Embed Size (px)
Citation preview

TSX: BRIO
Q2 2017 Financial and Operating Results
August 2, 2017

Cautionary StatementsCAUTIONARY NOTE REGARDING FORWARD-LOOKING STATEMENTS: This press release contains or incorporates by reference “forward-looking statements” and “forward-lookinginformation” under applicable Canadian securities legislation. Forward-looking information includes, but is not limited to information with respect to the Company’s strategy,plans or future financial or operating performance, the outcome of the legal matters involving the damages assessments and any related enforcement proceedings. Forward-looking statements are characterized by words such as “plan,” “expect”, “budget”, “target”, “project”, “intend”, “believe”, “anticipate”, “estimate” and other similar words, orstatements that certain events or conditions “may” or “will” occur. Forward-looking statements are based on the opinions, assumptions and estimates of management consideredreasonable at the date the statements are made, and are inherently subject to a variety of risks and uncertainties and other known and unknown factors that could cause actualevents or results to differ materially from those projected in the forward-looking statements. These factors include the Company’s expectations in connection with the productionand exploration, development and expansion plans at the Company's projects discussed herein being met, the impact of proposed optimizations at the Company's projects, theimpact of the proposed new mining law in Brazil, and the impact of general business and economic conditions, global liquidity and credit availability on the timing of cash flowsand the values of assets and liabilities based on projected future conditions, fluctuating metal prices (such as gold and silver), currency exchange rates (such as the Brazilian realversus the United States dollar), the impact of inflation, possible variations in ore grade or recovery rates, changes in the Company’s hedging program, changes in accountingpolicies, changes in mineral resources and mineral reserves, risks related to asset disposition, risks related to metal purchase agreements, risks related to acquisitions, changes inproject parameters as plans continue to be refined, changes in project development, construction, production and commissioning time frames, unanticipated costs and expenses,higher prices for fuel, steel, power, labour and other consumables contributing to higher costs and general risks of the mining industry, failure of plant, equipment or processes tooperate as anticipated, unexpected changes in mine life, final pricing for concentrate sales, unanticipated results of future studies, seasonality and unanticipated weather changes,costs and timing of the development of new deposits, success of exploration activities, permitting timelines, government regulation and the risk of government expropriation ornationalization of mining operations, risks related to relying on local advisors and consultants in foreign jurisdictions, environmental risks, unanticipated reclamation expenses,risks relating to joint venture operations, title disputes or claims, limitations on insurance coverage and timing and possible outcome of pending and outstanding litigation andlabour disputes, risks related to enforcing legal rights in foreign jurisdictions, as well as those risk factors discussed or referred to herein. Although the Company has attempted toidentify important factors that could cause actual actions, events or results to differ materially from those described in forward-looking statements, there may be other factorsthat cause actions, events or results not to be anticipated, estimated or intended. There can be no assurance that forward-looking statements will prove to be accurate, as actualresults and future events could differ materially from those anticipated in such statements. The Company undertakes no obligation to update forward-looking statements ifcircumstances or management’s estimates, assumptions or opinions should change, except as required by applicable law. The reader is cautioned not to place undue reliance onforward-looking statements. The forward-looking information contained herein is presented for the purpose of assisting investors in understanding the Company’s expectedfinancial and operational performance and results as at and for the periods ended on the dates presented in the Company’s plans and objectives and may not be appropriate forother purposes.
CAUTIONARY NOTE TO UNITED STATES INVESTORS CONCERNING ESTIMATES OF MEASURED, INDICATED AND INFERRED MINERAL RESOURCES: This presentation uses the terms"mineral resource", "measured mineral resource", "indicated mineral resource" and "inferred mineral resource" are defined in and required to be disclosed by NI 43-101.However, these terms are not defined terms under Industry Guide 7 and are not permitted to be used in reports and registration statements of United States companies filed withthe Commission. Investors are cautioned not to assume that any part or all of the mineral deposits in these categories will ever be converted into mineral reserves. "Inferredmineral resources" have a great amount of uncertainty as to their existence, and great uncertainty as to their economic and legal feasibility. It cannot be assumed that all or anypart of an inferred mineral resource will ever be upgraded to a higher category. Under Canadian rules, estimates of inferred mineral resources may not form the basis of feasibilityor pre-feasibility studies, except in rare cases. Investors are cautioned not to assume that all or any part of an inferred mineral resource exists or is economically or legallymineable. Disclosure of "contained ounces" in a mineral resource is permitted disclosure under Canadian regulations. In contrast, the Commission only permits U.S. companies toreport mineralization that does not constitute "mineral reserves" by Commission standards as in place tonnage and grade without reference to unit measures. Accordingly,information contained in this news release may not be comparable to similar information made public by U.S. companies subject to the reporting and disclosure requirementsunder the United States federal securities laws and the rules and regulations of the Commission thereunder.
All amounts are expressed in United States dollars unless otherwise indicated.| 2

Speakers
| 3
Gil ClausenPresident & CEO
Joe LongpreCFO

0.14 0.140.16
0.00
0.18
0.12
0.20
0.160.14
2014 2015 2016 Jan Feb Mar Apr May Jun Jul Aug Sep Oct Nov Dec
Committed to Corporate Social Responsibility
| 4
Safety Comes First
All injuries – Historical Performance
LTIFR – Historical Performance
Ontario Mines: 0.38
Brazilian Mines: 0.16
50
17
25
6
26
11
20
54 3 42
80
31
49
13
0
20
40
60
80
100
2014 2015 2016 2017 (YTD)
FAC
WLTI
LTI
Total

About Brio Gold
| 5
New Americas focused mid-tier gold producer with industry leading growth
Producing
In development,to be restarted in Q2 2018
(2)
(1) (1)
(1) Based on a BRL:USD exchange rate of 3.5:1.(2) Includes Corporate G&A.
Consolidated 198-223 $785-805 $995-1,015

| 6
Operational OverviewGil Clausen, President & CEO
Q2 2017 Operating Overview
| 7
Assay Furnace at RDM
Q2 2017 H1 2017
Production (oz) 44,223 94,763
Sales (oz) 42,691 92,306
Total Cost of Sales ($ per oz) $1,139 $1,109
Cash Costs(1) ($ per oz) $859 $842
AISC(1) ($ per oz) $1,085 $1,070
1. A non-GAAP financial measure. For a reconciliation of non-GAAP measures please see Brio Gold’s Q2 2017 MD&A.

RDM: Q2 2017 Overview
| 8
Q2 2017 H1 2017
Gold production (oz) 9,844 25,028
Sales (oz) 10,122 25,423
Ore mine (tonnes) 275,083 845,858
Ore processed (tonnes) 275,075 743,094
Gold feed grade (g/t) 1.29 1.21
Gold recovery rate 86.3% 86.6%
Total COS ($/oz) $1,125 $1,088
Cash Costs ($/oz)(1) $869 $927
AISC ($/oz) (1) $872 $953
1. A non-GAAP financial measure. For a reconciliation of non-GAAP measures please see Brio Gold’s Q2 2017 MD&A.
▪ Mine on care and maintenance for 41days with implementation of new mineplan
▪ Existing small-scale mining contractordemobilized in the quarter
▪ Selected large-scale mining contractor forstripping - no longer requires purchase ofwaste mining fleet
▪ Water storage facility completed,continuous operations expected in Q42017 with start of rainy season
▪ Installation of power line connectingRDM to the power grid continued onschedule, completion on track for Q22018 – expected to reduce costs
On track to achieve annual
production and cost guidance

Fazenda Brasileiro: Q2 2017 Overview
| 9
Q2 2017 H1 2017
Gold production (oz) 14,092 28,964
Sales (oz) 12,776 26,625
Ore mine (tonnes) 305,202 603,754
Ore processed (tonnes) 308,226 611,735
Gold feed grade (g/t) 1.60 1.64
Gold recovery rate 89.0% 89.7%
Total COS ($/oz) $1,145 $1,167
Cash Costs ($/oz)(1) $892 $841
AISC ($/oz) (1) $956 $999
1. A non-GAAP financial measure. For a reconciliation of non-GAAP measures please see Brio Gold’s Q2 2017 MD&A.
Production impacted by▪ Lower grade▪ Mills down due to liner replacements▪ Offset by higher recoveries
Higher costs impacted by▪ Strengthening local currency▪ Lower grade, as large portion of costs
are fixed▪ Expansionary cost higher with focus
on developing Canto, which isexpected to extend mine life
Production to Improve in H2
On track to achieve annual production
and cost guidance

Pilar: Q2 2017 Overview
| 10
Q2 2017 H1 2017
Gold production (oz) 20,287 40,771
Sales (oz) 19,793 40,258
Ore mine (tonnes) 304,471 592,702
Ore processed (tonnes) 304,951 593,591
Gold feed grade (g/t) 2.15 2.22
Gold recovery rate 96.2% 96.2%
Total COS ($/oz) $1,144 $1,083
Cash Costs ($/oz)(1) $831 $809
AISC ($/oz) (1) $1,022 $1,011
1. A non-GAAP financial measure. For a reconciliation of non-GAAP measures please see Brio Gold’s Q2 2017 MD&A.
Q2 2017 production
▪ In line with plan
▪ Lower than Q2 2016 due to lowerfeed grade as a result of minesequencing, offset by higherthroughput
Q2 2017 cost increase driven by
▪ Mostly strengthening local currency
▪ Lower grades
On track to achieve annual
production and cost guidance

Santa Luz
| 11
▪ Project on schedule and below budget.
▪ Pilot plant continuously running since last technical
report in July, ore samples of all types being tested
with results confirming recoveries.
▪ Consistent recoveries for all ore types verified with
standard resin-in-leach (RIL) circuit.
▪ Basic engineering completed, commenced detailed
engineering.
▪ Relining of tailings pond in progress.
▪ Major long lead items ordered, procurement
advancing.
▪ Tailings liner contractor mobilized, new tailings
liners delivered.
▪ Village relocation commenced, to be completed in
Q3 2017.
▪ Re-commissioning on track for Q2 2018.
▪ Completed exploration program in H1 2017,
updated reserve and resource expected in August.

| 12
Financial OverviewJoe Longpre, CFO

Q2 2017 Financial Highlights
| 13
Summary of Consolidated Financial Results Q2 2017 H1 2017
Revenues $52.9M $112.4M
Gross margin, before DDA $15.7M $34.9M
Net loss $(4.5)M $(11.7)M
On a per share basis (basic) $(0.07) $(0.04)
Adjusted loss $(3.6)M $(1.1)M
On a per share basis (basic) $(0.03) $(0.01)
Adjusted EBITDA(1) $(2.2)M $(6.2)M
Operating cash flow, before changes in working capital $4.3M $19.7M
Cash balance $11.5M $11.5M
1. A non-GAAP financial measure. For a reconciliation of non-GAAP measures please see Brio Gold’s Q2 2017 MD&A.
Currently assessing non-dilutive financing options to provide further liquidity
Working capital facility to be made available in Q3

| 14
Looking ForwardGil Clausen, President & CEO

Guidance
| 151. All guidance for costs assume a Brazilian Real to U.S. Dollar exchange rate of 3.50. 2. A non-GAAP measure. For a reconciliation of non-GAAP measures please see the end of this presentation.
Guidance Remains Unchanged
2017 AISC includes one time G&A costs related to Brio Gold transition as well as non-recurring
sustaining capital items.
2017E
Production (koz) 198-223
Total COS(1) $995 - $1,015
Cash Costs(1,2) $785 - $805
AISC(1,2) $995 - $1,015

Contact InformationLetitia WongVP, Corporate DevelopmentT: (416) 860-6310E: [email protected]
TSX: BRIO

Non-GAAP Measures
| 17
Non-GAAP FINANCIAL MEASURES
The Company has included certain non-GAAP financial measures including cash costs per ounce of gold produced, all-in sustaining costs per ounce of gold produced, adjusted earnings
(loss), and adjusted EBITDA to supplement its consolidated financial statements, which are presented in accordance with IFRS. The term IFRS and generally accepted accounting
principles (“GAAP”) are used interchangeably throughout this press release.
The Company believes that these measures, together with measures determined in accordance with IFRS, provide investors with an improved ability to evaluate the underlying
performance of the Company. Non-GAAP financial measures do not have any standardized meaning prescribed under IFRS, and therefore they may not be comparable to similar
measures employed by other companies. The data is intended to provide additional information and should not be considered in isolation or as a substitute for measures of
performance prepared in accordance with IFRS.
Cash Costs
The Company uses the non-GAAP financial measure “cash costs” on a per ounce of gold produced basis because it believes this measure provides investors and analysts with useful
information about the Company’s underlying cash costs of operations and is a relevant metric used to understand the Company’s operating profitability, and ability to generate cash
flow. Cash costs figures are calculated based on the standard developed by The Gold Institute, which was a worldwide association of suppliers of gold and gold products and included
leading North American gold producers. The Gold Institute ceased operations in 2002, but the standard remains the generally accepted standard of reporting cash costs of production in
North America. Adoption of the standard is voluntary and the cost measures presented herein may not be comparable to other similarly titled measures of other companies.
Cash costs include mine site operating costs such as mining, processing, administration, production taxes and royalties, which are not based on sales or taxable income calculations, but
are exclusive of amortization, reclamation, capital, development, and exploration costs. Cash costs per ounce of gold produced are calculated on a weighted average basis.
The term “cash costs” has no standard meaning and therefore, the Company’s definitions are unlikely to be comparable to similar measures presented by other companies and should
not be considered in isolation or as a substitute for measures prepared in accordance with IFRS and is not necessarily indicative of operating costs, operating profit or cash flows
presented under IFRS.
All-in-Sustaining Costs
The Company uses the non-GAAP financial measure “all-in-sustaining costs”, also referred to as “AISC”, on a per ounce of gold produced basis because it believes this measure provides
investors with useful information about the Company’s underlying cash costs of operations, after deducting certain non-discretionary items such as sustaining capital expenditures,
exploration expenses and certain general and administrative costs and is a relevant metric used to understand the Company’s operating profitability, and ability to general cash flow.
All-in-sustaining costs are based on cash costs, including cost components of mine sustaining capital expenditures and exploration and evaluation expense. All-in-sustaining costs for a
mine do not include capital expenditures attributable to projects or mine expansions, exploration and evaluation costs attributable to growth projects, Brio Gold corporate general and
administrative expenses, Yamana general and administrative expenses allocated to Brio Gold or stock-based compensation, income tax payments, financing costs and dividend
payments. Consequently, this measure is not representative of all of the Company’s cash expenditures. In addition, the calculation of all-in-sustaining costs does not include depletion,
depreciation and amortization expense as it does not reflect the impact of expenditures incurred in prior periods. The term “all-in-sustaining costs” has no standard meaning and
therefore, the Company’s definitions are unlikely to be comparable to similar measures presented by other companies and should not be considered in isolation or as a substitute for
measures prepared in accordance with IFRS and is not necessarily indicative of operating costs, operating profit or cash flows presented under IFRS.

Non-GAAP Measures
| 18
Reconciliation of total cost of sales to cash costs and all-in-sustaining costs, consolidated and per mine (Based on Consolidated Financial Statements unless otherwise noted)
(1) Inventory movement and adjustment represent the difference between the costs of production (which are based on ounces produced) and the cost of sales (which is based on ounces
sold). The timing difference between the units sold and the costs of those units requires an adjustment to reflect the nature of the underlying metric.
For the three months ended June 30, 2017
(In thousands of U.S. dollars) Consolidated Pilar Mine
FazendaBrasileiro
Mine RDM Mine
Cost of sales including depletion, depreciation and amortization 48,646 22,635 14,624 11,387
Depletion, depreciation and amortization (11,541) (6,213) (3,189) (2,139)
Adjustments:
Inventory movement and adjustments(1) 877 436 1,135 (694)
Cash costs(2) 37,982 16,858 12,570 8,554
General and administrative expenses attributable to all-in sustaining costs 6,458 142 22 6
Stock based compensation (2,002) — — —
Sustaining capital expenditures 5,436 3,743 878 24
Exploration and evaluation expense 149 — 2 —
All-in sustaining costs(2) 48,023 20,743 13,472 8,584
Cost of sales including depletion, depreciation and amortization per gold ounce sold 1,139 1,144 1,145 1,125
Cash cost per gold ounce produced(2) 859 831 892 869
All-in sustaining costs per ounce produced(2) 1,085 1,022 956 872
Gold ounces produced during the period (oz.) 44,223 20,287 14,092 9,844
Gold ounces sold during the period (oz.) 42,691 19,793 12,776 10,122

Non-GAAP Measures
| 19
(1) Inventory movement and adjustment represent the difference between the costs of production (which are based on ounces produced) and the cost of sales (which is based on ounces
sold). The timing difference between the units sold and the costs of those units requires an adjustment to reflect the nature of the underlying metric.
(2) A non-GAAP Financial Measure
For the three months ended June 30, 2016
(In thousands of U.S. dollars) Consolidated Pilar MineFazenda
Brasileiro Mine RDM Mine
Cost of sales including depletion, depreciation and amortization 54,265 22,554 17,784 13,659
Depletion, depreciation and amortization (15,752) (8,782) (5,484) (1,218)
Adjustments:
Inventory movement and adjustments(1) (226) 1,713 (50) (1,903)
Cash costs(2) 38,287 15,485 12,250 10,538
General and administrative expenses attributable to all-in sustaining costs 5,665 452 71 4
Stock based compensation (1,742) — — —
Sustaining capital expenditures 8,862 3,516 4,350 988
Exploration and evaluation expense 30 — — —
All-in sustaining costs(2) 51,102 19,453 16,671 11,530
Cost of sales including depletion, depreciation and amortization per gold ounce sold 1,037 1,023 1,008 1,079
Cash cost per gold ounce produced(2) 726 679 726 807
All-in sustaining costs per ounce produced(2) 969 856 988 883
Gold ounces produced during the period (oz.) 52,737 22,806 16,873 13,058
Gold ounces sold during the period (oz.) 52,351 22,047 17,650 12,654

Non-GAAP Measures
| 20
(1) Inventory movement and adjustment represent the difference between the costs of production (which are based on ounces produced) and the cost of sales (which is based on
ounces sold). The timing difference between the units sold and the costs of those units requires an adjustment to reflect the nature of the underlying metric.
(2) A non-GAAP Financial Measure
For the six months ended June 30, 2017
(In thousands of U.S. dollars) Consolidated Pilar MineFazenda
Brasileiro Mine RDM Mine
Cost of sales including depletion, depreciation and amortization 102,329 43,587 31,076 27,666
Depletion, depreciation and amortization (24,906) (11,282) (9,780) (3,844)
Adjustments:
Inventory movement and adjustments(1) 3,121 679 3,063 (621)
Cash costs(2) 80,544 32,984 24,359 23,201
General and administrative expenses attributable to all-in sustaining costs 11,548 716 498 328
Stock based compensation (3,744) — — —
Sustaining capital expenditures 12,831 7,513 3,968 325
Exploration and evaluation expense 239 — — —
All-in sustaining costs(2) 101,418 41,213 28,825 23,854
Cost of sales including depletion, depreciation and amortization per gold ounce sold 1,109 1,083 1,167 1,088
Cash cost per gold ounce produced(2) 842 809 841 927
All-in sustaining costs per ounce produced(2) 1,070 1,011 999 953
Gold ounces produced during the period (oz.) 94,763 40,771 28,964 25,028
Gold ounces sold during the period (oz.) 92,306 40,258 26,625 25,423

Non-GAAP Measures
| 21
For the six months ended June 30, 2016
(In thousands of U.S. dollars) Consolidated Pilar MineFazenda
Brasileiro Mine RDM Mine
Cost of sales including depletion, depreciation and amortization 87,532 41,950 31,923 13,659
Depletion, depreciation and amortization (26,558) (16,310) (9,030) (1,218)
Adjustments:
Inventory movement and adjustments(1) 1,130 3,653 (699) (1,903)
Cash costs(2) 62,104 29,293 22,194 10,538
General and administrative expenses attributable to all-in sustaining costs 10,917 534 170 4
Stock based compensation (3,484) — — —
Sustaining capital expenditures 13,186 5,941 6,237 988
Exploration and evaluation expense 51 — — —
All-in sustaining costs(2) 82,774 35,768 28,601 11,530
Cost of sales including depletion, depreciation and amortization per gold ounce sold 936 962 856 1,079
Cash cost per gold ounce produced(2) 667 656 627 807
All-in sustaining costs per ounce produced(2) 889 801 808 883
Gold ounces produced during the period (oz.) 93,109 44,654 35,397 13,058
Gold ounces sold during the period (oz.) 93,595 43,633 37,308 12,654

Non-GAAP Measures
| 22
Quarterly trailing cost of sales including depletion, depreciation and amortization to cash costs consolidated and per mine (Based on Condensed Consolidated
Interim Financial Statements unless otherwise noted)
Brio Gold Consolidated
(In thousands of U.S. dollars) Q2-17 Q1-17 Q4-16 Q3-16
Cost of sales including depletion, depreciation and amortization 48,646 53,684 71,169 53,009
Depletion, depreciation and amortization (11,541) (13,366) (26,275) (13,936)
Adjustments:
Inventory movement and adjustments(1) 877 2,254 (2,897) (1,614)
Cash costs(2) 37,982 42,572 41,997 37,459
Cost of sales including depletion, depreciation and amortization per gold ounce sold 1,139 1,082 1,421 1,083
Cash cost per gold ounce produced(2) 859 842 832 813
Gold ounces produced during the period (oz.) 44,223 50,540 50,477 46,075
Gold ounces sold during the period (oz.) 42,691 49,615 50,092 48,837
Brio Gold Consolidated
(In thousands of U.S. dollars) Q2-16 Q1-16 Q4-15 Q3-15
Cost of sales including depletion, depreciation and amortization 54,265 33,111 39,812 42,598
Depletion, depreciation and amortization (15,752) (10,855) (14,076) (16,752)
Adjustments:
Inventory movement and adjustments(1) (226) 1,382 (1,850) (213)
Cash costs(2) 38,287 23,638 23,886 25,633
Cost of sales including depletion, depreciation and amortization per gold ounce sold 1,037 803 1,016 1,104
Cash cost per gold ounce produced(2) 726 590 610 667
Gold ounces produced during the period (oz.) 52,737 40,372 39,279 38,430
Gold ounces sold during the period (oz.) 52,351 41,243 39,194 38,600

Non-GAAP Measures
| 23
Pilar Mine
(In thousands of U.S. dollars) Q2-17 Q1-17 Q4-16 Q3-16Cost of sales including depletion, depreciation and amortization 22,635 20,953 36,843 23,787
Depletion, depreciation and amortization (6,213) (5,070) (17,919) (9,295)
Adjustments:
Inventory movement and adjustments(1) 436 258 408 1,515
Cash costs(2) 16,858 16,141 19,332 16,007
Cost of sales including depletion, depreciation and amortization per gold ounce sold 1,144 1,024 1,687 1,152
Cash cost per gold ounce produced(2) 831 788 872 791
Gold ounces produced during the period (oz.) 20,287 20,484 22,170 20,237
Gold ounces sold during the period (oz.) 19,793 20,465 21,837 20,656
Pilar Mine
(In thousands of U.S. dollars) Q2-16 Q1-16 Q4-15 Q3-15Cost of sales including depletion, depreciation and amortization 22,554 19,726 19,237 23,000
Depletion, depreciation and amortization (8,782) (7,577) (5,682) (8,636)
Adjustments:
Inventory movement and adjustments(1) 1,713 1,626 (374) (367)
Cash costs(2) 15,485 13,775 13,181 13,997
Cost of sales including depletion, depreciation and amortization per gold ounce sold 1,023 914 851 1,069
Cash cost per gold ounce produced(2) 679 641 618 652
Gold ounces produced during the period (oz.) 22,806 21,848 21,326 21,468
Gold ounces sold during the period (oz.) 22,047 21,586 22,617 21,510
Fazenda Brasileiro Mine
(In thousands of U.S. dollars) Q2-17 Q1-17 Q4-16 Q3-16Cost of sales including depletion, depreciation and amortization 14,624 16,452 20,530 17,072
Depletion, depreciation and amortization (3,189) (6,591) (5,870) (3,792)
Adjustments:
Inventory movement and adjustments(1) 1,135 1,932 (896) (355)
Cash costs(2) 12,570 11,793 13,764 12,925
Cost of sales including depletion, depreciation and amortization per gold ounce sold 1,145 1,188 1,074 998
Cash cost per gold ounce produced(2) 892 793 753 751
Gold ounces produced during the period (oz.) 14,092 14,872 18,279 17,211
Gold ounces sold during the period (oz.) 12,776 13,849 19,110 17,100
Fazenda Brasileiro Mine
(In thousands of U.S. dollars) Q2-16 Q1-16 Q4-15 Q3-15Cost of sales including depletion, depreciation and amortization 17,784 14,368 20,054 19,598
Depletion, depreciation and amortization (5,484) (3,556) (8,394) (8,116)
Adjustments:
Inventory movement and adjustments(1) (50) (910) (914) 155
Cash costs(2) 12,250 9,902 10,746 11,637
Cost of sales including depletion, depreciation and amortization per gold ounce sold 1,008 731 1,210 1,147
Cash cost per gold ounce produced(2) 726 536 599 686
Gold ounces produced during the period (oz.) 16,873 18,524 17,953 16,963
Gold ounces sold during the period (oz.) 17,650 19,657 16,577 17,090
Non-GAAP Measures
| 24
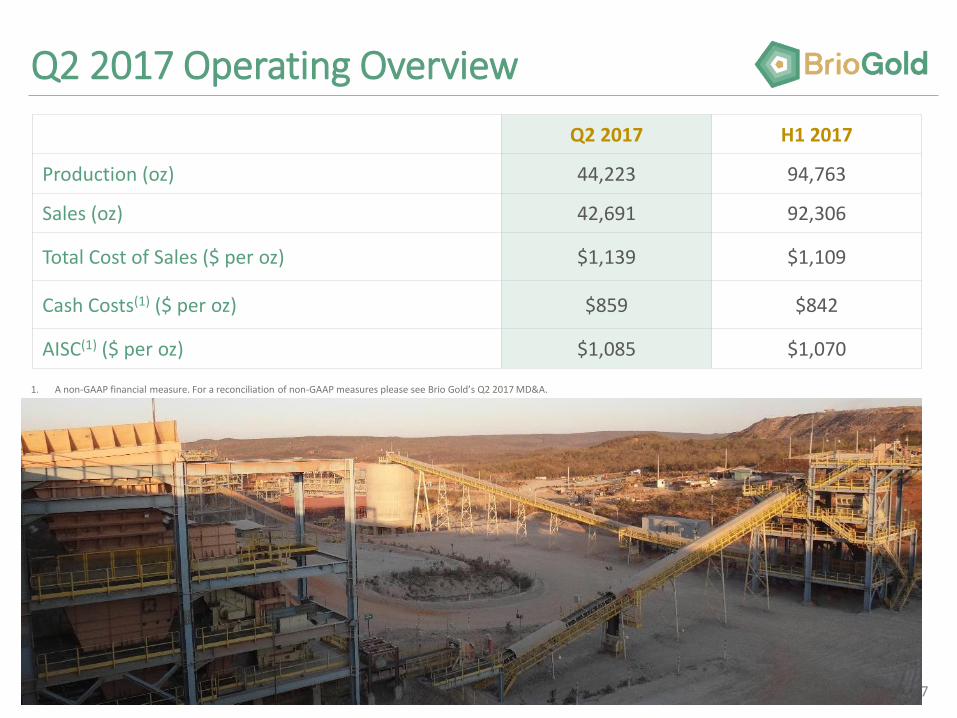
Notes:
(1) Inventory movement and adjustment represent the difference between the costs of production (which are based on ounces produced) and the cost of sales
(which is based on ounces sold). The timing difference between the units sold and the costs of those units requires an adjustment to reflect the nature of the
underlying metric.
(2) A non-GAAP financial measure.
(3) RDM was acquired during Q2, 2016, therefore Q3 2015 to Q1 2016 is not applicable
RDM, Brazil
(In thousands of U.S. dollars) Q2-17 Q1-17 Q4-16 Q3-16 Q2-16
Cost of sales including depletion, depreciation and amortization 11,387 16,278 13,660 12,150 13,080
Depletion, depreciation and amortization (2,139) (1,705) (2,477) (849) (1,217)
Adjustments:
Inventory movement and adjustments(1) (694) 64 (2,278) (2,794) (1,334)
Cash costs(2) 8,554 14,637 8,905 8,507 10,529
Cost of sales including depletion, depreciation and amortization per gold ounce sold 1,125 1,064 1,494 1,096 1,079
Cash cost per gold ounce produced(2) 869 964 888 986 807
Gold ounces produced during the period (oz.) 9,844 15,184 10,028 8,628 13,058
Gold ounces sold during the period (oz.) 10,122 15,301 9,146 11,081 12,654

Non-GAAP Measures
| 25
Adjusted EBITDA
The Company uses the non-GAAP financial measure “Adjusted EBITDA” because it believes it provides investors with useful information to evaluate its performance and understand its
ability to service and/or incur indebtedness.
The Company defines Adjusted EBITDA as net loss, before income tax recovery (expense), depletion, depreciation and amortization, impairment and reversals of mining properties,
interest expense, share-based compensation, and non-recurring provisions and other adjustments.
The term “Adjusted EBITDA” has no standard meaning and therefore, the Company’s definitions are unlikely to be comparable to similar measures presented by other companies and
should not be considered in isolation or as a substitute for measures prepared in accordance with IFRS and is not necessarily indicative of operating costs, operating profit or cash flows
presented under IFRS.
Reconciliation of Net Earnings to Adjusted EBITDA (Based on Consolidated Financial Statements unless otherwise noted)
For the three months ended For the six months ended
(In thousands of U.S. dollars) Q2 2017 Q2 2016 Q2 2017 Q2 2016
Net earnings (7,385) 10,315 (4,994) 20,790
Adjustments:
Income tax expense/(recoveries) 2,843 (14,432) (6,687) (22,122)
Depletion, depreciation and amortization 11,541 15,752 24,906 26,558
Foreign exchange (gain)/loss (1,252) 3,619 7 3,017
Bank, financing fees, interest expense and other 1,606 449 2,624 737
Loss/(gain) on indirect tax credits 1,908 1,624 (1,123) 4,397
Stock based compensation 2,002 1,742 3,744 3,484
Unrealized (gain)/loss on foreign exchange hedges (4,772) — 528 —
Adjusted EBITDA $ 6,491 $ 19,069 $ 19,005 $ 36,861

Non-GAAP Measures
| 26
Adjusted Earnings or Loss
The Company uses the non-GAAP financial measure “Adjusted earnings or loss” because it believes this measure provides useful information to investors to evaluate the Company’s
performance by excluding certain cash and non-cash charges. The presentation of Adjusted earnings or loss is not meant to be a substitute for net earnings or loss or net earnings or
loss per share presented in accordance with IFRS, but rather should be evaluated in conjunction with such IFRS measures. Adjusted earnings or loss is calculated as net earnings
excluding (a) share based payments, (b) unrealized foreign exchange (gains) losses related to revaluation of deferred income tax asset and liability on non-monetary items, (c)
unrealized foreign exchange (gains) losses related to other items, (d) impairment losses and reversals, (e) deferred income tax expense (recovery) on the translation of foreign currency
inter corporate debt, (f) periodic tax adjustments to historical deferred income tax balances relating to changes in enacted tax rates and (g) non-cash provisions and any other non-
recurring adjustments. Non-recurring adjustments from unusual events or circumstances are reviewed from time to time based on materiality and the nature of the event or
circumstance. Earnings adjustments for the comparative period reflect continuing operations.
The terms “Adjusted earnings or loss” has no standardized meaning prescribed by IFRS and therefore the Company’s definitions are unlikely to be comparable to similar measures
presented by other companies.
Reconciliation of Net Earnings to Adjusted Earnings or Loss (Based on Consolidated Financial Statements unless otherwise noted)
For the three months endedJune 30,
For the six months endedJune 30,
(In thousands of U.S. dollars) 2017 2016 2017 2016
Net earnings $ (7,385) $ 10,315 $ (4,994) $ 20,790
Adjustments:
Foreign exchange loss/(gain) (1,252) 3,619 7 3,017
Unrealized (gain)/loss on foreign exchange hedges (4,772) — 528 —
Loss/(gain) on indirect tax credits 1,908 1,624 (1,123) 4,397
Business transaction costs — 1,613 848 3,823
Stock based compensation 2,002 1,742 3,744 3,484
Non-cash tax effect on unrealized foreign exchange losses/(gains) 6,074 (15,487) (3,262) (29,281)
Tax impact of adjustments 1,202 330 3,093 809
Other (1,336) (1,441) 82 (3,490)
Adjusted (loss)/earnings $ (3,559) $ 2,315 $ (1,077) $ 3,549