Embed Size (px)
Citation preview

Q4 2017
INTERIM FINANCIAL
REPORT
Crayon Group

This document contains the un-audited consolidated quarterly
financial statements and notes for Crayon Group Holding ASA.
The below commentary should be read in conjunction with
definitions and further disclosure as provided in the notes.
Content
HIGHLIGHTS AND KEY FIGURES
FINANCIAL AND MARKET CLUSTER REVIEW
BUSINESS OVERVIEW AND OUTLOOK
FINANCIAL STATEMENTS AND NOTES
Crayon Group Holding ASA • Sandakerveien 114A • Pb 4384 Nydalen, 0402 Oslo Tlf + 47 23 00 67 00 •
Fax + 47 22 89 10 01 • Org.nr 997 602 234 • www.crayon.com
Investor relations: www.crayon.com/en/about-us/investor-relations/

Highlights
Strong commercial momentum across all business areas and market clusters. Q4 2017 revenue and gross
profit increased by 25% and 9% compared to the same quarter last year (year-over-year,“YoY”),
respectively, driven by strong growth in the Software Division and in the less established markets (incl.
USA).
Continued positive EBITDA development outside the Nordics (MNOK +6 YoY), largely explained by stable
and healthy EBITDA margins in the Consulting Division and business area Software Direct. The Nordics
were negatively impacted by short term partner incentive changes within the business area Software
Indirect.
Strong cash flow from operating activities during the quarter (MNOK +350), resulting in a FY 2017 cash
conversion ratio of 117% (operating cash flow as percentage of adjusted EBITDA).
On 8 November 2017, Crayon successfully accomplished an Initial Public Offering (“IPO”) on the Oslo
Stock Exchange, thereby raising gross proceeds of approximately MNOK 340 million (out of which MNOK
150 was used to deleverage its existing “CRAYON02” bond).
Key consolidated figures
1 827 060
1 358 532
2 401 719
1 249 731
2 291 729
Q4 2016 Q1 2017 Q2 2017 Q3 2017 Q4 2017
Consolidated Operating Revenue
NOK in thousands
332 482
269 804
356 555
227 752
361 665
Q4 2016 Q1 2017 Q2 2017 Q3 2017 Q4 2017
Consolidated Gross Profit
NOK in thousands
63 629
4 926
77 312
-9 346
57 709
Q4 2016 Q1 2017 Q2 2017 Q3 2017 Q4 2017
Adjusted EBITDA is EBITDA excluding other income and
expenses. Reference made to Alternative Performance
Measures Section in note disclosure.
Consolidated Adjusted EBITDA
NOK in thousands
Year to date Year to date
Q4 2017 Q4 2016 Q4 2017 Q4 2016
(NOK in thousands, unless stated) Un-audited Un-audited Un-audited Un-audited
Revenue 2 291 729 1 827 060 7 301 712 6 015 162
Gross profit 361 665 332 482 1 215 776 1 128 404
EBITDA 42 130 61 680 103 842 91 719
Adjusted EBITDA 57 709 63 629 130 600 105 175
EBIT 19 009 27 814 32 158 (7 299)
Net profit 2 012 (5 687) (54 511) (30 214)
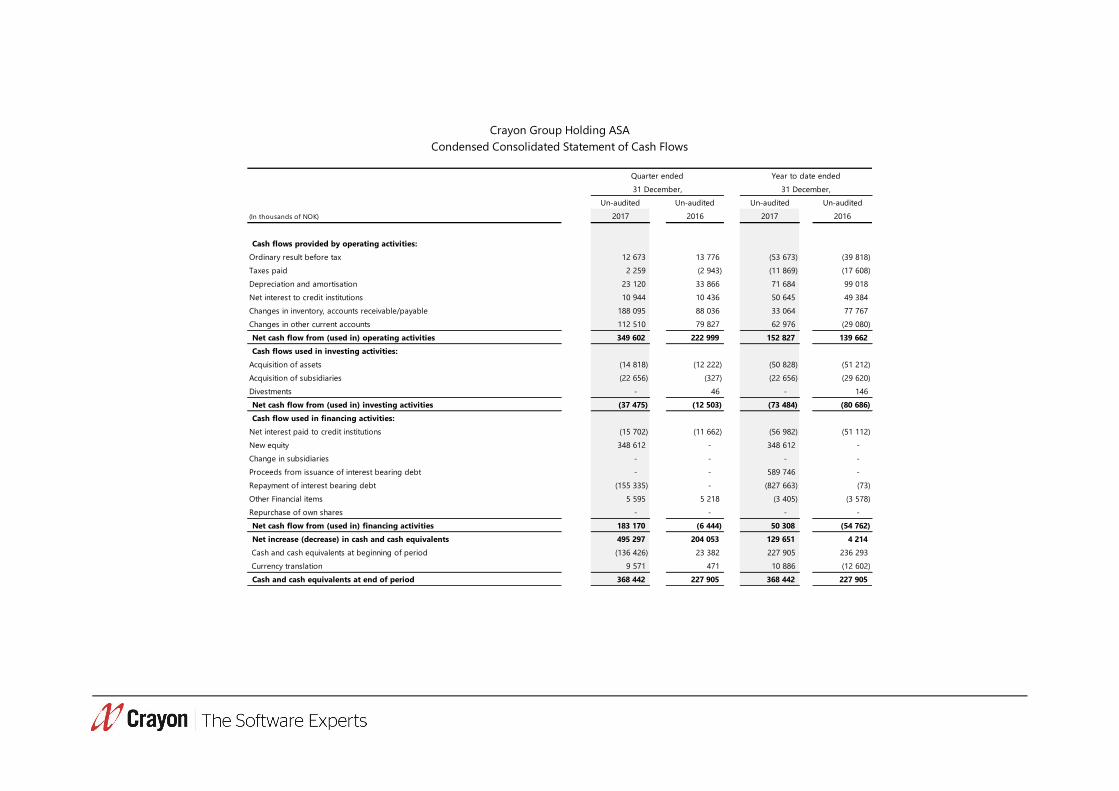
Cash flow from operations 349 602 222 999 152 827 139 662
Gross profit margin (%) 15.8 % 18.2 % 16.7 % 18.8 %
Adjusted EBITDA margin (%) 2.5 % 3.5 % 1.8 % 1.7 %
Adjusted EBITDA / Gross profit margin (%) 16.0 % 19.1 % 10.7 % 9.3 %
Earnings per share (Nok per share) 0.04 (0.03) (0.64) (0.14)
31 December 2017 31 December 2016
Net interest bearing debt 105 878 451 707
Liquidity reserve 518 869 288 400
Net working capital (401 250) (339 605)
Average headcount (number of employees) 1 009 967
(See Alternative Performance Measures section in the note disclosure for definitions) 31.12.2016

Financial review
In Q4 2017, Crayon delivered another consecutive
quarter of strong year-over-year (“YoY”) organic
revenue and gross profit growth, demonstrating a
strong commercial momentum across all business
areas and market clusters. Q4 2017 revenue and
gross profit growth was 25% and 9% YoY,
respectively. From a business division perspective,
gross profit growth for Software and Services was 9%
and 7% YoY, respectively. Software was driven by
Software Direct (+8% YoY) and Software Indirect
(+16% YoY), while Services was driven by Consulting
(+9% YoY) and SAM (+4% YoY).
In line with the underlying seasonality of the business,
Q4 2017 was a strong quarter from a cash flow
perspective. Cash flow from operating activities as a
factor of adjusted EBITDA grew from 3.5x in Q4 2016
to 6.1x in Q4 2017, resulting in a strong quarter-end
net cash position of MNOK 368 and net interest-
bearing debt of MNOK 105.9.
Despite strong commercial momentum and a strong
seasonal quarter from a profitability perspective,
adjusted EBITDA in Q4 2017 decreased by MNOK 6
(compared to Q4 2016) to MNOK 57.7. The decrease
was not in line with management expectations and is
largely explained by unexpected partner incentive
changes impacting the business area Software
Indirect. This change resulted in a “double digit”, like-
for-like, MNOK impact on gross profit and EBITDA in
Q4 2017. However, management’s view is that the
company is well positioned for this change, as
continued cloud transition will provide a positive
long-term impact, and that the situation is expected
to normalize in the second half of 2018.
The Company continues to see stable and healthy
profitability development within Services, particularly
driven by business area Software Asset Management
(SAM) where the FY 2017 EBITDA as a percentage of
gross profit (“EBITDA margin”) almost doubled to
10% compared to the previous year. Software also
had a healthy development, particularly in Software
Direct where the FY 2017 EBITDA grew 36% YoY.
Software Indirect affected by above mentioned
partner incentive changes.
In November the Company exercised an Equity Claw-
back mechanism in its outstanding bond
(“CRAYON02”) following the IPO, redeeming MNOK
150 of the Bond Issue at price equal to 102% of par
value. Current outstanding amount is MNOK 450.
0
50 000
100 000
150 000
200 000
250 000
Q4 2016 Q1 2017 Q2 2017 Q3 2017 Q4 2017
Software Gross Profit
In thousands of NOK
0
50 000
100 000
150 000
200 000
Q4 2016 Q1 2017 Q2 2017 Q3 2017 Q4 2017
Services Gross Profit
In thousands of NOK
4%
19%
50% -1%26%
0
50 000
100 000
150 000
200 000
250 000
Nordics Growth
Markets
Start-Ups USA Admin/Elim
Gross Profit per Market Cluster and
growth (%)
In thousands of NOK
Q4 2016 Q4 2017
-14%
56% 45% -11% 3%
-20 000
0
20 000
40 000
60 000
80 000
100 000
Nordics Growth
Markets
Start-Ups USA Admin/Elim
Adjusted EBITDA per Market Cluster and
growth (%)
In thousands of NOK
Q4 2016 Q4 2017
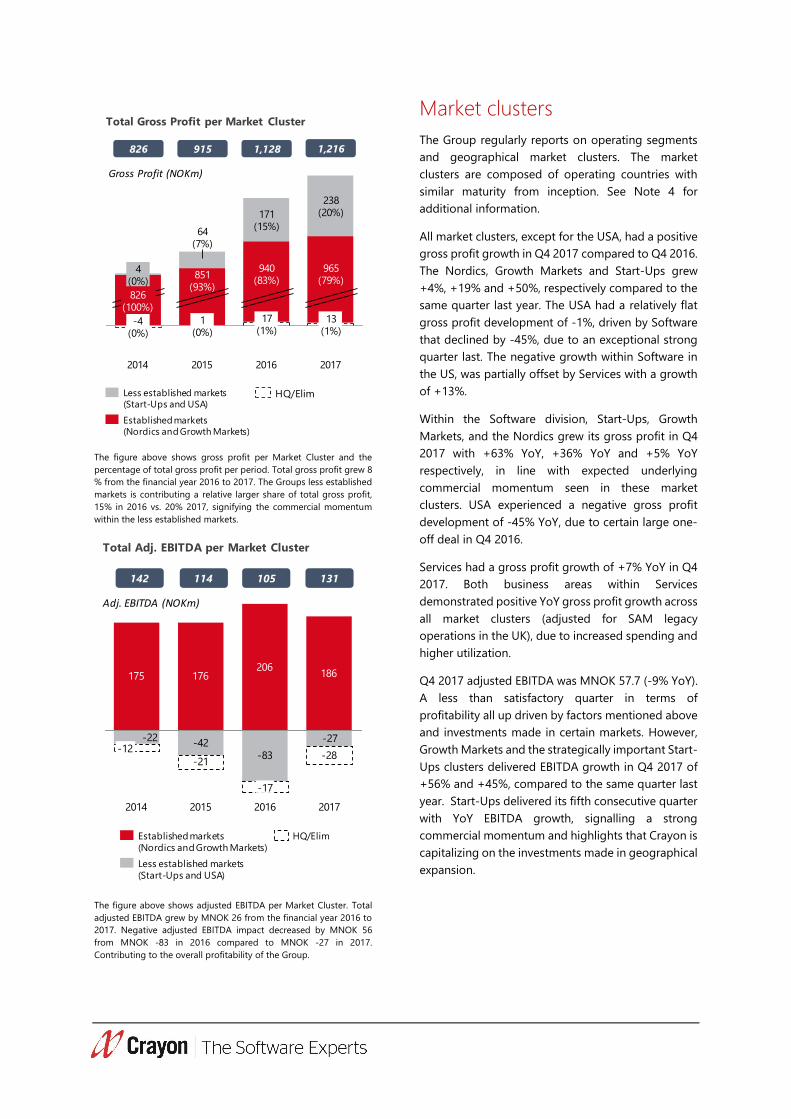
The figure above shows gross profit per Market Cluster and the
percentage of total gross profit per period. Total gross profit grew 8
% from the financial year 2016 to 2017. The Groups less established
markets is contributing a relative larger share of total gross profit,
15% in 2016 vs. 20% 2017, signifying the commercial momentum
within the less established markets.
The figure above shows adjusted EBITDA per Market Cluster. Total
adjusted EBITDA grew by MNOK 26 from the financial year 2016 to
2017. Negative adjusted EBITDA impact decreased by MNOK 56
from MNOK -83 in 2016 compared to MNOK -27 in 2017.
Contributing to the overall profitability of the Group.
Market clusters
The Group regularly reports on operating segments
and geographical market clusters. The market
clusters are composed of operating countries with
similar maturity from inception. See Note 4 for
additional information.
All market clusters, except for the USA, had a positive
gross profit growth in Q4 2017 compared to Q4 2016.
The Nordics, Growth Markets and Start-Ups grew
+4%, +19% and +50%, respectively compared to the
same quarter last year. The USA had a relatively flat
gross profit development of -1%, driven by Software
that declined by -45%, due to an exceptional strong
quarter last. The negative growth within Software in
the US, was partially offset by Services with a growth
of +13%.
Within the Software division, Start-Ups, Growth
Markets, and the Nordics grew its gross profit in Q4
2017 with +63% YoY, +36% YoY and +5% YoY
respectively, in line with expected underlying
commercial momentum seen in these market
clusters. USA experienced a negative gross profit
development of -45% YoY, due to certain large one-
off deal in Q4 2016.
Services had a gross profit growth of +7% YoY in Q4
2017. Both business areas within Services
demonstrated positive YoY gross profit growth across
all market clusters (adjusted for SAM legacy
operations in the UK), due to increased spending and
higher utilization.
Q4 2017 adjusted EBITDA was MNOK 57.7 (-9% YoY).
A less than satisfactory quarter in terms of
profitability all up driven by factors mentioned above
and investments made in certain markets. However,
Growth Markets and the strategically important Start-
Ups clusters delivered EBITDA growth in Q4 2017 of
+56% and +45%, compared to the same quarter last
year. Start-Ups delivered its fifth consecutive quarter
with YoY EBITDA growth, signalling a strong
commercial momentum and highlights that Crayon is
capitalizing on the investments made in geographical
expansion.
851(93%)
64(7%)
13(1%)
940(83%)
-4(0%)
1(0%)
2014
4(0%)
238(20%)
2017
17(1%)
965(79%)
826(100%)
171(15%)
2015 2016
Gross Profit (NOKm)
826 915 1,128 1,216
Total Gross Profit per Market Cluster
HQ/Elim
Established markets
(Nordics and Growth Markets)
Less established markets
(Start-Ups and USA)
-42-83
-21-28
175 176206
186
-27-22-12
20172015
-17
20162014
142 114 105 131
Total Adj. EBITDA per Market Cluster
Adj. EBITDA (NOKm)
Less established markets
(Start-Ups and USA)
HQ/ElimEstablished markets
(Nordics and Growth Markets)

Nordics The Nordics are Crayon’s most established markets of
operations. The region is composed of Norway,
Sweden, Denmark, Finland, and Iceland.
Nordic markets had a positive gross profit growth
from MNOK 226.7 in Q4 2016 to MNOK 235.3 in Q4
2017, i.e. 4% YoY. The YoY increase in Q4 was driven
by Norway (MNOK +9.7, or +7% YoY) and Sweden
(MNOK +1.4, or +5% YoY). Offset by Denmark
(MNOK -0.4 or -1% YoY) and Finland (MNOK -2.6, or
-14% YoY). Denmark had certain large deals in Q4
2016 which were not up for renewal in 2017 affecting
Software Direct. The negative impact in Finland was
principally due to changes in a government
framework agreement affecting Software Direct.
The period shows decreased profitability in the
Nordics. EBITDA decreased from MNOK 83.8 in Q4
2016 to MNOK 72.2 in Q4 2017, driven by Finland
(MNOK -4.6 YoY) and Norway (MNOK -3.8 YoY). The
reduced profitability in these two markets was also
driven by the above mentioned adverse gross profit
drivers (Finland) and due to temporary effect from
the previously mentioned vendor incentive change
(Norway).
Growth Markets Growth Markets is composed of Germany, Middle
East, France, and UK. The market cluster represents
Crayons geographical markets by mid-range markets
of operations by maturity.
Growth Markets gross profit grew from MNOK 49.6
in Q4 2016 to MNOK 59.2 in Q4 2017, i.e. 19% YoY, at
large driven by the Germany (MNOK +7.7, or 54%
YoY) and Middle East (MNOK +4.7, or 54% YoY).
Partially offset by France (MNOK -2.8, or -18%). UK
had a slight positive YoY gross profit growth in Q4
2017. The negative impact in France was largely
driven by a less than expected win rate within the
business area Software Direct compared to the
previous year.
With respect to profitability, Growth Markets
increased EBITDA from MNOK 2.8 in Q4 2016 to
MNOK 4.3 in Q4 2017, primarily driven by Germany
(MNOK +4.5, or 133% YoY) and the Middle East
(MNOK +1.6, or +104% YoY). Partially offset by
France (MNOK -3.9, or -116%) due to the above
mentioned adverse gross profit driver.
116 879
122 553
106 577
111 889
95 000
100 000
105 000
110 000
115 000
120 000
125 000
Q4 2016 Q4 2017 Q4 2016 Q4 2017
Software Services
Nordics Gross Profit
(excl. Admin/ Elim. per market cluster)
In thousands of NOK
Gross Profit
226 654
Gross Profit
235 257
EBITDA
83 846 EBITDA
72 199
-
50 000
100 000
150 000
200 000
250 000
Q4 2016 Q4 2017
Nordics Gross Profit and EBITDA
In thousands of NOK
28 451
38 718
19 564 20 096
-
5 000
10 000
15 000
20 000
25 000
30 000
35 000
40 000
45 000
Q4 2016 Q4 2017 Q4 2016 Q4 2017
Software Services
Growth Markets Gross Profit
(excl. Admin/ Elim. per market cluster)
In thousands of NOK
Gross Profit
49 566
Gross Profit
59 198
EBITDA
2 757
EBITDA
4 296
-
10 000
20 000
30 000
40 000
50 000
60 000
70 000
Q4 2016 Q4 2017
Growth Markets Gross Profit and EBITDA
In thousands of NOK

Start-Ups Start-Ups is composed of markets that have an
inception point within the 2014-2015 timeframe.
Markets include India, Singapore, Malaysia,
Philippines, Austria, Netherlands, Spain, Portugal and
Switzerland.
Start-Ups grew its gross profit from MNOK 18.7 in Q4
2016 to MNOK 28.1 in Q4 2017, i.e. +50% YoY. All
markets experienced positive YoY growth, with India
(MNOK +3.8, or +86% YoY), Switzerland (MNOK +2.5,
or +219% YoY) and Malaysia (MNOK +1.8, or +103%
YoY) being the key markets fuelling the gross profit
growth.
Similarly, Start-Ups increased its EBITDA from MNOK
-9.5 in Q4 2016 to MNOK -5.3 in Q4 2017, primarily
driven by Malaysia (MNOK +1.5, or +338% YoY),
Switzerland (MNOK +1.3, or 56% YoY), India (MNOK
+1.1, or 234% YoY) and Spain (MNOK +0.7, or +41%
YoY).
USA Crayon entered the USA in September 2015.
USA delivered a gross profit contribution of MNOK
30.5 in Q4 2017, from MNOK 30.7 in Q4 2016, i.e. -1%
YoY. Services demonstrated solid YoY gross profit
growth of +13% (MNOK +2.9), while Software gross
profit YoY growth declined by -45% (MNOK -4.0).
The USA had slightly declining EBITDA for the quarter
year over year, from MNOK -3.3 in Q4 2016 to MNOK
-3.6 in Q4 2017, driven by above mentioned gross
profit drivers. Management is optimistic about the
business outlook in the USA for 2018, particularly
within Services, and have initiated initiatives to
accelerate activity and profitability within Software.
HQ HQ adjusted EBITDA improved from MNOK -10.2 in
Q4 2016 to MNOK -9.9 in Q4 2017. However,
operational leverage has not developed in line with
management expectations primarily due to
additional costs related to large projects such as the
new ERP and CRM system, and IP development.
Management has intensified efforts towards the
“Cost Leadership” and “More for less” program into
2018.
12 702
20 672
5 905 7 343
-
5 000
10 000
15 000
20 000
25 000
Q4 2016 Q4 2017 Q4 2016 Q4 2017
Software Services
Start-Ups Gross Profit
(excl. Admin/ Elim. per market cluster)
In thousands of NOK
Gross Profit
18 700
Gross Profit
28 093
EBITDA
-9 499
EBITDA
-5 270
-15 000
-10 000
-5 000
-
5 000
10 000
15 000
20 000
25 000
30 000
Q4 2016 Q4 2017
Start-Ups Gross Profit and EBITDA
In thousands of NOK
8 774
4 818
22 199 25 136
-
5 000
10 000
15 000
20 000
25 000
30 000
Q4 2016 Q4 2017 Q4 2016 Q4 2017
Software Services
USA Gross Profit
(excl. Admin/ Elim. per market cluster)
In thousands of NOK
Gross Profit
30 691
Gross Profit
30 470
EBITDA
-3 251
EBITDA
-3 608 -10 000
-5 000
-
5 000
10 000
15 000
20 000
25 000
30 000
35 000
Q4 2016 Q4 2017
USA Gross Profit and EBITDA
In thousands of NOK

Balance sheet
As of Q4 2017, Crayon had assets of MNOK 3,080 that
primarily consists of accounts receivables (MNOK
1,541), goodwill (MNOK 831), and capitalized
technology, software and R&D (MNOK 109). Total
liabilities by Q4 2017 is MNOK 2,514 and primarily
consists of accounts payable (MNOK 1,601) and long-
term debt (MNOK 446).
In Q4 2017 there was trade working capital1 decrease
of MNOK 33 compared to Q4 2016, yielded a positive
impact on cash conversion from operating activities
(i.e., net cash from operations relative to adj. EBITDA)
that grew from 3.5x in Q4 2016 to 6.1x in Q4 2017,
harvesting on efforts put towards working capital
management in 2017. Management will continue the
efforts to control the working capital more efficiently
to further improve the cash position and cash
conversion. Crayon is close to finalizing a factoring
agreement with BNP aimed to counter the underlying
trade working capital build-up in the company.
Leverage
Net interest-bearing debt as end of end December
2017 was MNOK 105.9 with a net cash position of
MNOK 368.4 (the Company reports its cash balance
net of drawdown on its revolving credit facility
(“RCF”), corresponding to a leverage ratio of 0.77x
EBITDA2. The Group had significant headroom with
regards to its bank covenants as of quarter end.
Cash flow
The net cash position as of 31 December 2017, was
MNOK 368.4 (the Company reports its cash balance
net of drawdown on its revolving credit facility
(“RCF”)) compared to MNOK 227.9 at the beginning
of the year.
The YoY cash delta in Q4 2017 of MNOK +140.5
compared to Q4 2016 is explained by an increase in
cash from operating activities (MNOK +13.2 YoY YTD
December 2017 vs YTD December 2016), reduced
cash used in investing activities (MNOK +7.2 YoY YTD
December 2017 vs YTD December 2016), an increase
in cash from financing activities (MNOK +105.1 YoY
YTD December 2017 vs YTD December 2016) due to
proceedings from the IPO, partially offset by
1 Trade working capital = Accounts receivable (AR) + inventory –
Accounts payable (AP)
deleveraging when refinancing the matured “CGH01”
(MNOK 650) bond with the new bond, “CRAYON02”
(MNOK 600), in addition to associated refinancing
costs, and a positive currency translation effect
(MNOK +23.5 YoY YTD December 2017 vs. YTD
December 2016).
Partially offset by a lower ingoing cash balance for
the year (MNOK -8.4).
Total freely available cash as of 31 December 2017,
was MNOK 349.7 compared to MNOK 283.4 as of end
Q4 2016.
Employees
Crayon is a “people business” with teammates being
our greatest asset. We strive to continuously attract,
develop, and retain top talent, but perhaps even
more importantly, we empower our employees to do
their best every single day at work.
The average number of employees for Q4 2017 was
1,009, compared to an average for Q4 2016 of 967.
This represents a YoY increase of 42 employees (an
increase of 4%). The biggest increase was among
client facing employees within the Software business
division with a total increase in average employees of
23 YoY, representing a 7% increase. The average
number of employees in the Services business
division increased YoY by 4 employees, whilst other
employees increased by 15 from an average of 131 in
Q4 2016 to 146 in Q4 2017.
2 On a LTM basis, excluding other income and expenses and non-
controlling interest. Also, adjusted for restricted cash of MNOK 18.7.
Business overview and outlook
The mission of Crayon Group continues to be to
optimize the ROI on complex technology and
software expenditure for our customers. We have
operations in 21 global markets and reach around
80% of the global IT addressable market from these
locations. Our investment in the skills and expertise
of our teams and in unique customer enablement
platforms and tools, differentiates the business from
other more transactional competitors, enabling us to
deliver greater technical capability and value for our
customers.
Crayon’s SAM First…Cloud First strategy describes
our fundamental belief that SAM is the foundation of
all intelligent IT decision making, including an
optimized digital transformation into the Cloud. Put
simply, it’s extremely hard to maximize your ROI from
your complex IT investments or expenditure on
software licensing if you do not know what is being
purchased across your IT estate. You are unaware of
the entitlements that your existing agreements
provide you with and you do not know what the
technology consumption profiles are of your global
workforce. A competent SAM engagement and
governance environment are essential to these
primary IT knowledge silos and form a solid
foundation for informed technical decision making
and optimized IT project implementation.
Market trends
We live in a time of digital transformation.
Breakthroughs in Data, Cloud Computing, Mobility,
Intelligent Things, and Artificial Intelligence will
reshape every aspect of a business, from the smallest
SMB to the largest of enterprises. The key enabler for
this digital transformation is Cloud Computing.
However, cloud computing also creates challenges
and complications for the enterprises and
government organizations that intersect with
Crayon’s business and value proposition of how to
best manage Cloud Economics, Technology
Complexity, Cyber Security, and Data Protection.
Per IDC and Gartner, the worldwide enterprise
software market is expected to grow at a healthy
CAGR (“Compound Annual Growth Rate”) of 6-8%
from 2016 to 2020, yet with a CAGR of 25-30% within
the cloud segments for the same period. Moreover,
Cisco predicts that global cloud IP traffic will almost
quadruple over the next 5 years, meaning that the
amount of data crossing computers and devices will
nearly double every year. The question is not whether
Big Data and Cloud Computing is here to stay, but
how organizations can best adapt and optimize
business value within this new paradigm. This
represents a significant business opportunity for
Crayon. Our services cover nearly every aspect along
the Cloud and Digital Transformation value chain,
from planning and design to application
development and deployment.
Crayon helps customers and partners to purchase
more effectively, provision and administrate cloud
services. In addition, we have dedicated cloud
practices that develop bespoke business applications
for our customers, including Machine Learning and
predictive analytics solutions.

Financial statements
Note
Un-audited Un-audited Un-audited Un-audited
(In thousands of NOK) 2017 2016 2017 2016
Operating revenue 4 2 291 729 1 827 060 7 301 712 6 015 162
Materials and supplies 1 930 064 1 494 578 6 085 935 4 886 757
Gross profit 361 665 332 482 1 215 776 1 128 404
Payroll and related cost 268 594 229 827 940 464 870 183
Other operating expenses 35 362 39 026 144 711 153 046
Other income and expenses 15 579 1 949 26 758 13 456
EBITDA 42 130 61 680 103 842 91 719
Depreciation and amortization 5 23 120 33 867 71 684 99 018
Operating profit/EBIT 19 009 27 814 32 158 (7 299)
Interest expense 14 693 14 825 58 489 63 022
Other financial expense, net 6 (8 357) (787) 27 342 (30 503)
Ordinary result before tax 12 673 13 776 (53 673) (39 819)
Income tax expense on ordinary result 10 661 19 463 838 (9 605)
Net income 2 012 (5 687) (54 511) (30 214)
Allocation of net income
Non-controlling interests (1 274) (3 585) (6 105) (19 444)
Owners of Crayon Group Holding AS 3 286 (2 102) (48 406) (10 769)
Total net income allocated 2 012 (5 687) (54 511) (30 213)
Earnings per share (NOK per share) 0.04 (0.03) (0.64) (0.14)
Comprehensive income 6 504 9 676 9 263 (39 752)
Total comprehensive income 8 516 3 989 (45 248) (69 966)
Allocation of Total comprehensive income
Non-controlling interests (2 607) (3 848) (6 873) (18 312)
Owners of Crayon Group Holding AS 11 123 7 838 (38 375) (51 653)
Total comprehensive income allocated 8 516 3 990 (45 248) (69 965)
For description of other income and expenses, see Alternative Performance Measures section
Crayon Group Holding ASA
Condensed Consolidated Statement of Income
Quarter ended Year to date ended
31 December, 31 December,

31 December
Un-audited Audited
(In thousands of NOK) Note 2017 2016
ASSETS
Non-current assets:
Technology, software and R&D 8 109 311 104 347
Contracts 8 83 324 101 034
Software licenses 8 1 000 7 421
Goodwill 9 831 044 827 057
Deferred tax asset 33 802 29 644
Property & equipment 20 204 18 704
Other long-term receivables 4 771 3 203
Total non-current assets 1 083 457 1 091 410
Current assets:
Inventory 26 287 17 546
Accounts receivable 1 541 436 1 206 783
Other receivables 60 049 56 065
Income tax receivable - 1 084
Cash & cash equivalents 368 442 227 905
Total current assets 1 996 215 1 509 383
Total assets 3 079 671 2 600 793
LIABILITIES AND SHAREHOLDERS' EQUITY
Shareholders' equity:
Share capital 75 394 52 476
Own shares (3) (12)
Share premium 588 051 262 320
Sum paid-in equity 663 442 314 784
Funds (105 597) (53 605)
Non-controlling interests 8 153 11 194
Total shareholders' equity 565 998 272 373
Long-term liabilities:
Long-term debt 10 445 696 -
Deferred tax liabilities 31 768 44 818
Other long-term liabilities 7 188 1 472
Total long-term liabilities 484 651 46 290
Current liabilities:
Accounts payable 1 600 566 1 224 108
Public duties 229 057 186 949
Other current liabilities 194 416 210 026
Short-term debt - 661 047
Total current liabilities 2 029 022 2 282 130
Total liabilities 2 513 673 2 328 420
Total equity and liabilities 3 079 671 2 600 793
Crayon Group Holding ASA
Condensed Consolidated Balance Sheet Statement
31 December
Un-audited Un-audited Un-audited Un-audited
(In thousands of NOK) 2017 2016 2017 2016
Cash flows provided by operating activities:
Ordinary result before tax 12 673 13 776 (53 673) (39 818)
Taxes paid 2 259 (2 943) (11 869) (17 608)
Depreciation and amortisation 23 120 33 866 71 684 99 018
Net interest to credit institutions 10 944 10 436 50 645 49 384
Changes in inventory, accounts receivable/payable 188 095 88 036 33 064 77 767
Changes in other current accounts 112 510 79 827 62 976 (29 080)
Net cash flow from (used in) operating activities 349 602 222 999 152 827 139 662
Cash flows used in investing activities:
Acquisition of assets (14 818) (12 222) (50 828) (51 212)
Acquisition of subsidiaries (22 656) (327) (22 656) (29 620)
Divestments - 46 - 146
Net cash flow from (used in) investing activities (37 475) (12 503) (73 484) (80 686)
Cash flow used in financing activities:
Net interest paid to credit institutions (15 702) (11 662) (56 982) (51 112)
New equity 348 612 - 348 612 -
Change in subsidiaries - - - -
Proceeds from issuance of interest bearing debt - - 589 746 -
Repayment of interest bearing debt (155 335) - (827 663) (73)
Other Financial items 5 595 5 218 (3 405) (3 578)
Repurchase of own shares - - - -
Net cash flow from (used in) financing activities 183 170 (6 444) 50 308 (54 762)
Net increase (decrease) in cash and cash equivalents 495 297 204 053 129 651 4 214
Cash and cash equivalents at beginning of period (136 426) 23 382 227 905 236 293
Currency translation 9 571 471 10 886 (12 602)
Cash and cash equivalents at end of period 368 442 227 905 368 442 227 905
Condensed Consolidated Statement of Cash Flows
Crayon Group Holding ASA
Quarter ended Year to date ended
31 December, 31 December,

Year to date period ending
31 December,
Share Own Share Total
(In thousands of NOK) capital shares premium Funds equity
Balance at January 1, 2016 52 476 (43) 262 163 36 354 12 989 363 938
Net income - - - (10 769) (19 444) (30 214)
Currency translation - - - (40 884) 1 132 (39 752)
Other - 30 157 (38 306) 16 517 (21 601)
Balance as of end of period 52 476 (13) 262 320 (53 605) 11 194 272 370
Share Own Share Total
(In thousands of NOK) capital shares premium Funds equity
Balance at January 1, 2017 52 476 (12) 262 320 (53 606) 11 194 272 373
Opening balance adj. - - - 920 - 920
Adjustment - - - (9 690) 3 832 (5 857)
Share repurchase (net) - 9 38 29 - 76
IPO costs - - - (9 516) - (9 516)
Share based compensation - - - 4 639 - 4 639
Net income - - - (48 406) (6 105) (54 511)
Share issues 22 919 - 325 693 - - 348 612
Currency translation - - - 10 031 (768) 9 263
Other -0 - - - - (0)
Balance as of end of period 75 394 (3) 588 051 (105 597) 8 153 565 998
Non-controlling
interests
Crayon Group Holding ASA
Condensed Consolidated Statement of Changes in Shareholders' Equity
Attributable to equity holders of Crayon Group Holding AS
Attributable to equity holders of Crayon Group Holding AS
Non-controlling
interests

Notes
Note 1 – Corporate information
The condensed interim consolidated financial statements of Crayon Group Holding ASA for the twelve months
ended 31 December 2017 were authorised for issue on 19.02.2018.
Crayon Group Holding ASA (“Crayon”) is a public limited company registered in Norway. The Company is a leading
IT advisory firm in software and digital transformation services. Crayon optimises its clients' return on investment
(“ROI”) from complex software technology investments by combining extensive experience within volume software
licensing optimization, digital engineering, and predictive analytics. Headquartered in Oslo, Norway, the company
has approximately 1,100 employees in 43 offices worldwide.
Note 2 – Basis of preparation
The consolidated condensed interim financial statements have been prepared in accordance with IAS 34 Interim
Financial Reporting as endorsed by the EU. They do not include all the information required for full annual financial
statements and should be read in conjunction with the consolidated financial statements of the Group at the year-
end 31 December 2016.
The accounting policies applied by the Group in these interim financial statements are the same as those applied
by the Group in its consolidated financial statements for the year ended 31 December 2016. There are no changes
in accounting policy effective from 1 January 2017 that have an impact on the Group accounts.
A number of accounting standards and amendments to standards are not effective for the period ended 31
December 2017 and have not been applied in preparing these interim consolidated financial statements. Crayon
has performed an assessment of the impact of these standards as follows:
The implementation of IFRS 9 is mandatory from 1 January 2018. The standard addresses the
classification, measurement and recognition of financial assets and financial liabilities, replacing IAS 39.
IFRS 9 introduces a single approach for the classification and measurement of financial assets according
to their cashflow characteristics and the business model they are managed in, and provides a new
impairment model based on expected credit losses. The standard is not expected to have a significant
impact on the financial statements of Crayon Group.
The implementation of IFRS 15, revenue from contracts with customers is mandatory from 1 January
2018. The new standard establishes principles for reporting useful information to users of financial
statements about the nature, timing and uncertainty of revenue and cash flows arising from an entities
contracts with customers. Revenue is recognised when the customer obtains control of goods or
services and thus can direct the use and obtain the benefits from the said goods or services. So far,
there are no indications that IFRS 15 will have a material impact on the timing of revenue recognition
for Crayon Group.
The implementation of IFRS 16, Leases is mandatory from 1 January 2019. The new standard requires
companies to bring most of its leases on-balance sheet. Preliminary assessment of this new standard
indicates that a significant portion of the Groups operational lease commitments disclosed in note 22
of the 2016 annual report maybe presented as a financial lease in the balance sheet.
Note 3 -Est imates
The preparation of interim financial statements requires the Group to make certain estimates and assumptions that
affect the application of accounting policies and reported amounts of assets, liabilities, income and expenses.
Estimates and judgements are continually evaluated by the company based on historical experience and other
factors, including expectations of future events that are deemed to be reasonable under the circumstances. Actual
results may differ from these estimates. The most significant judgments used in preparing these interim financial
statements and the key areas of estimation uncertainty are the same as those applied in the consolidated annual
report for 2016.

Note 4 – Segment information
The Group regularly reports revenue, gross profit and adjusted EBITDA in functional operating segments and
geographical market clusters to the Board of Directors (the Group’s chief operating decision makers). While Crayon
uses all three measures to analyse performance, the Group’s strategy of profitable growth means that adjusted
EBITDA is the prevailing measure of performance.
The operating units that form a natural reporting segment are Software (Software Direct and Software Indirect),
Services (SAM and Consulting) and Admin/Eliminations (Admin & Shared services and Eliminations).
Software Direct is Crayon's licence offering from software vendors (e.g Microsoft, Adobe, Symantec, Citrix,
Vmware, Oracle, IBM and others). The emphasis is towards standard software, which customers consistently
use year after year, and which plays a key role in their technological platforms and critical commercial
processes.
Software Indirect is Crayon's service offering towards hosters, system integrators and ISVs, which includes
licence advisory/optimization, software licence sales and access to Crayons proprietary tools and IP.
Software Asset Management (SAM) services include processes and tools for enabling clients to build in
house SAM capabilities, licence spend optimisation and support for clients in vendor audits.
Consulting consists of Cloud Consulting and Solution Consulting services related to infrastructure
consulting, cloud migration and deployment, bespoke software deployment and follow-up of applications.
Admin & Shared services includes administrative income and costs, corporate administrative costs
(excluding other income and expenses), unallocated global shared costs and eliminations.
The geographical market clusters are composed of operating countries with similar maturity. The Nordics
is composed of Norway, Sweden, Denmark, Finland and Iceland (excluding Ice Distribution). Growth
Markets is composed of Germany, Middle East, France and UK. Start-Ups is composed of markets with an
inception point during 2014-2015 timeframe (i.e. India, Singapore, Malaysia, Philippines, Austria,
Netherlands, Spain, Portugal, Switzerland and Ice Distribution). USA represents the post-closing financial
contributions from the Anglepoint and SWI acquisitions, as well as Crayon US. HQ & Eliminations includes
corporate admin costs (excluding other income and expenses), unallocated global shared cost and
eliminations.
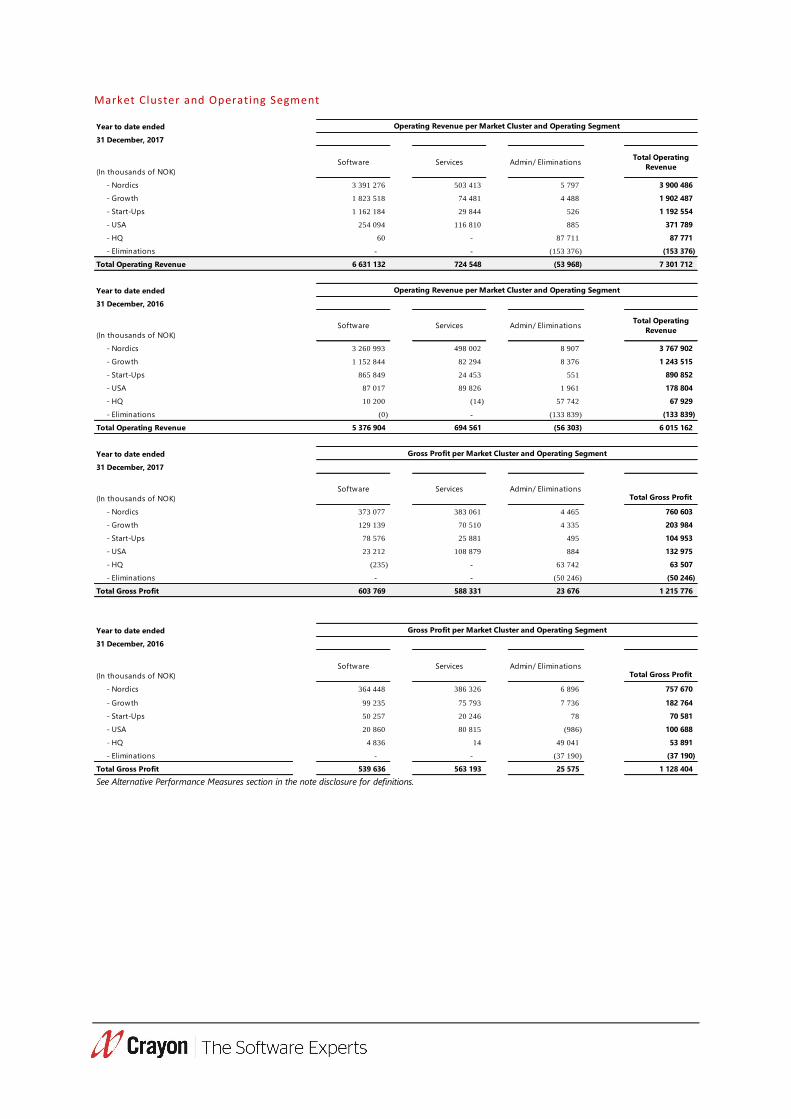
Market Cluster and Operating Segment
Year to date ended
31 December, 2017
(In thousands of NOK)
Software Services Admin/ EliminationsTotal Operating
Revenue
- Nordics 3 391 276 503 413 5 797 3 900 486
- Growth 1 823 518 74 481 4 488 1 902 487
- Start-Ups 1 162 184 29 844 526 1 192 554
- USA 254 094 116 810 885 371 789
- HQ 60 - 87 711 87 771
- Eliminations - - (153 376) (153 376)
Total Operating Revenue 6 631 132 724 548 (53 968) 7 301 712
Year to date ended
31 December, 2016
(In thousands of NOK)
Software Services Admin/ EliminationsTotal Operating
Revenue
- Nordics 3 260 993 498 002 8 907 3 767 902
- Growth 1 152 844 82 294 8 376 1 243 515
- Start-Ups 865 849 24 453 551 890 852
- USA 87 017 89 826 1 961 178 804
- HQ 10 200 (14) 57 742 67 929
- Eliminations (0) - (133 839) (133 839)
Total Operating Revenue 5 376 904 694 561 (56 303) 6 015 162
Year to date ended
31 December, 2017
(In thousands of NOK)
Software Services Admin/ EliminationsTotal Gross Profit
- Nordics 373 077 383 061 4 465 760 603
- Growth 129 139 70 510 4 335 203 984
- Start-Ups 78 576 25 881 495 104 953
- USA 23 212 108 879 884 132 975
- HQ (235) - 63 742 63 507
- Eliminations - - (50 246) (50 246)
Total Gross Profit 603 769 588 331 23 676 1 215 776
Year to date ended
31 December, 2016
(In thousands of NOK)
Software Services Admin/ EliminationsTotal Gross Profit
- Nordics 364 448 386 326 6 896 757 670
- Growth 99 235 75 793 7 736 182 764
- Start-Ups 50 257 20 246 78 70 581
- USA 20 860 80 815 (986) 100 688
- HQ 4 836 14 49 041 53 891
- Eliminations - - (37 190) (37 190)
Total Gross Profit 539 636 563 193 25 575 1 128 404
See Alternative Performance Measures section in the note disclosure for definitions.
Operating Revenue per Market Cluster and Operating Segment
Operating Revenue per Market Cluster and Operating Segment
Gross Profit per Market Cluster and Operating Segment
Gross Profit per Market Cluster and Operating Segment

Operating segment
(In thousands of NOK)
Operating Revenue per Operating Segment 2017 2016 2017 2016
- Software Direct 4 856 457 3 935 678 1 596 978 1 303 162
- Software Indirect 1 774 675 1 441 226 492 523 384 979
Total Revenue - Software 6 631 132 5 376 904 2 089 501 1 688 142
- SAM 310 680 291 175 82 386 79 389
- Consulting 413 869 403 386 123 940 115 406
Total Revenue - Services 724 548 694 561 206 326 194 795
Admin & shared services 99 407 77 536 36 918 15 101
Eliminations (153 376) (133 839) (41 016) (70 976)
Total Operating Revenue 7 301 712 6 015 162 2 291 729 1 827 061
(In thousands of NOK)
Gross Profit per Operating Segment 2017 2016 2017 2016
- Software Direct 470 411 429 095 151 356 140 317
- Software Indirect 133 359 110 541 35 111 30 153
Total Gross profit - Software 603 769 539 636 186 467 170 470
- SAM 282 213 261 987 74 973 72 114
- Consulting 306 118 301 206 89 491 82 118
Total Gross profit - Services 588 331 563 193 164 464 154 232
Admin & shared services 73 922 62 765 23 737 9 522
Eliminations (50 246) (37 190) (13 002) (1 742)
Total Gross Profit 1 215 776 1 128 404 361 665 332 482
(In thousands of NOK)
Adjusted EBITDA per Operating Segment 2017 2016 2017 2016
- Software Direct 189 030 139 138 70 728 59 190
- Software Indirect 50 055 50 323 9 522 14 170
Total EBITDA - Software 239 084 189 461 80 250 73 360
- SAM 27 862 13 380 7 149 7 898
- Consulting 25 760 33 551 11 217 11 589
Total EBITDA - Services 53 623 46 931 18 366 19 488
Admin & shared services (162 107) (131 217) (40 907) (29 218)
Eliminations - - - -
Total Adjusted EBITDA 130 600 105 175 57 708 63 630
See Alternative Performance Measures section in the note disclosure for definitions.
31 December,
Year to date ended
31 December,
Year to date ended
31 December,
Year to date ended Quarter ended
31 December,
Quarter ended
31 December,
Quarter ended
31 December,

Market Cluster
(In thousands of NOK)
Operating Revenue per Market Cluster: 2017 2016 2017 2016
- Nordics 3 900 486 3 767 902 1 323 788 1 185 884
- Growth Markets 1 902 487 1 243 515 545 571 340 829
- Start-Ups 1 192 554 890 852 334 809 304 447
- USA 371 789 178 804 93 608 53 179
- HQ 87 771 (65 911) 34 969 13 698
- Eliminations (153 376) (133 839) (41 016) (70 976)
Total Operating Revenue 7 301 712 5 881 323 2 291 729 1 827 061
(In thousands of NOK)
Gross Profit per Market Cluster 2017 2016 2017 2016
- Nordics 760 603 757 670 235 257 226 654
- Growth Markets 203 984 182 764 59 198 49 566
- Start-Ups 104 953 70 581 28 093 18 700
- USA 132 975 100 688 30 470 30 691
- HQ 63 507 53 891 21 650 8 614
- Eliminations (50 246) (37 190) (13 002) (1 742)
Total Gross Profit 1 215 776 1 128 404 361 665 332 482
(In thousands of NOK)
Adjusted EBITDA per Market Cluster 2017 2016 2017 2016
- Nordics 181 013 204 377 72 199 83 846
- Growth Markets 4 576 1 301 4 296 2 757
- Start-Ups (13 855) (32 951) (5 270) (9 499)
- USA (13 245) (50 148) (3 608) (3 251)
- HQ (27 889) (17 405) (9 908) -10 225
- Eliminations - - - -
Total Adjusted EBITDA 130 600 105 174 57 708 63 629
See Alternative Performance Measures section in the note disclosure for definitions.
31 December,
Quarter ended
31 December,
Quarter ended
31 December,
Quarter ended
31 December,
Year to date ended
Year to date ended
31 December,
Year to date ended
31 December,
Note 5 – Share options
Share incentive scheme:
2,2 million share options have been allotted to management and selected key employees. Each share option allows
for the subscription of one share in Crayon Group Holding ASA. The fair value of the options is calculated when they
are allotted and expensed over the vesting period. A cost of NOK 682.851 (including accrued social security tax) has
been charged as an expense in the profit and loss statement in 2017. The fair value at grant date is determined
using an adjusted form of the Black Scholes Model, which considers the exercise price (NOK 15,50), the term of the
option (5 years), the impact of dilution (where material), the share price at the grant date (NOK 15,50), expected
price volatility of the underlying share and risk-free interest. The expected volatility is based on historical volatility
for a selection of comparable listed companies. Risk free interest is based on treasury bond with same maturity as
the option program. For further details, see stock exchange notifications regarding IPO, see www.newsweb.no. In
total, the board of directors and management were allotted 0,4 million and 0,85 million share options, respectively.
IPO bonus scheme:
As part of the stock exchange listing, the Board of Directors decided to reward certain key personnel in the company
and therefore established an IPO bonus scheme whereby certain key personnel were given the opportunity to
subscribe for shares in the offering to a subscription price of 50% of the final offer price in the offering.
Approximately 30 key personnel, management and board of directors received in total 642.255 number of shares in
the IPO bonus scheme. For further details, see stock exchange notifications regarding IPO, see www.newsweb.no. In
total, the board of directors and management were rewarded 132.515 and 36.000 number of shares in the IPO
scheme, respectively.
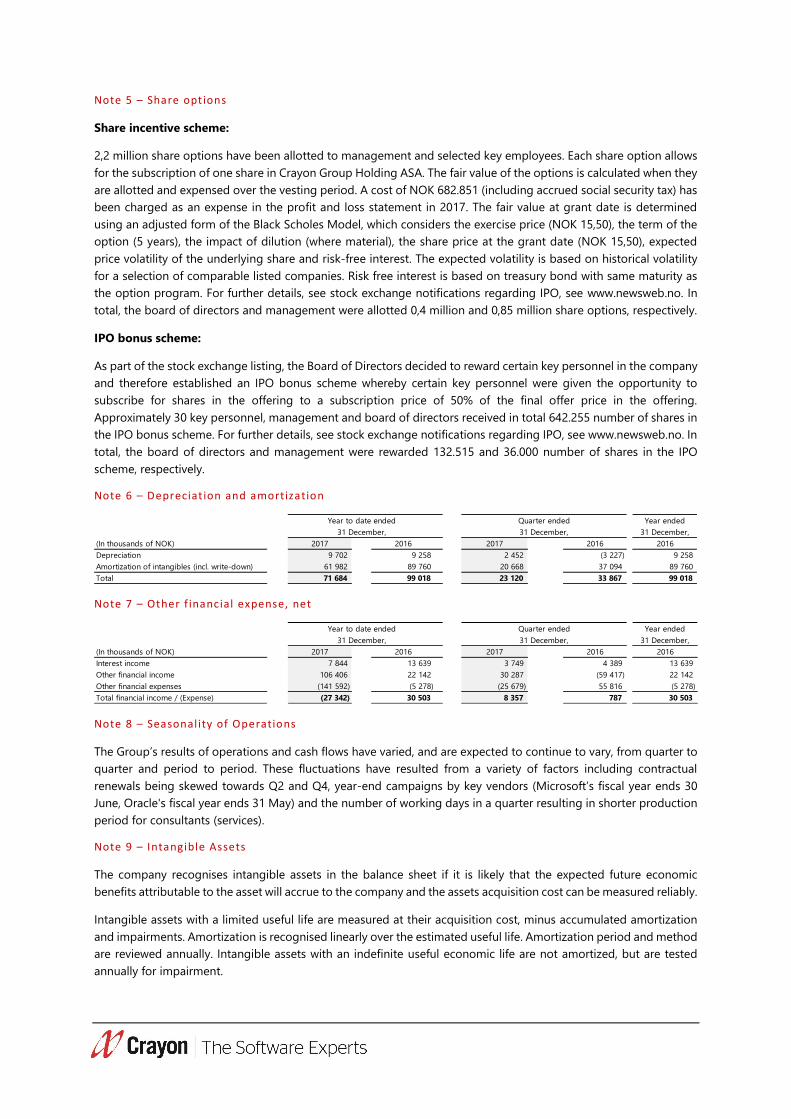
Note 6 – Depreciat ion and amortization
Note 7 – Other f inancial expense, net
Note 8 – Seasonal ity of Operations
The Group’s results of operations and cash flows have varied, and are expected to continue to vary, from quarter to
quarter and period to period. These fluctuations have resulted from a variety of factors including contractual
renewals being skewed towards Q2 and Q4, year-end campaigns by key vendors (Microsoft’s fiscal year ends 30
June, Oracle's fiscal year ends 31 May) and the number of working days in a quarter resulting in shorter production
period for consultants (services).
Note 9 – Intangible Assets
The company recognises intangible assets in the balance sheet if it is likely that the expected future economic
benefits attributable to the asset will accrue to the company and the assets acquisition cost can be measured reliably.
Intangible assets with a limited useful life are measured at their acquisition cost, minus accumulated amortization
and impairments. Amortization is recognised linearly over the estimated useful life. Amortization period and method
are reviewed annually. Intangible assets with an indefinite useful economic life are not amortized, but are tested
annually for impairment.
Year ended
31 December,
(In thousands of NOK) 2017 2016 2017 2016 2016
Depreciation 9 702 9 258 2 452 (3 227) 9 258
Amortization of intangibles (incl. write-down) 61 982 89 760 20 668 37 094 89 760
Total 71 684 99 018 23 120 33 867 99 018
Quarter ended
31 December,31 December,
Year to date ended
Year ended
31 December,
(In thousands of NOK) 2017 2016 2017 2016 2016
Interest income 7 844 13 639 3 749 4 389 13 639
Other financial income 106 406 22 142 30 287 (59 417) 22 142
Other financial expenses (141 592) (5 278) (25 679) 55 816 (5 278)
Total financial income / (Expense) (27 342) 30 503 8 357 787 30 503
31 December,
Quarter ended
31 December,
Year to date ended

The company divides its intangible assets into the following categories in the balance sheet:
Technology, Software and R&D:
Per IFRS 3, the Group has assessed if there are any identifiable intangible assets separable from Goodwill arising
from business combinations. The Group has determined that intangible assets arising from the business
combinations of Anglepoint and FAST meet the recognition requirements under IAS38 as separately identifiable
intangible assets. In the case of FAST, a set of technology and software primarily used in a subscription service to
customers who need software asset management (SAM) and IT Compliance assistance was capitalized. The software
and technology is expected to generate future economic benefits to the Group. In the case of the business
combination with Anglepoint, the Group capitalized software and technology developed internally by Anglepoint.
All qualifying intangible assets acquired during business combinations are recognized in the balance sheet at fair
value at the time of acquisition. Technology, Software and R&D arising from business combinations are amortized
linearly over the estimated useful life.
In addition to intangible assets recognised as part of business combinations, the Group also capitalizes expenses
related to development activities if the product or process is technically feasible and the Group has adequate
resources to complete the development. Expenses capitalized include material cost, direct wage costs and a share
of directly attributable overhead costs. Capitalized development costs are amortised linearly over the estimated
useful life.
Software Licences (IP):
Software Licences (IP) relates to the intangible asset recognised in relation to Genova. Genova is part of Esito’s
developed software used as an internal tool to serve its customer base. Genova is expected to generate future
economic benefits for the Group. The intangible asset has an indefinite life and therefore, are not amortized. The
assets are tested annually for impairment.
2017
Aquisition cost 01.01 7 421 119 393
Additions - 40 350
FX translation - 37
Aquisitition cost at the end of the period 7 421 159 780
Amortization and impairment 01.01 - 63 300
Amortization - 27 530
Impairment 6 421 -
Accumulated amortization and impairment 6 421 90 830
Net value at the end of the period 1 000 68 950
Amortization period None 1-10 years
Amortization method None Linear
Software
licences (IP)
Development
costs (R&D)
2017
Aquisition cost 01.01 360 079 66 354 553 247
Additions - - 40 350
FX translation 1 646 (480) 1 203
Aquisitition cost at the end of the period 361 725 65 874 594 800
Amortization and impairment 01.01 259 045 18 099 340 444
Amortization 19 356 7 414 54 300
Impairment - - 6 421
Accumulated amortization and impairment 278 401 25 513 401 165
Net value at the end of the period 83 324 40 361 193 635
Amortization period 1-10 years 1-10 years
Amortization method Linear Linear
ContractsTechnology and
software Total

LicMan was 100% written down in December 2017.
Contracts:
Per IFRS 3, the Group has assessed if there are any identifiable intangible assets separable from Goodwill arising
from business combinations. The Group has determined that the customer relationships identified in the business
combinations of Anglepoint, Inmeta-Crayon, Fast and Again meet the recognition requirements under IAS38 as
separately identifiable intangible assets. These customer relationships are all expected to generate future economic
benefits to the Group. Customer relationships acquired in business combinations are recognized in the balance
sheet at fair value at the time of acquisition. The customer relationships have limited useful life and are stated at
acquisition cost minus accumulated amortisation. Linear amortisation is carried over expected useful life.
Note 10 – Goodwill
Goodwill arising on business combinations is initially measured at cost, being the excess of the cost of an acquisition
over the net identifiable assets and liabilities assumed at the date of acquisition and relates to the future economic
benefits arising from assets which are not capable of being identified and separately recognised. Following initial
recognition, Goodwill is measured at cost less accumulated impairment losses.
Reconciliation of the carrying amount of goodwill at the beginning and end of the reporting period is presented
below:
The Group performs an impairment test for Goodwill on an annual basis or when there are circumstances which
would indicate that the carrying value of goodwill may be impaired. When assessing impairment, assets are grouped
into cash generating units (CGU's), the lowest levels at which it is possible to distinguish between cash flows.
Impairment of Goodwill is tested by comparing the carrying value of Goodwill for each CGU to the recoverable
amount. The recoverable amount is the higher of fair value less cost to sell and value in use.
The impairment assessment is built on a discounted cashflow model (DCF), with the model assumptions relating to
WACC and CAGR specified per CGU.
Note 11 – Debt
In March 2017, the company successfully completed the issuance of a MNOK 600 senior secured bond in the Nordic
market. Net proceeds from the bond issue was used to refinance the outstanding MNOK 650 bond issued in July
2014.
In light of the refinancing mentioned above, the Group also successfully increased its revolving credit facility to
MNOK 200.
Settlement for the initial loan amount was 6 April 2017, with final maturity 6 April 2020. The initial loan amount has
a coupon of 3 months NIBOR +550 bps. p.a. Any outstanding bonds is to be repaid in full at the maturity date. On
the 22 November the Company exercised an Equity Claw-back mechanism in CRAYON02 following the IPO,
redeeming NOK 150 million of the Bond Issue at price equal to 102% of par value.
The outstanding bond principal (NOK) has been hedged against the relevant currencies comprising the underlying
cash flow of the company, and is booked as the actual value representing future liabilities based on the exchange
rates at the balance sheet date. In accordance with IAS 39, the transactional costs (NOK ~ 10 million) related to the
(In thousands of NOK) Goodwill
Aquisition cost at 01.01 875 934
Additions -
Currency translation 5 249
Aquisition cost at the end of the period 881 183
Impairment at 01.01 48 877
Impirment during the period 1 262
Accumulated Impairment at the end of the period 50 139
Net book value at the end of the period 831 044
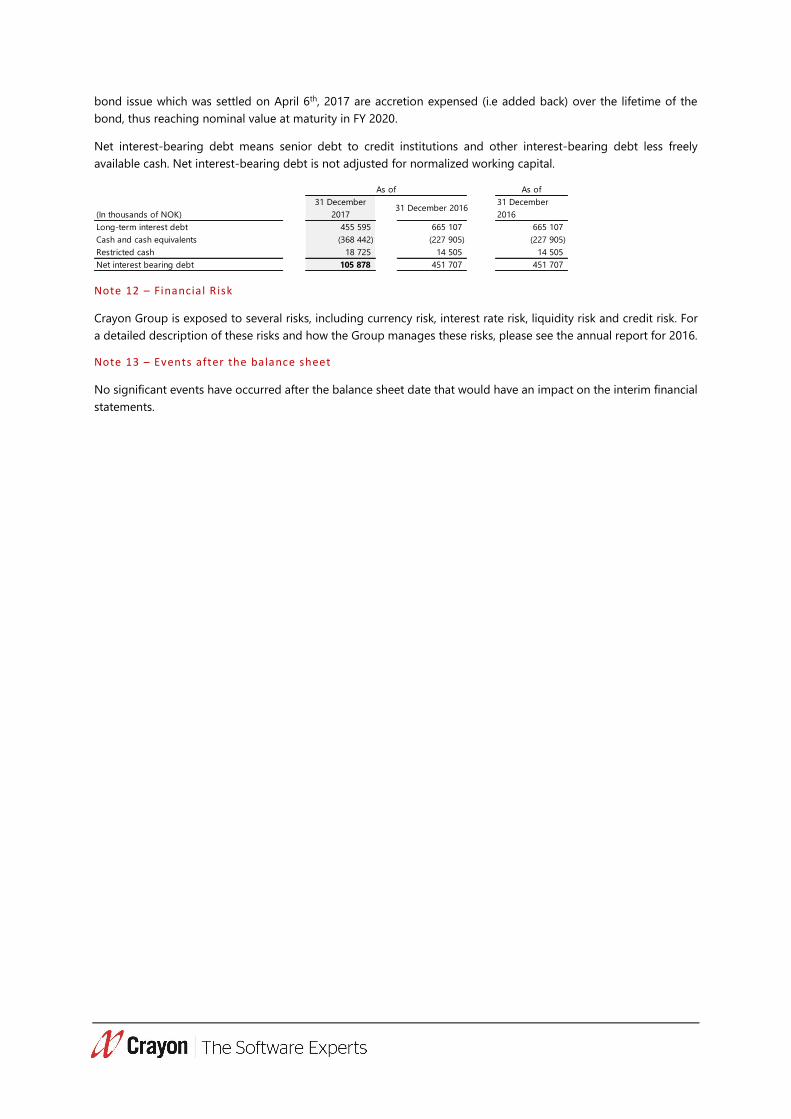
bond issue which was settled on April 6th, 2017 are accretion expensed (i.e added back) over the lifetime of the
bond, thus reaching nominal value at maturity in FY 2020.
Net interest-bearing debt means senior debt to credit institutions and other interest-bearing debt less freely
available cash. Net interest-bearing debt is not adjusted for normalized working capital.
Note 12 – Financial R isk
Crayon Group is exposed to several risks, including currency risk, interest rate risk, liquidity risk and credit risk. For
a detailed description of these risks and how the Group manages these risks, please see the annual report for 2016.
Note 13 – Events after the balance sheet
No significant events have occurred after the balance sheet date that would have an impact on the interim financial
statements.
As of
(In thousands of NOK)
31 December
201731 December 2016
31 December
2016
Long-term interest debt 455 595 665 107 665 107
Cash and cash equivalents (368 442) (227 905) (227 905)
Restricted cash 18 725 14 505 14 505
Net interest bearing debt 105 878 451 707 451 707
As of

Alternative Performance Measures
The financial information in this report is prepared under International Financial Reporting Standards (IFRS), as
adopted by the EU. To enhance the understanding of Crayon's performance, the company has presented a number
of alternative performance measures (APMs). An APM is defined by ESMA guidelines as a financial measure of
historical or future financial performance, financial position, or cash flows, other than a financial measure defined or
specified in the relevant accounting rules (IFRS).
Crayon uses the following APM's:
Gross Profit: Operating revenue less materials and supplies.
EBIT: Earnings before interest expense, other financial items and income taxes.
EBITDA: Earnings before interest expense, other financial items, income taxes, depreciation and
amortisation.
Adjusted EBITDA: EBITDA adjusted for other income and expenses. See table below.
Other income and expenses: Income and expenses which are considered special costs. See table below.
Net working capital: Current assets, net of cash and cash equivalents less current liabilities, net of short
term debt. Net working capital gives a measure of the funding required by the operations of the business.
Freely available cash: Cash and cash equivalents less restricted cash.
Liquidity reserve: Freely available cash and available credit facilities.
(In thousands of NOK) 2017 2016
EBITDA 103 842 91 719
Other Income and Expenses 26 758 13 456
Adjusted EBITDA 130 600 105 175
31 December,
Year to date ended
Year ended
31 December,
(In thousands of NOK) 2017 2016 2016
Refinancing 152 244 244
General M&A and strategy costs 348 4 802 4 802
IPO Cost 2017 16 149
Share based compensation 3 945
Extraordinary personell costs 6 164 7 743 7 743
Other - 667 667
Other income and expenses 26 758 13 456 13 456
31 December,
Year to date ended
Year ended
31 December
(In thousands of NOK) 2017 2016 2016
Inventory 26 287 17 546 17 546
Accounts receivable 1 492 161 1 206 783 1 206 783
Other receivables 60 049 56 065 56 065
Income tax receivable (4 983) 1 084 1 084
Accounts payable (1 550 436) (1 224 108) (1 224 108)
Public duties (229 057) (186 949) (186 949)
Other current liabilities (195 271) (210 026) (210 026)
Net working capital (401 250) (339 605) (339 605)
Year to date ended
31 December,
Year ended
31 December
(In thousands of NOK) 2017 2016 2016
Cash and cash equivalents 368 442 227 905 227 905
Restricted cash (18 725) (14 505) (14 505)
Freely available cash 349 717 213 400 213 400
Available credit facility 169 151 75 000 75 000
Liquidity reserve 518 869 288 400 288 400
31 December,
Year to date ended

Responsibi li ty statement by the Board and CEO
The Board and CEO have considered and approved the condensed set of financial statements for the period 1
January to 31 December 2017. We confirm to the best of our knowledge that the condensed set of financial
statements for the above-mentioned period:
• Has been prepared in accordance with IAS 34 (Interim Financial Reporting)
• Gives a true and fair view of the Group’s assets, liabilities, financial position, and overall result for the
period viewed in their entirety
• That the interim management report includes a fair review of any significant events that arose during the
above-mentioned period and their effect on the financial report
• Gives a true picture of any significant related parties’ transactions, principal risks and uncertainties faced
by the Group
Grethe Viksaas Jens Rugseth
Chairman
Dagfinn Ringås
Eivind Roald Camilla Magnus Bjørn Rosvoll
David Ulvær Torgrim Takle
CEO
Brit Smestad

Crayon Austria
Liebermannstraße F04/201, 2345 Brunn am Gebirge.
Crayon Denmark
Tobaksvejen 2A, 3. Sal., 2860 Søborg
Crayon Finland
Karvaamokuja 2a, 00380 Helsinki
Crayon France
1 Rue Royale, 92210 Saint-Cloud
Crayon Germany
Bajuwarenring 1, 82041 Oberhaching
Crayon Iceland
Borgartún 26, IS-105 Reykjavík, Iceland
Crayon India
Bangalore, #40, 4th Floor, 6th Sector, 12th Main,
Near BDA Complex, HSR Layout, Bengaluru – 560 102
Crayon India
Chennai, No. 29, 1st Floor, Shree Narayana Complex,
Sarathy Nagar, Velachery, Chennai – 600 042
Crayon India
Delhi, #616, 6th Floor, Ansal Chamber 2,
Bhikaji Cama Place, New Delhi – 110 066
Crayon India
Mumbai, Jai Antariksha, Office # 706,
7th Floor, Mumbai – 400 059
Crayon India
Unit No 6, Tower -2
Artha Infratech Pvt. Ltd. SEZ, Plot No. 21
Sector Techzone - IV, Greater Noida West UP - 201306
Crayon Malaysia
Unit 25-7, 7th Floor, Boulevard Office,
Mid Valley City, Lingkaran Syed Putra,
59200 Kuala Lumpur
Crayon Netherlands
IJsbaanpad 9-11, 1076CV Amsterdam,
The Netherlands
Crayon Norway
Postboks 4384, Nydalen,
Sandakerveien
114 A - 0402 Oslo
Crayon Philippines
Level 12 Robinsons Summit Center 6783 Ayala Avenue Makati
Manila 1226, Philippines
Crayon Portugal
Rua António Champalimaud, Lt., 1 Lispólis, Ed., CID, 1600-546
Lisboa
Crayon Singapore
60, Paya Lebar Road,
#08-20 Paya Lebar Square,
Singapore 409051
Crayon Spain
Calle la Caléndula, 93 Miniparc III – Edificio,
E 28109 Alcobendas
Crayon Switzerland
Suworow-Haus, Hellgasse 9,
6460 Altdorf
Crayon Sweden
Landsvägen 50A, 17263 Sundbyberg,
Sweden
Crayon MEA
Mazaya Business Avenue, Tower BB2, Office 2006
Jumeirah Lake Tower,
P.O. Box 336483 Dubai, UAE
Crayon UK
Crayon House, Mercury Park, Wooburn Green,
Buckinghamshire, HP10 0HH
Crayon US
Greater Denver Area,
350 Interlocken Blvd,
Suite 220 Broomfield, CO 80021
Crayon US
Greater Dallas/Ft Worth Area,
8111 LBJ Freeway, Suite 1000,
Dallas, TX 75251
Crayon US
Greater Fargo/Minneapolis Area,
3187 Bluestem Drive, Suite #1 West Fargo,
ND 58078-8008
Crayon US
Greater San Francisco Area, Anglepoint Group, Inc.
Santa Clara Towers, Suite 770,
3945 Freedom Circle, Santa Clara,
CA, 95054
Crayon US
Crayon US
Greater Salt Lake City Area,
3507 N. University Ave. Suite 200,
Provo, UT, 84604
Crayon US
Greater Raleigh Area,
56 Hunter St. Suite 300, Apex,
NC, 27502
Main regional Crayon offices: