Embed Size (px)
Citation preview
Q2 2017 Financial Update August 14, 2017
Agenda
• Stan Marshall President and CEO
• Derrick Sturge Executive VP Finance & CFO
• Questions
2
Forward-Looking Information Certain statements in this presentation are “forward-looking statements” based on Nalcor’s current expectations, estimates, projections and assumptions, subject to risks and uncertainties. Statements containing words such as “could”, “expect”, “may”, “anticipate”, “believe”, “intend”, “estimate”, “plan” and similar expressions constitute forward-looking statements. By their nature, forward-looking statements require Management to make assumptions and are not subject to important unknown risks and uncertainties, which may cause actual results in future periods to differ materially from forecasted results. While Management considers these assumptions to be reasonable and appropriate based on information currently available, there is a risk that they may not be accurate. Nalcor assumes no obligation to update or revise any forward-looking statements, whether as a result of new information, future events or any other reason.
3

4
Stan Marshall, CEO
Derrick Sturge, VP Finance and CFO
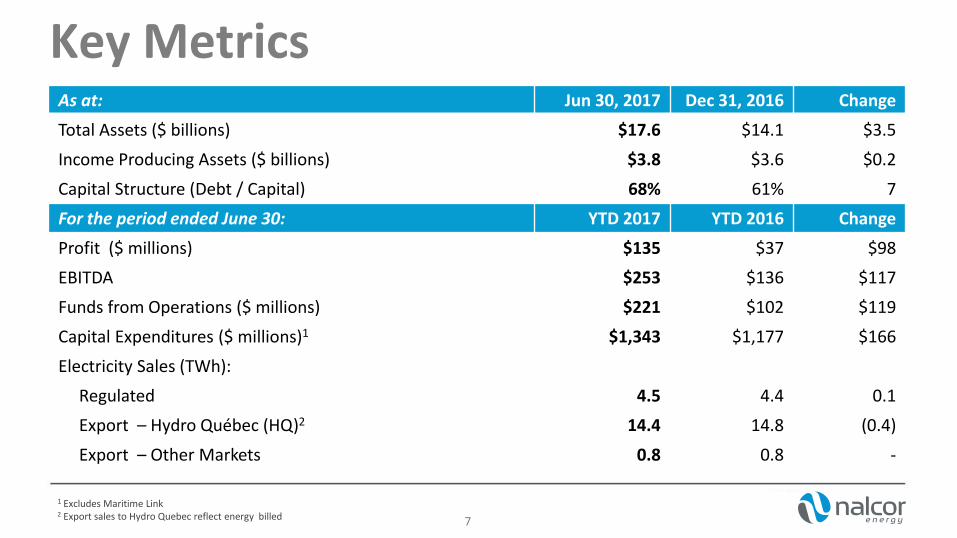
Key Metrics As at: Jun 30, 2017 Dec 31, 2016 Change
Total Assets ($ billions) $17.6 $14.1 $3.5
Income Producing Assets ($ billions) $3.8 $3.6 $0.2
Capital Structure (Debt / Capital) 68% 61% 7
For the period ended June 30: YTD 2017 YTD 2016 Change
Profit ($ millions) $135 $37 $98
EBITDA $253 $136 $117
Funds from Operations ($ millions) $221 $102 $119
Capital Expenditures ($ millions)1 $1,343 $1,177 $166
Electricity Sales (TWh):
Regulated 4.5 4.4 0.1
Export – Hydro Québec (HQ)2 14.4 14.8 (0.4)
Export – Other Markets 0.8 0.8 -
7
1 Excludes Maritime Link 2 Export sales to Hydro Quebec reflect energy billed
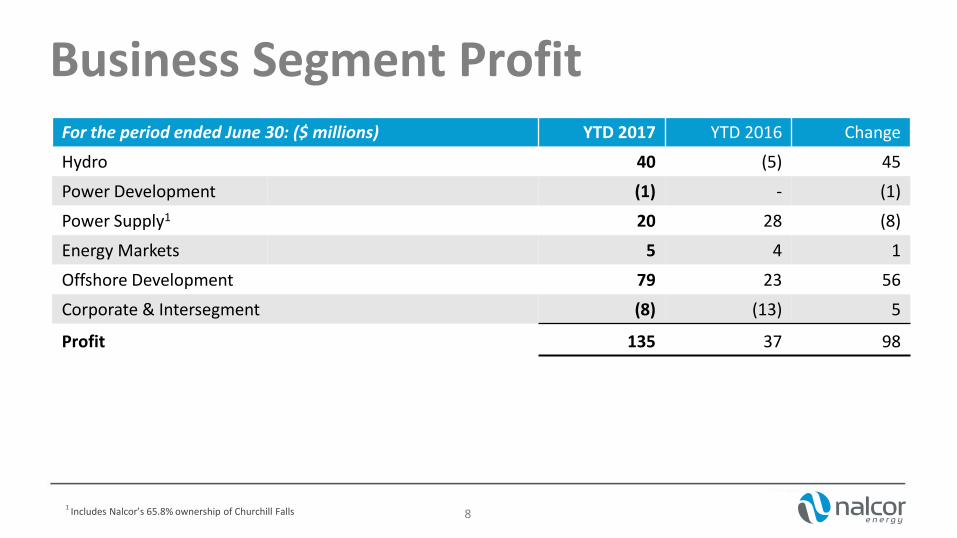
Business Segment Profit For the period ended June 30: ($ millions) YTD 2017 YTD 2016 Change
Hydro 40 (5) 45
Power Development (1) - (1)
Power Supply1 20 28 (8)
Energy Markets 5 4 1
Offshore Development 79 23 56
Corporate & Intersegment (8) (13) 5
Profit 135 37 98
8 1 Includes Nalcor’s 65.8% ownership of Churchill Falls
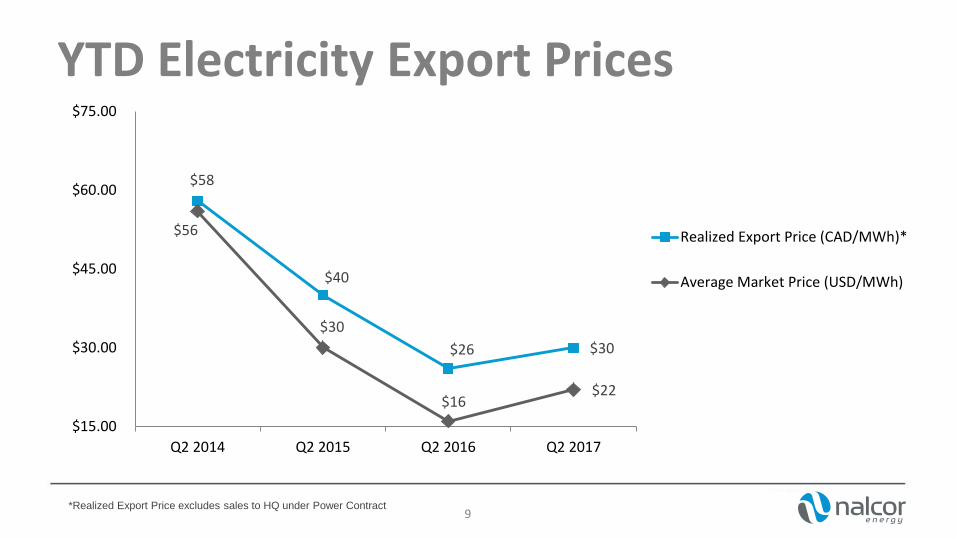
YTD Electricity Export Prices
$58
$40
$26 $30
$56
$30
$16 $22
$15.00
$30.00
$45.00
$60.00
$75.00
Q2 2014 Q2 2015 Q2 2016 Q2 2017
Realized Export Price (CAD/MWh)*
Average Market Price (USD/MWh)
9 *Realized Export Price excludes sales to HQ under Power Contract
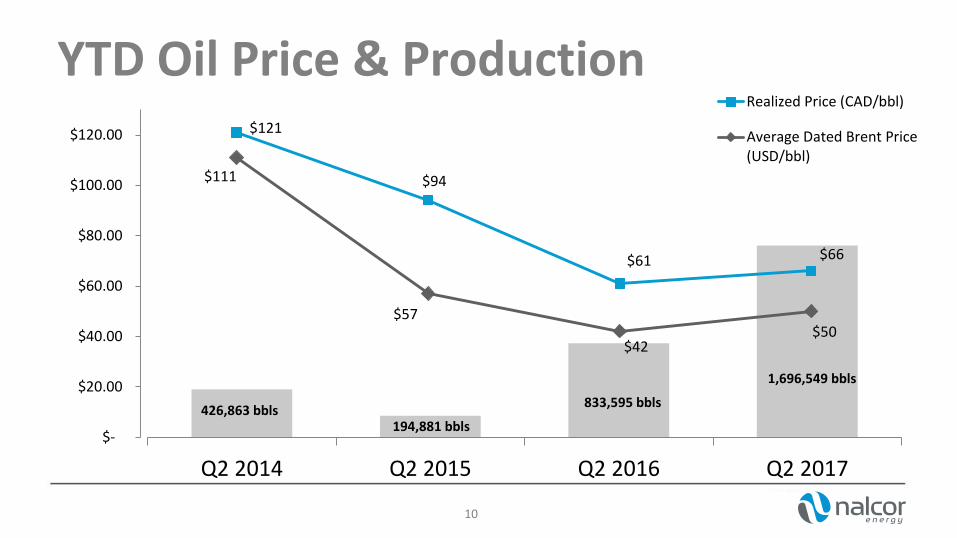
Q2 2014 Q2 2015 Q2 2016 Q2 2017
10
$121
$94
$61 $66
$111
$57
$42 $50
$-
$20.00
$40.00
$60.00
$80.00
$100.00
$120.00
Realized Price (CAD/bbl)
Average Dated Brent Price(USD/bbl)
194,881 bbls
833,595 bbls
1,696,549 bbls
426,863 bbls
YTD Oil Price & Production
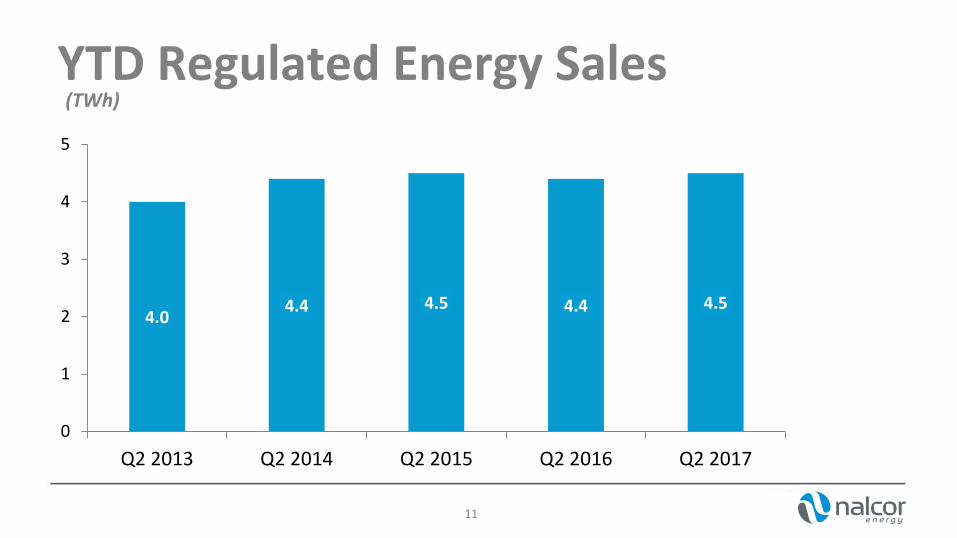
YTD Regulated Energy Sales
4.0 4.4 4.5 4.4 4.5
0
1
2
3
4
5
Q2 2013 Q2 2014 Q2 2015 Q2 2016 Q2 2017
11
(TWh)
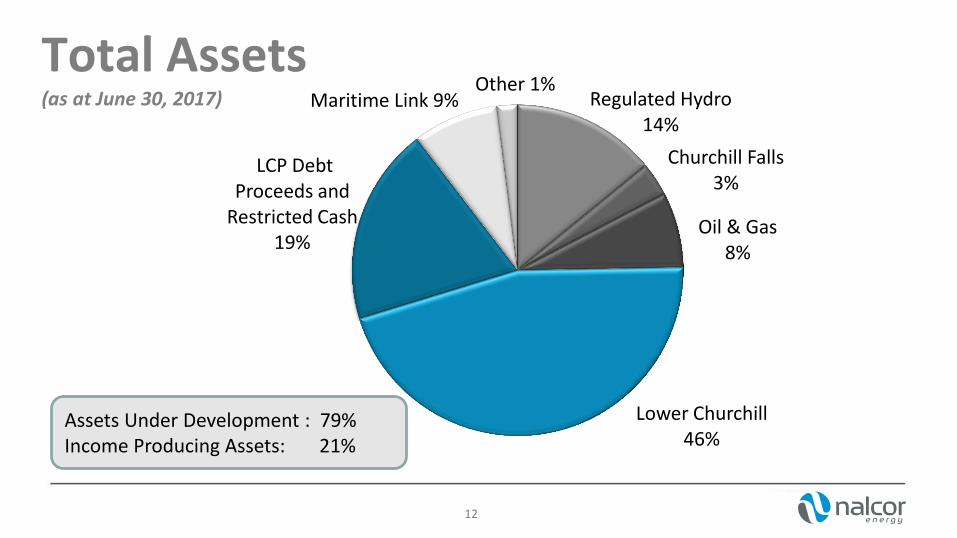
Total Assets (as at June 30, 2017) Regulated Hydro
14%
Churchill Falls 3%
Oil & Gas 8%
Lower Churchill 46%
LCP Debt Proceeds and
Restricted Cash 19%
Maritime Link 9% Other 1%
12
Assets Under Development : 79% Income Producing Assets: 21%
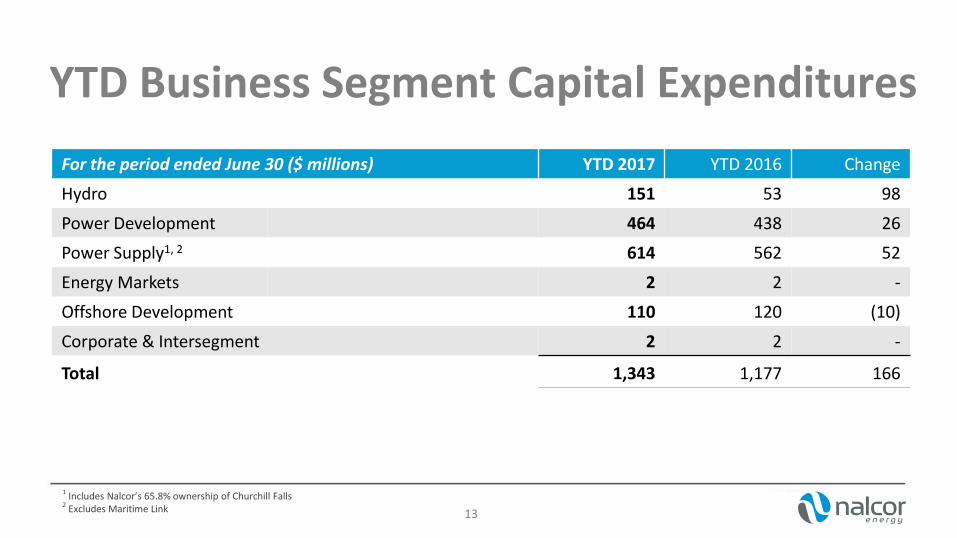
YTD Business Segment Capital Expenditures
13
1 Includes Nalcor’s 65.8% ownership of Churchill Falls 2 Excludes Maritime Link
For the period ended June 30 ($ millions) YTD 2017 YTD 2016 Change
Hydro 151 53 98
Power Development 464 438 26
Power Supply1, 2 614 562 52
Energy Markets 2 2 -
Offshore Development 110 120 (10)
Corporate & Intersegment 2 2 -
Total 1,343 1,177 166
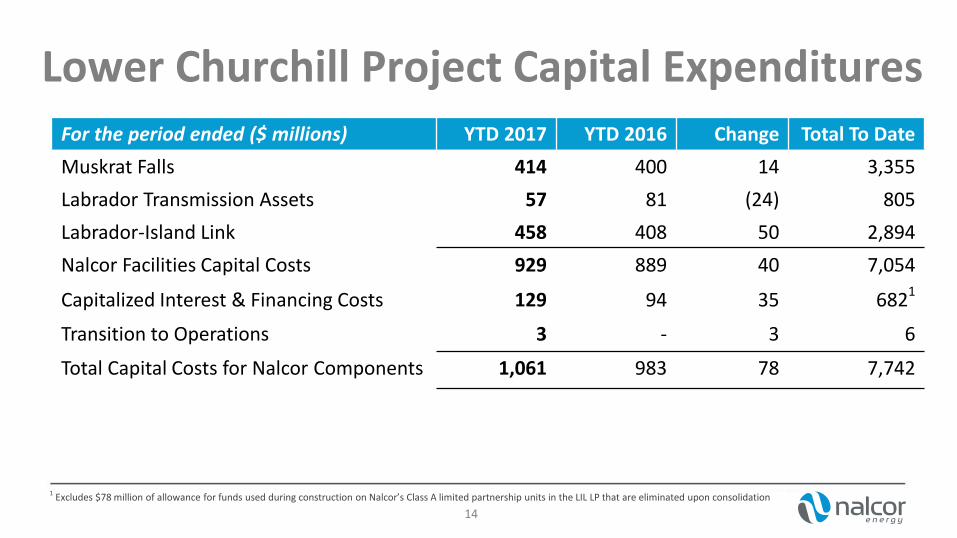
Lower Churchill Project Capital Expenditures For the period ended ($ millions) YTD 2017 YTD 2016 Change Total To Date
Muskrat Falls 414 400 14 3,355
Labrador Transmission Assets
57 81 (24) 805
Labrador-Island Link 458 408 50 2,894
Nalcor Facilities Capital Costs
929 889 40 7,054
Capitalized Interest & Financing Costs 129 94 35 6821
Transition to Operations 3 - 3 6
Total Capital Costs for Nalcor Components 1,061 983 78 7,742
14
1 Excludes $78 million of allowance for funds used during construction on Nalcor’s Class A limited partnership units in the LIL LP that are eliminated upon consolidation
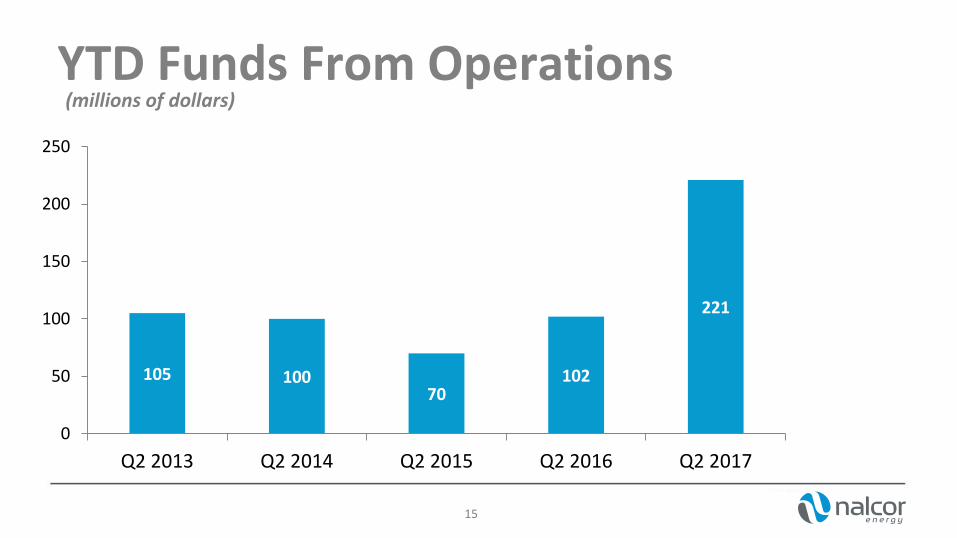
YTD Funds From Operations
105 100 70
102
221
0
50
100
150
200
250
Q2 2013 Q2 2014 Q2 2015 Q2 2016 Q2 2017
15
(millions of dollars)
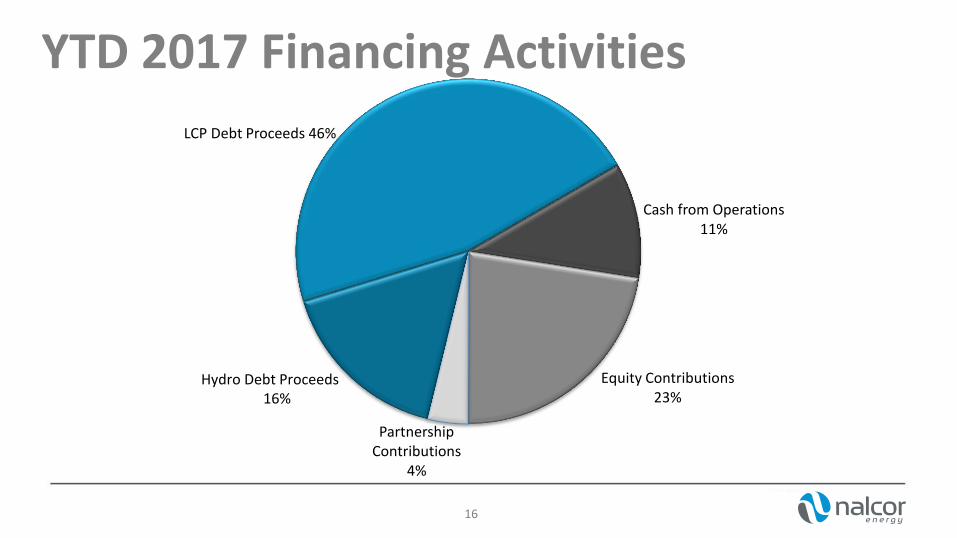
YTD 2017 Financing Activities
Cash from Operations 11%
Equity Contributions 23%
Partnership Contributions
4%
LCP Debt Proceeds 46%
Hydro Debt Proceeds 16%
16
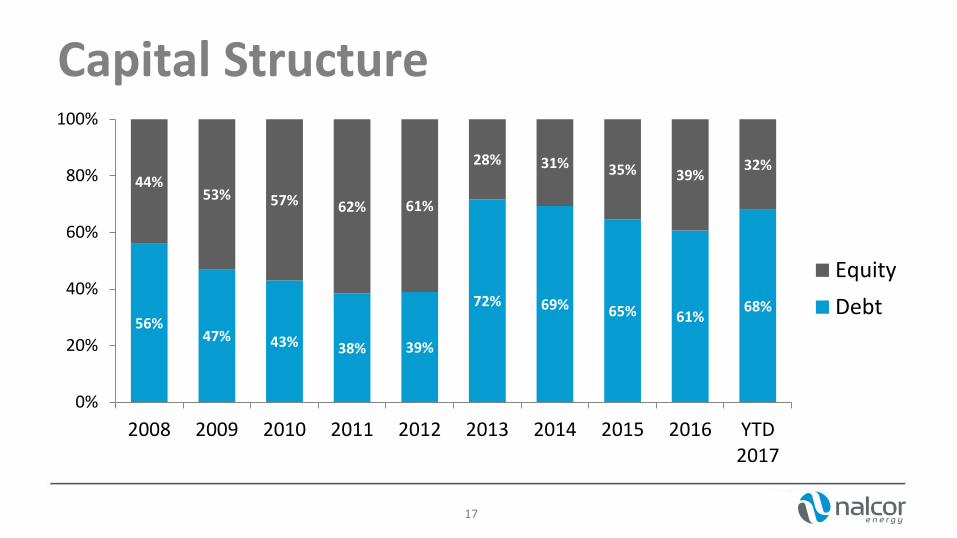
Capital Structure
17
56% 47% 43% 38% 39%
72% 69% 65% 61% 68%
44% 53% 57% 62% 61%
28% 31% 35% 39% 32%
0%
20%
40%
60%
80%
100%
2008 2009 2010 2011 2012 2013 2014 2015 2016 YTD2017
Equity
Debt
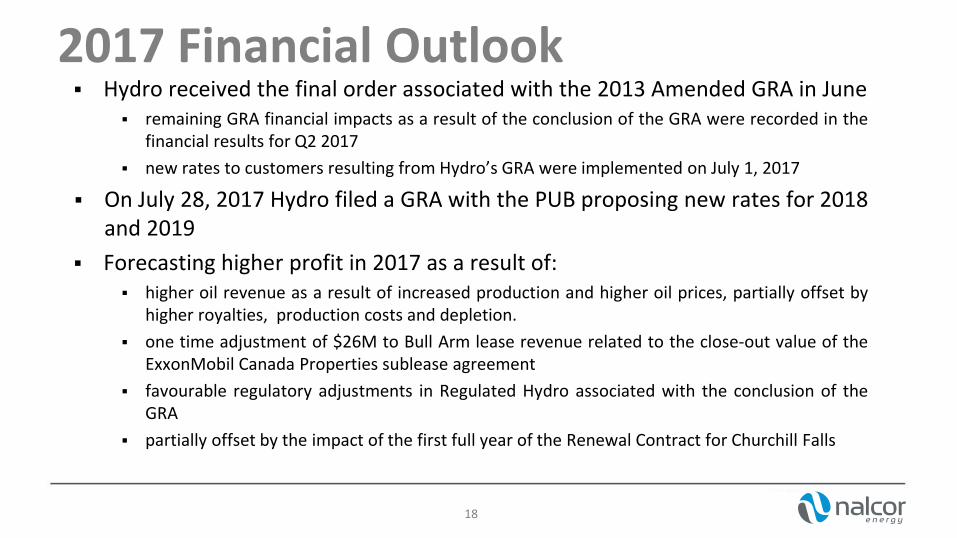
2017 Financial Outlook Hydro received the final order associated with the 2013 Amended GRA in June
remaining GRA financial impacts as a result of the conclusion of the GRA were recorded in the financial results for Q2 2017
new rates to customers resulting from Hydro’s GRA were implemented on July 1, 2017
On July 28, 2017 Hydro filed a GRA with the PUB proposing new rates for 2018 and 2019
Forecasting higher profit in 2017 as a result of: higher oil revenue as a result of increased production and higher oil prices, partially offset by
higher royalties, production costs and depletion.
one time adjustment of $26M to Bull Arm lease revenue related to the close-out value of the ExxonMobil Canada Properties sublease agreement
favourable regulatory adjustments in Regulated Hydro associated with the conclusion of the GRA
partially offset by the impact of the first full year of the Renewal Contract for Churchill Falls
18
2017 Financial Outlook Anticipating first oil from Hebron in late 2017
Forecasting capital expenditures (excl. Maritime Link) of $3.1 billion with the largest portion relating to the Lower Churchill Project ($2.4 billion)
19

Questions


![Result update presentation Q2 FY16 [Company Update]](https://img.pdfslide.net/doc/110x75/577ca7c81a28abea748c8e41/result-update-presentation-q2-fy16-company-update.jpg)