Embed Size (px)
Citation preview

1
TSX: GCMAugust 15, 2017
Lombardo Paredes Arenas, CEOMike Davies, CFO
The leading high‐grade gold producer in Colombia
Q2‐2017 Results

2
TSX: GCMAugust 15, 2017
Forward‐Looking Statements DISCLAIMER
This presentation contains "forward‐looking information", which may include, but is not limited to, statements withrespect to the future financial or operating performance of the Company and its projects, and, specifically, statementsconcerning anticipated growth in annual gold production, future cash costs and AISC, future G&A and capex, excesscash flow and sinking funds for the senior debentures and future purchases and/or redemptions of the seniordebentures. Often, but not always, forward‐looking statements can be identified by the use of words such as "plans","expects", "is expected", "budget", "scheduled", "estimates", "forecasts", "intends", "anticipates", or "believes" orvariations (including negative variations) of such words and phrases, or state that certain actions, events or results"may", "could", "would", "might" or "will" be taken, occur or be achieved. Forward‐looking statements involve knownand unknown risks, uncertainties and other factors which may cause the actual results, performance or achievementsof Gran Colombia to be materially different from any future results, performance or achievements expressed orimplied by the forward‐looking statements. Factors that could cause actual results to differ materially from thoseanticipated in these forward‐looking statements are described under the caption "Risk Factors" in the Company'sAnnual Information Form dated as of March 30, 2017 which is available for view on SEDAR at www.sedar.com.Forward‐looking statements contained herein are made as of the date of this press release and Gran Colombiadisclaims, other than as required by law, any obligation to update any forward‐looking statements whether as aresult of new information, results, future events, circumstances, or if management's estimates or opinions shouldchange, or otherwise. There can be no assurance that forward‐looking statements will prove to be accurate, as actualresults and future events could differ materially from those anticipated in such statements. Accordingly, the reader iscautioned not to place undue reliance on forward‐looking statements.

3
TSX: GCMAugust 15, 2017
Q2‐2017 Highlights
2017 Priorities First Half Accomplishments
Improve capital structure• Share consolidation• Debt extension
• Completed April 25, 2017.• $47M extended to 2024 on May 31, 2017.
Generate Excess Cash Flow = 10% of principal amount of Senior Debentures
• Generated $5.5M in H1‐2017.• $2.0M used to cancel $2.4M of 2020s (NCIB).• $3.0M redemption of 2020s on July 31, 2017.
Continue implementation of optimized mine planat Segovia:• Development and mechanization at Providenciaand El Silencio
• Upgrades at Maria Dama and TSF expansion
H1‐2017 sustaining capex of $11.9M (~$142/oz):• ~40% related to exploration &development • ~30% mines and related infrastructure• ~15% Maria Dama plant upgrades• ~10% related to new water treatment plant
20,000m drilling program at Segovia • Commenced late January 2017.• 4 rigs currently in the field; 40% complete
Update mineral resource estimates:• Segovia
• Marmato Underground
• Completed effective March 15, 2017• PEA to be filed September 2017• Expected September2017

4
TSX: GCMAugust 15, 2017
RESULTS Highlights
Mine development at Sandra K – July 17, 2014
(1) Refer to Company’s MD&A for computation
2nd Quarter 1st Half
2017 2016 2017 2016
46,075 38,229 Gold production (ozs) 85,083 69,718
45,179 38,902 Gold sales (ozs) 83,613 68,588
$1,225 $1,216 Realized gold price ($/oz) $1,201 $1,185
$676 $680 Cash cost ($/oz) $709 $682
$884 $811 AISC ($/oz) $910 $802
$56.0M $48.0M Revenue $101.7M $82.5M
$21.3M $18.3M Adjusted EBITDA (1) $34.9M $29.9M
$36.2M $0.1M Net income $35.4M $10.9M
$1.77 $0.01 Per share $1.77 $1.40
$4.1M $3.9M Adjusted net income (1) $7.2M $4.1M
$0.20 $0.42 Per share $0.36 $0.53
$3.2M $2.3M Excess Cash Flow $5.5M $2.3M

5
TSX: GCMAugust 15, 2017
RESULTS Segovia LOM Plan
• Updated Mineral Resource effective March 15, 2017
• Life‐of‐mine (“LOM”) plan updated in Q2‐2017 with key results as follows:
• Mine life extended by 4 years to 2026• Incorporates mining from 5 major mines within our
titles• 4.1M tonnes processed over the LOM• LOM head grade averages 8.8 g/t• 1.0M ozs of gold recovered• LOM total cash cost of $697/oz and AISC (ex G&A)
of $896/oz• At $1,250 long‐term gold price, total
undiscounted after‐tax FCF of $210M
• SRK is preparing a 43‐101 PEA technical report to be filed on SEDAR in September 2017
• 20,000 meters drilling program being conducted in 2017 aimed at increasing confidence in Mineral Resources and expanding resources for future mining.
Measured & Indicated Inferred
Au(koz)
Au(koz)
March 15, 2017 1,100 978
December 31, 2016 402 1,278
Change vs 2016 698174%
(300)‐23%
• Mine life extension plus increase in LT gold price assumption to $1,250/oztriggered a $53M reversal of impairment ($35.5M after‐tax) in Q2‐2017.

6
TSX: GCMAugust 15, 2017
RESULTS
Segovia production growImproved head grades in the Company‐operated mining areas, notably in the Providencia mine,
was the key driver behind the Q2‐2017 th (26%) over Q2‐2016. Produced 12,651 ozs in July 2017.
Capital investment and mechanization focused on expanding Company‐operated mining areas.Marmato
Generally, operations running steady. Produced 2,329 ozs in July 2017.
Production
2nd Quarter 1st Half
2017 2016 2017 2016
Gold (ozs)
Segovia
13,647 7,962 Company-operated 21,547 13,051
26,581 23,922 Contract miners 51,449 44,832
40,228 31,884 72,996 57,883
5,847 6,345 Marmato 12,087 11,835
46,075 38,229 Total Company 85,083 69,718
44,691 43,722 Silver (ozs) 86,370 82,148

7
TSX: GCMAugust 15, 2017
Growth in Gran Colombia’s total gold production has been driven by the high‐grade Segovia Operations. Marmato has been steady.
2017 production guidance is 150,000‐160,000 ounces of gold.
Gold ProductionRESULTSAISC (‐23%
)
000’s ozs
‐
25
50
75
100
125
150
175
2013 2014 2015 2016 LTM *
Segovia Marmato
165k
* LTM = Latest 12 months ended June 30, 2017

8
TSX: GCMAugust 15, 2017
Total Cash Cost Per Ounce (1)RESULTS
117
89 $400
$600
$800
$1,000
$1,200
2013 2014 2015 2016 H1‐2017
Segovia
2013 2014 2015 2016 H1‐2017
Marmato
$1,06116% of H1‐2017 gold sales
US$/oz sold
$652
84% of H1‐2017 gold sales
Total cash cost for the Company was $709/oz in H1‐2017, up from $682/oz in H1‐2016.
Production growth helping to drive down fixed costs on a per ounce basis at Segovia.
Appreciation of the Colombian peso relative to last year has increased USD‐equivalent cash costs to some extent in H1‐2017. Marmato’s cash costs on a per ounce basis has also been impacted by lower grades this year compared to H1‐2016.
Continuing to expect FY2017 total cash cost to remain below $720/oz.
(1) By‐product credit basis. Refer to Company’s MD&A for computation.
9
TSX: GCMAugust 15, 2017
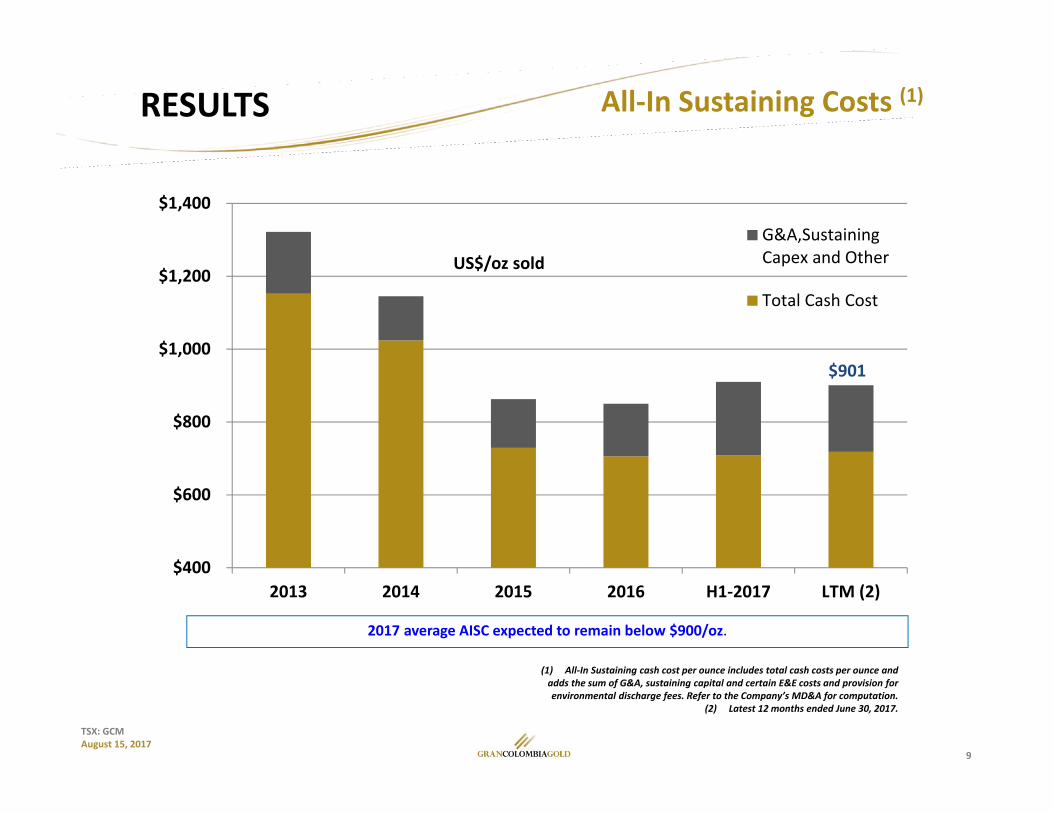
All‐In Sustaining Costs (1)
(1) All‐In Sustaining cash cost per ounce includes total cash costs per ounce and adds the sum of G&A, sustaining capital and certain E&E costs and provision for environmental discharge fees. Refer to the Company’s MD&A for computation.
(2) Latest 12 months ended June 30, 2017.
RESULTSAISC (‐23%
)
US$/oz sold
$400
$600
$800
$1,000
$1,200
$1,400
2013 2014 2015 2016 H1‐2017 LTM (2)
G&A,SustainingCapex and Other
Total Cash Cost
$901
2017 average AISC expected to remain below $900/oz.

10
TSX: GCMAugust 15, 2017
0 200 400 600 800 1,000 1,200
Guyana Goldfields
Detour Gold
IamGold
Alamos Gold
TAHOE Resources
Kinross Gold
Argonaut Gold
New Gold
Yamana Gold
Gran Colombia Gold
Centerra Gold
Timmins / Alio Gold
Goldcorp
Kirkland Lake Gold
Barrick Gold US$/oz sold
Cash Cost AISC
Gran Colombia’s AISC is well positioned amongst industry peers.
All‐In Sustaining Costs (1)
(1) Q2 2017 reported results filings; AISC is a common performance measure but does not have any standardized meaning within the industry and therefore its computations may vary between companies.
RESULTSAISC (‐23%
)
$884

11
TSX: GCMAugust 15, 2017
Adjusted EBITDA (1)RESULTS
(1) Refer to Company’s MD&A for computation.(2) LTM = Latest 12 months ended June 30, 2017.
$‐
$25
$50
$75
2013 2014 2015 2016 LTM (2)
$71.0M
US$M
H1‐2017 adjusted EBITDA of $35M is up 17% over H1‐2016.
The LTM adjusted EBITDA is $71.0M at the end of H1‐2017, up 8% over FY2016.

12
TSX: GCMAugust 15, 2017
Excess Cash Flow (1)RESULTS
(1) As defined in the Indentures (available on the Company’s web site) for the 2018 and 2020/2024 Debentures.
‐20.0 ‐10.0 0.0 10.0 20.0 30.0 40.0
Excess Cash Flow (1)
Working capital
Local debt repayments
Other obligations
Interest paid
Capex
Income taxes paid
Adjusted EBITDA
$5.5M
US$M
H1‐2017
$34.9M
Sinking Fund Balances – June 30, 2017:2020/2024 Debentures ‐ $3.1M2018 Debentures ‐ $1.5M
Used $1.4M of 2020 Sinking Fund torepurchase $1.7M of debentures inH1‐2017 under NCIB.
Used $3.0M of 2020 Sinking Fund at June 30, 2017 for partial redemption on July 31, 2017.
Expecting Excess Cash Flow of ~$16M for FY2017, up from $2.9m in FY2016

13
TSX: GCMAugust 15, 2017
Balance SheetRESULTS
* Excludes current portion of short and long‐term debt ** Aggregate principal amounts issued and outstanding
June 2017 December 2016
Adjusted working capital deficit *
Cash $3.0M $2.8M
Accounts receivable $10.3M $11.4M
Accounts payable and accrued liabilities ($19.8M) ($16.6M)
Wealth taxes payable ($0.5M) ‐
Income taxes payable ($1.2M) ($6.1M)
Mining titles and compensation agreements payable ($10.5M) ($11.0M)
Inventories and other items, net $10.8M $9.2M
($7.9M) ($10.3M)
Total short and long‐term debt
Local debt, net of cash in trust $0.7M $1.4M
2018 Debentures ** $46.0M $49.7M
2020 Debentures ** $52.5M $101.2M
2024 Debentures** $47.0M
Sinking funds for 2018 and 2020 Debentures ($4.6M) ($0.5M)

14
TSX: GCMAugust 15, 2017
CAPITAL STRUCTURE
TSX Symbol Exercise Price Issued &Outstanding2017‐08‐14
Fully DilutedShares
Common shares GCM 20.5M 20.5M
2018 Debentures (1) GCM.DB.U US$1.95 $46.0M 23.6M
2020 Debentures (1) GCM.DB.V US$1.95 $48.8M 25.0M
2024 Debentures (1) GCM.DB.X US$1.95 $47.0M 24.1M
93.2M
Warrants GCM.WT.AUnlisted
CA$48.75CA$281.25
0.3M67K
Options CA$2.55 CA$27.60 1.8M47K
(1) Amounts shown for the Senior Debentures are at Face Value.
Common shares consolidated on a 1:15 basis effective April 25, 2017.
Through NCIB repurchases and the July 31, 2017 partial redemption, the 2020 Debentures principal outstanding has been reduced by $5.4M so far this year, eliminating $0.8M of future interest and reducing potential dilution by 2.8M shares.
$47.0M of 2020 Debentures extended to 2024 effective May 31, 2017
Post Consolidation

15
TSX: GCMAugust 15, 2017
2017 OUTLOOK
Priorities1. Improve capital structure: share consolidation and debt extension.2. Generate Excess Cash Flow = 10% of principal amount of Senior Debentures.3. Continue implementation of optimized mine plan at Segovia:
– Continue development and mechanization at Providencia and El Silencio;– Additional upgrades at Maria Dama and tailings storage expansion;
4. 20,000m drilling program at Segovia; and5. Update mineral resource estimates at Segovia and Marmato Underground.
2017 Targets2017 Guidance H1‐2017 Actual LTM *
Gold production (ozs) 150,000 – 160,000 85,083 165,073
Cash cost/oz sold < $720 $709 $718
AISC/oz sold < $900 $910 $901
Maintaining Guidance
* LTM = Latest 12 months ended June 30, 2017

16
TSX: GCMAugust 15, 2017
For Further Information, Contact: Mike Davies
Chief Financial Officer(416) 360‐4653
Town of Segovia


![FCM Workflow using GCM. Agenda Polling Mechanism What is GCM Need / advantages of GCM GCM Architecture Working of GCM GCM – Send to Sync [ HTTP ] and](https://img.pdfslide.net/doc/110x75/5697bfba1a28abf838ca07e2/fcm-workflow-using-gcm-agenda-polling-mechanism-what-is-gcm-need-advantages.jpg)