Embed Size (px)
Citation preview

Q4 2018 Earnings Call Presentation
February 21, 2019

Q4 2018 Earnings Call Presentation | 2
We would like to caution you with respect to any “forward-looking statements” made in this presentation as defined in Section 27A of the United States Securities Act of 1933, as amended, and Section 21E of the United States Securities Exchange Act of 1934, as amended. The words such as "believe,” “expect,” “anticipate,” “plan,” “intend,” “foresee,” “should,” “would,” “could,” “may,” “estimate,” “outlook” and similar expressions are intended to identify forward-looking statements, which are generally not historical in nature.
Such forward-looking statements involve significant risks, uncertainties and assumptions that could cause actual results to differ materially from our historical experience and our present expectations or projections, including the following known material factors: risks related to review of our accounting for foreign currency effects and any resulting financial restatements, pro forma corrections, filing delay, regulatory non-compliance or litigation; the risk that additional information may arise during our review of our accounting for foreign currency effects that would require us to make additional adjustments or identify additional material weaknesses; competitive factors in our industry; risks related to our information technology infrastructure and intellectual property; risks related to our business operations and products; risks related to third parties with whom we do business; our ability to hire and retain key personnel; risks related to legislation or governmental regulations affecting us; international, national or local economic, social or political conditions; risks associated with being a public listed company; conditions in the credit markets; risks associated with litigation or investigations; risks associated with accounting estimates, currency fluctuations and foreign exchange controls; risks related to integration; tax-related risks; and such other risk factors as set forth in our filings with the United States Securities and Exchange Commission.
We caution you not to place undue reliance on any forward-looking statements, which speak only as of the date hereof. We undertake no obligation to publicly update or revise any of our forward-looking statements after the date they are made, whether as a result of new information, future events or otherwise, except to the extent required by law.
DisclaimerForward-looking statements
Q4 2018 Overview
Financial Results and Operational Highlights
Doug Pferdehirt, Chief Executive Officer
Maryann Mannen, EVP and Chief Financial Officer

Q4 2018 Earnings Call Presentation | 4
2018: Winning, executing, collaborating
(1) Adjusted EBITDA is a non-GAAP measure. Adjusted EBITDA as presented excludes the impact of charges and credits from continuing operations as identified in the reconciliation of GAAP to non-GAAP financial schedules
included in the appendix.(2) iEPCI™ = integrated engineering, procurement, construction and installation
Winning Executing Collaborating
Delivering on a clear strategy to create value and expand growth opportunities
$14.3B Inbound order intake
12.2%Adjusted EBITDA(1) margin
5 Strategic relationships announced
Maintaining customer confidence to
secure new project awardsMeeting and exceeding project
delivery and financial commitments
Strengthening integrated offerings
through collaboration
Order inbound +40% (YoY); orders
exceeded revenues in all segments
Backlog of $14.6B, up 12% (YoY)
Margin down 93bps on anticipated
revenue decline of 17% (YoY)
3 iEPCI™(2) projects delivered;
Yamal Trains 2 and 3 handed over
ahead of schedule
Island Offshore, Magma Global,
Petrobras, Equinor, Chevron
Leveraging know-how, expertise
and next generation technology
Q4 2018 Earnings Call Presentation | 5
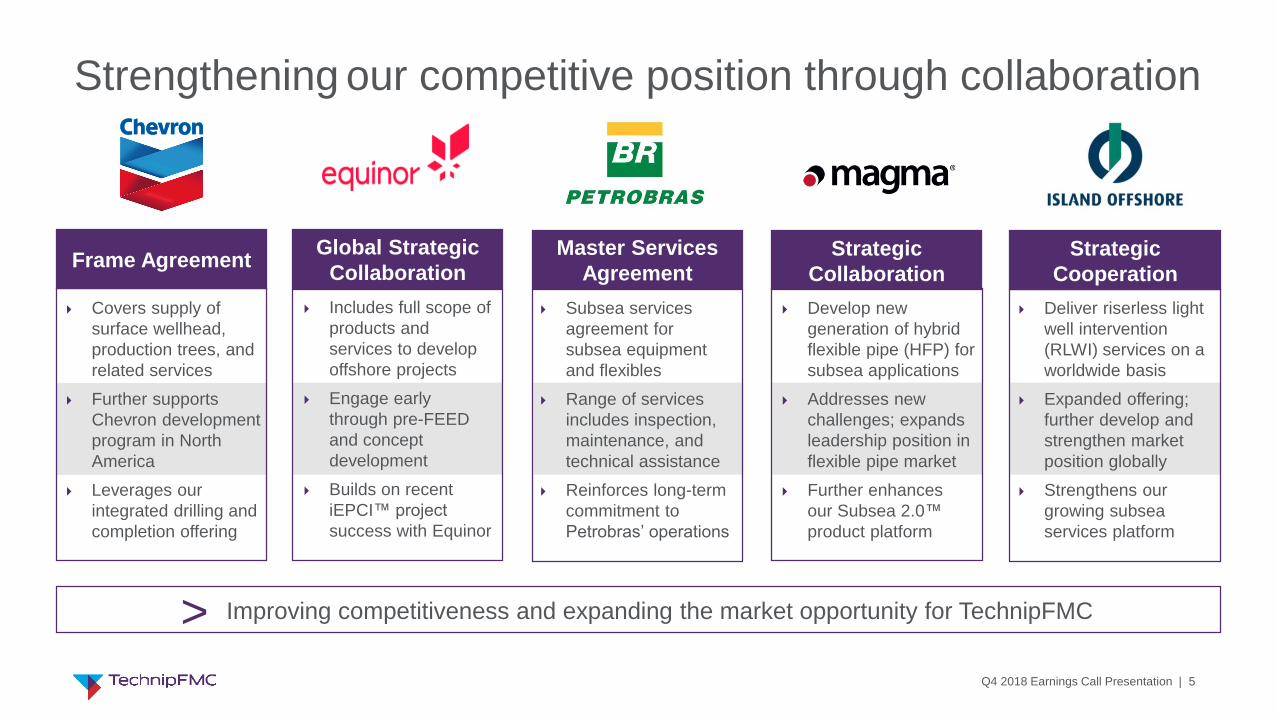
Deliver riserless light
well intervention
(RLWI) services on a
worldwide basis
Expanded offering;
further develop and
strengthen market
position globally
Strengthens our
growing subsea
services platform
Develop new
generation of hybrid
flexible pipe (HFP) for
subsea applications
Addresses new
challenges; expands
leadership position in
flexible pipe market
Further enhances
our Subsea 2.0™
product platform
Subsea services
agreement for
subsea equipment
and flexibles
Range of services
includes inspection,
maintenance, and
technical assistance
Reinforces long-term
commitment to
Petrobras’ operations
Includes full scope of
products and
services to develop
offshore projects
Engage early
through pre-FEED
and concept
development
Builds on recent
iEPCI™ project
success with Equinor
Winning
Strengthening our competitive position through collaboration
Frame AgreementGlobal Strategic
CollaborationStrategic
Cooperation
Master Services
Agreement
> Improving competitiveness and expanding the market opportunity for TechnipFMC
Strategic
Collaboration
Covers supply of
surface wellhead,
production trees, and
related services
Further supports
Chevron development
program in North
America
Leverages our
integrated drilling and
completion offering
Q4 2018 Earnings Call Presentation | 6
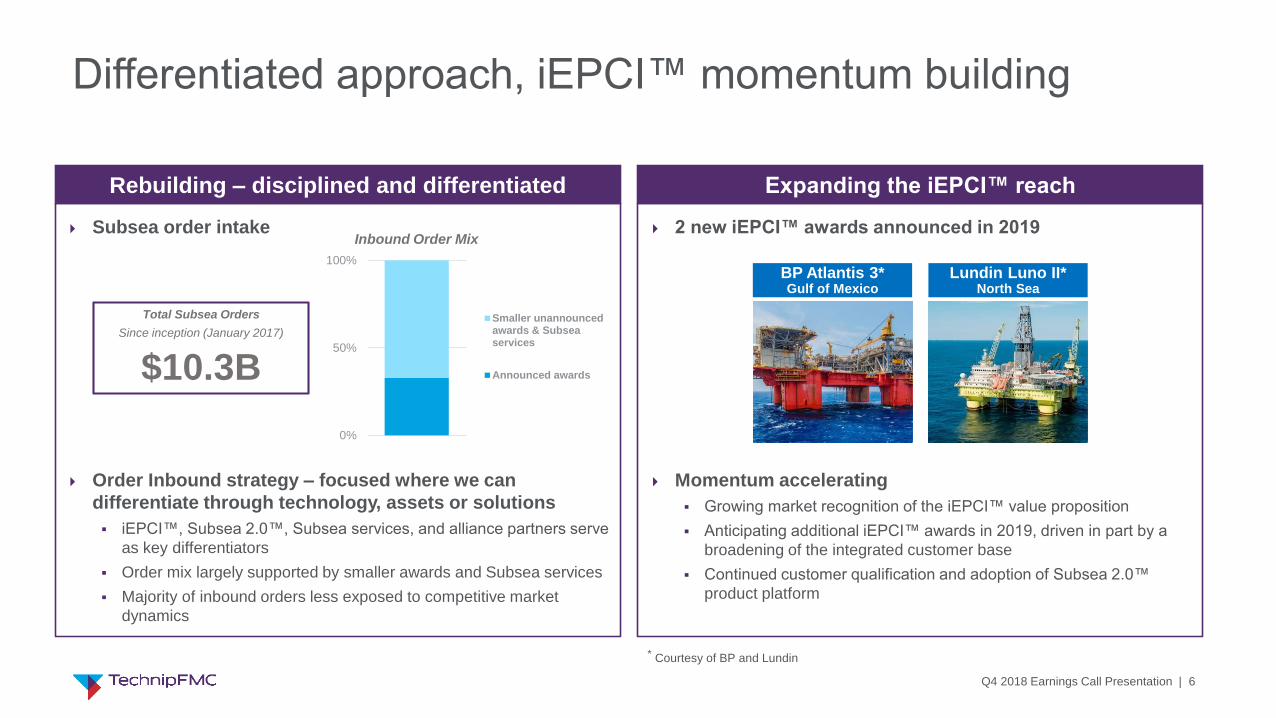
Differentiated approach, iEPCI™ momentum building
Subsea order intake
Order Inbound strategy – focused where we can
differentiate through technology, assets or solutions
▪ iEPCI™, Subsea 2.0™, Subsea services, and alliance partners serve
as key differentiators
▪ Order mix largely supported by smaller awards and Subsea services
▪ Majority of inbound orders less exposed to competitive market
dynamics
Rebuilding – disciplined and differentiated
2 new iEPCI™ awards announced in 2019
Momentum accelerating
▪ Growing market recognition of the iEPCI™ value proposition
▪ Anticipating additional iEPCI™ awards in 2019, driven in part by a
broadening of the integrated customer base
▪ Continued customer qualification and adoption of Subsea 2.0™
product platform
Expanding the iEPCI™ reach
0%
50%
100%
Smaller unannouncedawards & Subseaservices
Announced awards
Inbound Order Mix
BP Atlantis 3*Gulf of Mexico
Lundin Luno II*North Sea
Total Subsea Orders
Since inception (January 2017)
$10.3B
* Courtesy of BP and Lundin

Q4 2018 Earnings Call Presentation | 7
Subsea opportunities in the next 24 months*
ANADARKO
Golfinho
INPEX
Ichthys 2a
SHELL
Bonga SW
TOTAL
ACCEPETROBRAS
Mero 2
EXXONMOBIL
Neptun Deep
$250M to $500M
$500M to $1,000M
above $1,000M
ENI
Merakes
CHEVRON
Anchor
EXXONMOBIL
Payara
EQUINOR
Johan Sverdrup 2
RELIANCE
MJ-1
TOTAL
Preowei
PETROBRAS
Buzios V
PETROBRAS
Sepia
CONOCOPHILLIPS
Barossa
WOODSIDE
Browse
*February 2019 update; project value ranges reflect potential subsea scope
ENI
Zabazaba
TOTAL
Lapa
ENI
Kalimba
Petronas
Limbayong
PETROBRAS
Itapu
Q4 2018 Earnings Call Presentation | 8
0
4.5
9
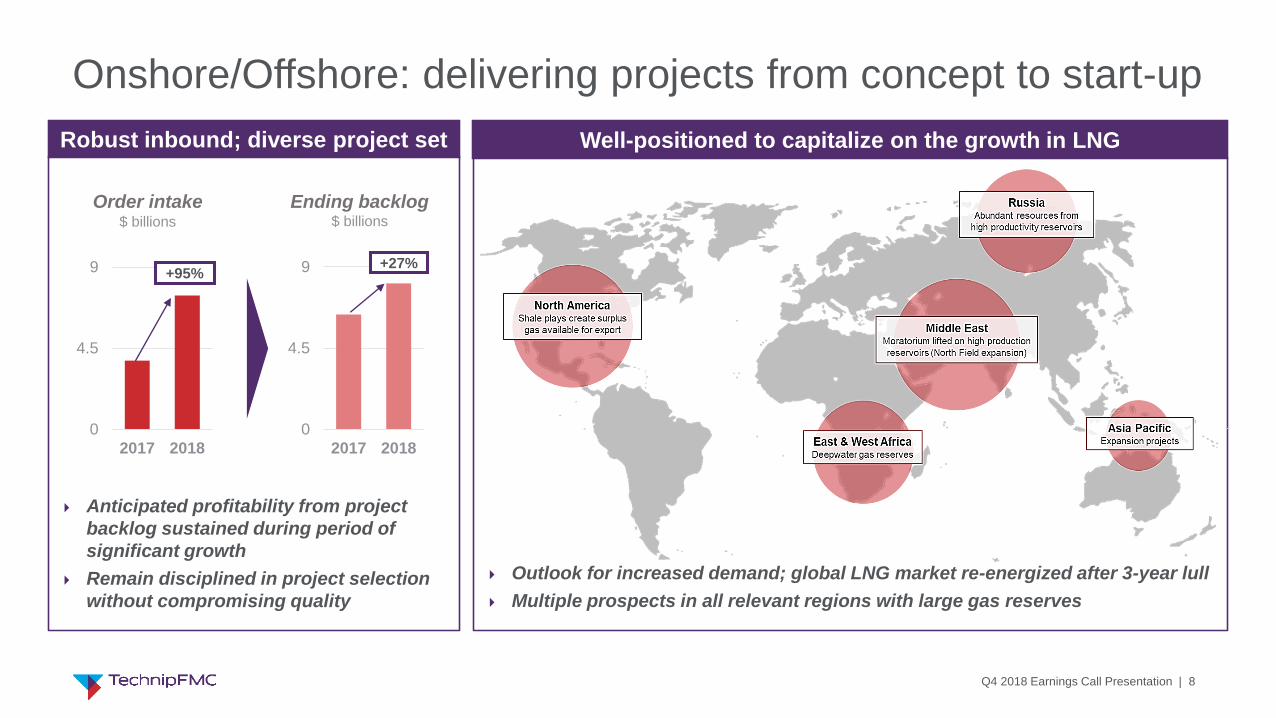
2017 2018
+95%
Onshore/Offshore: delivering projects from concept to start-up
Robust inbound; diverse project set
Ending backlog
Anticipated profitability from project
backlog sustained during period of
significant growth
Remain disciplined in project selection
without compromising quality
0
4.5
9
2017 2018
Order intake
+27%
$ billions $ billions
Outlook for increased demand; global LNG market re-energized after 3-year lull
Multiple prospects in all relevant regions with large gas reserves
Well-positioned to capitalize on the growth in LNG

Q4 2018 Earnings Call Presentation | 9
OTHER ITEMS
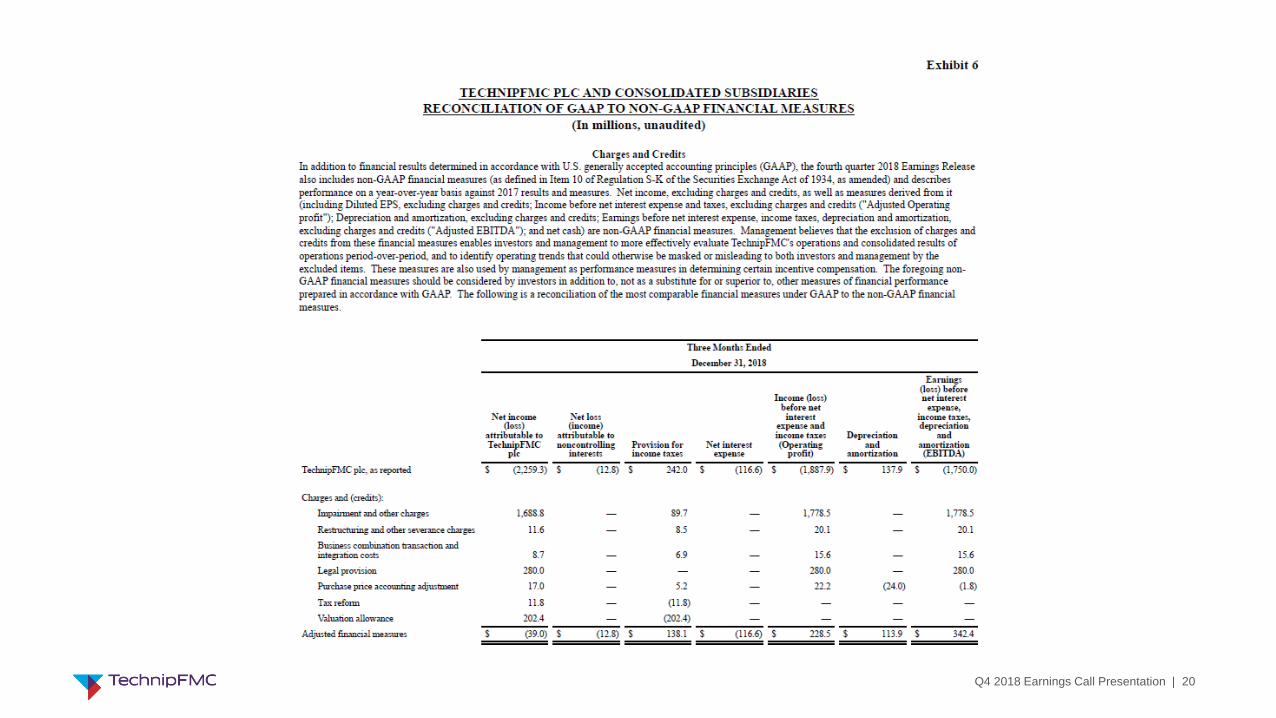
After-tax charges and (credits) of $2,220.3 million
Corporate expense of $90.3 million, excluding charges and
(credits); includes $38.7 million, or $0.05 per diluted share,
of net foreign exchange loss
Net interest expense of $116.6 million, including $108.8
million, or $0.24 per diluted share, related to liability
payable to joint venture partner
Depreciation and amortization expense
Reported: $137.9 million; adjusted: $113.9 million(1)
Purchase price accounting impact of $24 million
Q4 2018 Financial highlights
(1) Adjusted results exclude the impact of exceptional charges and credits from continuing operations as identified in the reconciliation of GAAP to non-GAAP financial measures schedules included in this presentation.
(2) Net cash is a non-GAAP financial measure reflecting cash and cash equivalents, net of debt, as identified in the reconciliation of GAAP to non-GAAP financial schedules included in this presentation.
Revenue
$3.3 billion
Adjusted EBITDA(1) $342 million$431 million from Subsea, Onshore/Offshore, Surface Technologies
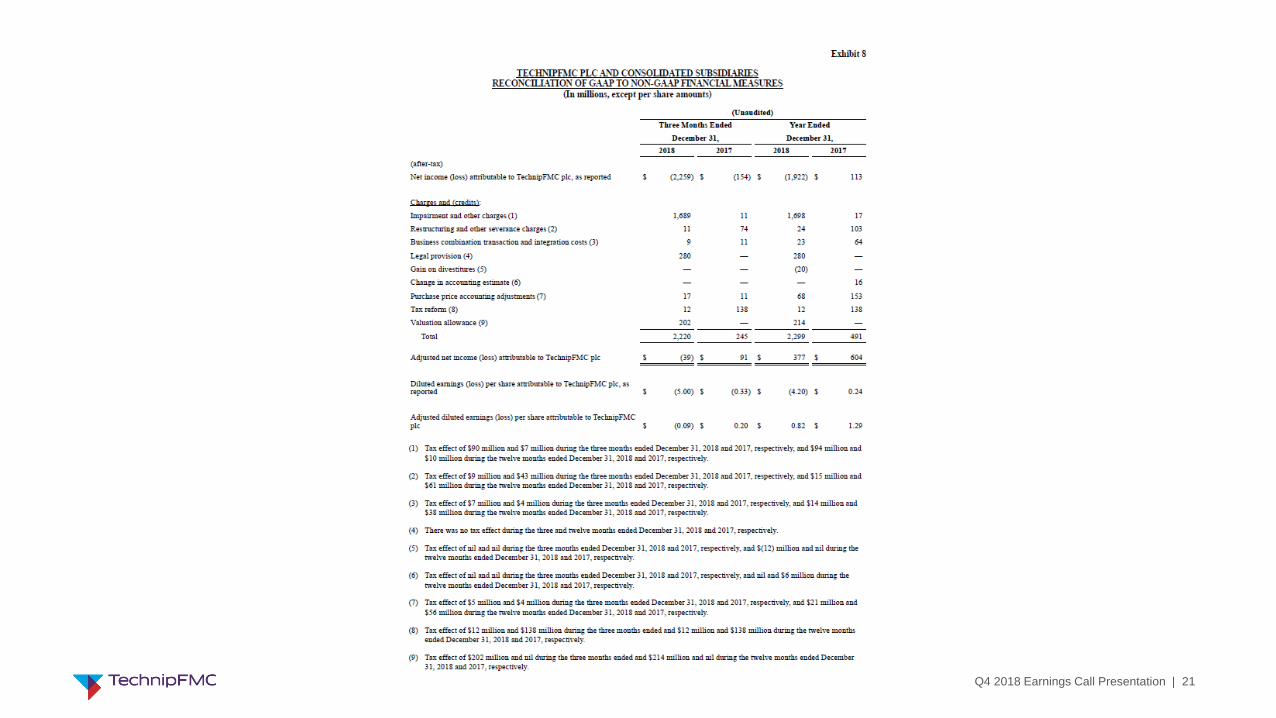
Adjusted Diluted EPS(1)
$(0.09)
Net Cash(2)
$1.3 billion
Backlog
$14.6 billion

Q4 2018 Earnings Call Presentation | 10
Improved operating cash flow; shareholder distributions increased
Cash & cash
equivalents at
Sep 30, 2018
Cash flow
from operating
activities
Dividends
paid
Share
repurchases
All other
(incl. FX)
Cash & cash
equivalents at
Dec 31, 2018
5,5405,553
Capex
(in $ millions)
Shareholder distributions
FY 2018 Operating cash flow
Positive operating cash flow in 2H 2018
▪ 2H 2018 $300 million, full-year $(185) million
Capital expenditures of $368 million
Shareholder distributions of $681 million
▪ Dividends of $238 million
▪ Share repurchase of $443 million
Cash payments to Yamal JV partners
▪ $226 million for mandatorily redeemable liability
FY 2018 items of note
4Q 2018 items of note
▪ Positive operating cash flow
▪ Capex funding for growth initiatives
▪ Shareholder distributions continue
4Q 2018 Cash flow walk
(in $ millions)
(202)
(284)
141159
1Q18 2Q18 3Q18 4Q18

Q4 2018 Earnings Call Presentation | 11
$350 million capex planned in 2019
Disciplined capital allocation strategy
$681 millionreturned to shareholders in 2018
Share buyback
Completed previous
$500 millionshare repurchase
Announced new
$300 million authorization Dec 2018
Dividend
Declared a Quarterlycash dividend of USD
$0.13 per share
2 3
Growth
$350 million capex in 2019
1
Reduced from prior guidance of $400 million
Growth initiatives
Fleet optimization (dive support vessel)
Local content capability
Brazil (spoolbase)
Saudi Arabia (manufacturing)
Subsea services
Tooling
Well intervention

Q4 2018 Earnings Call Presentation | 12
Summary
Q4 2018 – Solid conclusion to the year
Solid operating performance across segments despite headwinds in certain markets, notably North America
Major award for MIDOR refinery expansion; project to be inbound in first quarter 2019
Positive cash flow from operations; shareholder distributions continued
FY 2018 – Exceeding total Company objectives for the second consecutive year
Robust orders; full-year inbound of $14.3 billion, up 40 percent versus the prior year
Delivery of 3 iEPCI™ projects; early delivery of Yamal Trains 2 and 3
$500 million share repurchase program completed; additional $300 million authorized
FY 2019 – Capitalizing on improving outlook, particularly for Subsea and LNG
Segment guidance maintained; capital expenditure guidance reduced to $350 million in 2019
Encouraging Subsea inbound to date, including two iEPCI™ awards; integrated momentum building
Global LNG markets re-energized; with multiple prospects at play, selectivity will drive differentiation
* Major award is defined as $250 million or greater in value.

Q4 2018 Earnings Call Presentation | 13
Appendix

Q4 2018 Earnings Call Presentation | 14
20.4%
15.6%
Adjusted EBITDA margin
Q4 2018 Segment results
2,020
1,672
Revenue
4Q17 4Q18
1,2921,233
Revenue
4Q17 4Q18
18.9%
12.0%
Adjusted EBITDA margin
Subsea
-5%
USD, in millions
Operational Highlights
Revenue declined 5%: projects in Africa were completed or progressed towards completion, largely offset by increased activity in North America, Asia Pacific, and South America
Adjusted EBITDA margin declined 685 bps to 12%: primarily due to execution of more competitively priced backlog, partially offset by merger synergies and other cost reduction activities
Inbound orders of $880.6 million; book-to-bill of 0.7x; period-end backlog at $6.0 billion
14.6%
13.0%
Adjusted EBITDA margin
Onshore/Offshore Surface Technologies
Operational Highlights
Revenue declined 17%: moved closer to completion on major projects, primarily Yamal LNG
Adjusted EBITDA margin decreased 160 bps to 13%: due to revenue decline and shift in revenue mix to lower margin work; offset by strong project execution on Yamal LNG, also benefitting from bonus for completion of further milestones, including Train 3
Inbound orders of $1.6 billion; book-to-bill of 1.0x; period-end backlog at $8.1 billion
Operational Highlights
Revenue increased 12%: increased drilling activity and market share gains in North America drove wellhead product sales and fracrental assets higher; international growth driven by pressure control sales and services
Adjusted EBITDA margin decreased 481 bps to 15.6%: primarily due to decline in flowline product sales resulting from lower completions activity in North America
Inbound orders of $435.1 million; book-to-bill of 1.1x; period-end backlog at $469.9 million
USD, in millions USD, in millions
-685 bps -17% -160 bps +12% -481 bps
372
417
Revenue
4Q17 4Q18
Q4 2018 Earnings Call Presentation | 15
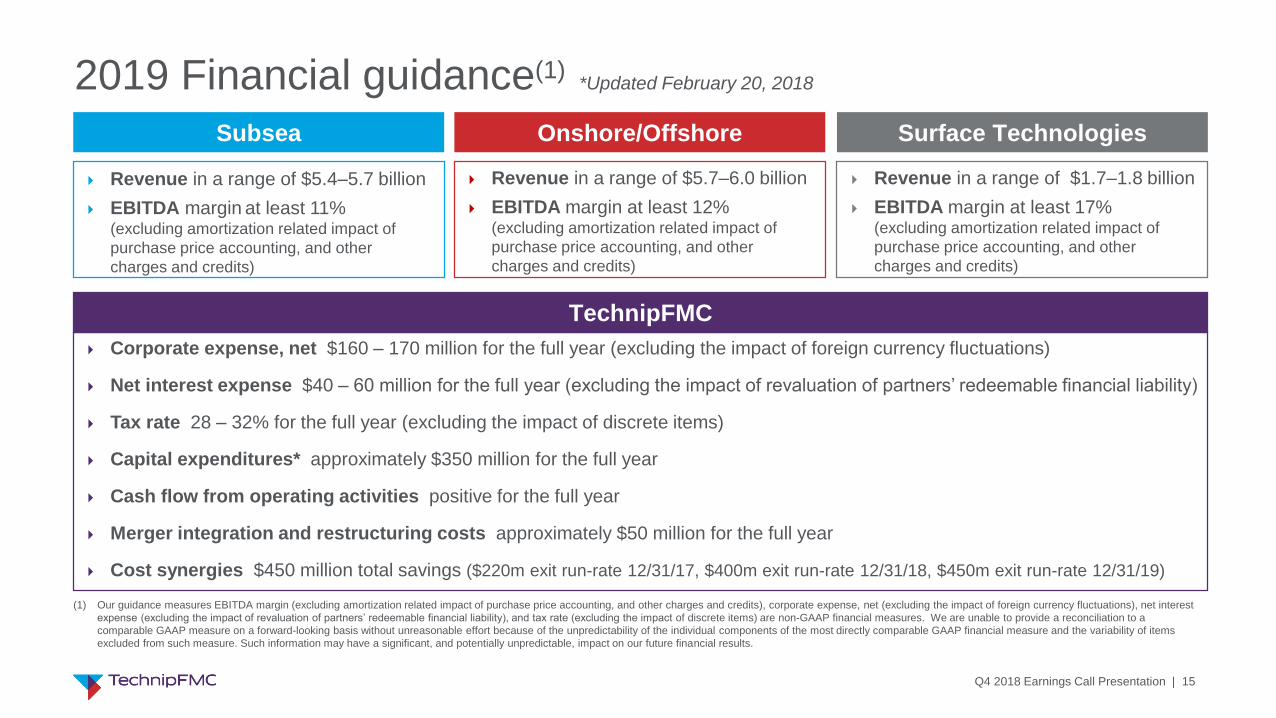
Revenue in a range of $1.7–1.8 billion
EBITDA margin at least 17% (excluding amortization related impact of
purchase price accounting, and other
charges and credits)
Revenue in a range of $5.4–5.7 billion
EBITDA margin at least 11%(excluding amortization related impact of
purchase price accounting, and other
charges and credits)
Subsea Onshore/Offshore Surface Technologies
Revenue in a range of $5.7–6.0 billion
EBITDA margin at least 12% (excluding amortization related impact of
purchase price accounting, and other
charges and credits)
Corporate expense, net $160 – 170 million for the full year (excluding the impact of foreign currency fluctuations)
Net interest expense $40 – 60 million for the full year (excluding the impact of revaluation of partners’ redeemable financial liability)
Tax rate 28 – 32% for the full year (excluding the impact of discrete items)
Capital expenditures* approximately $350 million for the full year
Cash flow from operating activities positive for the full year
Merger integration and restructuring costs approximately $50 million for the full year
Cost synergies $450 million total savings ($220m exit run-rate 12/31/17, $400m exit run-rate 12/31/18, $450m exit run-rate 12/31/19)
TechnipFMC
(1) Our guidance measures EBITDA margin (excluding amortization related impact of purchase price accounting, and other charges and credits), corporate expense, net (excluding the impact of foreign currency fluctuations), net interest
expense (excluding the impact of revaluation of partners’ redeemable financial liability), and tax rate (excluding the impact of discrete items) are non-GAAP financial measures. We are unable to provide a reconciliation to a
comparable GAAP measure on a forward-looking basis without unreasonable effort because of the unpredictability of the individual components of the most directly comparable GAAP financial measure and the variability of items
excluded from such measure. Such information may have a significant, and potentially unpredictable, impact on our future financial results.
2019 Financial guidance(1) *Updated February 20, 2018
Q4 2018 Earnings Call Presentation | 16
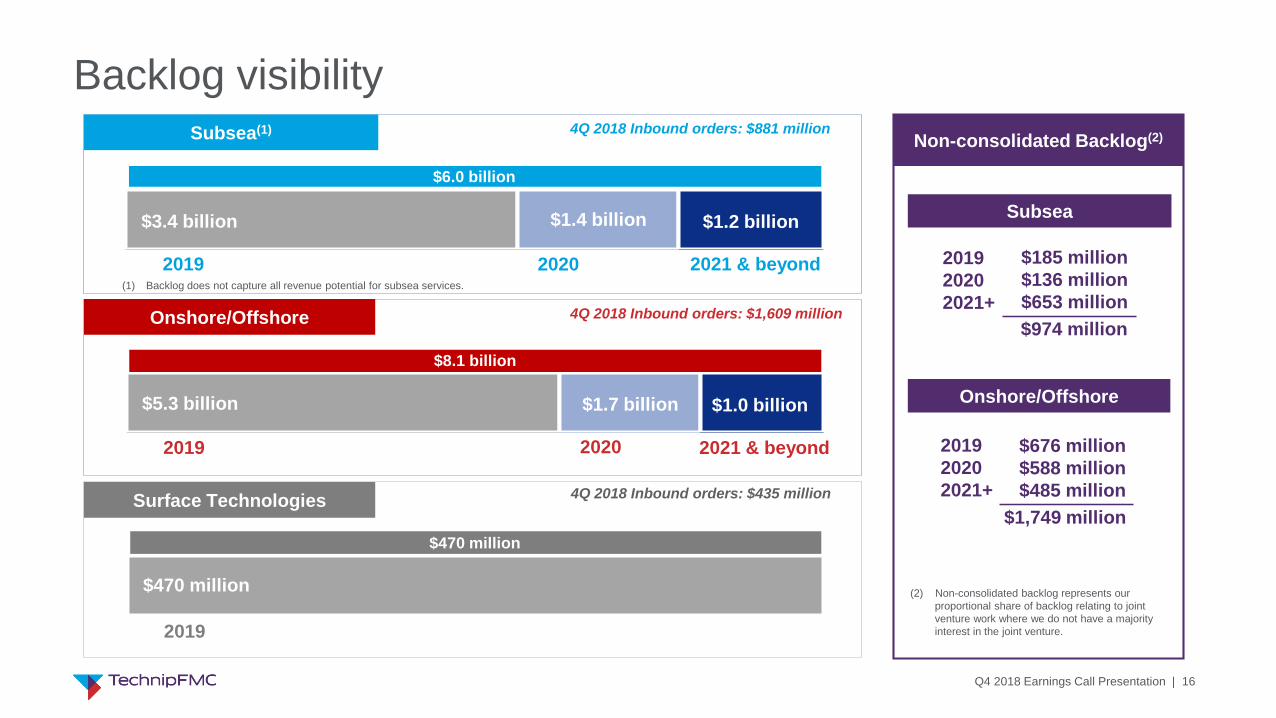
$185 million
$136 million
$653 million
$676 million
$588 million
$485 million
Subsea(1)
$6.0 billion
$3.4 billion $1.4 billion $1.2 billion
2021 & beyond2020
Onshore/Offshore
$8.1 billion
2019 2021 & beyond2020
4Q 2018 Inbound orders: $881 million
4Q 2018 Inbound orders: $1,609 million
Surface Technologies
2019
$5.3 billion $1.7 billion $1.0 billion
2019
4Q 2018 Inbound orders: $435 million
$470 million
Subsea
Onshore/Offshore
2019
2020
2021+
$974 million
2019
2020
2021+
$1,749 million
Non-consolidated Backlog(2)
(2) Non-consolidated backlog represents our
proportional share of backlog relating to joint
venture work where we do not have a majority
interest in the joint venture.
(1) Backlog does not capture all revenue potential for subsea services.
Backlog visibility
$470 million
Q4 2018 Earnings Call Presentation | 17
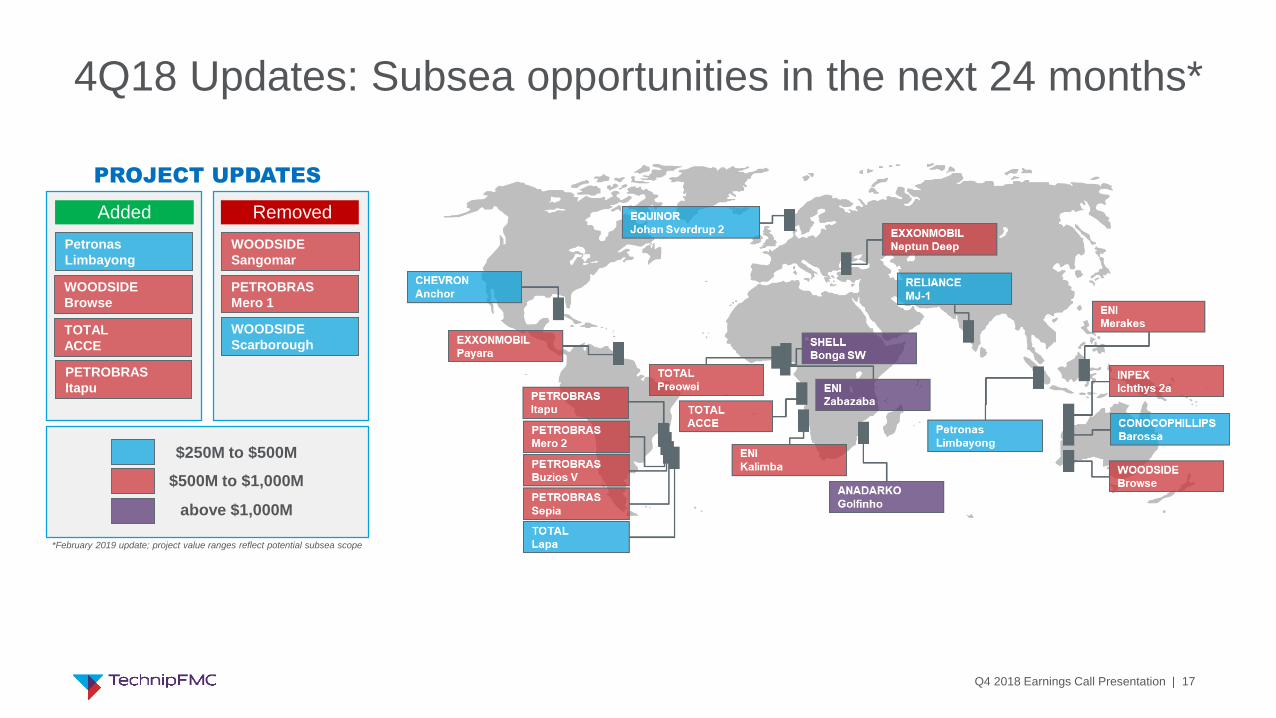
4Q18 Updates: Subsea opportunities in the next 24 months*
Added
PROJECT UPDATES
Removed
WOODSIDE
Scarborough
$250M to $500M
$500M to $1,000M
above $1,000M
*February 2019 update; project value ranges reflect potential subsea scope
WOODSIDE
Sangomar
PETROBRAS
Mero 1
WOODSIDE
Browse
Petronas
Limbayong
TOTAL
ACCE
PETROBRAS
Itapu
Q4 2018 Earnings Call Presentation | 18
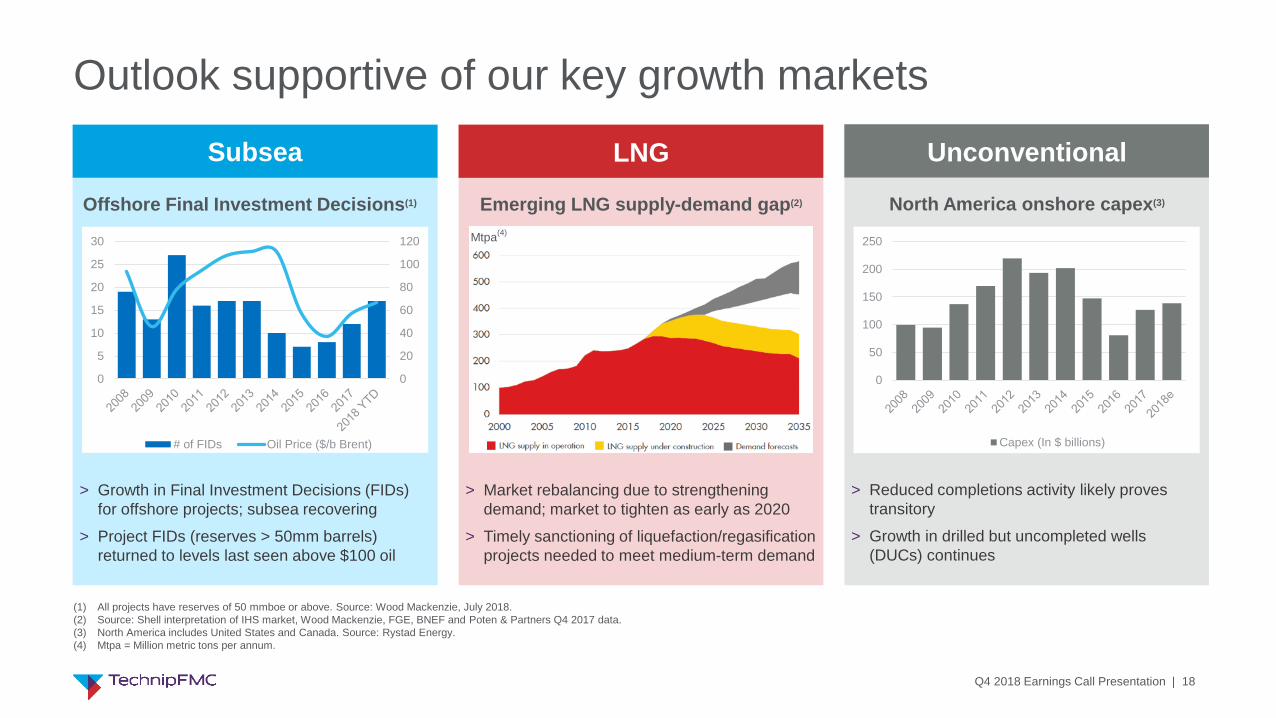
Subsea LNG
Outlook supportive of our key growth markets
0
20
40
60
80
100
120
0
5
10
15
20
25
30
# of FIDs Oil Price ($/b Brent)
Offshore Final Investment Decisions(1)
> Growth in Final Investment Decisions (FIDs)
for offshore projects; subsea recovering
> Project FIDs (reserves > 50mm barrels)
returned to levels last seen above $100 oil
> Market rebalancing due to strengthening
demand; market to tighten as early as 2020
> Timely sanctioning of liquefaction/regasification
projects needed to meet medium-term demand
Emerging LNG supply-demand gap(2)
Unconventional
> Reduced completions activity likely proves
transitory
> Growth in drilled but uncompleted wells
(DUCs) continues
North America onshore capex(3)
0
50
100
150
200
250
Capex (In $ billions)
(1) All projects have reserves of 50 mmboe or above. Source: Wood Mackenzie, July 2018.
(2) Source: Shell interpretation of IHS market, Wood Mackenzie, FGE, BNEF and Poten & Partners Q4 2017 data.
(3) North America includes United States and Canada. Source: Rystad Energy.
(4) Mtpa = Million metric tons per annum.
Mtpa(4)
Q4 2018 Earnings Call Presentation | 19
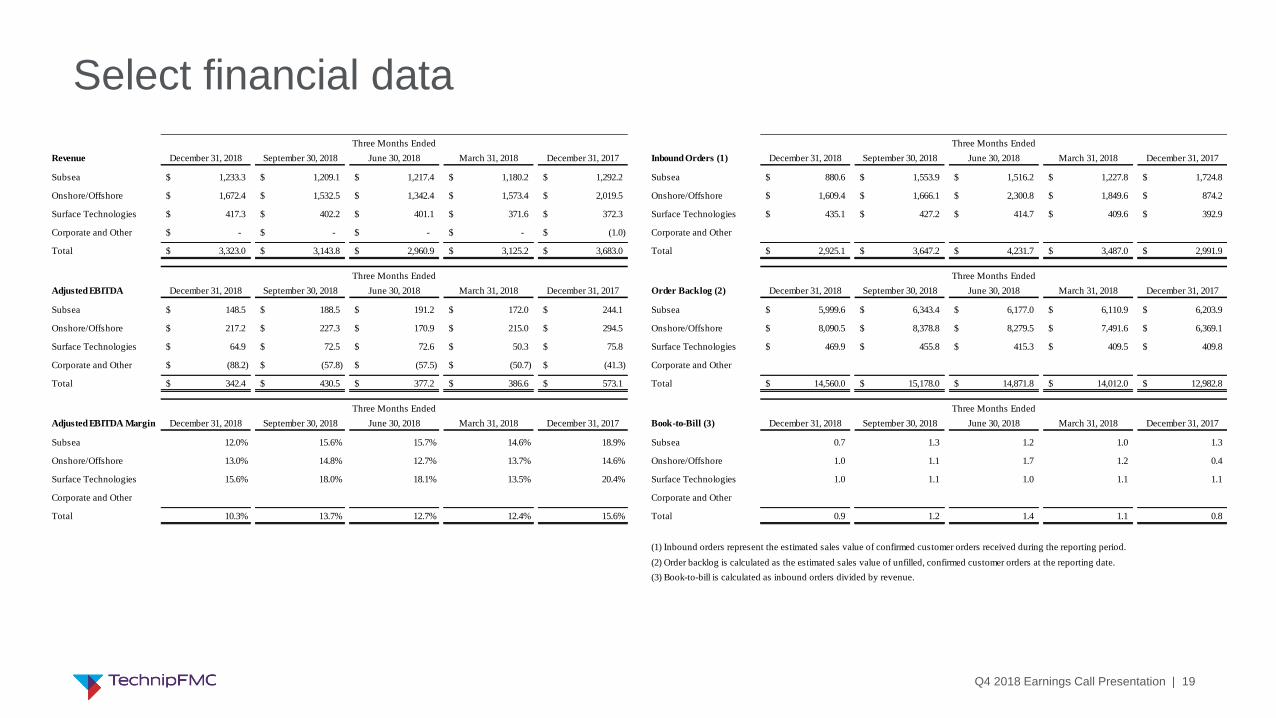
Select financial data
Revenue December 31, 2018 September 30, 2018 June 30, 2018 March 31, 2018 December 31, 2017 Inbound Orders (1) December 31, 2018 September 30, 2018 June 30, 2018 March 31, 2018 December 31, 2017
Subsea 1,233.3$ 1,209.1$ 1,217.4$ 1,180.2$ 1,292.2$ Subsea 880.6$ 1,553.9$ 1,516.2$ 1,227.8$ 1,724.8$
Onshore/Offshore 1,672.4$ 1,532.5$ 1,342.4$ 1,573.4$ 2,019.5$ Onshore/Offshore 1,609.4$ 1,666.1$ 2,300.8$ 1,849.6$ 874.2$
Surface Technologies 417.3$ 402.2$ 401.1$ 371.6$ 372.3$ Surface Technologies 435.1$ 427.2$ 414.7$ 409.6$ 392.9$
Corporate and Other -$ -$ -$ -$ (1.0)$ Corporate and Other
Total 3,323.0$ 3,143.8$ 2,960.9$ 3,125.2$ 3,683.0$ Total 2,925.1$ 3,647.2$ 4,231.7$ 3,487.0$ 2,991.9$
Adjusted EBITDA December 31, 2018 September 30, 2018 June 30, 2018 March 31, 2018 December 31, 2017 Order Backlog (2) December 31, 2018 September 30, 2018 June 30, 2018 March 31, 2018 December 31, 2017
Subsea 148.5$ 188.5$ 191.2$ 172.0$ 244.1$ Subsea 5,999.6$ 6,343.4$ 6,177.0$ 6,110.9$ 6,203.9$
Onshore/Offshore 217.2$ 227.3$ 170.9$ 215.0$ 294.5$ Onshore/Offshore 8,090.5$ 8,378.8$ 8,279.5$ 7,491.6$ 6,369.1$
Surface Technologies 64.9$ 72.5$ 72.6$ 50.3$ 75.8$ Surface Technologies 469.9$ 455.8$ 415.3$ 409.5$ 409.8$
Corporate and Other (88.2)$ (57.8)$ (57.5)$ (50.7)$ (41.3)$ Corporate and Other
Total 342.4$ 430.5$ 377.2$ 386.6$ 573.1$ Total 14,560.0$ 15,178.0$ 14,871.8$ 14,012.0$ 12,982.8$
Adjusted EBITDA Margin December 31, 2018 September 30, 2018 June 30, 2018 March 31, 2018 December 31, 2017 Book-to-Bill (3) December 31, 2018 September 30, 2018 June 30, 2018 March 31, 2018 December 31, 2017
Subsea 12.0% 15.6% 15.7% 14.6% 18.9% Subsea 0.7 1.3 1.2 1.0 1.3
Onshore/Offshore 13.0% 14.8% 12.7% 13.7% 14.6% Onshore/Offshore 1.0 1.1 1.7 1.2 0.4
Surface Technologies 15.6% 18.0% 18.1% 13.5% 20.4% Surface Technologies 1.0 1.1 1.0 1.1 1.1
Corporate and Other Corporate and Other
Total 10.3% 13.7% 12.7% 12.4% 15.6% Total 0.9 1.2 1.4 1.1 0.8
(1) Inbound orders represent the estimated sales value of confirmed customer orders received during the reporting period.
(2) Order backlog is calculated as the estimated sales value of unfilled, confirmed customer orders at the reporting date.
(3) Book-to-bill is calculated as inbound orders divided by revenue.
Three Months Ended
Three Months Ended
Three Months Ended
Three Months Ended
Three Months Ended
Three Months Ended
Q4 2018 Earnings Call Presentation | 20
Q4 2018 Earnings Call Presentation | 21

Q4 2018 Earnings Call Presentation | 22

Q4 2018 Earnings Call Presentation | 23

Q4 2018 Earnings Call Presentation | 24