Embed Size (px)
Citation preview

Q2 2021 Management PresentationAugust, 2021

IMPORTANT INFORMATION
Cautionary Statement Regarding Forward-Looking Statements
This presentation (this “Presentation”) contains forward-looking statements within the meaning of the federal securities laws, including statements regarding the financial position, business strategy, and the plans and objectives of management for future operations of MarketWise, Inc. (the
“Company,” “we,” “us,” or “our”). These forward-looking statements generally are identified by the words “believe,” “project,” “expect,” “anticipate,” “estimate,” “intend,” “strategy,” “future,” “opportunity,” “plan,” “may,” “should,” “will,” “would,” “will be,” “will continue,” “will
likely result,” and similar expressions, but the absence of these words does not mean that a statement is not forward-looking. Forward-looking statements are predictions, projections, and other statements about future events that are based on current expectations and assumptions and, as
a result, are subject to risks and uncertainties. Many factors could cause actual future events to differ materially from the forward-looking statements in this Presentation, including, but not limited to: our ability to attract new subscribers and to persuade existing subscribers to renew their
subscription agreements with us and to purchase additional products and services from us; our ability to adequately market our products and services, and to develop additional products and product offerings; our ability to manage our growth effectively, including through
acquisitions; failure to maintain and protect our reputation for trustworthiness and independence; our ability to attract, develop, and retain capable management, editors, and other key personnel; our ability to grow market share in our existing markets or any new markets we may enter;
adverse or weakened conditions in the financial sector, global financial markets, and global economy; our ability to respond to and adapt to changes in technology and consumer behavior; failure to successfully identify and integrate acquisitions, or dispose of assets and businesses; our public
securities’ potential liquidity and trading; the impact of the regulatory environment and complexities with compliance related to such environment; the impact of the COVID-19 pandemic; our future capital needs; our ability to maintain an effective system of internal control over financial
reporting, and to address and remediate existing material weaknesses in our internal control over financial reporting; our ability to maintain and protect our intellectual property; and other factors beyond our control.
The foregoing list of factors is not exhaustive. You should carefully consider the foregoing factors and the other risks and uncertainties described in the “Risk Factors” section of our Quarterly Reports on Form 10-Q, Annual Reports on Form 10-K, the registration statement on Form S-4 and
proxy statement/prospectus filed with the U.S. Securities and Exchange Commission (the “SEC”) and other documents filed by us from time to time with the SEC. These filings identify and address other important risks and uncertainties that could cause actual events and results to differ
materially from those contained in the forward-looking statements. New risks emerge from time to time. It is not possible for our management to predict all risks, nor can we assess the impact of all factors on our business or the extent to which any factor, or combination of factors, may
cause actual results to differ materially from those contained in any forward-looking statements we may make. In light of these risks, uncertainties and assumptions, the forward-looking events and circumstances discussed in this Presentation may not occur and actual results could differ
materially and adversely from those anticipated.
Forward-looking statements speak only as of the date they are made. You are cautioned not to put undue reliance on forward-looking statements, and we assume no obligation and do not intend to update or revise these forward-looking statements, whether as a result of new information,
future events or otherwise. We do not give any assurance that we will achieve our expectations.
Financial Information; Non-GAAP Financial Measures
The financial information and data contained in this Presentation is unaudited and does not conform to Regulation S-X
This Presentation also includes certain financial measures not presented in accordance with generally accepted accounting principles (“GAAP”) including, but not limited to, Adjusted CFFO, Adjusted CFFO Conversion, Adjusted Free Cash Flow, and Adjusted Free Cash Flow Margin and certain
ratios and other metrics derived therefrom. The Company defines Adjusted CFFO as net cash provided by operating activities plus profits distributions to Class B unitholders included in stock-based compensation. The Company defines Adjusted Free Cash Flow as Adjusted CFFO minus capital
expenditures The Company defines Adjusted CFFO Conversion as Adjusted Free Cash Flow divided by Adjusted CFFO.. The Company defines Adjusted Free Cash Flow Margin as Adjusted Free Cash Flow divided by Billings (i.e., amounts invoiced to customers). These financial measures are not
measures of financial performance in accordance with GAAP and may exclude items that are significant in understanding and assessing the Company’s financial results. Therefore, these measures should not be considered in isolation or as an alternative to net income, cash flows from operations
or other measures of profitability, liquidity or performance under GAAP. You should be aware that the Company’s presentation of these measures may not be comparable to similarly-titled measures used by other companies.
The Company believes these non-GAAP measures of financial results provide useful information to management and investors regarding certain financial and business trends relating to the Company’s financial condition and results of operations. The Company believes that the use of these non-
GAAP financial measures provides an additional tool for investors to use in evaluating ongoing operating results and trends in and in comparing the Company’s financial measures with other similar companies, many of which present similar non-GAAP financial measures to investors. These non-
GAAP financial measures are subject to inherent limitations as they reflect the exercise of judgments by management about which expense and income are excluded or included in determining these non-GAAP financial measures. For a reconciliation of these non-GAAP figures to the nearest
measure determined under GAAP, please see the appendix to this Presentation.
This Presentation also includes certain projections of non-GAAP financial measures. Due to the high variability and difficulty in making accurate forecasts and projections of some of the information excluded from these projected measures, together with some of the excluded information not
being ascertainable or accessible, the Company is unable to quantify certain amounts that would be required to be included in the most directly comparable GAAP financial measures without unreasonable effort. Consequently, no disclosure of estimated comparable GAAP measures is included
and no reconciliation of the forward-looking non-GAAP financial measures is included.
Industry and Market Data
In this Presentation, the Company rely on and refer to certain information and statistics obtained from third-party sources which they believe to be reliable. The Company has not independently verified the accuracy or completeness of any such third-party information.
2

3
MANAGEMENT
MARCO
GALSIM
CIO
DALE
LYNCH
CFO
MARK
ARNOLD
CEO &
Chairman
MarketWise
GARY
ANDERSON
General
Counsel
CYNTHIA
CHERRY
Sr.
Director of
Human
Resources
MARCO
FERRI
Director of
Business
Development
4
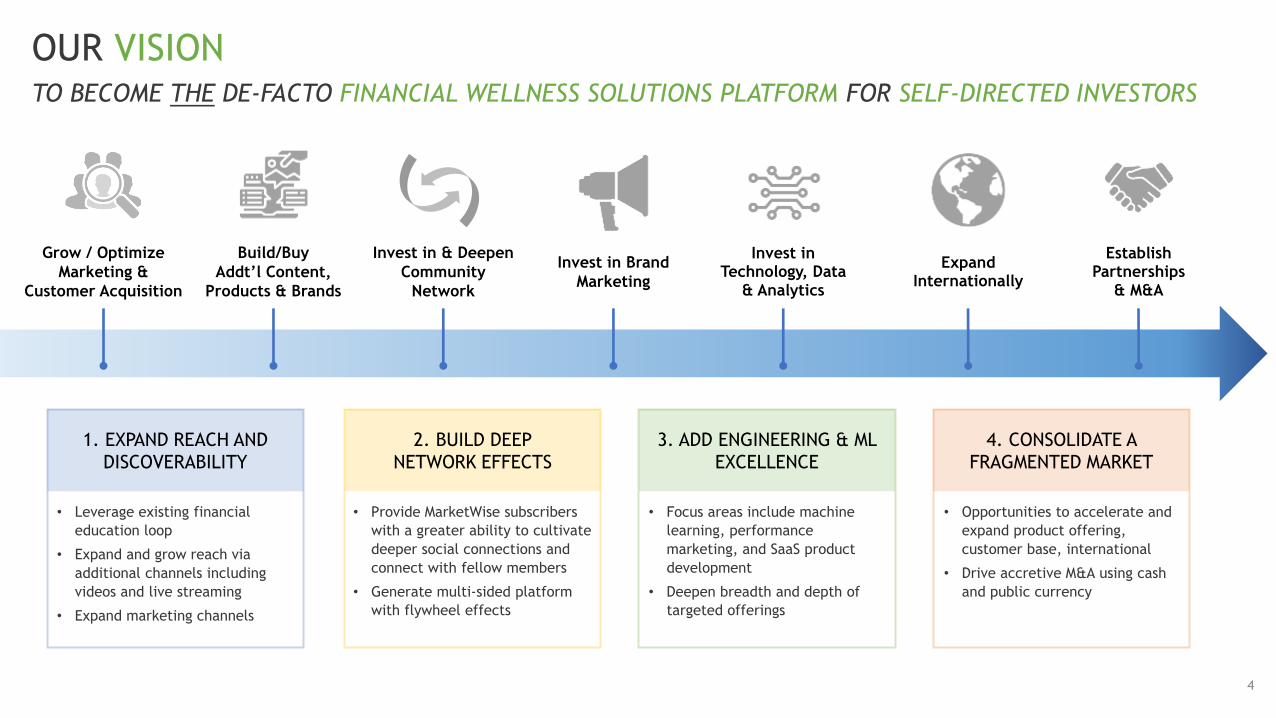
OUR VISIONTO BECOME THE DE-FACTO FINANCIAL WELLNESS SOLUTIONS PLATFORM FOR SELF-DIRECTED INVESTORS
Grow / Optimize
Marketing &
Customer Acquisition
Invest in Brand
Marketing
Build/Buy
Addt’l Content,
Products & Brands
Invest in Technology, Data
& Analytics
Establish Partnerships
& M&A
• Leverage existing financial
education loop
• Expand and grow reach via
additional channels including
videos and live streaming
• Expand marketing channels
• Provide MarketWise subscribers
with a greater ability to cultivate
deeper social connections and
connect with fellow members
• Generate multi-sided platform
with flywheel effects
• Focus areas include machine
learning, performance
marketing, and SaaS product
development
• Deepen breadth and depth of
targeted offerings
• Opportunities to accelerate and
expand product offering,
customer base, international
• Drive accretive M&A using cash
and public currency
4. CONSOLIDATE A
FRAGMENTED MARKET
3. ADD ENGINEERING & ML
EXCELLENCE
2. BUILD DEEP
NETWORK EFFECTS
1. EXPAND REACH AND
DISCOVERABILITY
ExpandInternationally
Invest in & Deepen
Community
Network
5
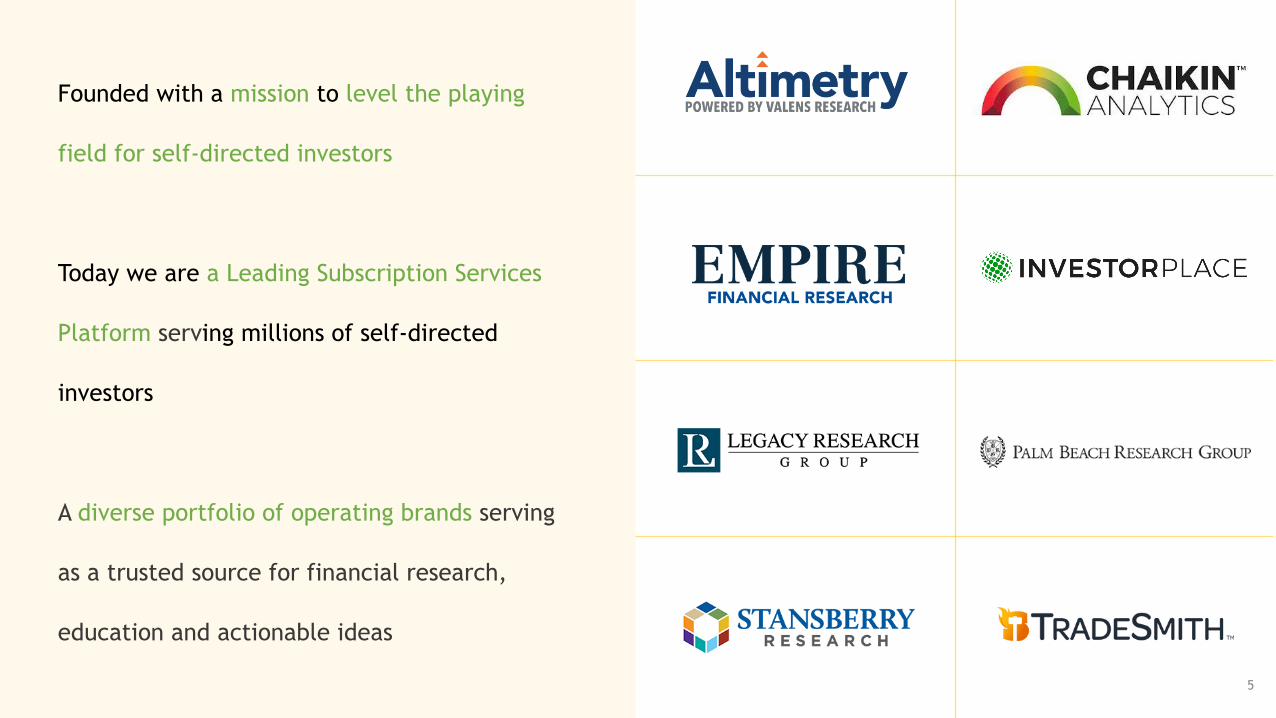
Founded with a mission to level the playing
field for self-directed investors
Today we are a Leading Subscription Services
Platform serving millions of self-directed
investors
A diverse portfolio of operating brands serving
as a trusted source for financial research,
education and actionable ideas
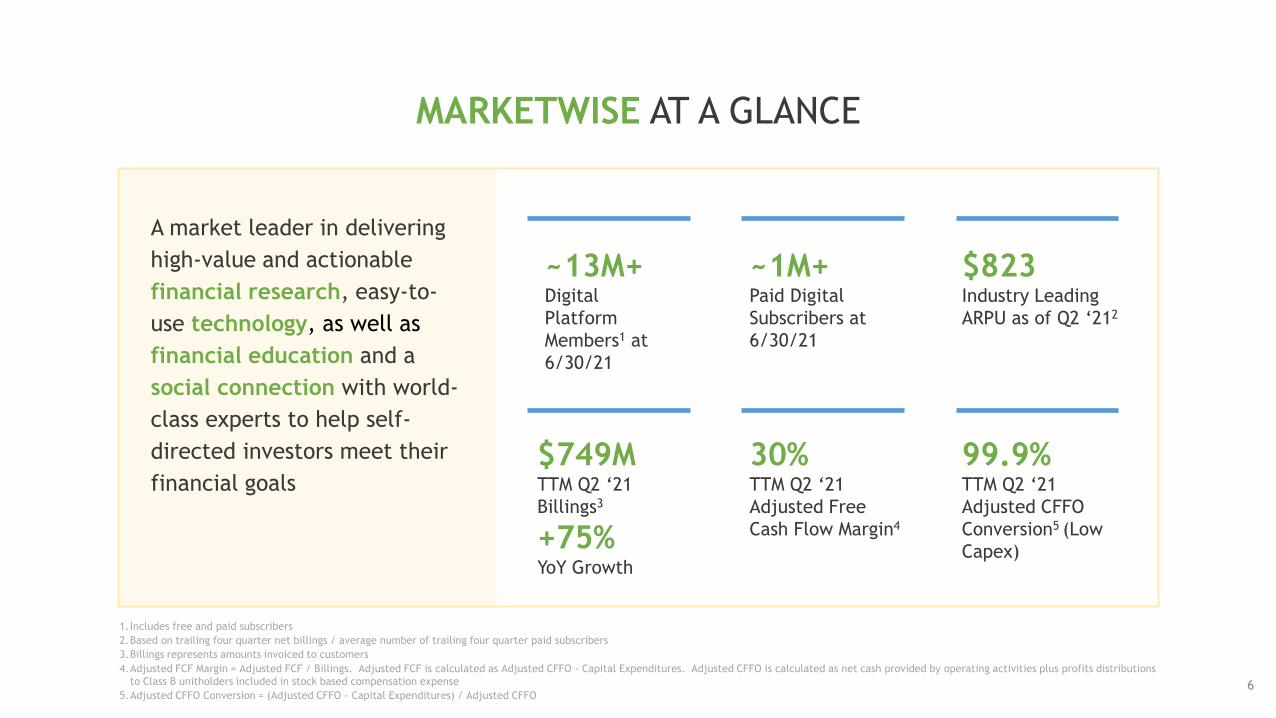
MARKETWISE AT A GLANCE
6
A market leader in delivering
high-value and actionable
financial research, easy-to-
use technology, as well as
financial education and a
social connection with world-
class experts to help self-
directed investors meet their
financial goals
~13M+Digital
Platform
Members1 at
6/30/21
~1M+Paid Digital
Subscribers at
6/30/21
$823Industry Leading
ARPU as of Q2 ‘212
$749MTTM Q2 ‘21
Billings3
+75%YoY Growth
30%TTM Q2 ‘21
Adjusted Free
Cash Flow Margin4
99.9%TTM Q2 ‘21
Adjusted CFFO
Conversion5 (Low
Capex)
1.Includes free and paid subscribers
2.Based on trailing four quarter net billings / average number of trailing four quarter paid subscribers
3.Billings represents amounts invoiced to customers
4.Adjusted FCF Margin = Adjusted FCF / Billings. Adjusted FCF is calculated as Adjusted CFFO - Capital Expenditures. Adjusted CFFO is calculated as net cash provided by operating activities plus profits distributions
to Class B unitholders included in stock based compensation expense
5.Adjusted CFFO Conversion = (Adjusted CFFO - Capital Expenditures) / Adjusted CFFO
7
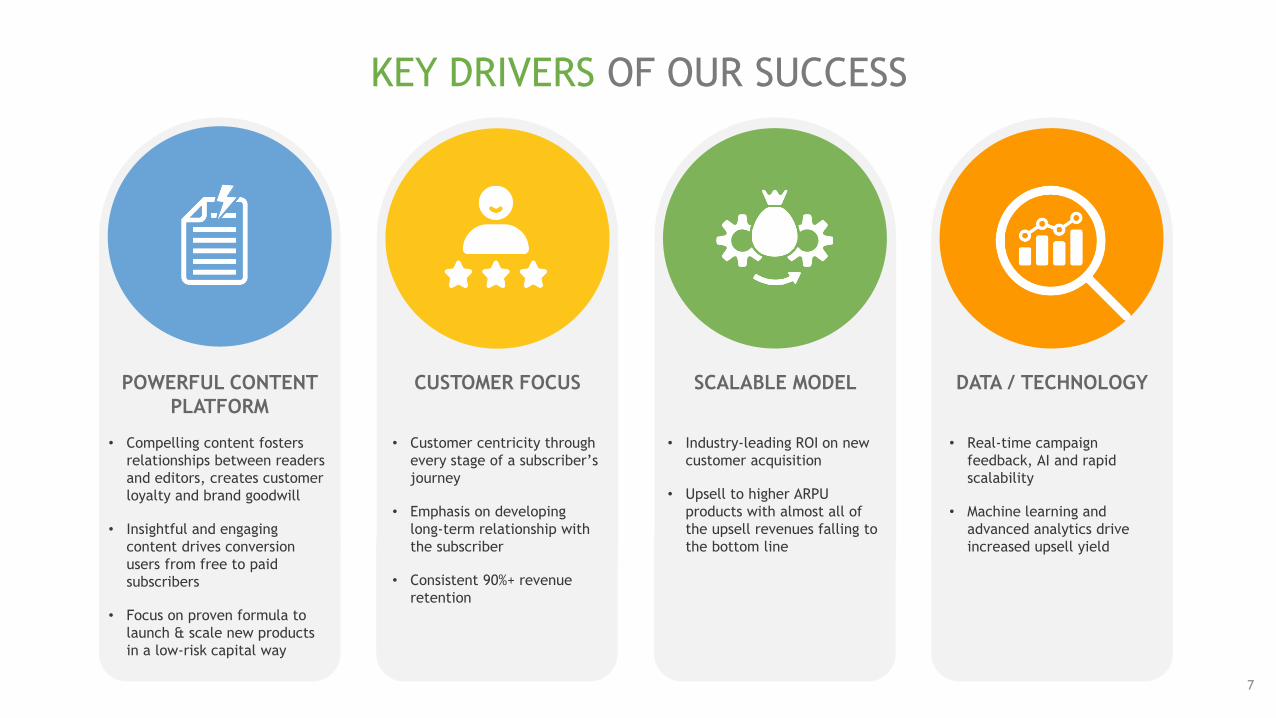
KEY DRIVERS OF OUR SUCCESS
DATA / TECHNOLOGY
• Real-time campaign
feedback, AI and rapid
scalability
• Machine learning and
advanced analytics drive
increased upsell yield
SCALABLE MODEL
• Industry-leading ROI on new
customer acquisition
• Upsell to higher ARPU
products with almost all of
the upsell revenues falling to
the bottom line
CUSTOMER FOCUS
• Customer centricity through
every stage of a subscriber’s
journey
• Emphasis on developing
long-term relationship with
the subscriber
• Consistent 90%+ revenue
retention
POWERFUL CONTENT
PLATFORM
• Compelling content fosters
relationships between readers
and editors, creates customer
loyalty and brand goodwill
• Insightful and engaging
content drives conversion
users from free to paid
subscribers
• Focus on proven formula to
launch & scale new products
in a low-risk capital way
8
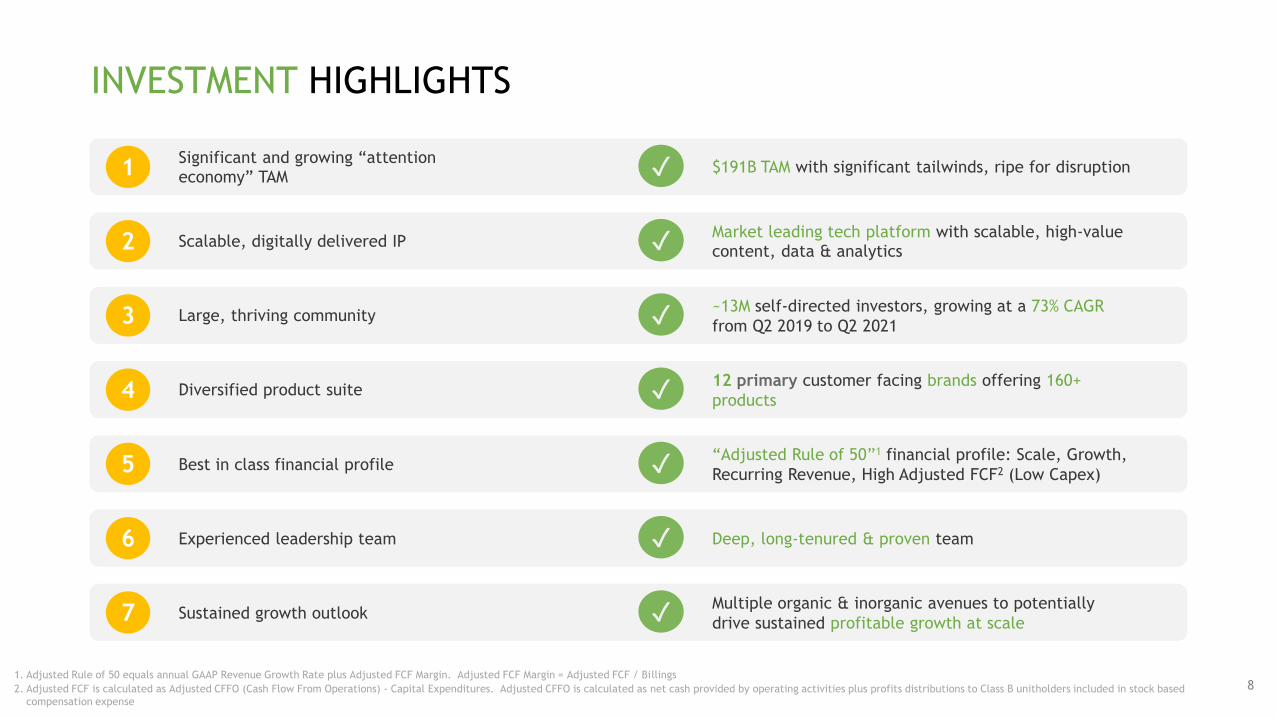
INVESTMENT HIGHLIGHTS
1 ✓Significant and growing “attention economy” TAM
$191B TAM with significant tailwinds, ripe for disruption
2 ✓Scalable, digitally delivered IPMarket leading tech platform with scalable, high-value content, data & analytics
3 ✓Large, thriving community~13M self-directed investors, growing at a 73% CAGR
from Q2 2019 to Q2 2021
4 ✓Diversified product suite12 primary customer facing brands offering 160+
products
5 ✓Best in class financial profile“Adjusted Rule of 50”1 financial profile: Scale, Growth,
Recurring Revenue, High Adjusted FCF2 (Low Capex)
6 ✓Experienced leadership team Deep, long-tenured & proven team
7 ✓Sustained growth outlookMultiple organic & inorganic avenues to potentially
drive sustained profitable growth at scale
1. Adjusted Rule of 50 equals annual GAAP Revenue Growth Rate plus Adjusted FCF Margin. Adjusted FCF Margin = Adjusted FCF / Billings
2. Adjusted FCF is calculated as Adjusted CFFO (Cash Flow From Operations) - Capital Expenditures. Adjusted CFFO is calculated as net cash provided by operating activities plus profits distributions to Class B unitholders included in stock based
compensation expense
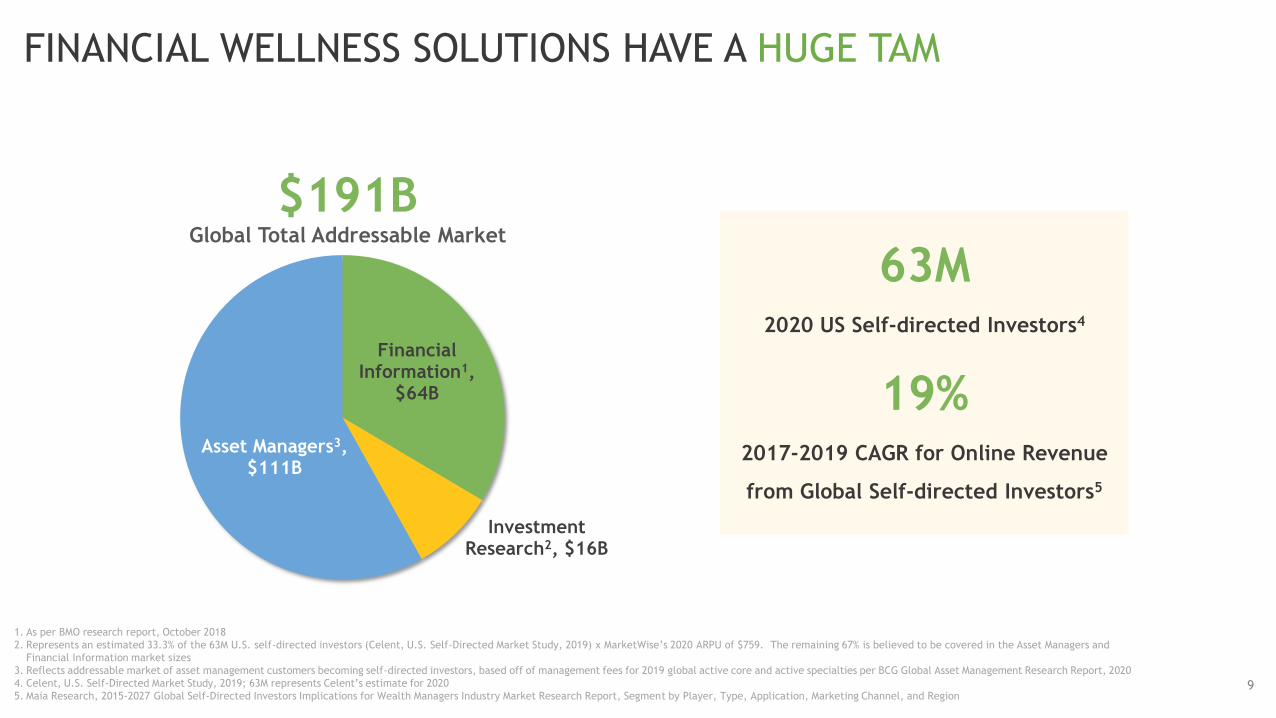
Financial Information1,
$64B
Investment Research2, $16B
Asset Managers3, $111B
$191B Global Total Addressable Market
9
1. As per BMO research report, October 2018
2. Represents an estimated 33.3% of the 63M U.S. self-directed investors (Celent, U.S. Self-Directed Market Study, 2019) x MarketWise’s 2020 ARPU of $759. The remaining 67% is believed to be covered in the Asset Managers and
Financial Information market sizes
3. Reflects addressable market of asset management customers becoming self-directed investors, based off of management fees for 2019 global active core and active specialties per BCG Global Asset Management Research Report, 2020
4. Celent, U.S. Self-Directed Market Study, 2019; 63M represents Celent’s estimate for 2020
5. Maia Research, 2015-2027 Global Self-Directed Investors Implications for Wealth Managers Industry Market Research Report, Segment by Player, Type, Application, Marketing Channel, and Region
FINANCIAL WELLNESS SOLUTIONS HAVE A HUGE TAM
63M2020 US Self-directed Investors4
19%2017-2019 CAGR for Online Revenue
from Global Self-directed Investors5
10
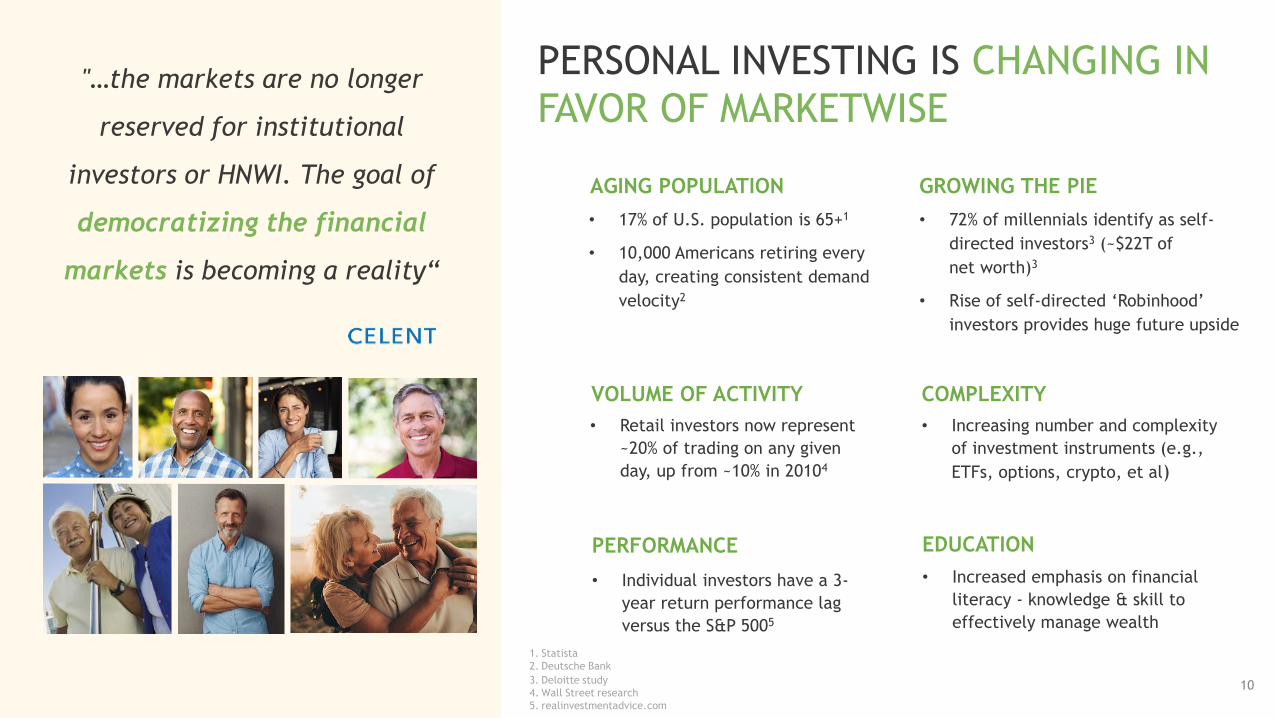
PERSONAL INVESTING IS CHANGING IN
FAVOR OF MARKETWISE
AGING POPULATION
• 17% of U.S. population is 65+1
• 10,000 Americans retiring every
day, creating consistent demand
velocity2
GROWING THE PIE
• 72% of millennials identify as self-
directed investors3 (~$22T of
net worth)3
• Rise of self-directed ‘Robinhood’
investors provides huge future upside
PERFORMANCE
• Individual investors have a 3-
year return performance lag
versus the S&P 5005
EDUCATION
• Increased emphasis on financial
literacy - knowledge & skill to
effectively manage wealth
VOLUME OF ACTIVITY
• Retail investors now represent
~20% of trading on any given
day, up from ~10% in 20104
COMPLEXITY
• Increasing number and complexity
of investment instruments (e.g.,
ETFs, options, crypto, et al)
"…the markets are no longer
reserved for institutional
investors or HNWI. The goal of
democratizing the financial
markets is becoming a reality“
1. Statista
2. Deutsche Bank
3. Deloitte study
4. Wall Street research
5. realinvestmentadvice.com
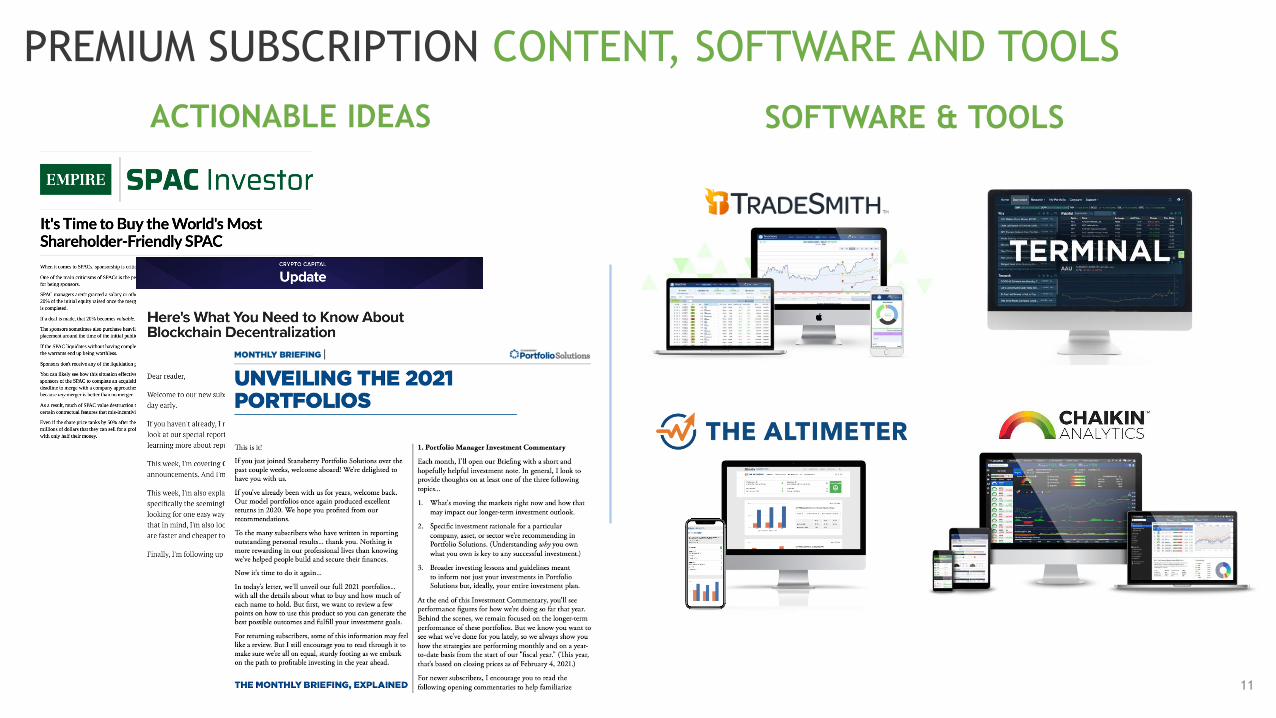
PREMIUM SUBSCRIPTION CONTENT, SOFTWARE AND TOOLS
ACTIONABLE IDEAS SOFTWARE & TOOLS
11
12
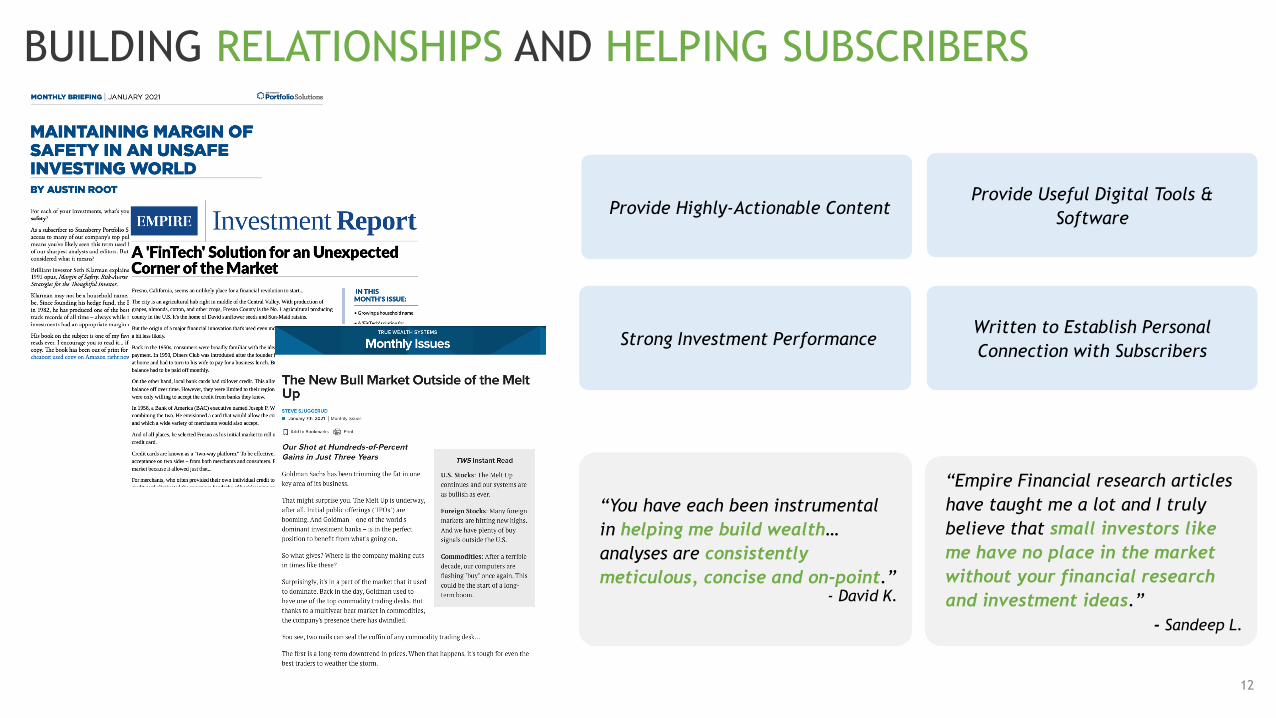
BUILDING RELATIONSHIPS AND HELPING SUBSCRIBERS
Provide Useful Digital Tools &
SoftwareProvide Highly-Actionable Content
Strong Investment Performance
“Empire Financial research articles
have taught me a lot and I truly
believe that small investors like
me have no place in the market
without your financial research
and investment ideas.”
- Sandeep L.
“You have each been instrumental
in helping me build wealth…
analyses are consistently
meticulous, concise and on-point.” - David K.
Written to Establish Personal
Connection with Subscribers
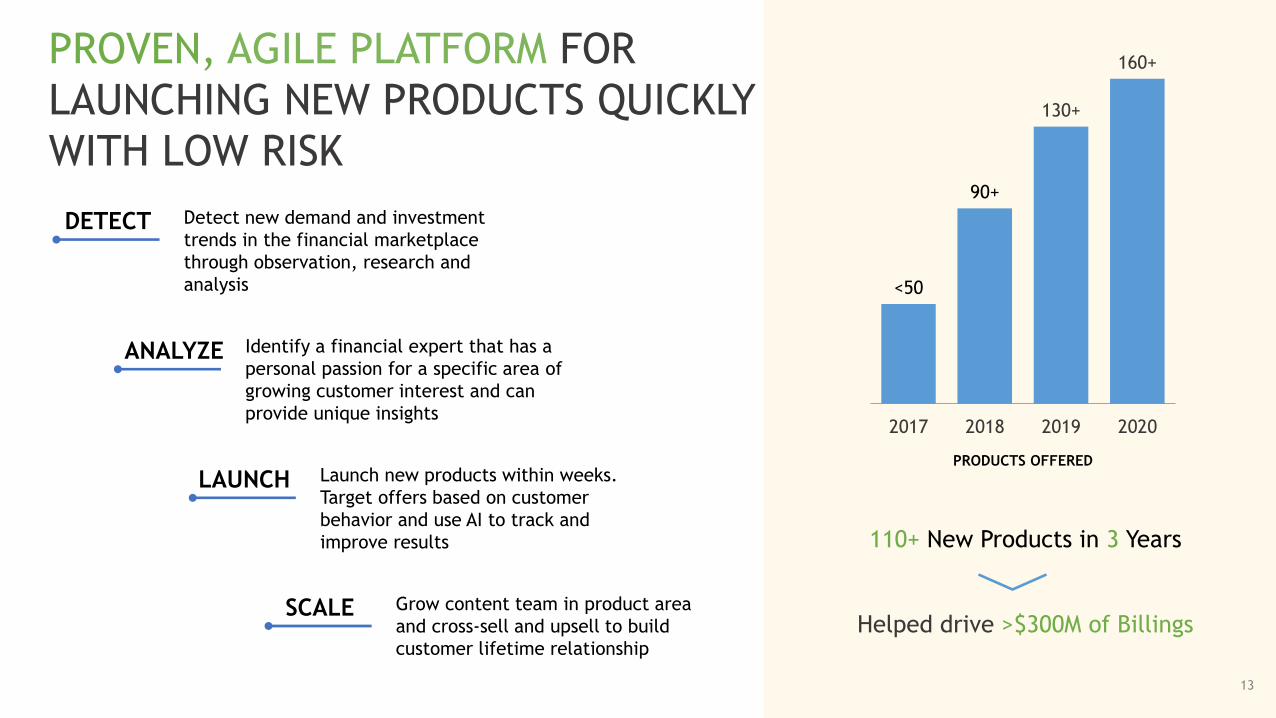
Detect new demand and investment
trends in the financial marketplace
through observation, research and
analysis
DETECT
Identify a financial expert that has a
personal passion for a specific area of
growing customer interest and can
provide unique insights
ANALYZE
Launch new products within weeks.
Target offers based on customer
behavior and use AI to track and
improve results
LAUNCH
Grow content team in product area
and cross-sell and upsell to build
customer lifetime relationship
SCALE
PROVEN, AGILE PLATFORM FOR
LAUNCHING NEW PRODUCTS QUICKLY
WITH LOW RISK
13
110+ New Products in 3 Years
Helped drive >$300M of Billings
PRODUCTS OFFERED
<50
90+
130+
160+
2017 2018 2019 2020
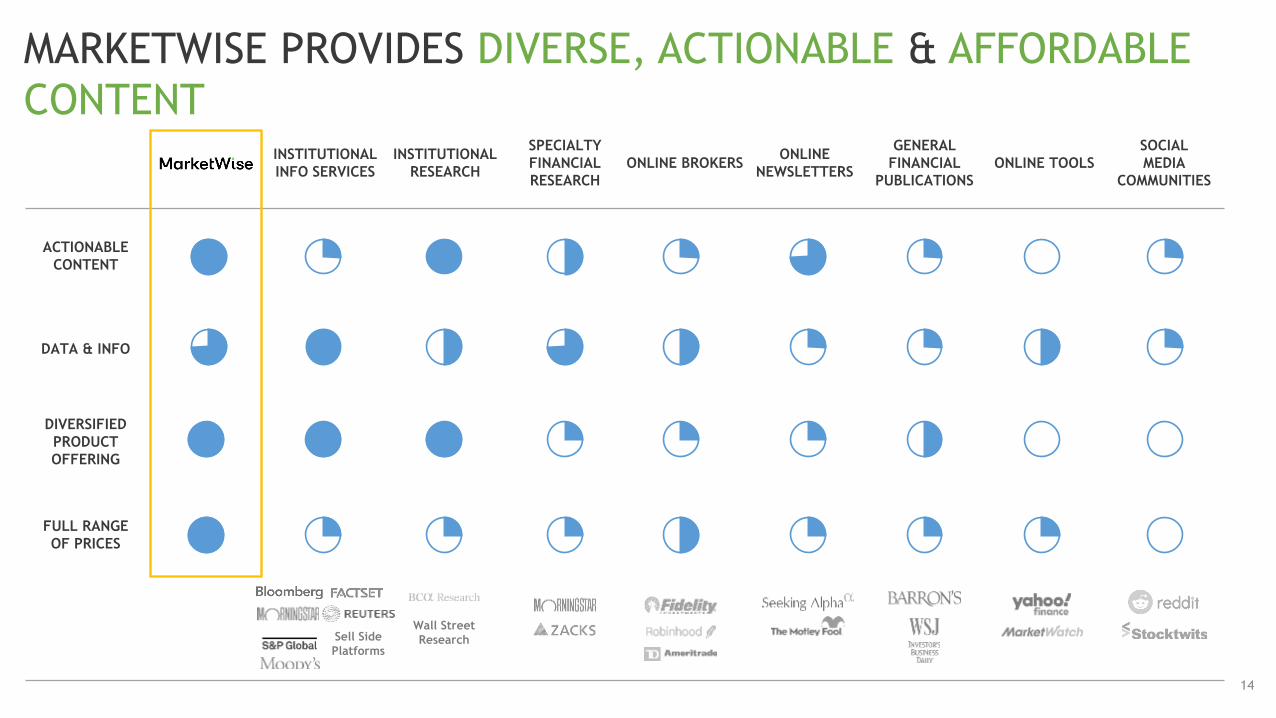
INSTITUTIONAL
INFO SERVICES
INSTITUTIONAL
RESEARCH
SPECIALTY
FINANCIAL
RESEARCH
ONLINE BROKERSONLINE
NEWSLETTERS
GENERAL
FINANCIAL
PUBLICATIONS
ONLINE TOOLS
SOCIAL
MEDIA
COMMUNITIES
ACTIONABLE
CONTENT
DATA & INFO
DIVERSIFIED
PRODUCT
OFFERING
FULL RANGE
OF PRICES
14
Sell Side
Platforms
Wall Street
Research
MARKETWISE PROVIDES DIVERSE, ACTIONABLE & AFFORDABLE
CONTENT
15
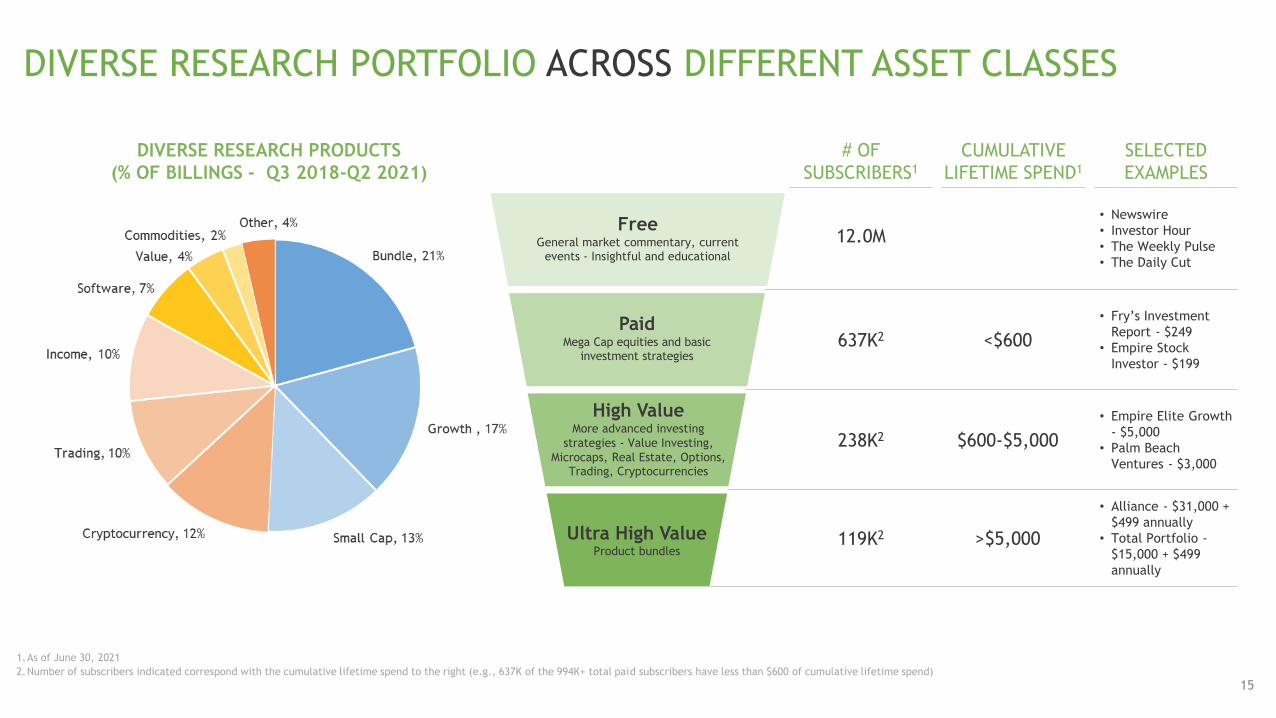
DIVERSE RESEARCH PORTFOLIO ACROSS DIFFERENT ASSET CLASSES
SELECTED
EXAMPLES
CUMULATIVE
LIFETIME SPEND1
# OF
SUBSCRIBERS1
119K2
238K2
637K2
>$5,000
$600-$5,000
<$600
Ultra High ValueProduct bundles
High ValueMore advanced investing
strategies - Value Investing,
Microcaps, Real Estate, Options, Trading, Cryptocurrencies
PaidMega Cap equities and basic
investment strategies
FreeGeneral market commentary, current
events - Insightful and educational
• Newswire
• Investor Hour
• The Weekly Pulse
• The Daily Cut
• Fry’s Investment
Report - $249
• Empire Stock
Investor - $199
• Empire Elite Growth
- $5,000
• Palm Beach
Ventures - $3,000
• Alliance - $31,000 +
$499 annually
• Total Portfolio -
$15,000 + $499
annually
DIVERSE RESEARCH PRODUCTS
(% OF BILLINGS - Q3 2018-Q2 2021)
12.0M
1.As of June 30, 2021
2.Number of subscribers indicated correspond with the cumulative lifetime spend to the right (e.g., 637K of the 994K+ total paid subscribers have less than $600 of cumulative lifetime spend)
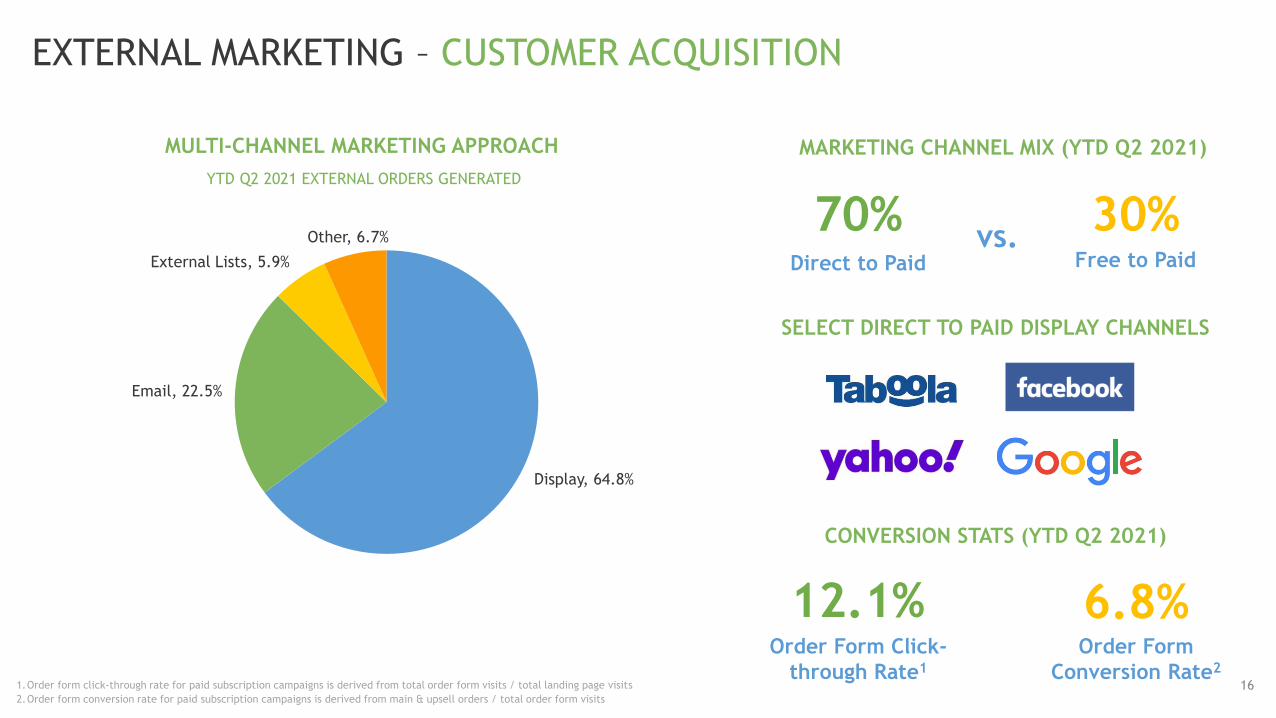
MARKETING CHANNEL MIX (YTD Q2 2021)
Direct to Paid Free to Paid
70% 30%vs.
MULTI-CHANNEL MARKETING APPROACH
YTD Q2 2021 EXTERNAL ORDERS GENERATED
EXTERNAL MARKETING – CUSTOMER ACQUISITION
SELECT DIRECT TO PAID DISPLAY CHANNELS
CONVERSION STATS (YTD Q2 2021)
Order Form Click-
through Rate1
12.1% 6.8%Order Form
Conversion Rate21.Order form click-through rate for paid subscription campaigns is derived from total order form visits / total landing page visits
2.Order form conversion rate for paid subscription campaigns is derived from main & upsell orders / total order form visits
16
Display, 64.8%
Email, 22.5%
External Lists, 5.9%
Other, 6.7%
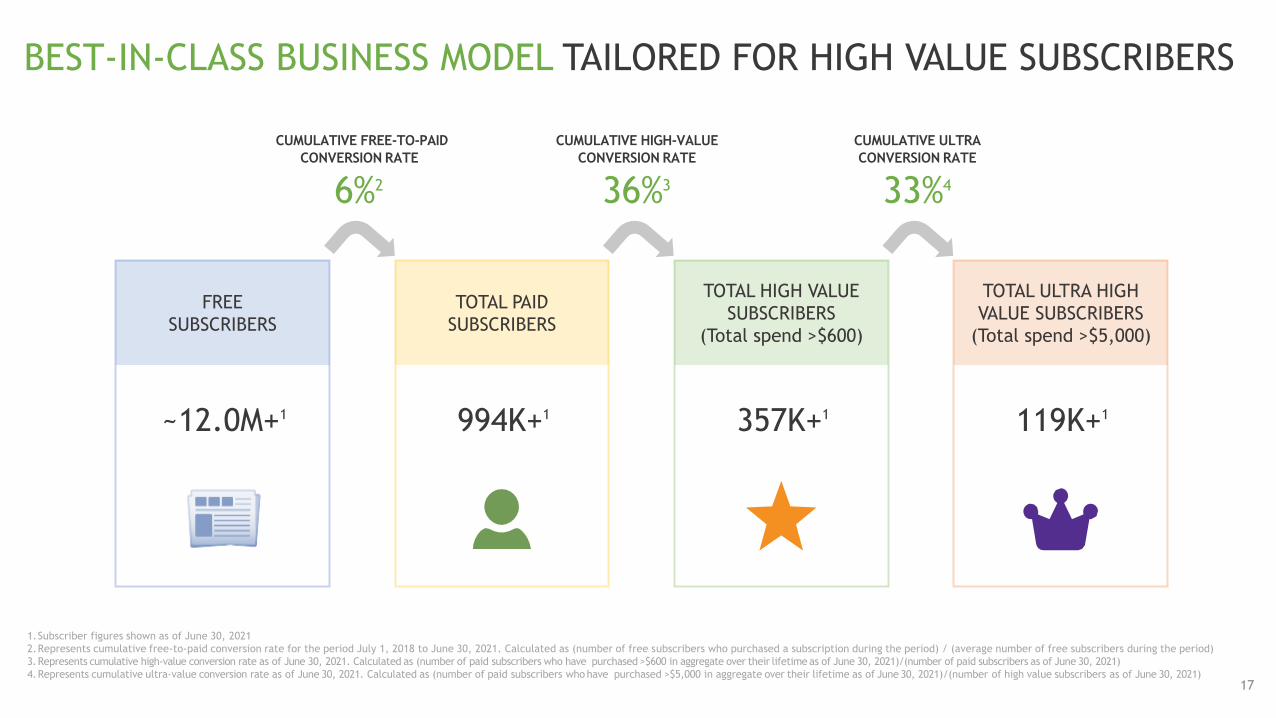
1.Subscriber figures shown as of June 30, 2021
2.Represents cumulative free-to-paid conversion rate for the period July 1, 2018 to June 30, 2021. Calculated as (number of free subscribers who purchased a subscription during the period) / (average number of free subscribers during the period)
3.Represents cumulative high-value conversion rate as of June 30, 2021. Calculated as (number of paid subscribers who have purchased >$600 in aggregate over their lifetime as of June 30, 2021)/(number of paid subscribers as of June 30, 2021)
4.Represents cumulative ultra-value conversion rate as of June 30, 2021. Calculated as (number of paid subscribers who have purchased >$5,000 in aggregate over their lifetime as of June 30, 2021)/(number of high value subscribers as of June 30, 2021)
BEST-IN-CLASS BUSINESS MODEL TAILORED FOR HIGH VALUE SUBSCRIBERS
17
CUMULATIVE FREE-TO-PAID
CONVERSION RATE
6%2
CUMULATIVE HIGH-VALUE
CONVERSION RATE
36%3
CUMULATIVE ULTRA
CONVERSION RATE
33%4
119K+1
TOTAL ULTRA HIGH
VALUE SUBSCRIBERS
(Total spend >$5,000)
357K+1
TOTAL HIGH VALUE
SUBSCRIBERS
(Total spend >$600)
994K+1
TOTAL PAID
SUBSCRIBERS
~12.0M+1
FREE
SUBSCRIBERS
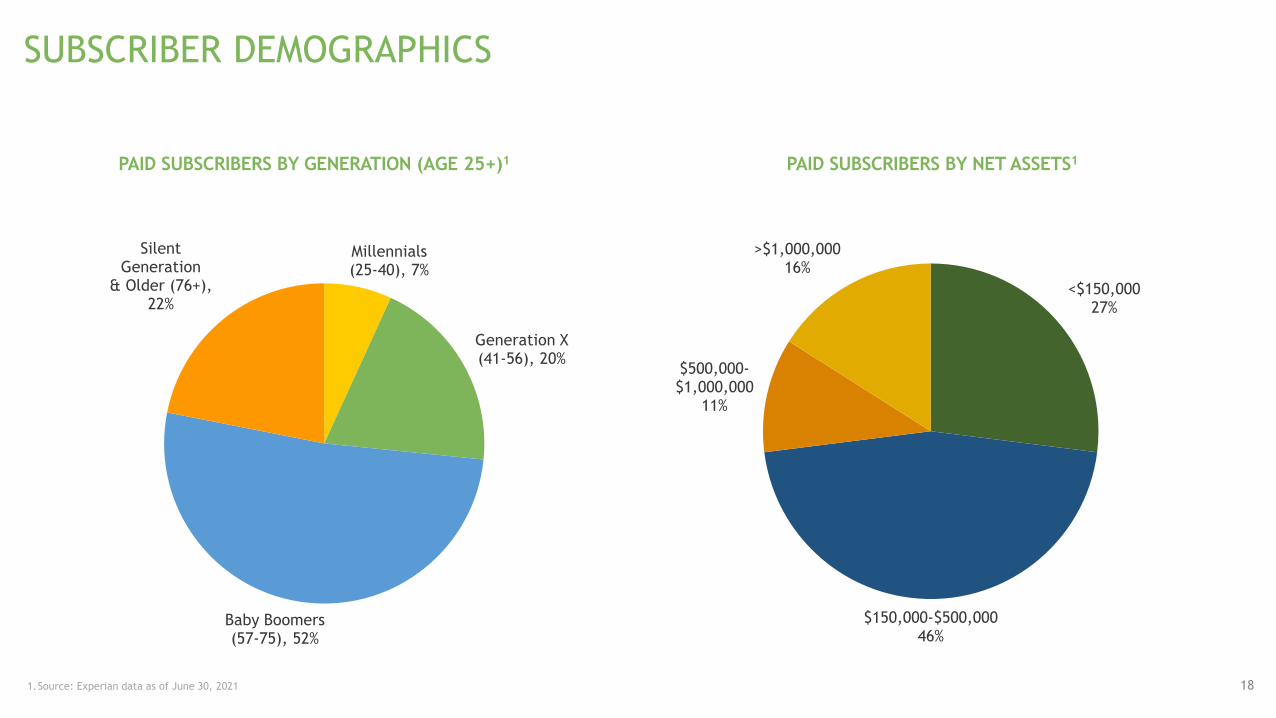
<$150,00027%
$150,000-$500,00046%
$500,000-$1,000,000
11%
>$1,000,00016%
18
SUBSCRIBER DEMOGRAPHICS
PAID SUBSCRIBERS BY GENERATION (AGE 25+)1 PAID SUBSCRIBERS BY NET ASSETS1
1.Source: Experian data as of June 30, 2021
Millennials(25-40), 7%
Generation X(41-56), 20%
Baby Boomers(57-75), 52%
Silent Generation
& Older (76+), 22%
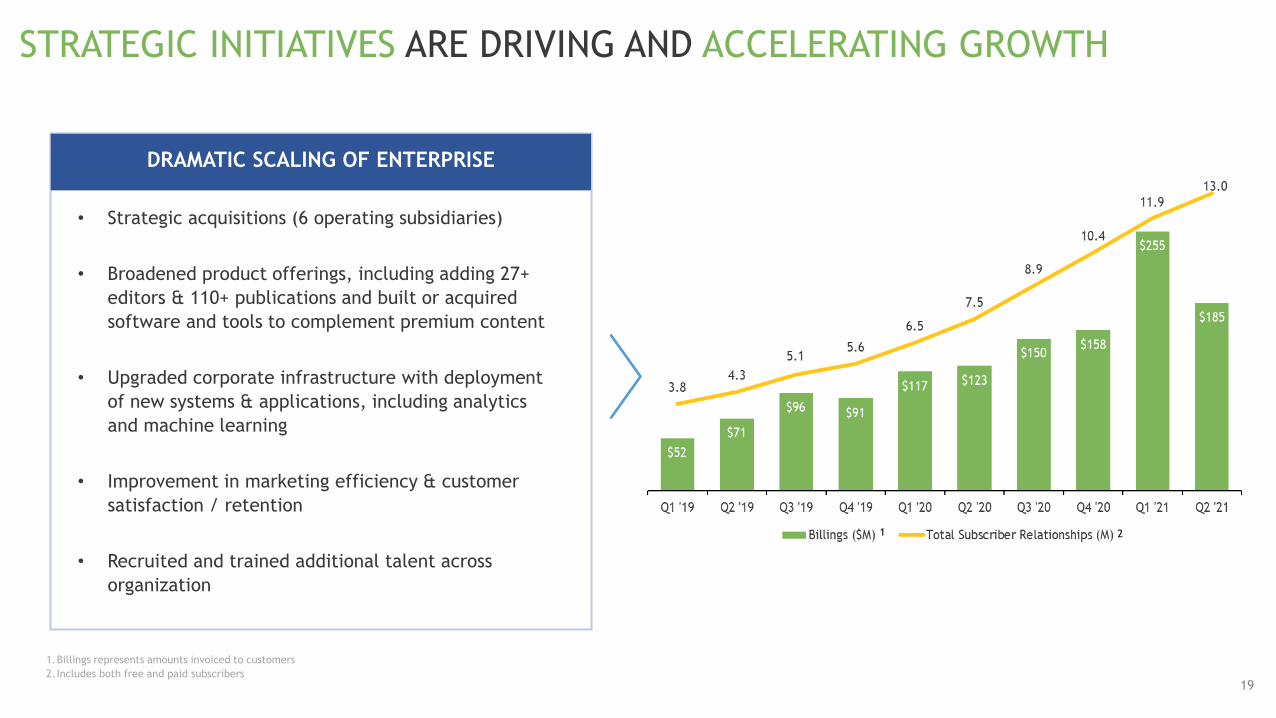
STRATEGIC INITIATIVES ARE DRIVING AND ACCELERATING GROWTH
19
DRAMATIC SCALING OF ENTERPRISE
• Strategic acquisitions (6 operating subsidiaries)
• Broadened product offerings, including adding 27+
editors & 110+ publications and built or acquired
software and tools to complement premium content
• Upgraded corporate infrastructure with deployment
of new systems & applications, including analytics
and machine learning
• Improvement in marketing efficiency & customer
satisfaction / retention
• Recruited and trained additional talent across
organization
2
1.Billings represents amounts invoiced to customers
2.Includes both free and paid subscribers
1
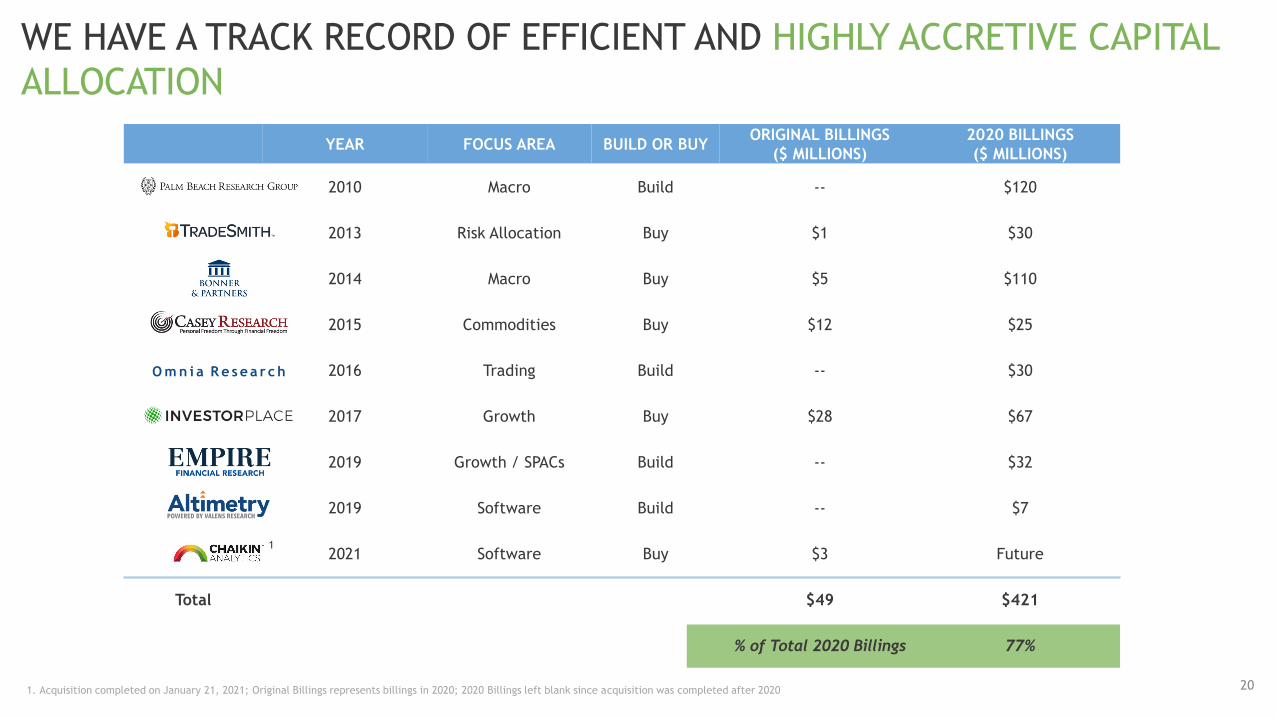
YEAR FOCUS AREA BUILD OR BUYORIGINAL BILLINGS
($ MILLIONS)
2020 BILLINGS
($ MILLIONS)
2010 Macro Build -- $120
2013 Risk Allocation Buy $1 $30
2014 Macro Buy $5 $110
2015 Commodities Buy $12 $25
2016 Trading Build -- $30
2017 Growth Buy $28 $67
2019 Growth / SPACs Build -- $32
2019 Software Build -- $7
2021 Software Buy $3 Future
Total $49 $421
% of Total 2020 Billings 77%
WE HAVE A TRACK RECORD OF EFFICIENT AND HIGHLY ACCRETIVE CAPITAL
ALLOCATION
20
1
1. Acquisition completed on January 21, 2021; Original Billings represents billings in 2020; 2020 Billings left blank since acquisition was completed after 2020
O m n i a R e se a r c h

Financial Overview
August, 2021
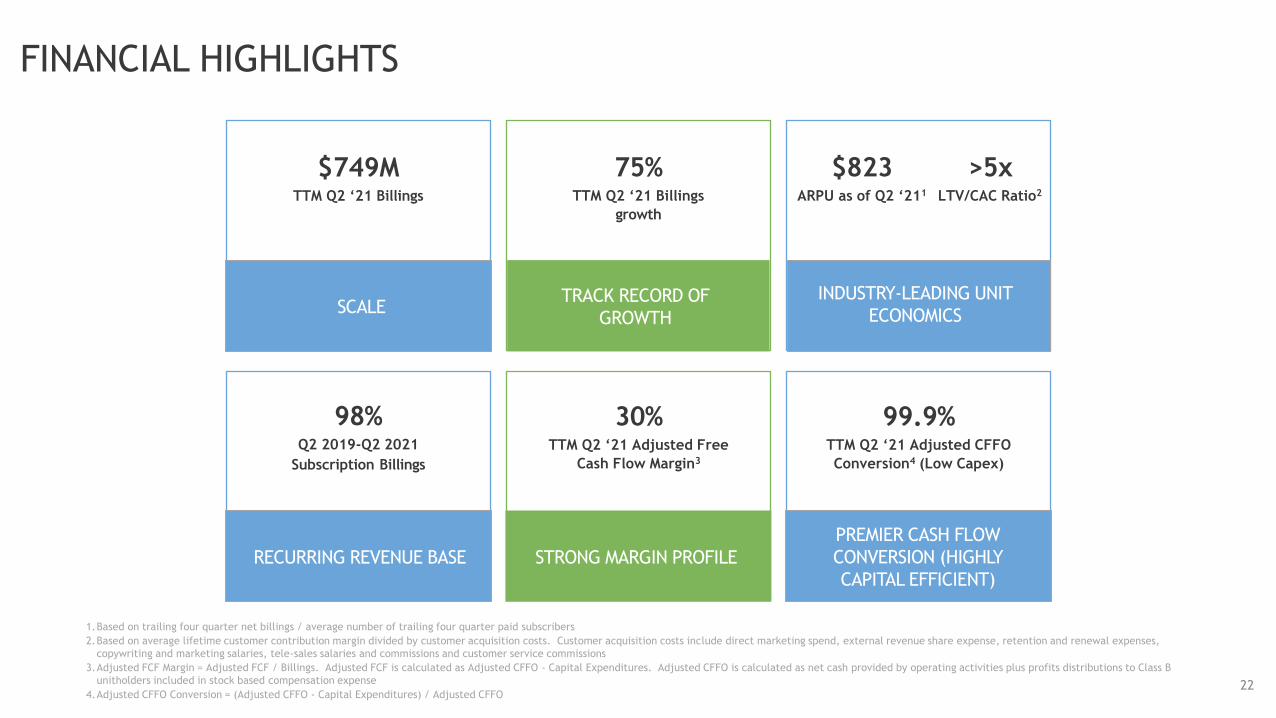
FINANCIAL HIGHLIGHTS
SCALE
$749MTTM Q2 ‘21 Billings
98%Q2 2019-Q2 2021
Subscription Billings
RECURRING REVENUE BASE
30%TTM Q2 ‘21 Adjusted Free
Cash Flow Margin3
75%TTM Q2 ‘21 Billings
growth
TRACK RECORD OF
GROWTH
STRONG MARGIN PROFILE
>5xLTV/CAC Ratio2
INDUSTRY-LEADING UNIT
ECONOMICS
22
99.9%TTM Q2 ‘21 Adjusted CFFO
Conversion4 (Low Capex)
PREMIER CASH FLOW
CONVERSION (HIGHLY
CAPITAL EFFICIENT)
1.Based on trailing four quarter net billings / average number of trailing four quarter paid subscribers
2.Based on average lifetime customer contribution margin divided by customer acquisition costs. Customer acquisition costs include direct marketing spend, external revenue share expense, retention and renewal expenses,
copywriting and marketing salaries, tele-sales salaries and commissions and customer service commissions
3.Adjusted FCF Margin = Adjusted FCF / Billings. Adjusted FCF is calculated as Adjusted CFFO - Capital Expenditures. Adjusted CFFO is calculated as net cash provided by operating activities plus profits distributions to Class B
unitholders included in stock based compensation expense
4.Adjusted CFFO Conversion = (Adjusted CFFO - Capital Expenditures) / Adjusted CFFO
$823ARPU as of Q2 ‘211
23
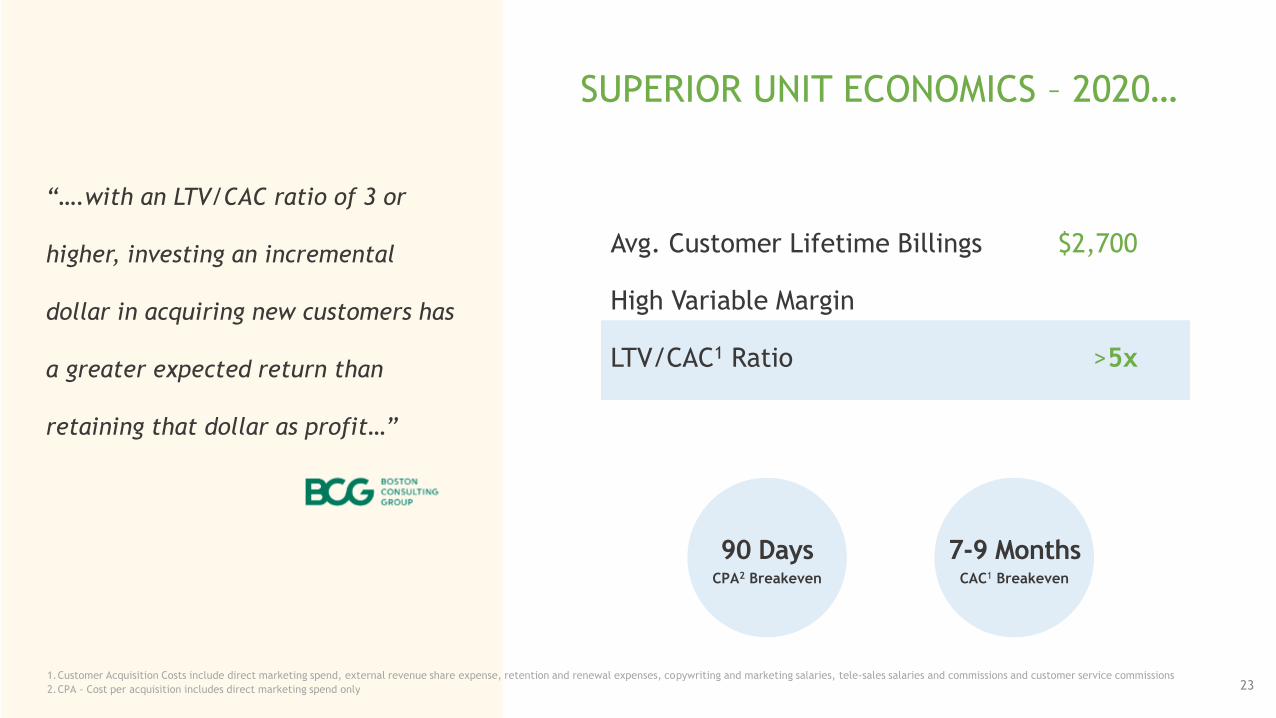
SUPERIOR UNIT ECONOMICS – 2020…
Avg. Customer Lifetime Billings $2,700
High Variable Margin
LTV/CAC1 Ratio >5x
“….with an LTV/CAC ratio of 3 or
higher, investing an incremental
dollar in acquiring new customers has
a greater expected return than
retaining that dollar as profit…”
90 DaysCPA2 Breakeven
7-9 MonthsCAC1 Breakeven
1.Customer Acquisition Costs include direct marketing spend, external revenue share expense, retention and renewal expenses, copywriting and marketing salaries, tele-sales salaries and commissions and customer service commissions
2.CPA - Cost per acquisition includes direct marketing spend only
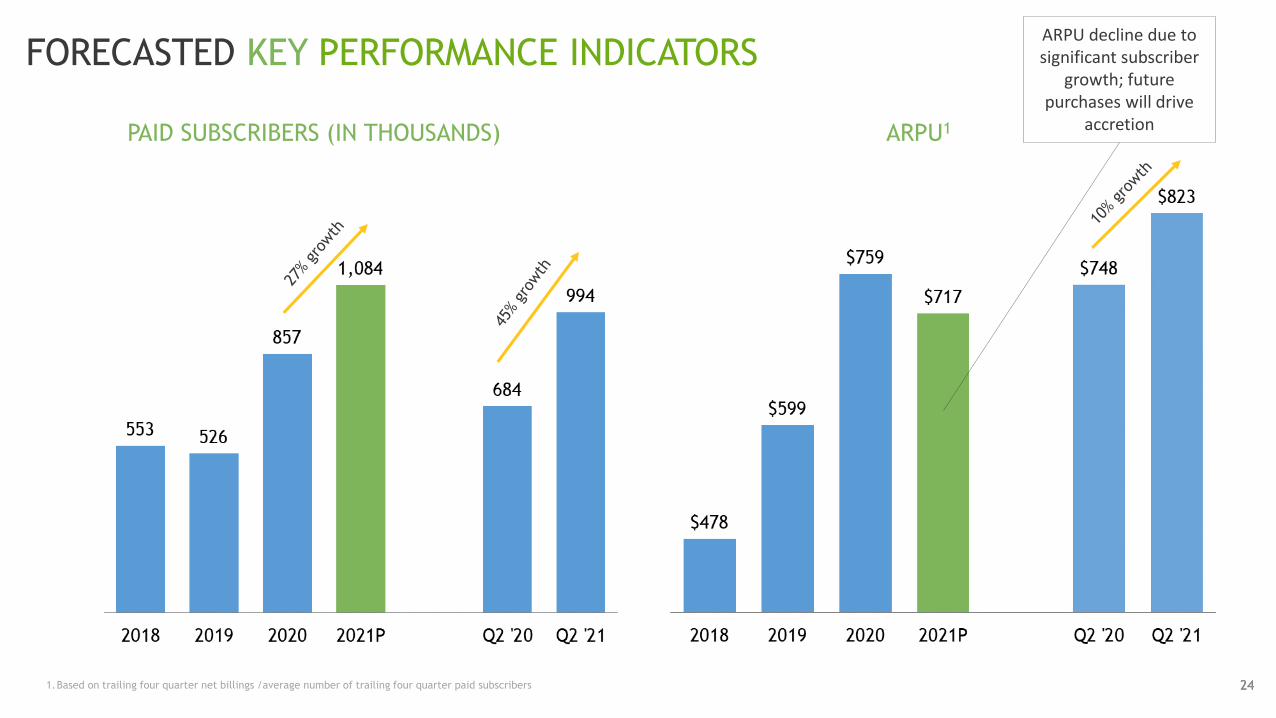
FORECASTED KEY PERFORMANCE INDICATORS
2424
PAID SUBSCRIBERS (IN THOUSANDS)
1.Based on trailing four quarter net billings /average number of trailing four quarter paid subscribers
ARPU1
ARPU decline due to significant subscriber
growth; future purchases will drive
accretion
25
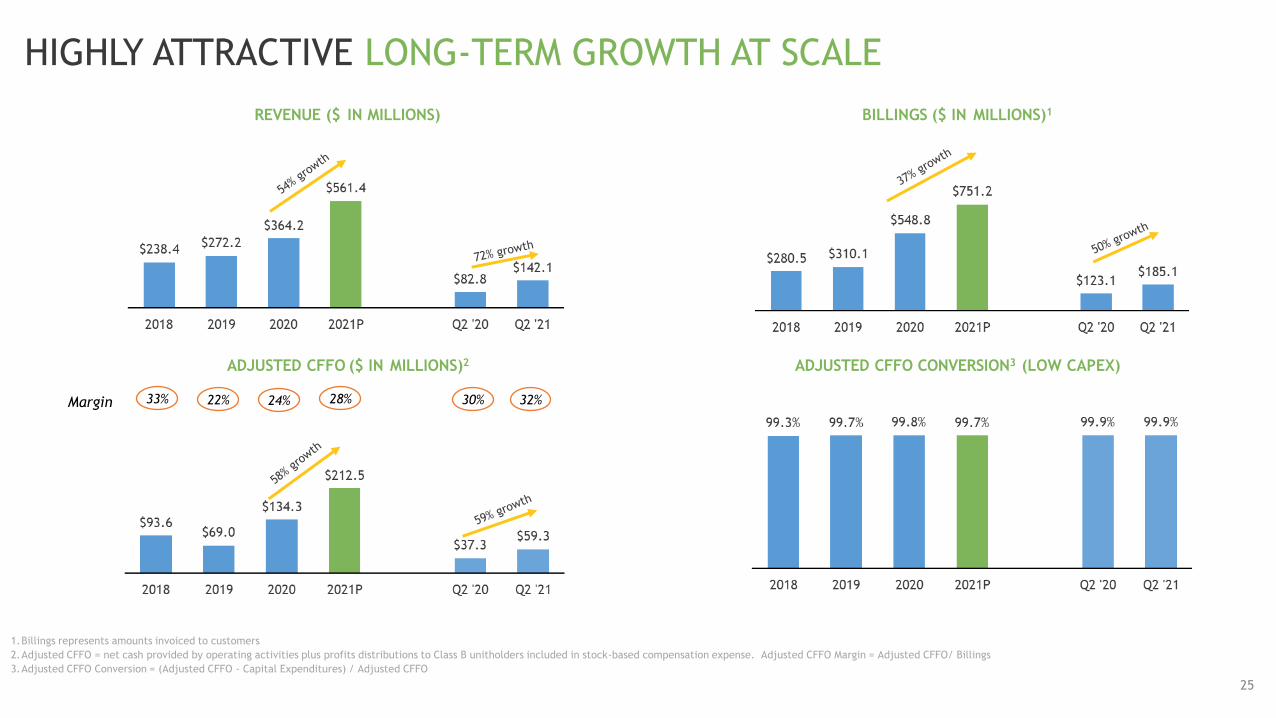
HIGHLY ATTRACTIVE LONG-TERM GROWTH AT SCALE
1.Billings represents amounts invoiced to customers
2.Adjusted CFFO = net cash provided by operating activities plus profits distributions to Class B unitholders included in stock-based compensation expense. Adjusted CFFO Margin = Adjusted CFFO/ Billings
3.Adjusted CFFO Conversion = (Adjusted CFFO - Capital Expenditures) / Adjusted CFFO
24% 28%Margin 22%
BILLINGS ($ IN MILLIONS)1
ADJUSTED CFFO CONVERSION3 (LOW CAPEX)ADJUSTED CFFO ($ IN MILLIONS)2
33%
REVENUE ($ IN MILLIONS)
30% 32%
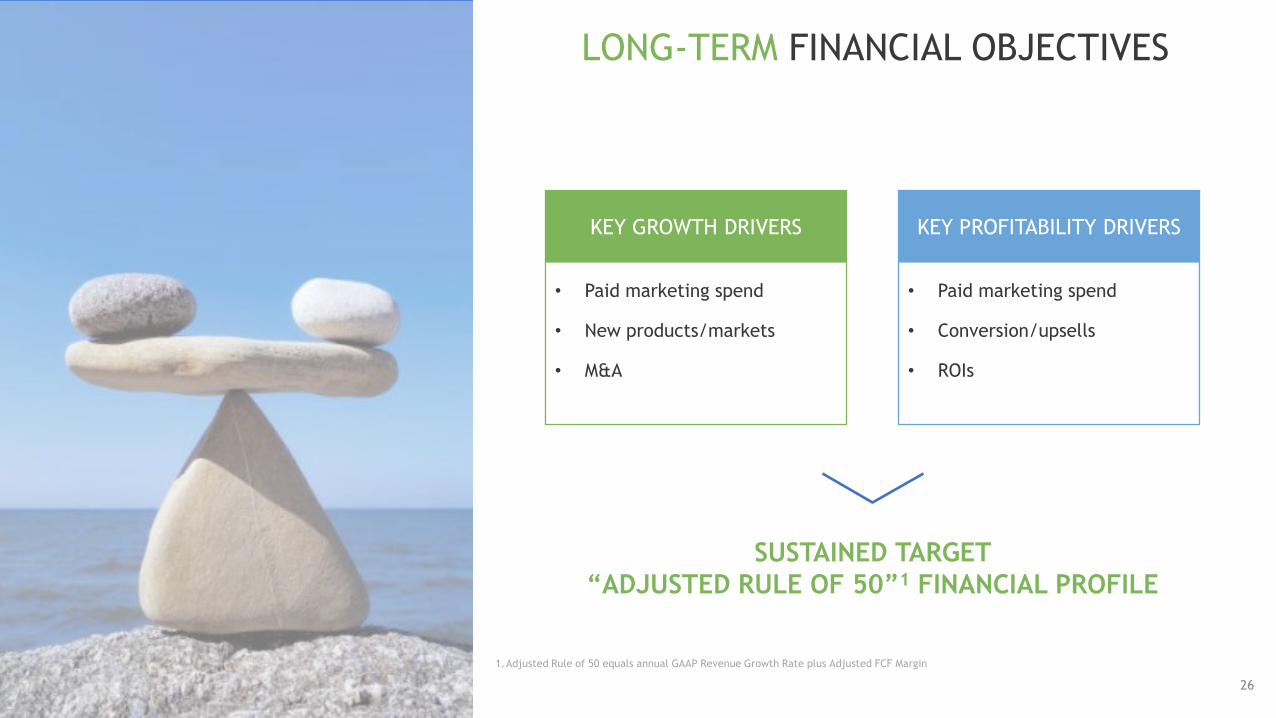
LONG-TERM FINANCIAL OBJECTIVES
SUSTAINED TARGET
“ADJUSTED RULE OF 50”1 FINANCIAL PROFILE
26
KEY GROWTH DRIVERS KEY PROFITABILITY DRIVERS
• Paid marketing spend
• New products/markets
• M&A
• Paid marketing spend
• Conversion/upsells
• ROIs
1.Adjusted Rule of 50 equals annual GAAP Revenue Growth Rate plus Adjusted FCF Margin

Appendix
August, 2021
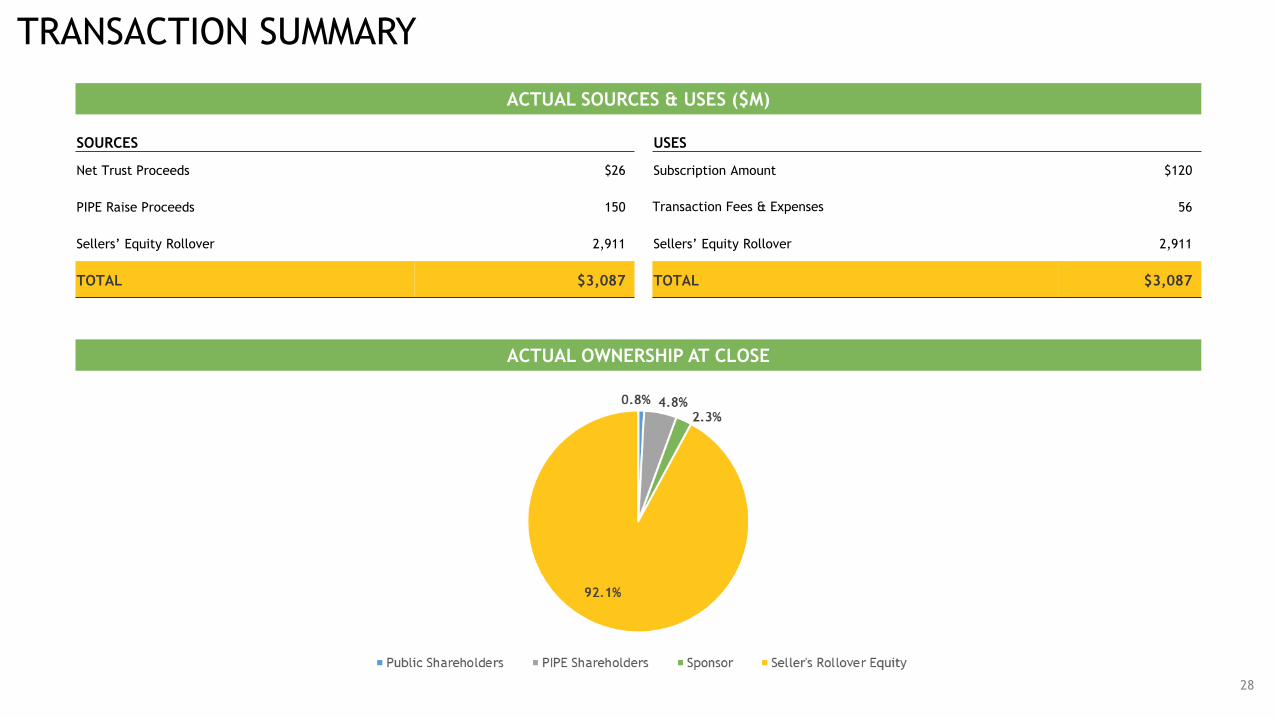
TRANSACTION SUMMARY
28
SOURCES USES
Net Trust Proceeds $26 Subscription Amount $120
PIPE Raise Proceeds 150 Transaction Fees & Expenses 56
Sellers’ Equity Rollover 2,911 Sellers’ Equity Rollover 2,911
TOTAL $3,087 TOTAL $3,087
ACTUAL SOURCES & USES ($M)
ACTUAL OWNERSHIP AT CLOSE
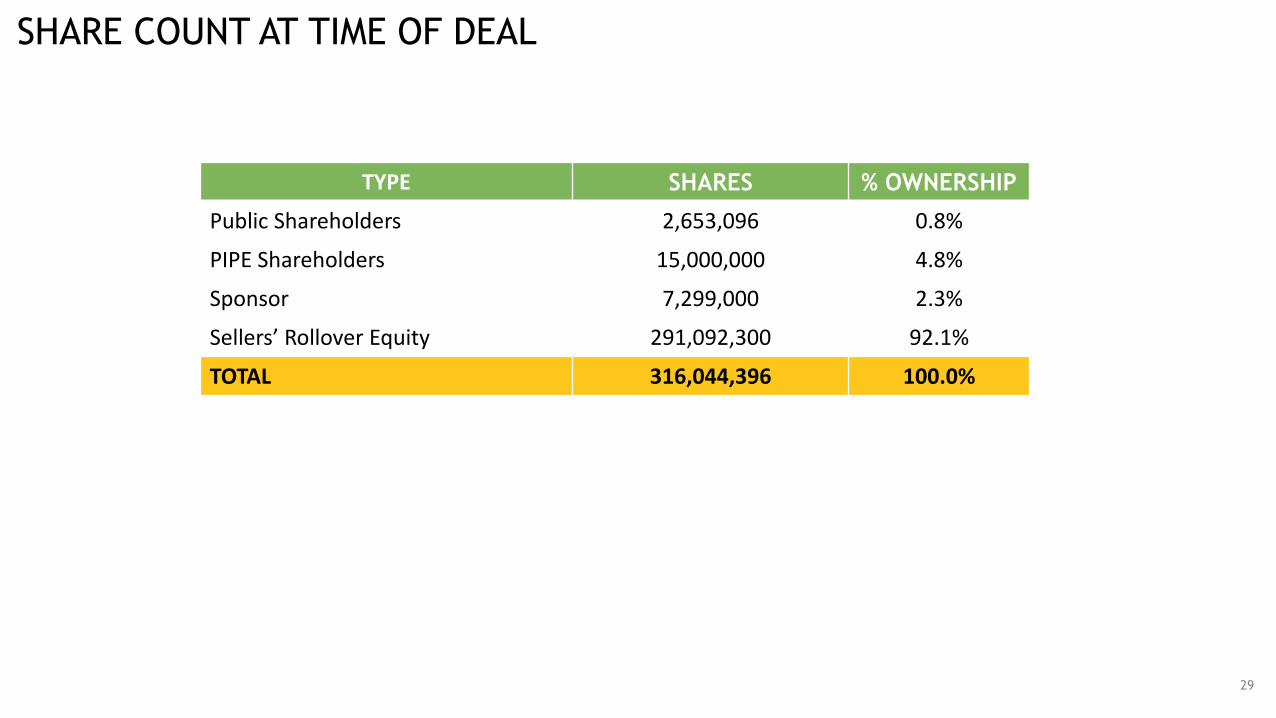
SHARE COUNT AT TIME OF DEAL
29
TYPE SHARES % OWNERSHIP
Public Shareholders 2,653,096 0.8%
PIPE Shareholders 15,000,000 4.8%
Sponsor 7,299,000 2.3%
Sellers’ Rollover Equity 291,092,300 92.1%
TOTAL 316,044,396 100.0%
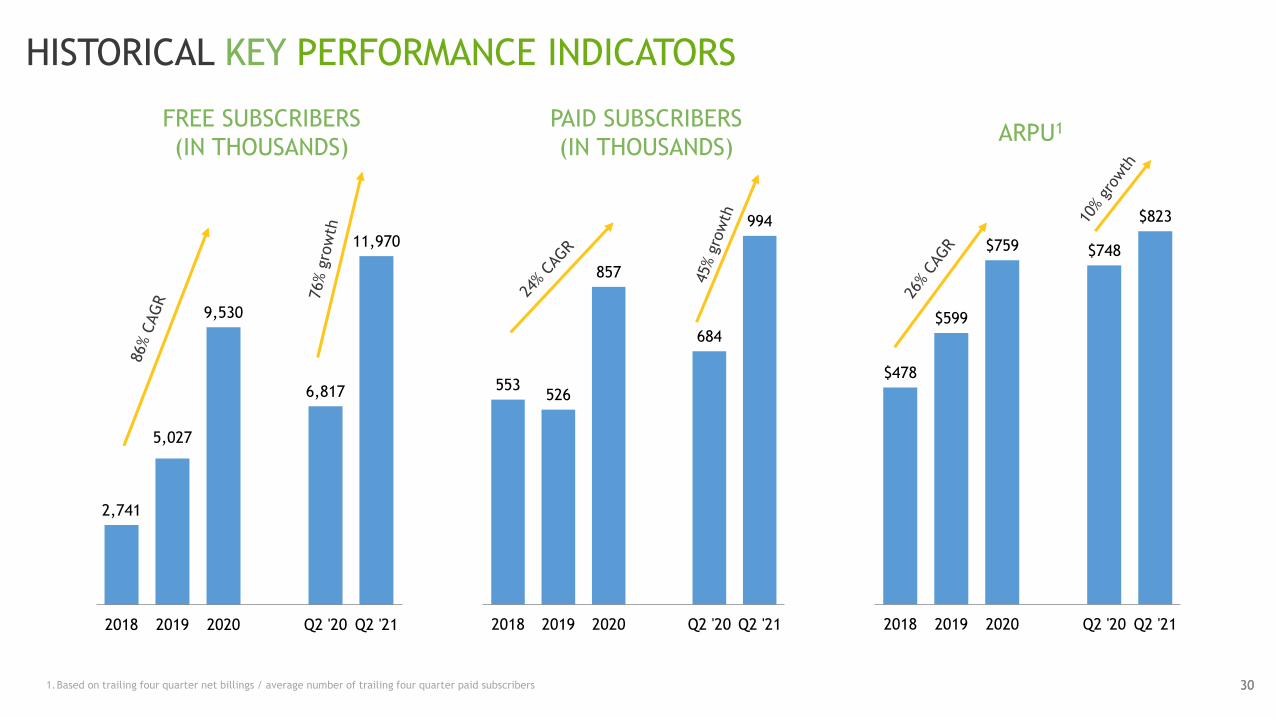
$478
$599
$759 $748
$823
2018 2019 2020 Q2 '20 Q2 '21
553526
857
684
994
2018 2019 2020 Q2 '20 Q2 '21
HISTORICAL KEY PERFORMANCE INDICATORS
3030
FREE SUBSCRIBERS
(IN THOUSANDS)
PAID SUBSCRIBERS
(IN THOUSANDS)ARPU1
1.Based on trailing four quarter net billings / average number of trailing four quarter paid subscribers
2,741
5,027
9,530
6,817
11,970
2018 2019 2020 Q2 '20 Q2 '21
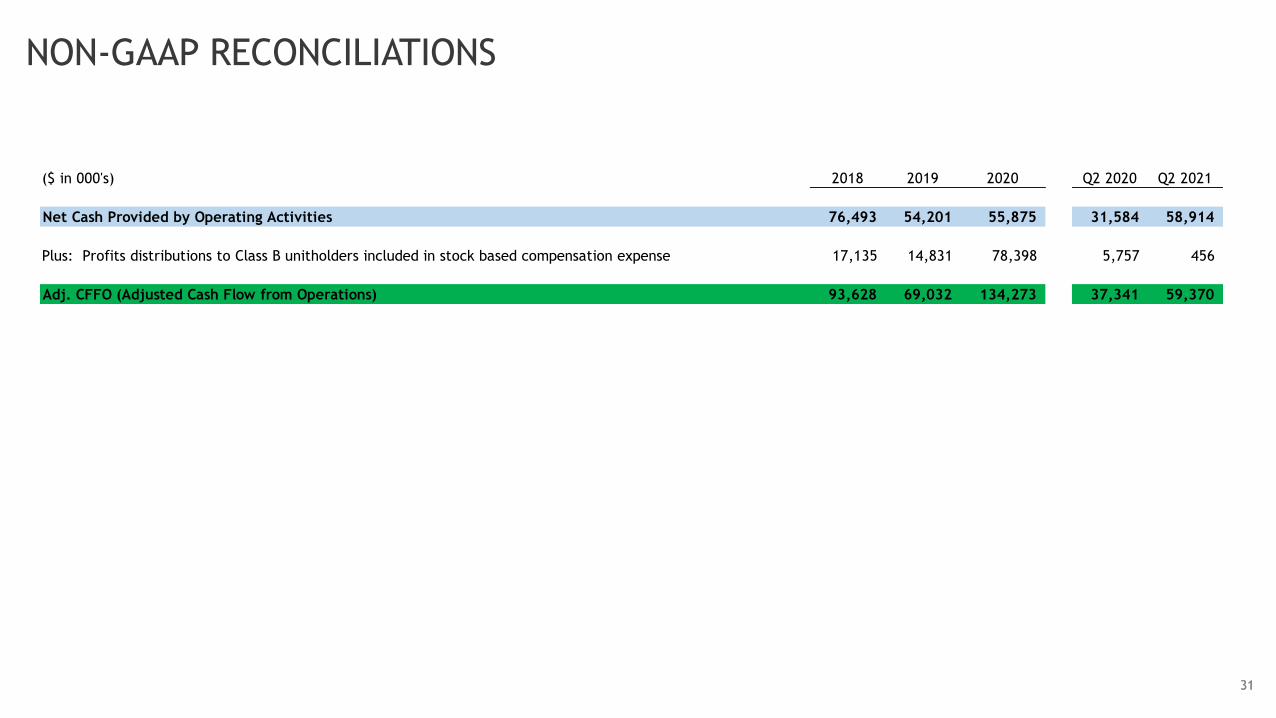
NON-GAAP RECONCILIATIONS
3131
($ in 000's) 2018 2019 2020 Q2 2020 Q2 2021
Net Cash Provided by Operating Activities 76,493 54,201 55,875 31,584 58,914
Plus: Profits distributions to Class B unitholders included in stock based compensation expense 17,135 14,831 78,398 5,757 456
Adj. CFFO (Adjusted Cash Flow from Operations) 93,628 69,032 134,273 37,341 59,370
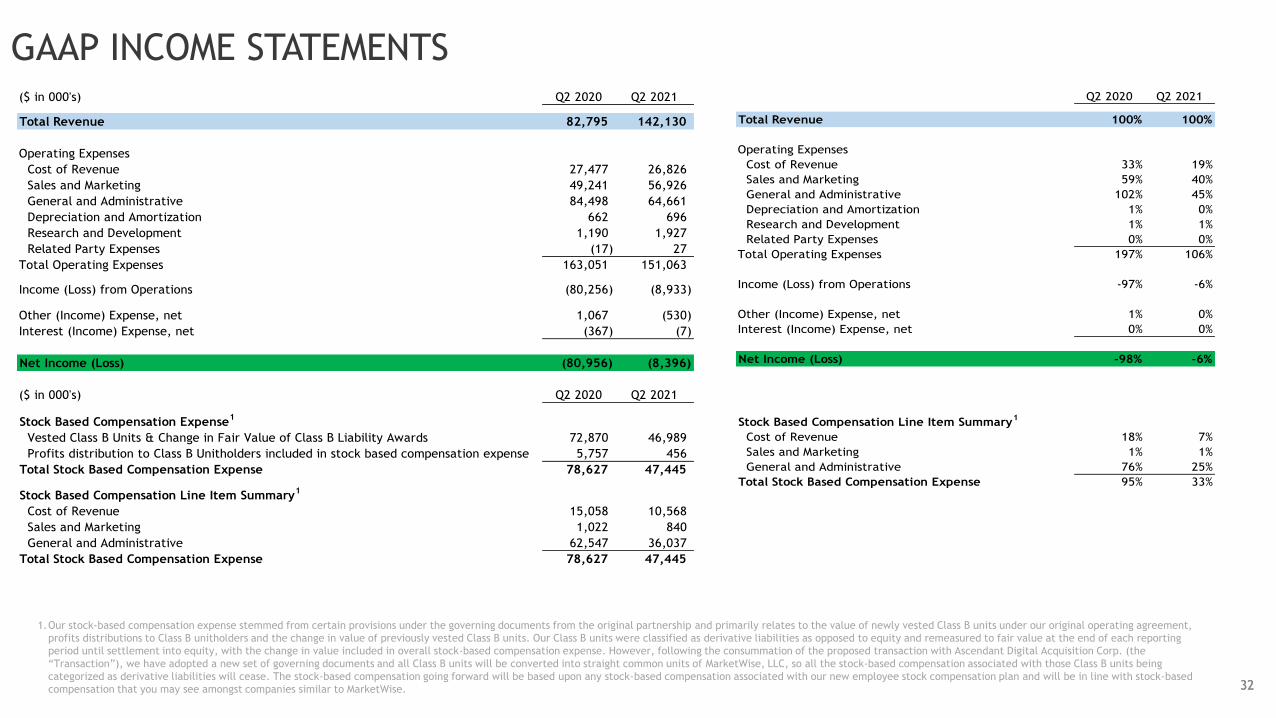
GAAP INCOME STATEMENTS
3232
1.Our stock-based compensation expense stemmed from certain provisions under the governing documents from the original partnership and primarily relates to the value of newly vested Class B units under our original operating agreement,
profits distributions to Class B unitholders and the change in value of previously vested Class B units. Our Class B units were classified as derivative liabilities as opposed to equity and remeasured to fair value at the end of each reporting
period until settlement into equity, with the change in value included in overall stock-based compensation expense. However, following the consummation of the proposed transaction with Ascendant Digital Acquisition Corp. (the
“Transaction”), we have adopted a new set of governing documents and all Class B units will be converted into straight common units of MarketWise, LLC, so all the stock-based compensation associated with those Class B units being
categorized as derivative liabilities will cease. The stock-based compensation going forward will be based upon any stock-based compensation associated with our new employee stock compensation plan and will be in line with stock-based
compensation that you may see amongst companies similar to MarketWise.
Q2 2020 Q2 2021
Total Revenue 100% 100%
Operating Expenses
Cost of Revenue 33% 19%
Sales and Marketing 59% 40%
General and Administrative 102% 45%
Depreciation and Amortization 1% 0%
Research and Development 1% 1%
Related Party Expenses 0% 0%
Total Operating Expenses 197% 106%
Income (Loss) from Operations -97% -6%
Other (Income) Expense, net 1% 0%
Interest (Income) Expense, net 0% 0%
Net Income (Loss) -98% -6%
Stock Based Compensation Line Item Summary1
Cost of Revenue 18% 7%
Sales and Marketing 1% 1%
General and Administrative 76% 25%
Total Stock Based Compensation Expense 95% 33%
($ in 000's) Q2 2020 Q2 2021
Total Revenue 82,795 142,130
Operating Expenses
Cost of Revenue 27,477 26,826
Sales and Marketing 49,241 56,926
General and Administrative 84,498 64,661
Depreciation and Amortization 662 696
Research and Development 1,190 1,927
Related Party Expenses (17) 27
Total Operating Expenses 163,051 151,063
Income (Loss) from Operations (80,256) (8,933)
Other (Income) Expense, net 1,067 (530)
Interest (Income) Expense, net (367) (7)
Net Income (Loss) (80,956) (8,396)
($ in 000's) Q2 2020 Q2 2021
Stock Based Compensation Expense1
Vested Class B Units & Change in Fair Value of Class B Liability Awards 72,870 46,989
Profits distribution to Class B Unitholders included in stock based compensation expense 5,757 456
Total Stock Based Compensation Expense 78,627 47,445
Stock Based Compensation Line Item Summary1
Cost of Revenue 15,058 10,568
Sales and Marketing 1,022 840
General and Administrative 62,547 36,037
Total Stock Based Compensation Expense 78,627 47,445