Embed Size (px)
Citation preview

7 May 2020
Chief Executive Officer
Steve Binnie
Sappi Limited
Q2 FY20 financial results delivering on
strategy
2020
Vision2020
intentionalevolution
next phase
growth
1

Forward-looking statements and Regulation G
2
Forward-looking statementsCertain statements in this release that are neither reported financial results nor other historical information, are forward-looking statements, including but not limited to statements that are predictions ofor indicate future earnings, savings, synergies, events, trends, plans or objectives. The words “believe”, “anticipate”, “expect”, “intend”, “estimate”, “plan”, “assume”, “positioned”, “will”, “may”, “should”,“risk” and other similar expressions, which are predictions of or indicate future events and future trends and which do not relate to historical matters, identify forward-looking statements. In addition, thisdocument includes forward-looking statements relating to our potential exposure to various types of market risks, such as interest rate risk, foreign exchange rate risk and commodity price risk. Youshould not rely on forward-looking statements because they involve known and unknown risks, uncertainties and other factors which are in some cases beyond our control and may cause our actualresults, performance or achievements to differ materially from anticipated future results, performance or achievements expressed or implied by such forward-looking statements (and from past results,performance or achievements). Certain factors that may cause such differences include but are not limited to:
The highly cyclical nature of the pulp and paper industry (and the factors that contribute to such cyclicality, such as levels of demand, production capacity, production, input costs including rawmaterial, energy and employee costs, and pricing)
The impact on our business of adverse changes in global economic conditions The Covid-19 pandemic Unanticipated production disruptions (including as a result of planned or unexpected power outages) Changes in environmental, tax and other laws and regulations Adverse changes in the markets for our products The emergence of new technologies and changes in consumer trends including increased preferences for digital media Consequences of our leverage, including as a result of adverse changes in credit markets that affect our ability to raise capital when needed Adverse changes in the political situation and economy in the countries in which we operate or the effect of governmental efforts to address present or future economic or social problems The impact of restructurings, investments, acquisitions, dispositions and other strategic initiatives (including related financing), any delays, unexpected costs or other problems experienced in
connection with dispositions or with integrating acquisitions or implementing restructurings or other strategic initiatives, and achieving expected savings and synergies, and Currency fluctuations.
We undertake no obligation to publicly update or revise any of these forward-looking statements, whether to reflect new information or future events or circumstances or otherwise.
Regulation G disclosureCertain non-GAAP financial information is contained in this presentation that management believe may be useful in comparing the company’s operating results from period to period. Reconciliation's ofcertain of the non-GAAP measures to the corresponding GAAP measures can be found in the quarterly results booklet for the relevant period. These booklets are available on our website:https://www.sappi.com/quarterly-reports.

Highlights – Q2 FY20
3
EBITDA* $131mDown 30% Y-o-Y
Net debt/EBITDA 3.1X**
EPS* 4 US cents
o Historically low DP prices and reduced volumes significantly impacting profitability
o Packaging and specialities segment continued to grow volumes and profitability
o Significant market share gains in graphics paper business
o Matane integration on track – included in DP segment
o Strong liquidity with cash on hand US$268 million and US$642 million from undrawn committed RCF
• Refer to the supplementary information in this presentation for a reconciliation of EBITDA to reported operating profit and page 25 in our Q2 FY20 financial results booklet (available on www.sappi.com) for a definition of special items.
** Adjusted covenant leverage ratio
Excluding special items*
0
40
80
120
160
200
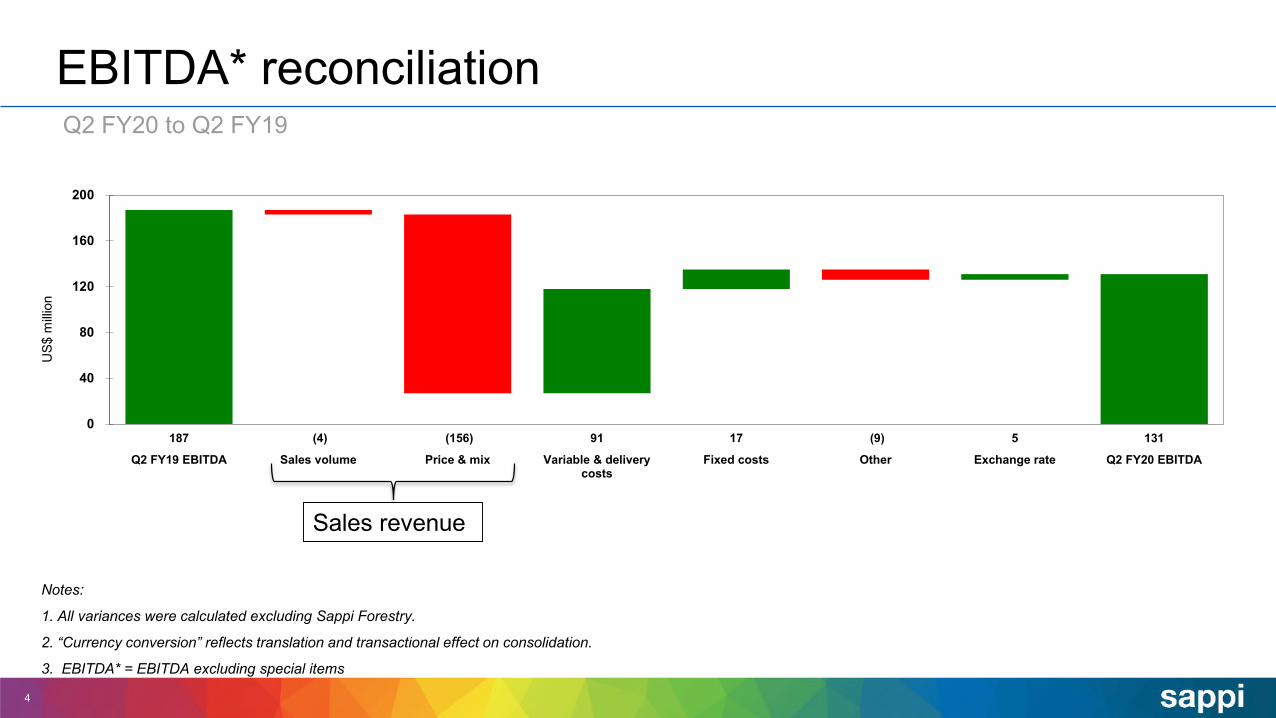
187 (4) (156) 91 17 (9) 5 131
Q2 FY19 EBITDA Sales volume Price & mix Variable & deliverycosts
Fixed costs Other Exchange rate Q2 FY20 EBITDA
EBITDA* reconciliation
4
Q2 FY20 to Q2 FY19
US$
milli
on
Notes:
1. All variances were calculated excluding Sappi Forestry.
2. “Currency conversion” reflects translation and transactional effect on consolidation.
3. EBITDA* = EBITDA excluding special items
Sales revenue
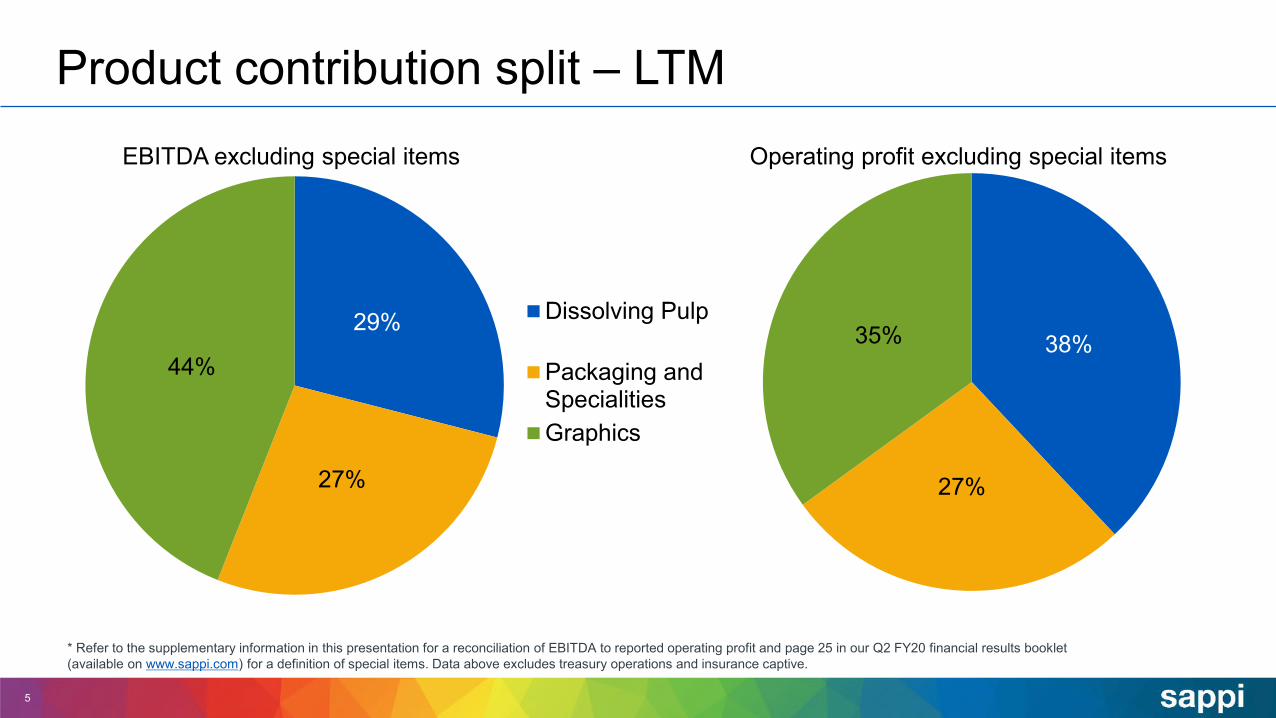
Product contribution split – LTM
5
* Refer to the supplementary information in this presentation for a reconciliation of EBITDA to reported operating profit and page 25 in our Q2 FY20 financial results booklet (available on www.sappi.com) for a definition of special items. Data above excludes treasury operations and insurance captive.
29%
27%
44%
Dissolving Pulp
Packaging andSpecialitiesGraphics
38%
27%
35%
EBITDA excluding special items Operating profit excluding special items

6
Segment volume & EBITDA* margin
0.0%2.0%4.0%6.0%8.0%10.0%12.0%
600700800900
1,0001,1001,200
Graphics volume Graphics margin
0.0%
5.0%
10.0%
15.0%
20.0%
100
150
200
250
300
350
Pack/Spec volume Pack/Spec margin
0%
10%
20%
30%
40%
100150200250300350400
DP volume EBITDA margin
EBITDA* = EBITDA excluding special items

Maturity profile*Fiscal years
7
268
8723 43 45
455
113
25
526
25
246
347
65 85
0
100
200
300
400
500
600
2020 2021 2022 2023 2024 2025 2026 2027 2032
US$
milli
on
Cash Short-term SPH term debt Securitisation SSA
EUR450m bondEUR350m bond
US$221m bond
*Graph excludes US$97 million in IFRS16 leases – Average maturity of 4 years

Capex
8
0
100
200
300
400
500
600
2016 2017 2018 2019 2020E
US$
milli
on
Maintenance Efficiency and expansion

9
Segmental overview
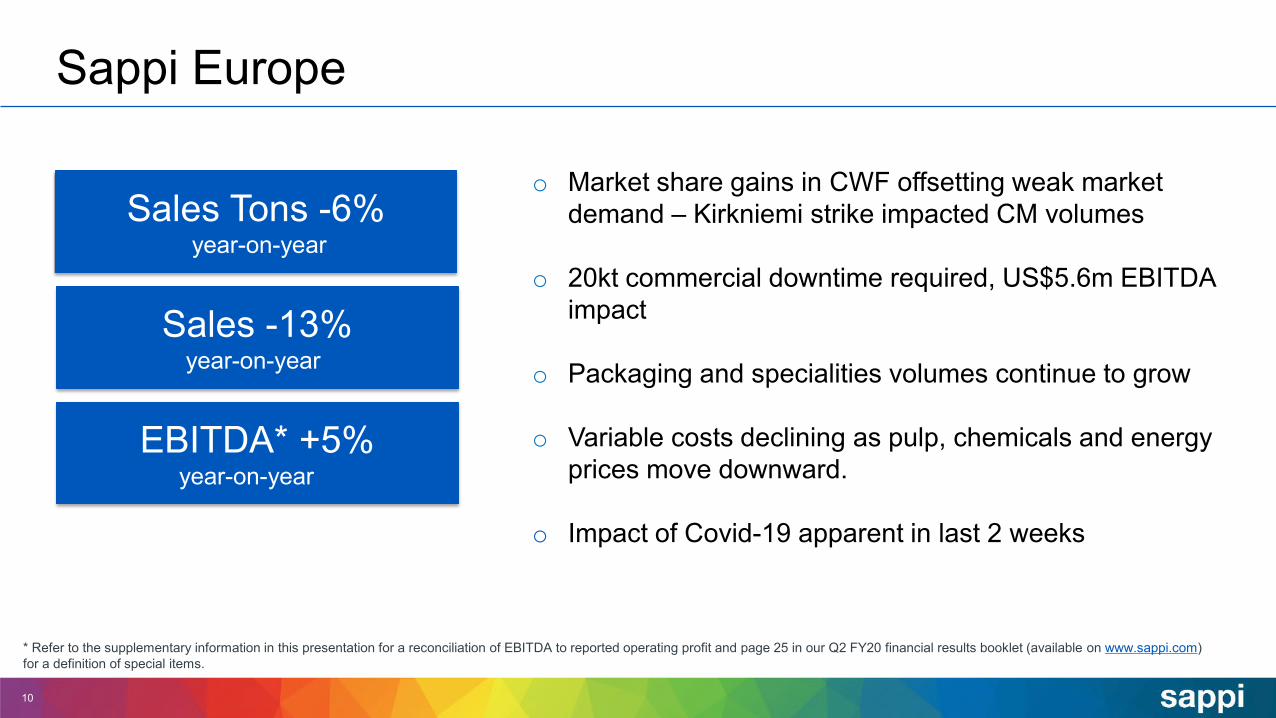
Sappi Europe
10
Sales Tons -6%year-on-year
Sales -13%year-on-year
EBITDA* +5%year-on-year
* Refer to the supplementary information in this presentation for a reconciliation of EBITDA to reported operating profit and page 25 in our Q2 FY20 financial results booklet (available on www.sappi.com) for a definition of special items.
o Market share gains in CWF offsetting weak market demand – Kirkniemi strike impacted CM volumes
o 20kt commercial downtime required, US$5.6m EBITDA impact
o Packaging and specialities volumes continue to grow
o Variable costs declining as pulp, chemicals and energy prices move downward.
o Impact of Covid-19 apparent in last 2 weeks
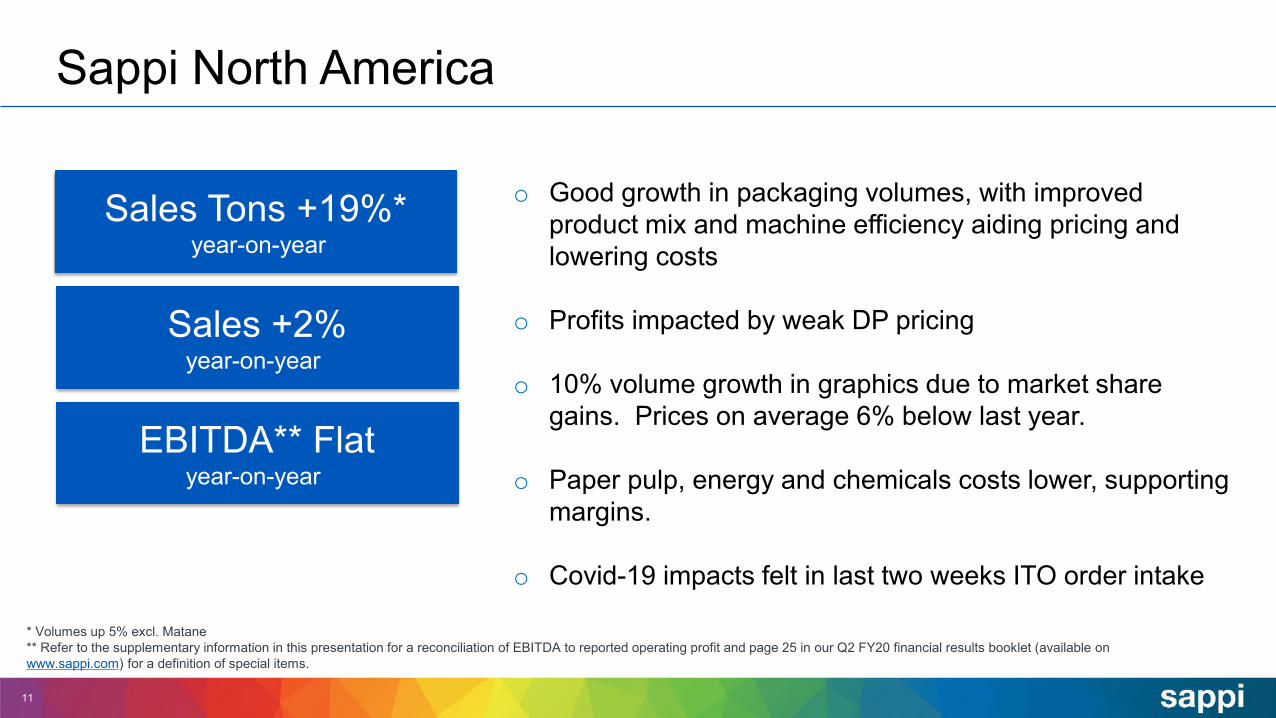
Sappi North America
11
Sales Tons +19%*year-on-year
Sales +2%year-on-year
EBITDA** Flatyear-on-year
* Volumes up 5% excl. Matane** Refer to the supplementary information in this presentation for a reconciliation of EBITDA to reported operating profit and page 25 in our Q2 FY20 financial results booklet (available on www.sappi.com) for a definition of special items.
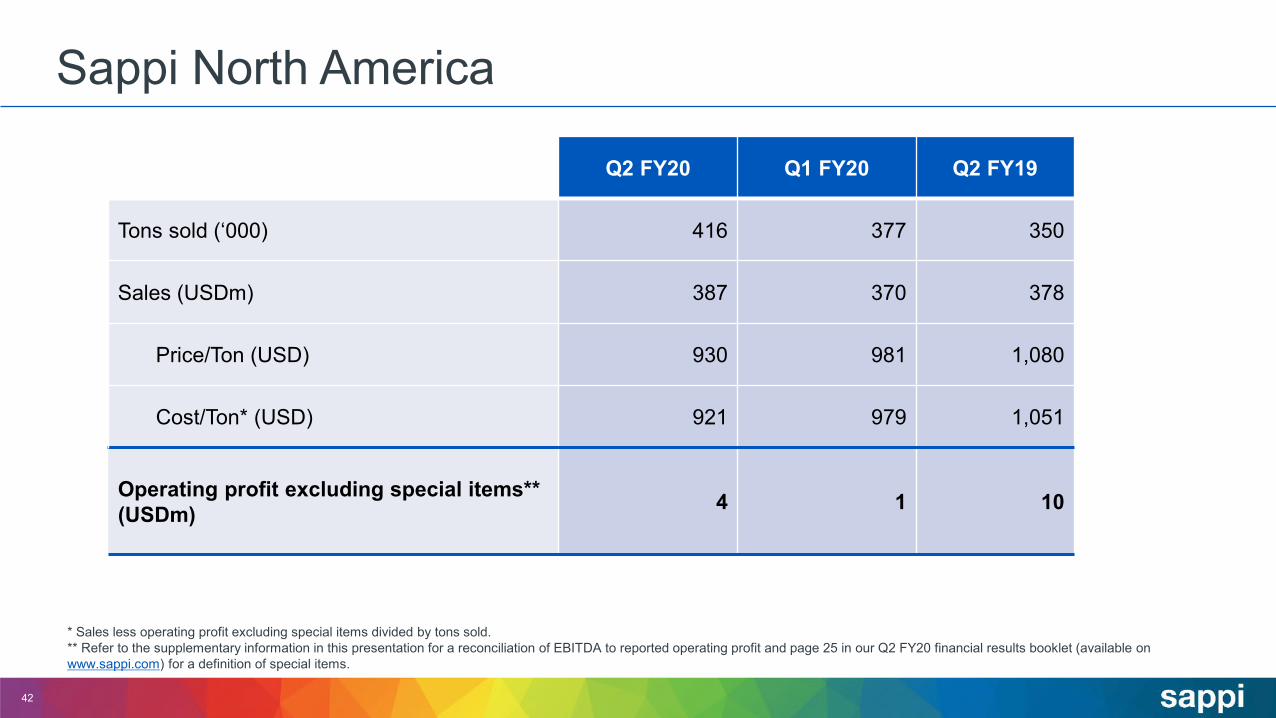
o Good growth in packaging volumes, with improved product mix and machine efficiency aiding pricing and lowering costs
o Profits impacted by weak DP pricing
o 10% volume growth in graphics due to market share gains. Prices on average 6% below last year.
o Paper pulp, energy and chemicals costs lower, supporting margins.
o Covid-19 impacts felt in last two weeks ITO order intake
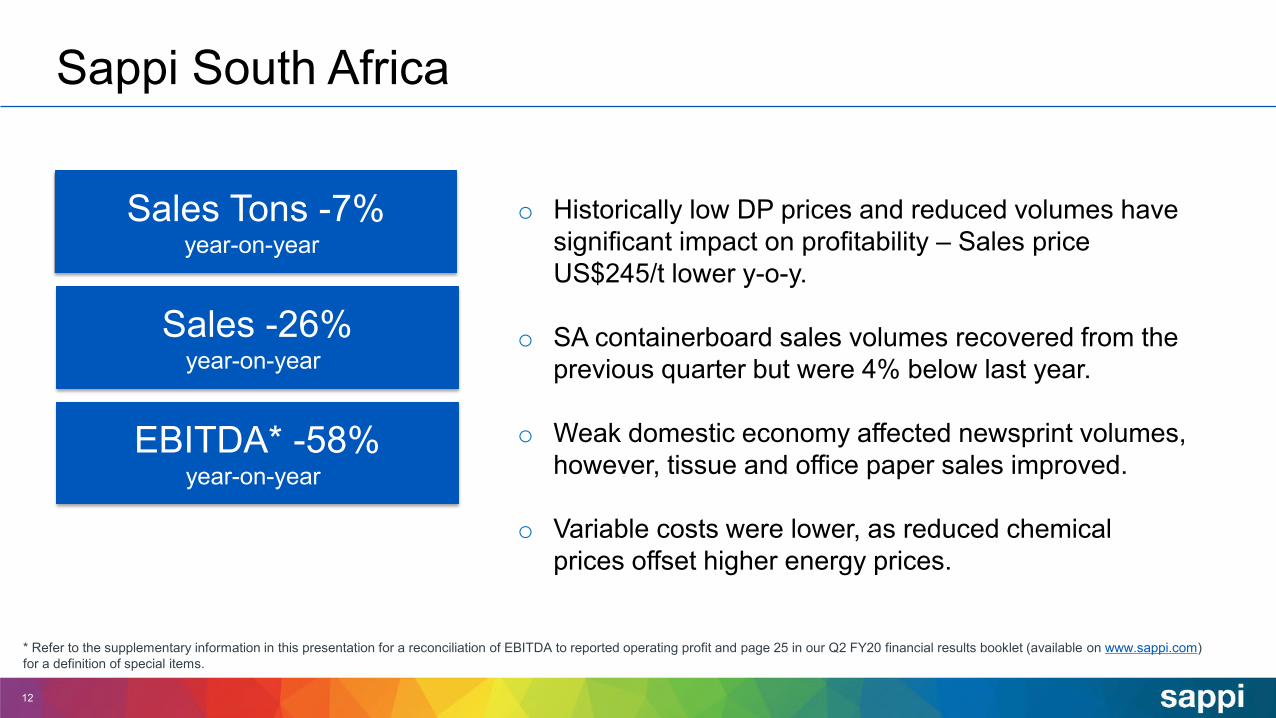
Sappi South Africa
12
Sales Tons -7%year-on-year
Sales -26%year-on-year
EBITDA* -58%year-on-year
* Refer to the supplementary information in this presentation for a reconciliation of EBITDA to reported operating profit and page 25 in our Q2 FY20 financial results booklet (available on www.sappi.com) for a definition of special items.
o Historically low DP prices and reduced volumes have significant impact on profitability – Sales price US$245/t lower y-o-y.
o SA containerboard sales volumes recovered from the previous quarter but were 4% below last year.
o Weak domestic economy affected newsprint volumes, however, tissue and office paper sales improved.
o Variable costs were lower, as reduced chemical prices offset higher energy prices.
Covid-19 update
13
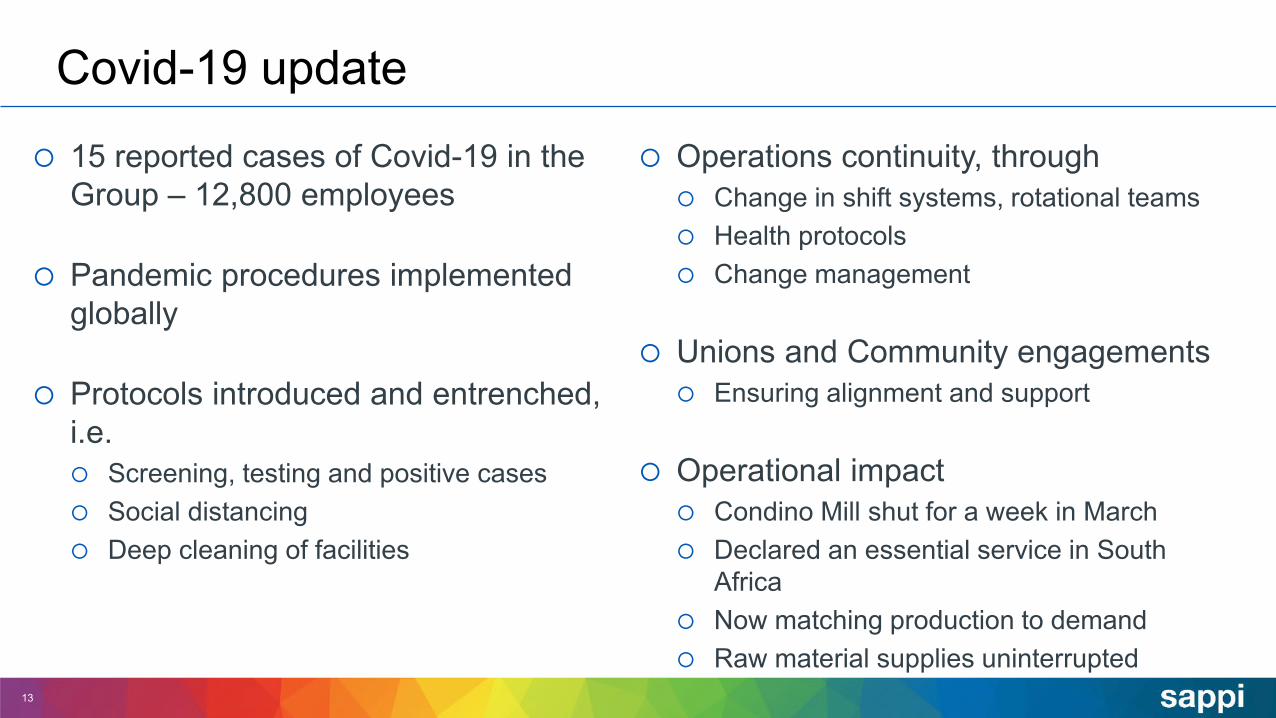
15 reported cases of Covid-19 in the Group – 12,800 employees
Pandemic procedures implemented globally
Protocols introduced and entrenched, i.e. Screening, testing and positive cases Social distancing Deep cleaning of facilities
Operations continuity, through Change in shift systems, rotational teams Health protocols Change management
Unions and Community engagements Ensuring alignment and support
Operational impact Condino Mill shut for a week in March Declared an essential service in South
Africa Now matching production to demand Raw material supplies uninterrupted
Covid-19 update - cash management
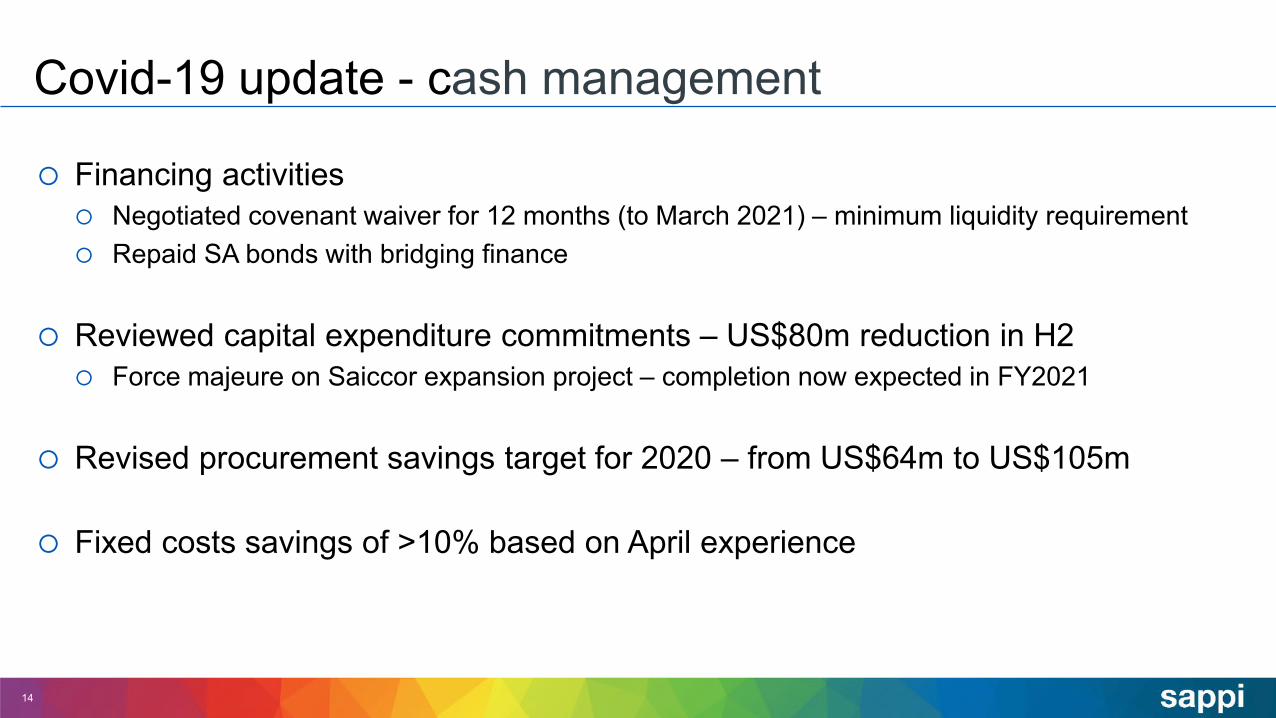
Financing activities Negotiated covenant waiver for 12 months (to March 2021) – minimum liquidity requirement Repaid SA bonds with bridging finance
Reviewed capital expenditure commitments – US$80m reduction in H2 Force majeure on Saiccor expansion project – completion now expected in FY2021
Revised procurement savings target for 2020 – from US$64m to US$105m
Fixed costs savings of >10% based on April experience
14

Covid-19 update - cash management
Working capital management Restricting stock build Resisting delays in receivables – Overdues remain constant with prior quarters
Applying for government assistance where criteria is met Differs by region, mostly from May onwards
Short-interval control Daily cash monitoring and weekly cash flow forecasts Invoice and order intake monitoring
15
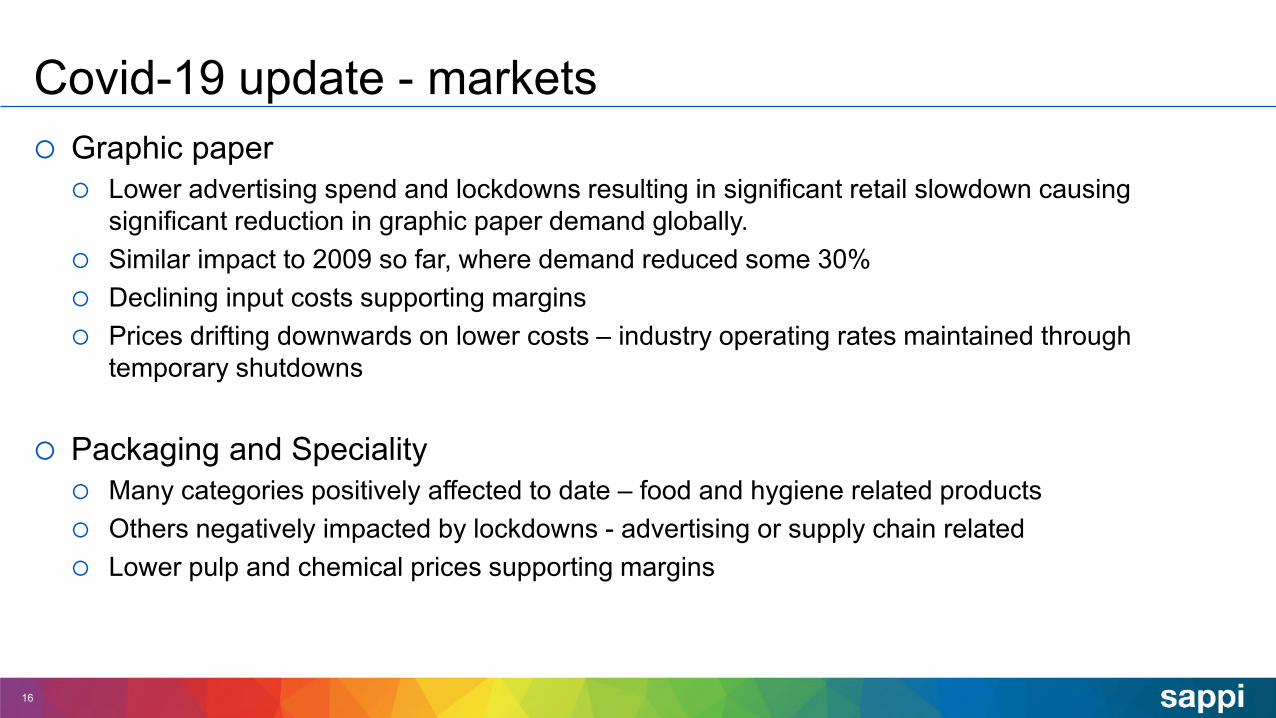
Covid-19 update - markets Graphic paper Lower advertising spend and lockdowns resulting in significant retail slowdown causing
significant reduction in graphic paper demand globally. Similar impact to 2009 so far, where demand reduced some 30% Declining input costs supporting margins Prices drifting downwards on lower costs – industry operating rates maintained through
temporary shutdowns
Packaging and Speciality Many categories positively affected to date – food and hygiene related products Others negatively impacted by lockdowns - advertising or supply chain related Lower pulp and chemical prices supporting margins
16

Covid-19 update - markets
Dissolving Pulp Retail lockdowns in many geographies have impacted entire textile supply chain
Growth in E-commerce/online sales not enough to offset impact on brick and mortar stores Initial signs in China point to a slow recovery post lock-down
DP demand down approximately 35%, similar to 2009, though duration then was short-lived. Exchange rate movements lowering costs for many producers, DP price trending lower in line
with VSF pricing. VSF production impacted by lockdowns in some regions – excess capacity remains an issue
with lower demand. BCTMP sales holding up well, and pricing has improved over the last few months
17

18
US retail sales March 2020 - 8.7% MoM by category
-50.5%
-27.1% -26.8% -26.5%-23.3%
-19.7%-15.1%
1.3% 3.1% 4.3%
26.9%
-60%
-45%
-30%
-15%
0%
15%
30% Retail sales % +(-) change in March , month over month
Average retail sales -8.7%
The coronavirus pandemic triggered steep drops in several areas of March retail sales
Source: US Commerce Department
19
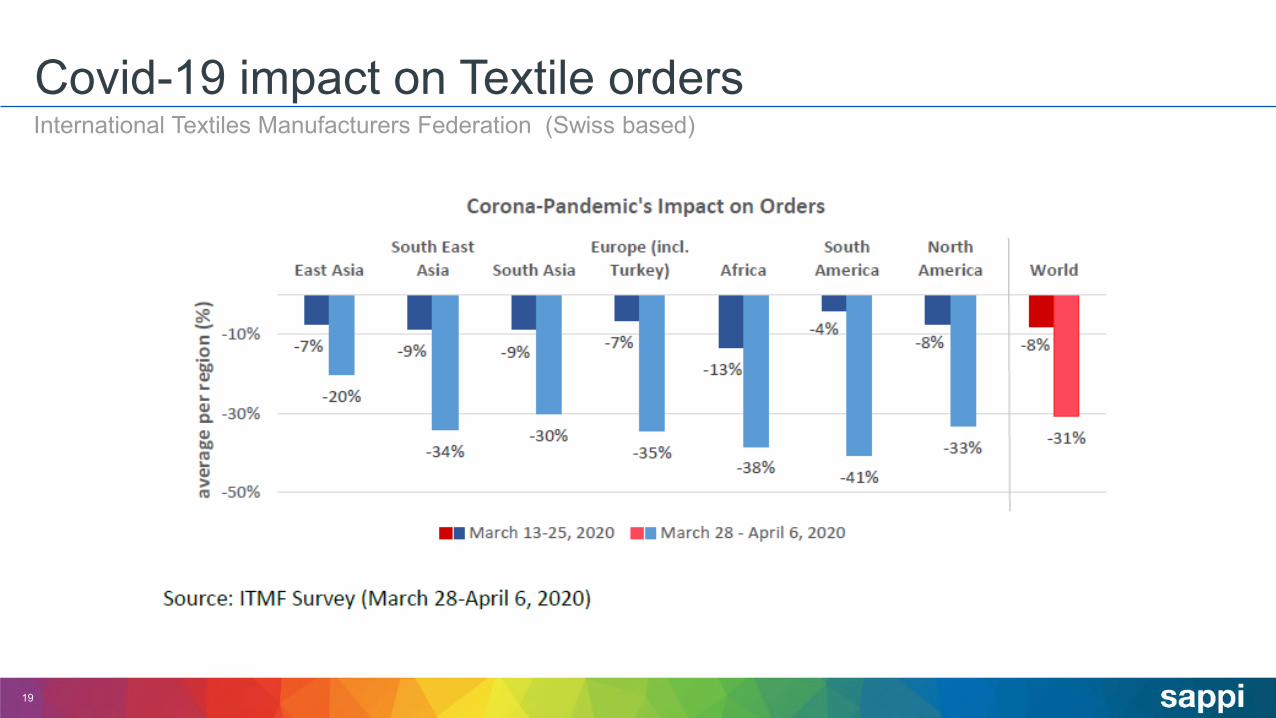
Covid-19 impact on Textile ordersInternational Textiles Manufacturers Federation (Swiss based)

Maintaina healthybalancesheet
Rationalisedeclining
businesses
Accelerate growth in
higher margin growth
segments
Achievecost
advantages
Improveoperational
and machineefficiencies
Maximiseprocurement
benefits Optimisebusiness
processes
Continuouslybalance
paper supplyand demandin all regions
Wherepossible
convert papermachines tohigher marginbusinesses
Optimiseworkingcapital
Strongcash
generationSmart
financing
Expandpaper
packaginggrades
Enhancespecialised celluloseportfolio
Extractvalue from our
biorefinerystream
Our group strategy
20
At Sappi we do business with integrity and courage; making smart decisions which we execute with speed.Our values are underpinned by an unrelenting focus on and commitment to safety.
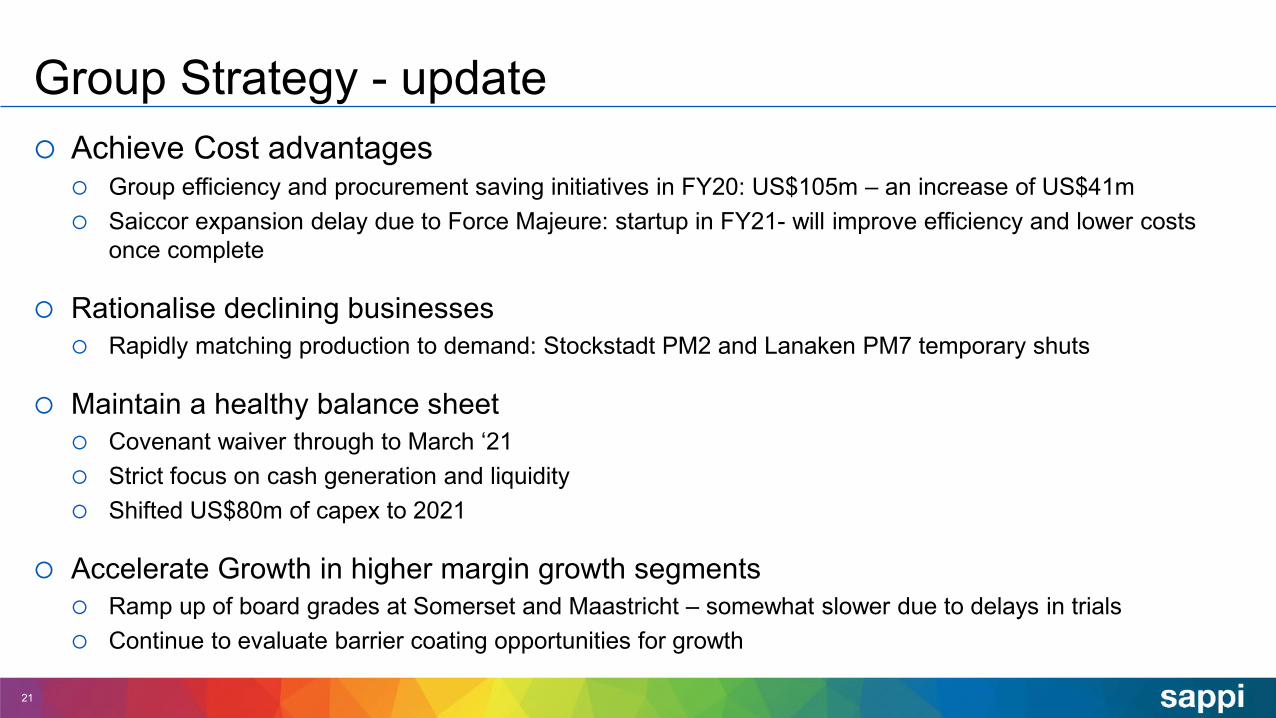
Group Strategy - update Achieve Cost advantages
Group efficiency and procurement saving initiatives in FY20: US$105m – an increase of US$41m Saiccor expansion delay due to Force Majeure: startup in FY21- will improve efficiency and lower costs
once complete
Rationalise declining businesses Rapidly matching production to demand: Stockstadt PM2 and Lanaken PM7 temporary shuts
Maintain a healthy balance sheet Covenant waiver through to March ‘21 Strict focus on cash generation and liquidity Shifted US$80m of capex to 2021
Accelerate Growth in higher margin growth segments Ramp up of board grades at Somerset and Maastricht – somewhat slower due to delays in trials Continue to evaluate barrier coating opportunities for growth
21

DP and Graphic paper demand expected to be significantly impacted
Focus on liquidity and cash flow – various cost savings measures implemented, excess production
curtailed, non-essential capital expenditure delayed and optimisation of working capital.
Packaging and specialities segment continues to grow and recent conversions will continue to
ramp up. Citrus outlook encouraging which will positively impact SA containerboard sales.
Saiccor expansion project completion likely only in FY2021 due to force majeure declaration.
Annual maintenance shuts shifted as late as possible and capital expenditure for remainder of
2020 expected to be US$200 million.
22
Outlook

Thank you
23

24
Supplementary information
Excluding special items*
25
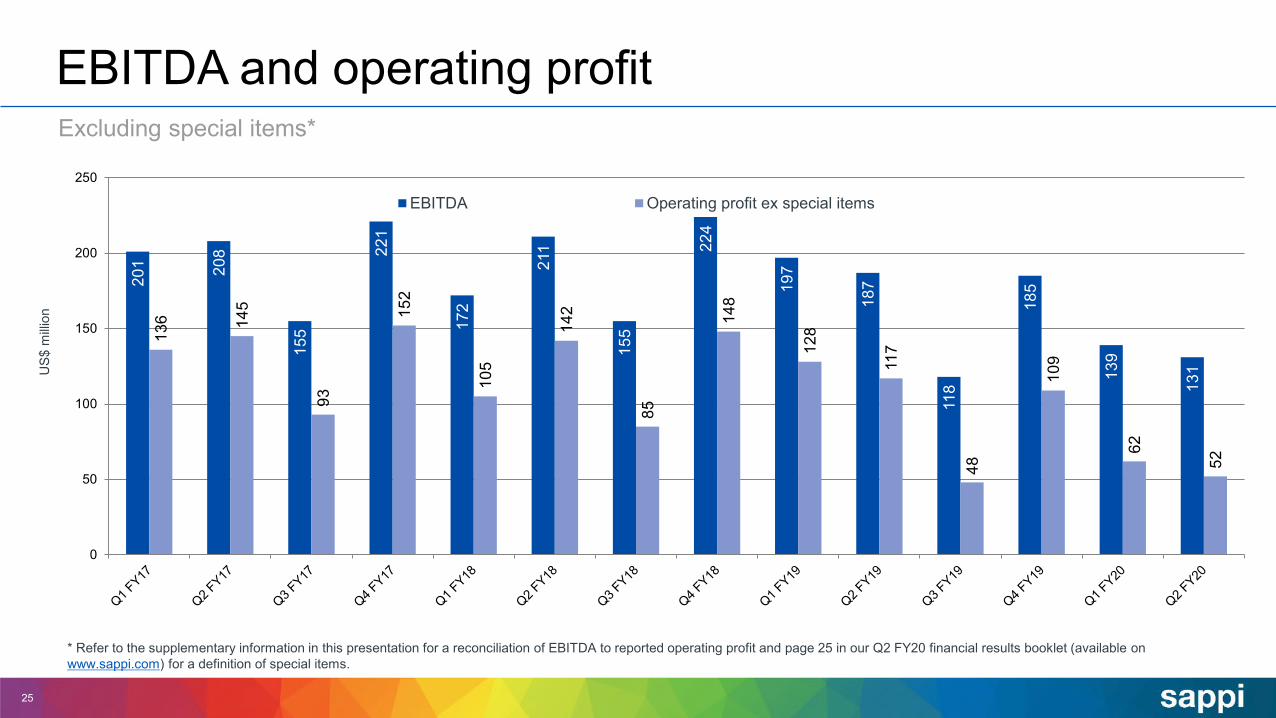
EBITDA and operating profit
* Refer to the supplementary information in this presentation for a reconciliation of EBITDA to reported operating profit and page 25 in our Q2 FY20 financial results booklet (available on www.sappi.com) for a definition of special items.
201 20
8
155
221
172
211
155
224
197
187
118
185
139
131
136 14
5
93
152
105
142
85
148
128
117
48
109
62
52
0
50
100
150
200
250
US$
milli
on
EBITDA Operating profit ex special items
26
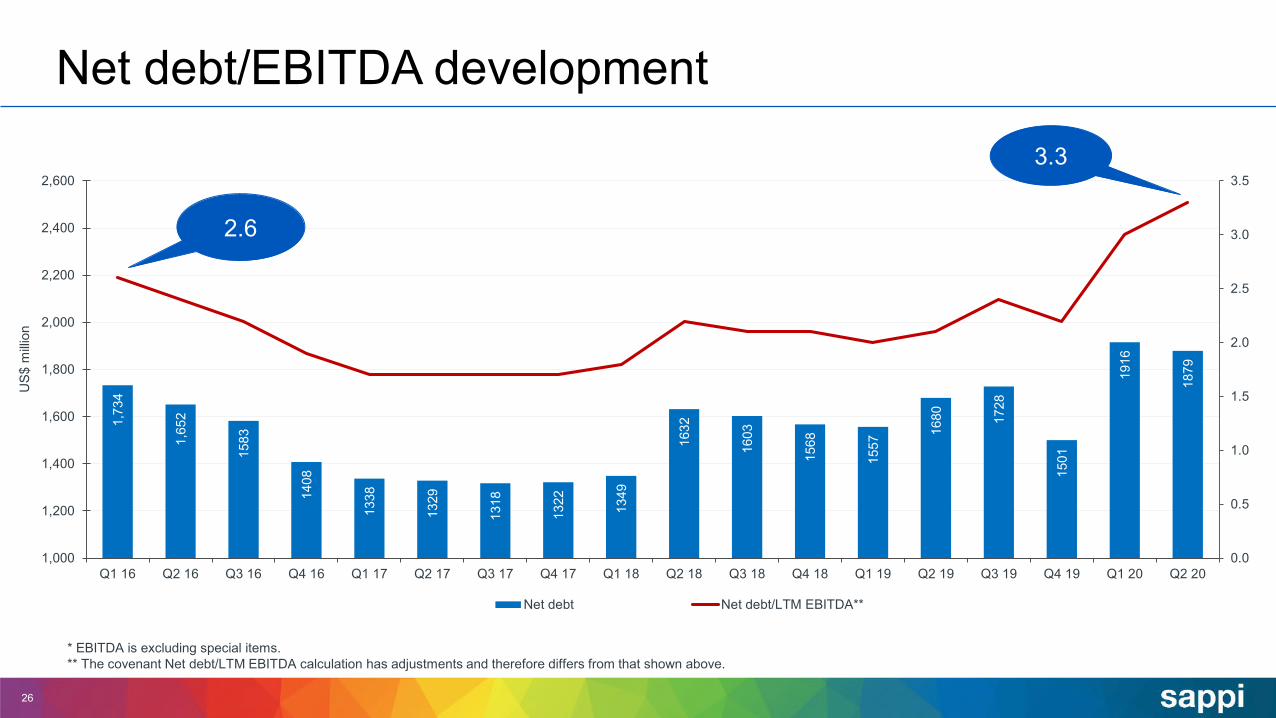
Net debt/EBITDA development
* EBITDA is excluding special items.** The covenant Net debt/LTM EBITDA calculation has adjustments and therefore differs from that shown above.
1,73
4
1,65
2
1583
1408
1338
1329
1318
1322 1349
1632
1603
1568
1557
1680 17
28
1501
1916
1879
0.0
0.5
1.0
1.5
2.0
2.5
3.0
3.5
1,000
1,200
1,400
1,600
1,800
2,000
2,200
2,400
2,600
Q1 16 Q2 16 Q3 16 Q4 16 Q1 17 Q2 17 Q3 17 Q4 17 Q1 18 Q2 18 Q3 18 Q4 18 Q1 19 Q2 19 Q3 19 Q4 19 Q1 20 Q2 20
US$
milli
on
Net debt Net debt/LTM EBITDA**
3.3
2.6
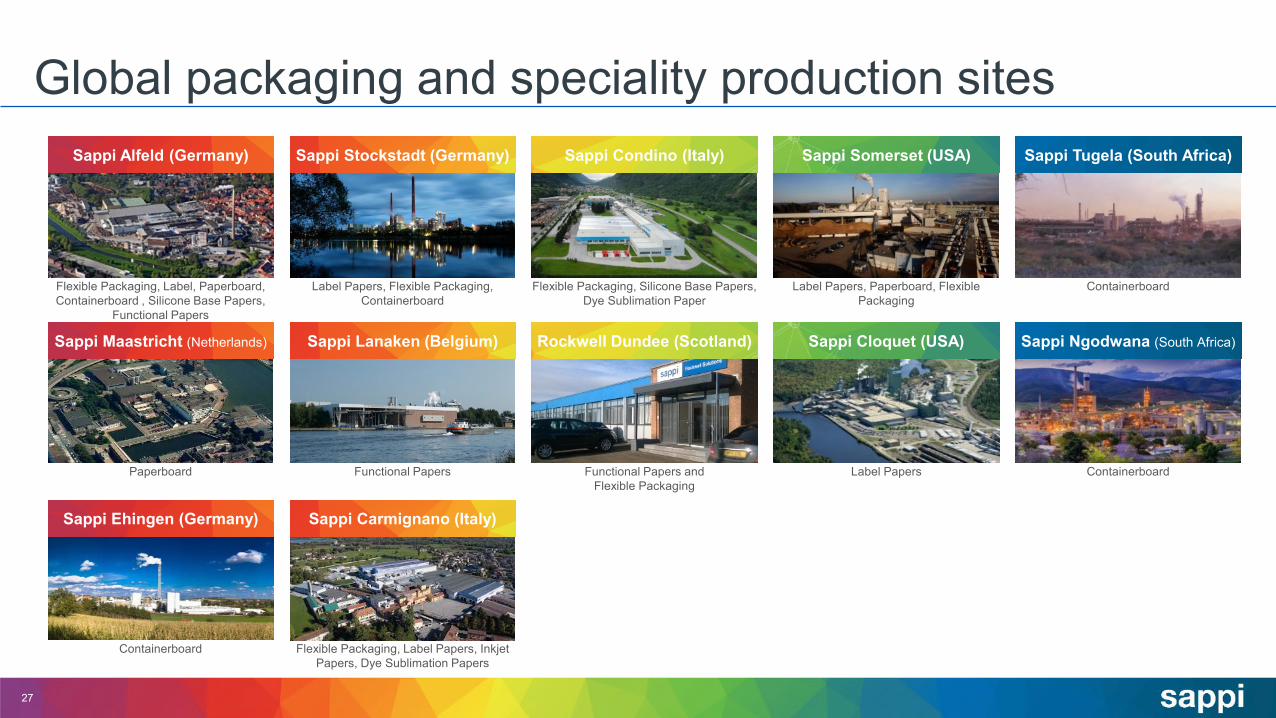
Global packaging and speciality production sitesSappi Somerset (USA)Sappi Alfeld (Germany) Sappi Tugela (South Africa)Sappi Stockstadt (Germany) Sappi Condino (Italy)
Label Papers, Paperboard, Flexible Packaging
Flexible Packaging, Label, Paperboard, Containerboard , Silicone Base Papers,
Functional Papers
ContainerboardLabel Papers, Flexible Packaging, Containerboard
Flexible Packaging, Silicone Base Papers, Dye Sublimation Paper
Sappi Cloquet (USA)Sappi Maastricht (Netherlands) Sappi Ngodwana (South Africa)Sappi Lanaken (Belgium) Rockwell Dundee (Scotland)
Label Papers ContainerboardPaperboard Functional Papers Functional Papers andFlexible Packaging
Sappi Ehingen (Germany)
Containerboard Flexible Packaging, Label Papers, Inkjet Papers, Dye Sublimation Papers
Sappi Carmignano (Italy)
27
Accelerategrowth in
higher margingrowth
segments
Extractvalue from our
biorefinerystream
Enhancespecialisedcelluloseportfolio
Expandpaper
packaginggrades
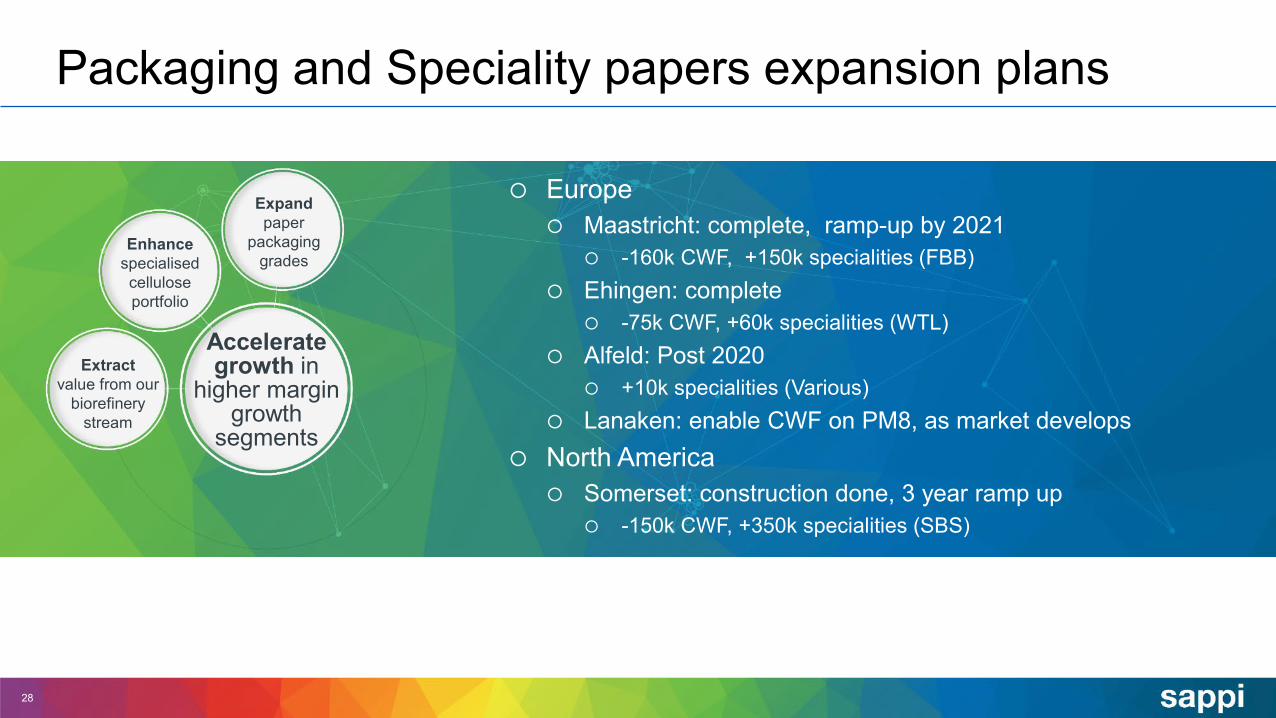
Packaging and Speciality papers expansion plans
28
Europe Maastricht: complete, ramp-up by 2021
-160k CWF, +150k specialities (FBB) Ehingen: complete
-75k CWF, +60k specialities (WTL) Alfeld: Post 2020
+10k specialities (Various) Lanaken: enable CWF on PM8, as market develops
North America Somerset: construction done, 3 year ramp up
-150k CWF, +350k specialities (SBS)

29
Product Groups and ProductsEU Packaging
and Specialities

Sappi North America packaging offering
30
C1S PaperPaperboard (SBS)
Label Paper Bag PaperFolding Carton
LithoLamination
Food service Board
Proto C1S, Spectro C1S
Proto Litho LusterFSBLusterPlate
Bristols
LusterCote LusterPrintSpectro (C1S & C2S)
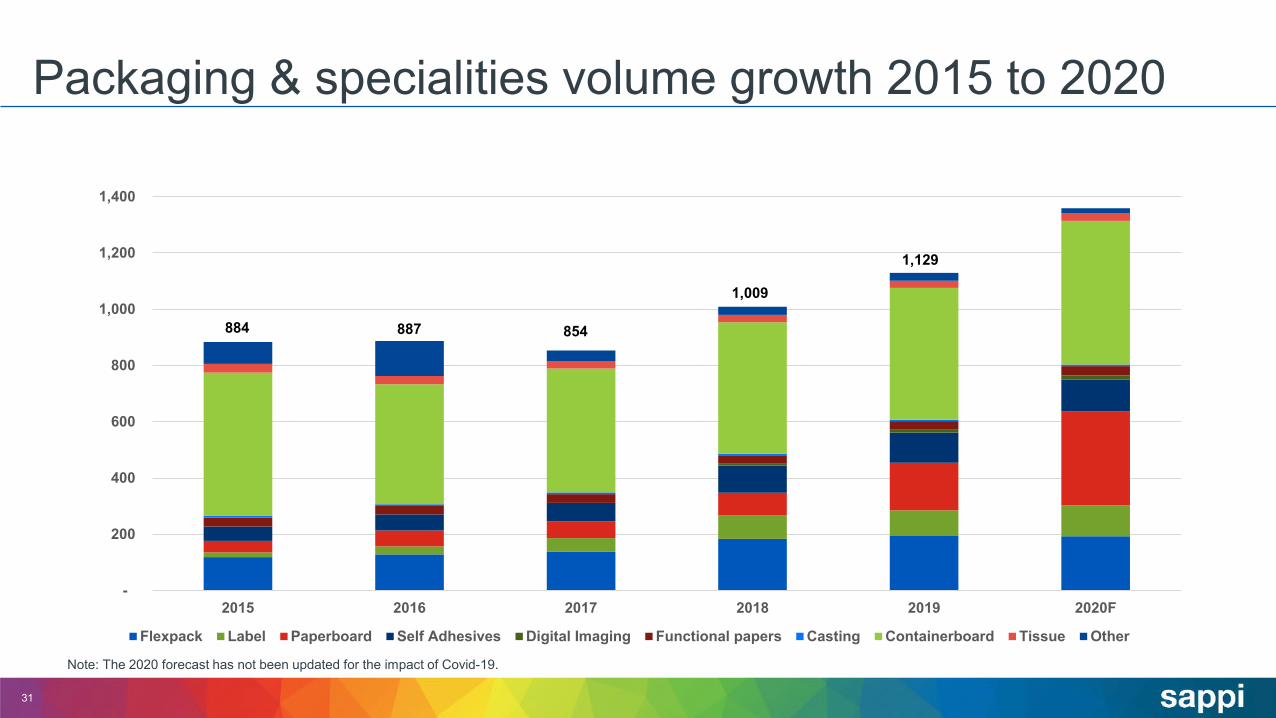
Packaging & specialities volume growth 2015 to 2020
31
-
200
400
600
800
1,000
1,200
1,400
2015 2016 2017 2018 2019 2020F
Flexpack Label Paperboard Self Adhesives Digital Imaging Functional papers Casting Containerboard Tissue Other
884 887 854
1,009
1,129
Note: The 2020 forecast has not been updated for the impact of Covid-19.
32
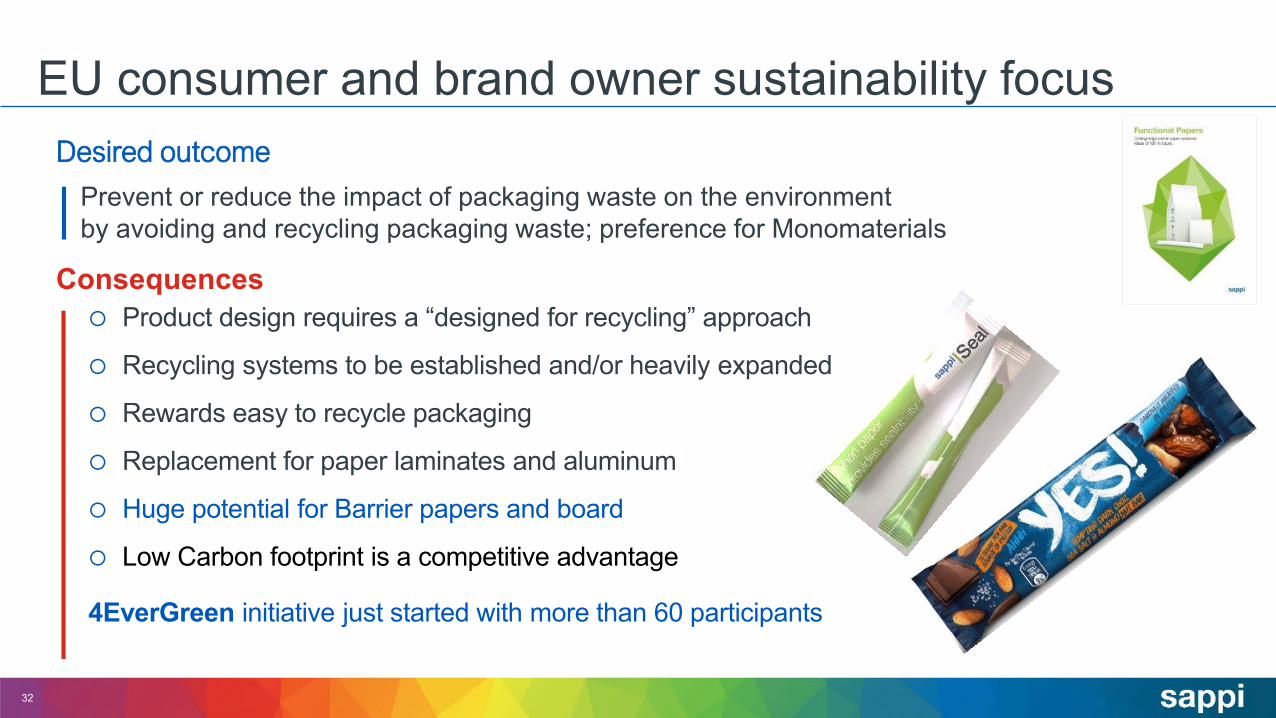
EU consumer and brand owner sustainability focusDesired outcome
Prevent or reduce the impact of packaging waste on the environment by avoiding and recycling packaging waste; preference for Monomaterials
Consequences Product design requires a “designed for recycling” approach
Recycling systems to be established and/or heavily expanded
Rewards easy to recycle packaging
Replacement for paper laminates and aluminum
Huge potential for Barrier papers and board
Low Carbon footprint is a competitive advantage
4EverGreen initiative just started with more than 60 participants
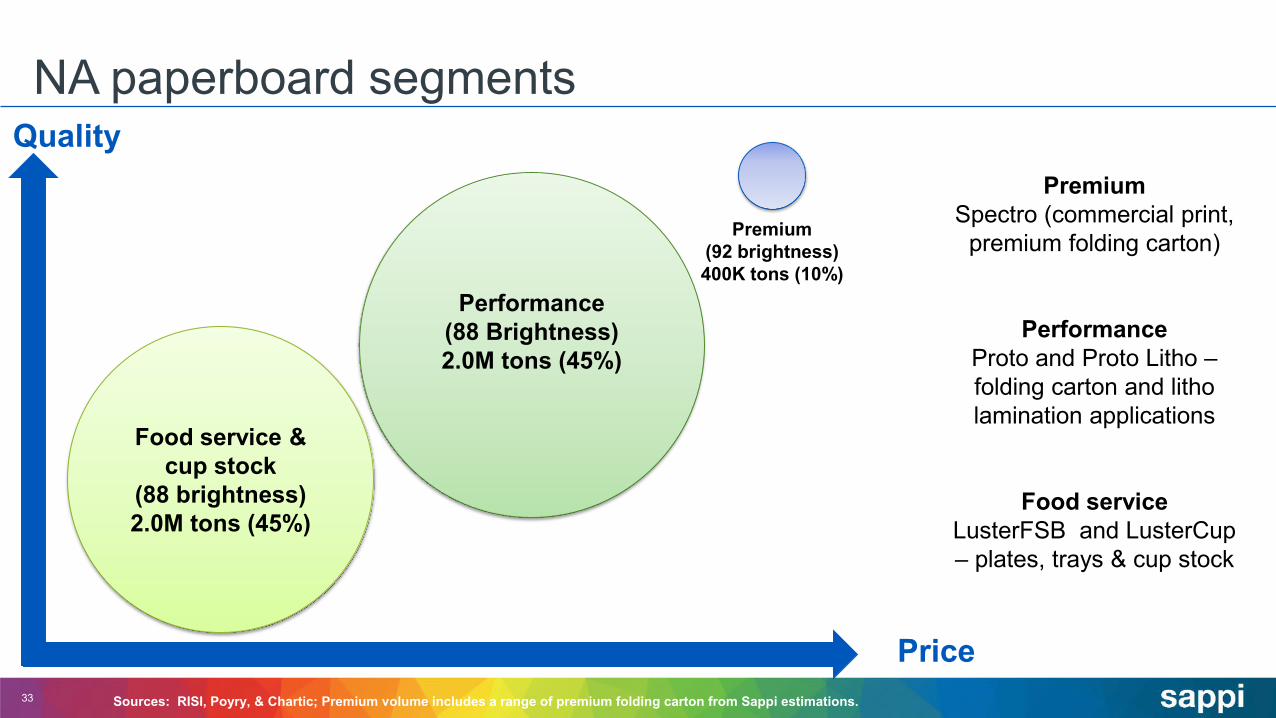
NA paperboard segments
33
PremiumSpectro (commercial print,
premium folding carton)
PerformanceProto and Proto Litho –folding carton and litho lamination applications
Food serviceLusterFSB and LusterCup – plates, trays & cup stock
Sources: RISI, Poyry, & Chartic; Premium volume includes a range of premium folding carton from Sappi estimations.
Performance (88 Brightness)2.0M tons (45%)
Premium (92 brightness)400K tons (10%)
Food service & cup stock
(88 brightness)2.0M tons (45%)
Price
Quality

SA total containerboard market – local market share
34
966
992
967
1,00
0 1,01
2
44%
36% 37% 37% 37%
0%
5%
10%
15%
20%
25%
30%
35%
40%
45%
50%
940
950
960
970
980
990
1,000
1,010
1,020
FY15 FY16 FY17 FY18 FY19
Market Size (kton) Sappi Market share
Sappi
MondiMpact
Corruseal
New Era
NeopakOther+Import
Market Split Includes Cape Kraft and Enstra
The above market size includes virgin and recycled containerboard
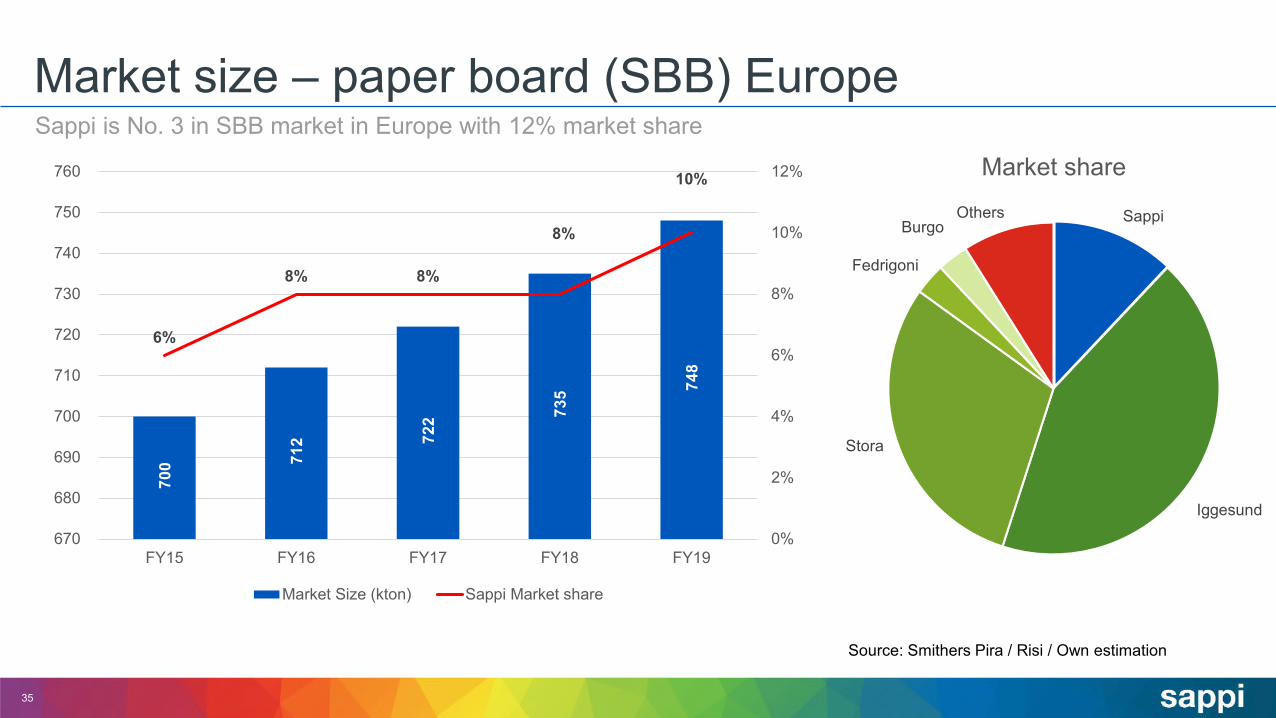
Market size – paper board (SBB) EuropeSappi is No. 3 in SBB market in Europe with 12% market share
35
700 71
2 722 73
5 748
6%
8% 8%
8%
10%
0%
2%
4%
6%
8%
10%
12%
670
680
690
700
710
720
730
740
750
760
FY15 FY16 FY17 FY18 FY19
Market Size (kton) Sappi Market share
Sappi
Iggesund
Stora
Fedrigoni
BurgoOthers
Market share
Source: Smithers Pira / Risi / Own estimation

Market size – flexible packaging EuropeSappi is the market leader in flexible packaging in Europe
36
1,45
5 1,48
3 1,51
2 1,53
4 1,55
7
8%9% 9%
12%13%
0%
2%
4%
6%
8%
10%
12%
14%
1,400
1,420
1,440
1,460
1,480
1,500
1,520
1,540
1,560
1,580
FY15 FY16 FY17 FY18 FY19
Market Size (kton) Sappi Market share
Sappi
Billerud
Mondi
Ahlstrom
Others
Market share
Source: Smithers Pira / Risi / Own estimation
Capacity Limit reached
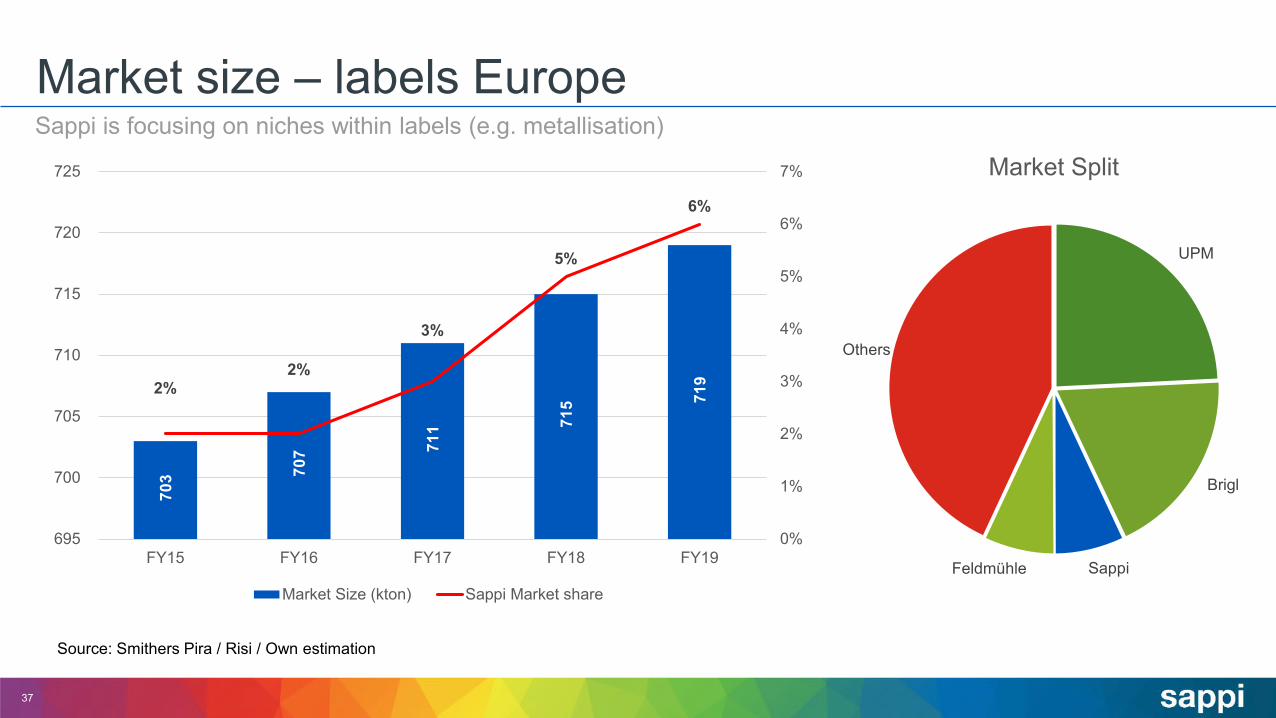
Market size – labels EuropeSappi is focusing on niches within labels (e.g. metallisation)
37
703 70
7 711 71
5 719 2%
2%
3%
5%
6%
0%
1%
2%
3%
4%
5%
6%
7%
695
700
705
710
715
720
725
FY15 FY16 FY17 FY18 FY19
Market Size (kton) Sappi Market share
UPM
Brigl
SappiFeldmühle
Others
Market Split
Source: Smithers Pira / Risi / Own estimation

Market size – self-adhesive EuropeSappi is No. 3 in Europe after UPM and Ahlstrom
38
491 50
2 512 52
2 533
10%11%
13%
18%
20%
0%
5%
10%
15%
20%
25%
470
480
490
500
510
520
530
540
FY15 FY16 FY17 FY18 FY19
Market Size (kton) Sappi Market share
UPM
Ahlstrom
Sappi
Delfort
Others
Market split
Source: Smithers Pira / Risi / Own estimation
Capacity limit reached

Market size – digital solutions EuropeSappi is market leader in dye sublimation in Europe
39
35 40
45 50
58
17%
25%
0
0.05
0.1
0.15
0.2
0.25
0.3
-
10
20
30
40
50
60
70
FY15 FY16 FY17 FY18 FY19
Market Size (kton) Sappi Market share
Sappi
Neenah
F. Schoeller
Beaver
Hansol
Others
Market split
Sappi Neenah F. SchoellerBeaver Hansol Others
Source: Smithers Pira / Pöyry / Risi / Own estimation
40
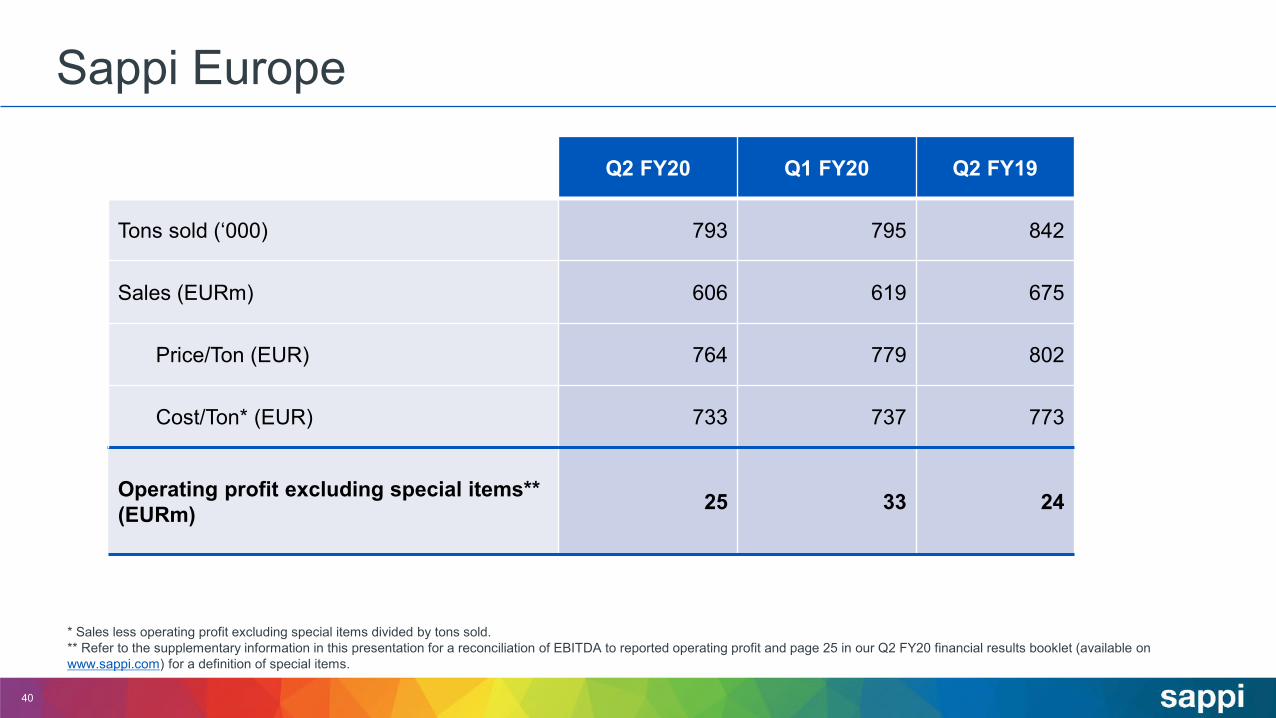
Sappi Europe
* Sales less operating profit excluding special items divided by tons sold.** Refer to the supplementary information in this presentation for a reconciliation of EBITDA to reported operating profit and page 25 in our Q2 FY20 financial results booklet (available on www.sappi.com) for a definition of special items.
Q2 FY20 Q1 FY20 Q2 FY19
Tons sold (‘000) 793 795 842
Sales (EURm) 606 619 675
Price/Ton (EUR) 764 779 802
Cost/Ton* (EUR) 733 737 773
Operating profit excluding special items**(EURm) 25 33 24
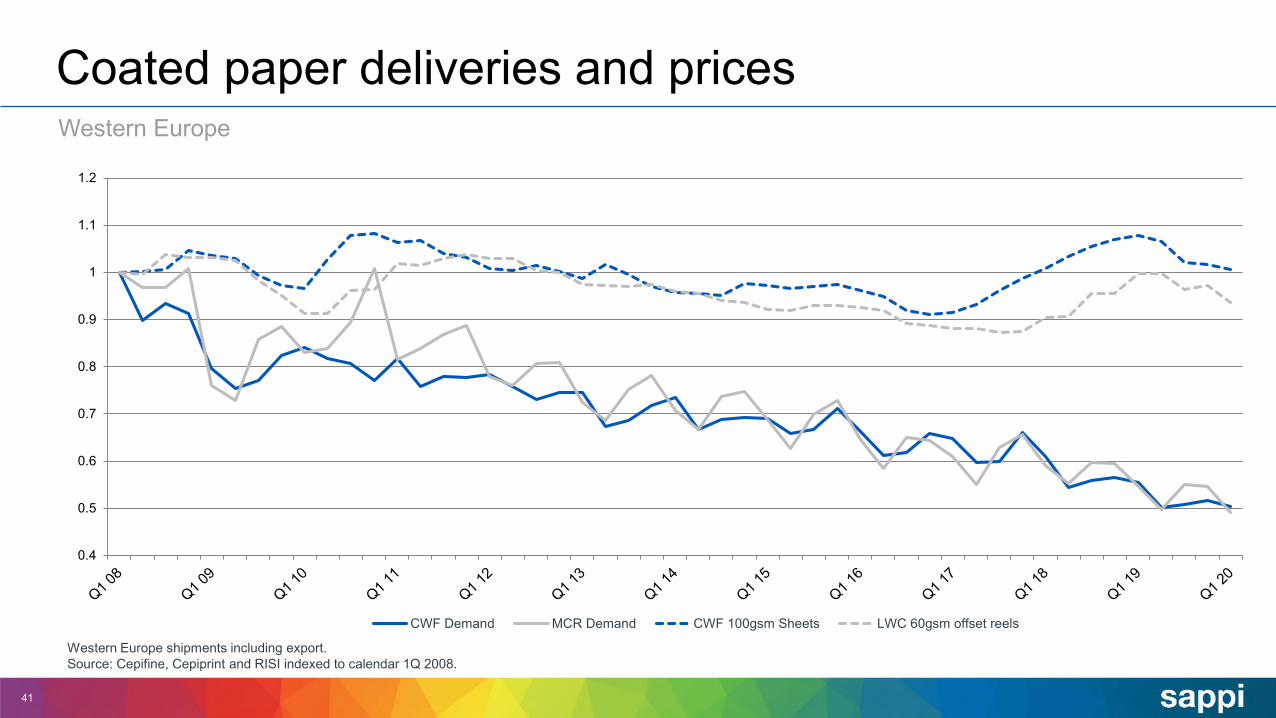
Western Europe
41
Coated paper deliveries and prices
Western Europe shipments including export.Source: Cepifine, Cepiprint and RISI indexed to calendar 1Q 2008.
0.4
0.5
0.6
0.7
0.8
0.9
1
1.1
1.2
CWF Demand MCR Demand CWF 100gsm Sheets LWC 60gsm offset reels
42
Sappi North America
* Sales less operating profit excluding special items divided by tons sold.** Refer to the supplementary information in this presentation for a reconciliation of EBITDA to reported operating profit and page 25 in our Q2 FY20 financial results booklet (available on www.sappi.com) for a definition of special items.
Q2 FY20 Q1 FY20 Q2 FY19
Tons sold (‘000) 416 377 350
Sales (USDm) 387 370 378
Price/Ton (USD) 930 981 1,080
Cost/Ton* (USD) 921 979 1,051
Operating profit excluding special items**(USDm) 4 1 10
United States of America
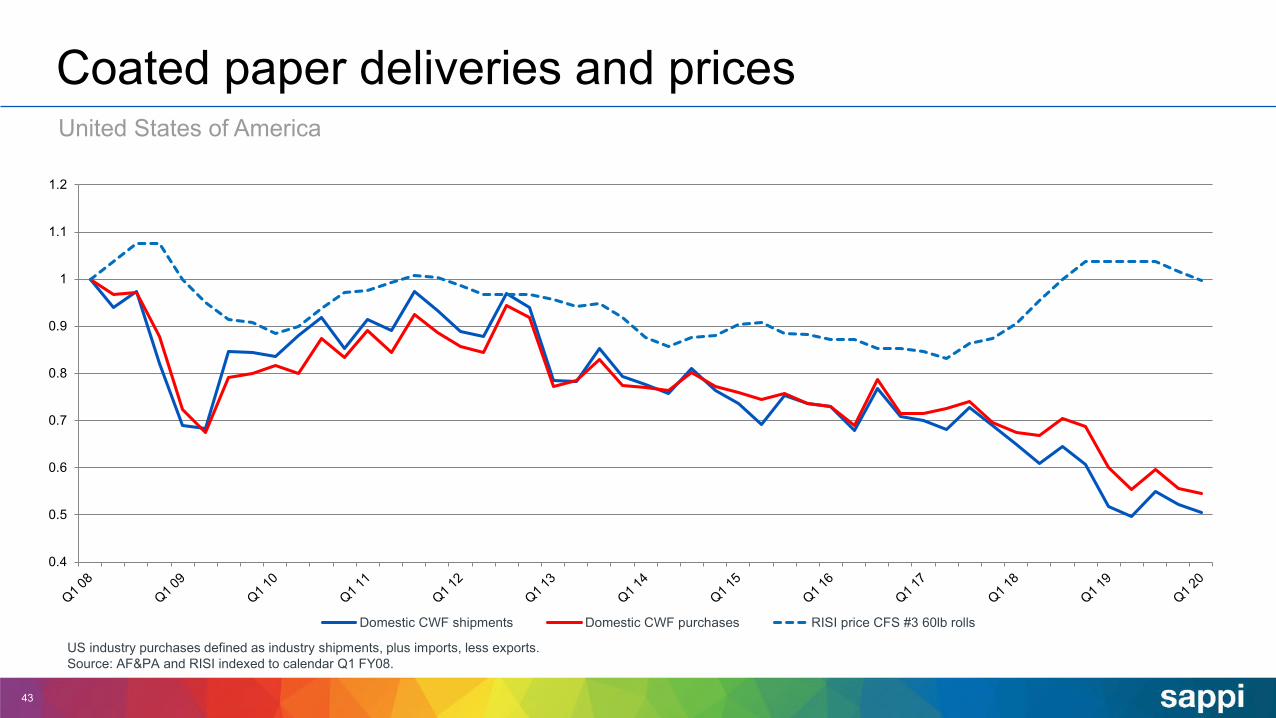
43
Coated paper deliveries and prices
US industry purchases defined as industry shipments, plus imports, less exports.Source: AF&PA and RISI indexed to calendar Q1 FY08.
0.4
0.5
0.6
0.7
0.8
0.9
1
1.1
1.2
Domestic CWF shipments Domestic CWF purchases RISI price CFS #3 60lb rolls

44
Sappi South Africa
* Sales less operating profit excluding special items divided by tons sold.** Refer to the supplementary information in this presentation for a reconciliation of EBITDA to reported operating profit and page 25 in our Q2 FY20 financial results booklet (available on www.sappi.com) for a definition of special items.
Q2 FY20 Q1 FY19 Q2 FY19
Tons sold (‘000) 389 338 418
Sales (ZARm) 3,979 3,549 4,982
Price/Ton (ZAR) 10,229 10,500 11,919
Cost/Ton* (ZAR) 9,404 9,541 9,237
Operating profit excluding special items**(ZARm) 321 324 1,121
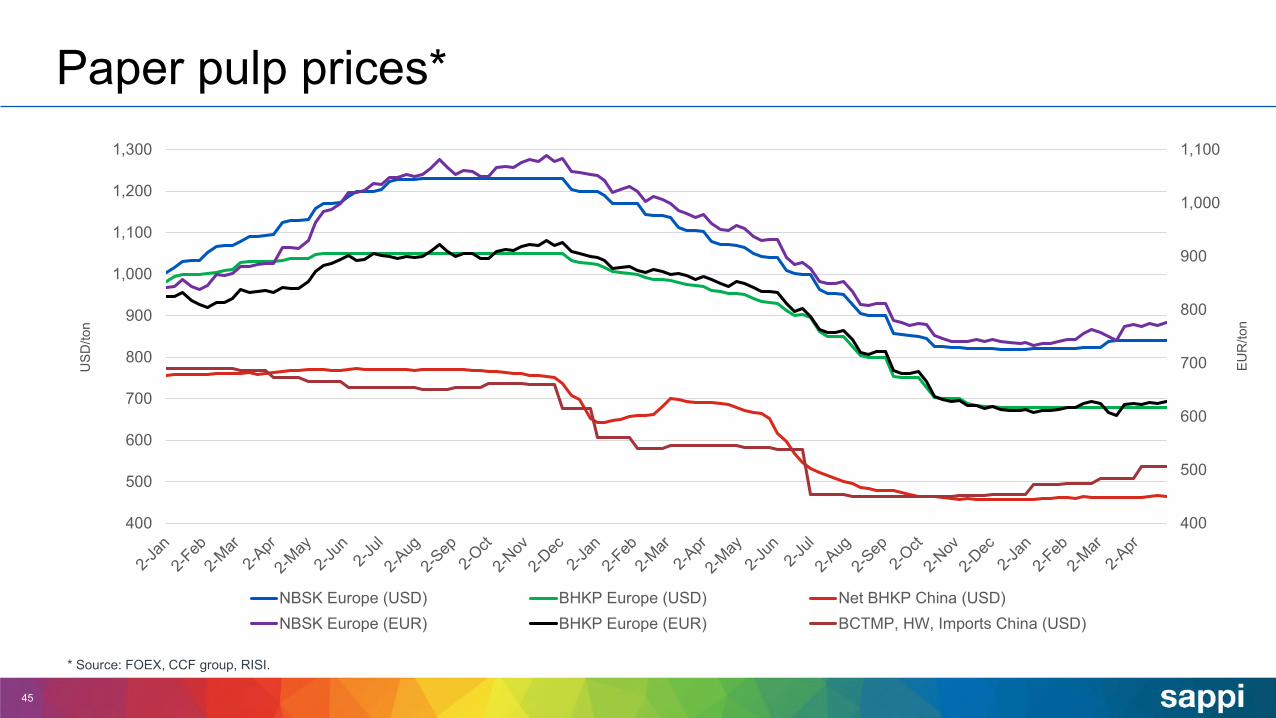
45
Paper pulp prices*
* Source: FOEX, CCF group, RISI.
EUR
/ton
400
500
600
700
800
900
1,000
1,100
400
500
600
700
800
900
1,000
1,100
1,200
1,300
NBSK Europe (USD) BHKP Europe (USD) Net BHKP China (USD)NBSK Europe (EUR) BHKP Europe (EUR) BCTMP, HW, Imports China (USD)
USD
/ton
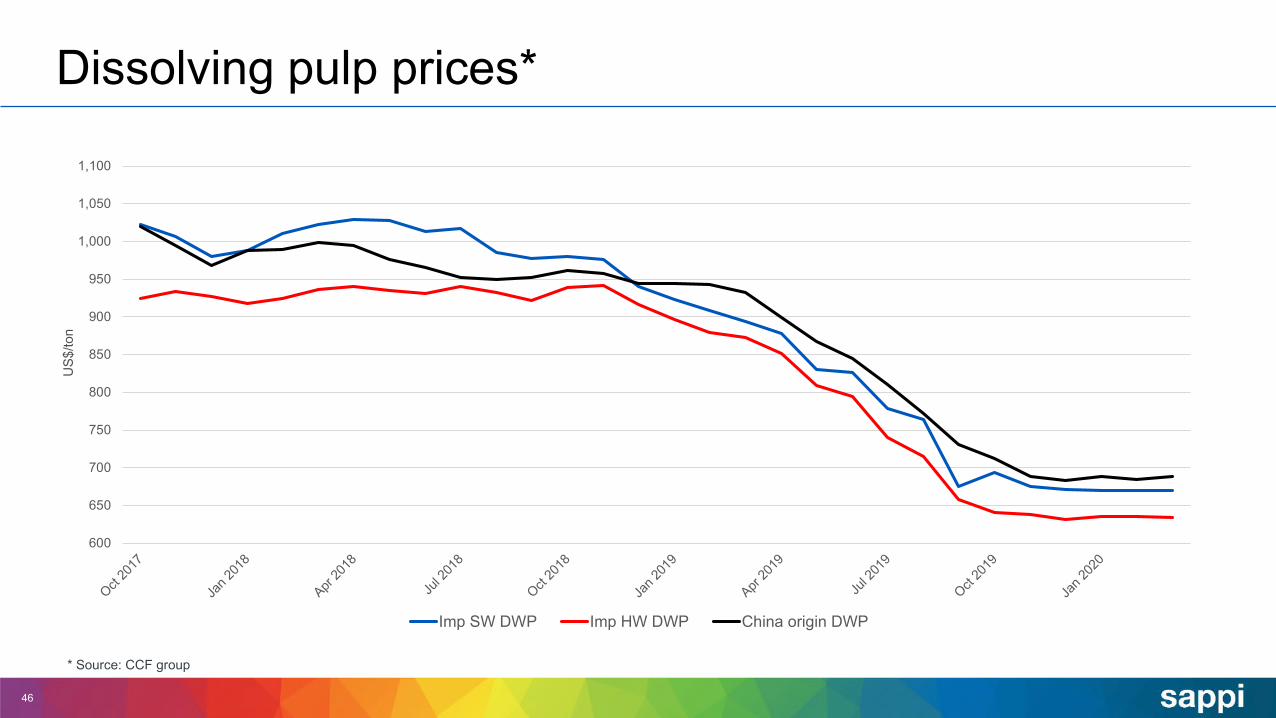
46
Dissolving pulp prices*
* Source: CCF group
600
650
700
750
800
850
900
950
1,000
1,050
1,100
Imp SW DWP Imp HW DWP China origin DWP
US$
/ton

47
Textile fibre prices*
* Source: CCF group
US$
/ton
0
500
1,000
1,500
2,000
2,500
3,000
Cotton 328 Cotton "A" Index PSF 1.4 D VSF 1.2 D VSF 1.5 D

Cash flow
48
US$m Q2 FY20 Q1 FY20 Q2 FY19
Cash generated from operations 116 136 182Movement in working capital (14) (76) (80)
Net finance costs paid (18) (35) (21)
Finance income received 1 2 1
Taxation (paid) refund (11) (32) (43)
Dividend paid - - (92)
Cash generated from operating activities 74 (5) (53)
Cash utilised in investing activities (74) (273) (95)Capital expenditure (70) (112) (95)
Proceeds on disposal of assets - - 1
Acquisition of subsidiary - (158) -
Other non-current asset movements (4) (3) (1)
Net cash generated (utilised) - (278) (148)
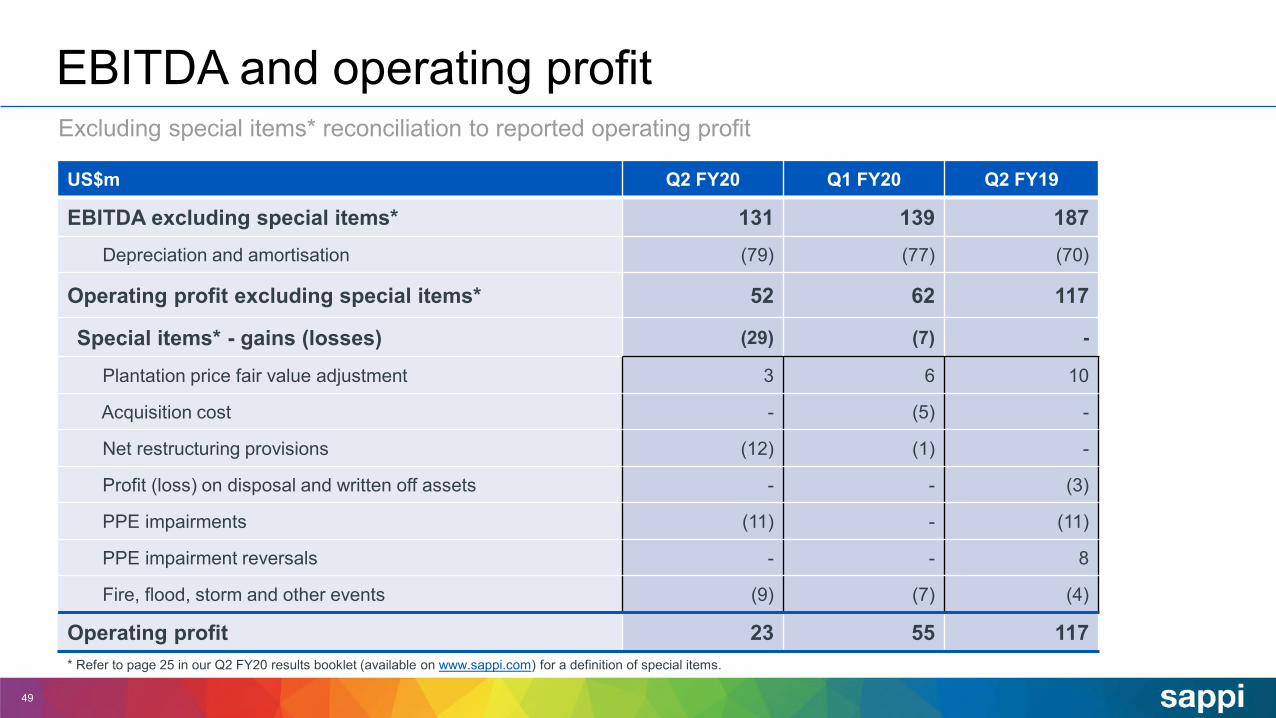
Excluding special items* reconciliation to reported operating profit
49
EBITDA and operating profit
* Refer to page 25 in our Q2 FY20 results booklet (available on www.sappi.com) for a definition of special items.
US$m Q2 FY20 Q1 FY20 Q2 FY19
EBITDA excluding special items* 131 139 187Depreciation and amortisation (79) (77) (70)
Operating profit excluding special items* 52 62 117
Special items* - gains (losses) (29) (7) -
Plantation price fair value adjustment 3 6 10
Acquisition cost - (5) -
Net restructuring provisions (12) (1) -
Profit (loss) on disposal and written off assets - - (3)
PPE impairments (11) - (11)
PPE impairment reversals - - 8
Fire, flood, storm and other events (9) (7) (4)
Operating profit 23 55 117
Thank you
50