Embed Size (px)
Citation preview

Q2FY18 Performance Review25th October 2017

2
Q2FY18 Snapshot
Q2FY18 Business Wise Sales Split
Domestic83%
IMD14%
CSD3%
Consolidated Revenues (including GST/VAT) grew by 14% during the
quarter with volumes growing by 10%.
Reported Revenue from Operations grew by 8%
Domestic Revenues grew by 14% with volumes growing by 10%
International Business grew by 22%
CSD Business declined by 20%
EBIDTA and PAT grew by 15% and 49% respectively during the
quarter.
Note: Like to Like Revenue Growth (including GST/VAT) has been reported in this presentation

Sales PerformancePerformance update for Q2FY18
3

4
BoroPlus Range
BoroPlus range grew by 38% during the quarter led by a strong growth in Antiseptic Creams.
Launched BoroPlus Zero Oil Zero Pimple Face Wash during the quarter-
Enriched with Multani Mitti and Neem extracts to stop recurrence of pimples
Endorsed by Bollywood actress Kriti Sanon

5
Navratna Range
Navratna range grew by 16% during the quarter led by a double digit volume growth in both Cool Oils and Cool
Talc.
Introduced new SKU’s in the portfolio to enhance penetration
Navratna Extra Thanda- 250ml (+Free 50 ml)
Navratna Almond Cool Oil – 200 ml & 15 ml
Navratna i-COOL Blast - 50gm and 400gm

6
Pain Management Range
Pain Management Range grew by 15% during the quarter.
Balms posted double digit volume growth led by a robust growth in Mentho Plus Balm.
New launches – Zandu Gel, Zandu Spray and Zandu Roll On scaling up well
Zandu Gel associated with Mumbai’s kabaddi team “U Mumba” as its title sponsor in the Pro Kabaddi League.
7
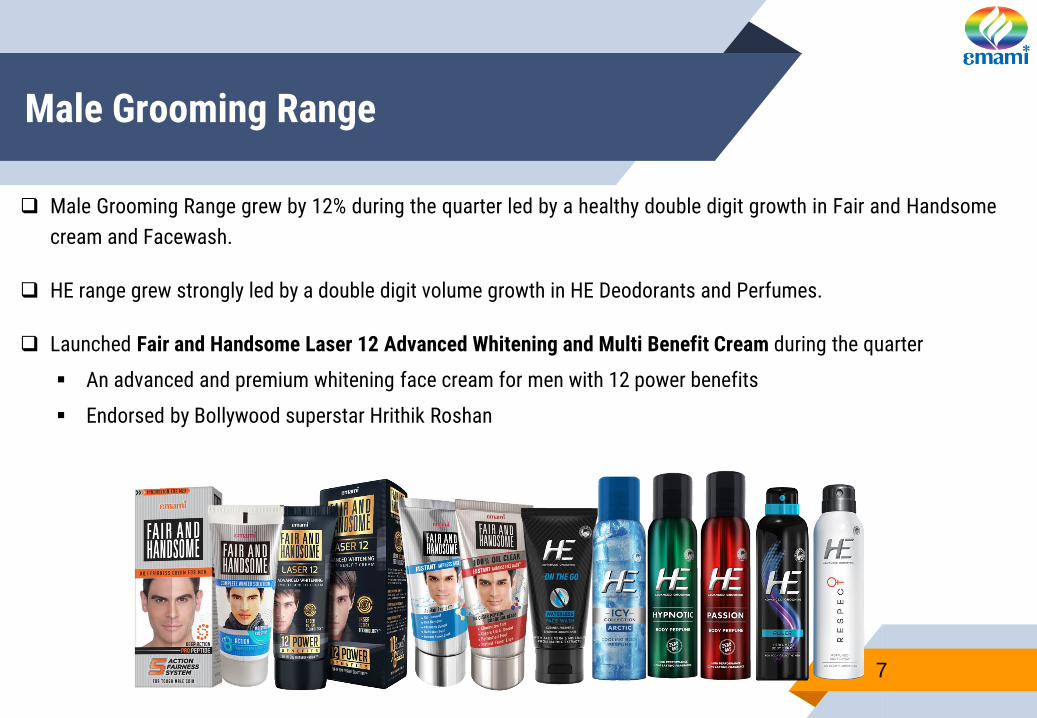
Male Grooming Range
Male Grooming Range grew by 12% during the quarter led by a healthy double digit growth in Fair and Handsome
cream and Facewash.
HE range grew strongly led by a double digit volume growth in HE Deodorants and Perfumes.
Launched Fair and Handsome Laser 12 Advanced Whitening and Multi Benefit Cream during the quarter
An advanced and premium whitening face cream for men with 12 power benefits
Endorsed by Bollywood superstar Hrithik Roshan

8
Kesh King Range
Challenging trade sentiment in the wholesale channel and rural markets continued to impact the performance.
Kesh King Range declined by 16% during the quarter.
New Campaign of ‘Ayurved Ka King’ launched in major dailies & popular TV channels.

9
Healthcare Range
Healthcare range grew by 2% during the quarter due to subdued performance of Pancharishtha
Nityam continued to post robust growth led by Nityam Tablets
Generics and Ethicals posted double digit volume growth.

10
Other Brands
7 Oils in One continued to report double digit volume growth and sales of Vasocare Petroleum Jelly more than
doubled during the quarter.
Launched “ammonia-free” Diamond Shine Luxury Crème Hair Colour during the quarter
Enriched with Diamond Serum and 11 Ayurvedic Herbs & Conditioners, that give the hair amazing shine &
superior softness and ensure the colour lasts twice as long.
Endorsed by Bollywood actress Shilpa Shetty

11
International Business
SAARC45%
MENAP25%
CIS13%
AFRICA9%
OTHERS8%
IMDH1FY18
Cluster WiseContribution
SAARC South Asian Association forRegional Cooperation
MENAP: Middle East, North Africa &Pakistan
CIS: Commonwealth of IndependentStates
International Business grew by 22% during the quarter led by a
robust performance in SAARC and African markets.
MENAP posted a high single digit growth
Reported Market share gains across majority of the portfolio.

Financial AnalysisEarnings analysis for Q2FY18
12

13
Q2FY18 Financial Analysis
Cost of Goods Sold(as a % of Sales)
-80 bps
Q2FY17 Q2FY18
33.5%
32.7%
Staff Costs(as a % of Sales)
+ 40 bps
Q2FY17 Q2FY18
10.1%10.5%
A&P Spends(₹ in Millions)
Q2FY17 Q2FY18
992 988
Interest Paid(₹ in Millions)
Q2FY17 Q2FY18
160
104
Other Income(₹ in Millions)
Q2FY17 Q2FY18
87
53
Admin & Other Exp(as a % of Sales)
- 30 bps
Q2FY17 Q2FY18
9.3%9.0%
- 130 bps

14
Q2FY18 Summarized Financials
₹ in Millions
Particulars Q2FY18 % Q2FY17 % Growth % FY17 %
Revenue from Operations (including GST/ VAT) 7,125 113.4% 6,253 107.2% 13.9% 27,168 107.3%
Less : GST/VAT (844) (13.4%) (418) (7.2%) 101.9% (1,842) (7.3%)
Revenue from Operations 6,281 100.0% 5,835 100.0% 7.6% 25,326 100.0%
Materials Cost 2,053 32.7% 1,955 33.5% 5.0% 8,825 34.8%
A&P 988 15.7% 992 17.0% -0.4% 4,428 17.5%
Staff Cost 659 10.5% 591 10.1% 11.5% 2,242 8.9%
Admn & Other Exp. 568 9.0% 545 9.3% 4.3% 2,240 8.8%
EBIDTA 2,013 32.1% 1,752 30.0% 14.9% 7,591 30.0%
Other Income 53 0.9% 87 1.5% -38.3% 311 1.2%
Interest 104 1.7% 160 2.7% -35.0% 580 2.3%
Amortisation of TM’s/ brands 604 9.6% 680 11.6% -11.1% 2,617 10.3%
Depreciation/Amortisation of other assets 146 2.3% 111 1.9% 31.8% 469 1.9%
PBT 1,213 19.3% 889 15.2% 36.5% 4,236 16.7%
Tax 226 3.6% 228 3.9% -0.7% 832 3.3%
PAT 987 15.7% 661 11.3% 49.3% 3,404 13.4%
Cash Profit (PAT + Dep. & Amortization) 1,737 27.7% 1,452 24.9% 19.7% 6,490 25.6%
EPS - Rs. 4.3 0.1% 2.9 49.3% 15.0 0.1%
Cash EPS- Rs. 7.7 6.4 19.7% 28.6

15
H1FY18 Summarized Financials
₹ in Millions
Particulars H1FY18 % of Sales H1FY17 % of Sales Growth % FY17 % of Sales
Revenue from Operations (including GST/ VAT) 12,975 111.0% 13,218 107.6% -1.8% 27,168 107.3%
Less : GST/VAT (1,283) (11.0%) (929) (7.6%) 38.1% (1,842) (7.3%)
Revenue from Operations 11,692 100.0% 12,289 100.0% -4.9% 25,326 100.0%
Materials Cost 4,035 34.5% 4,264 34.7% -5.4% 8,825 34.8%
A&P 2,416 20.7% 2,526 20.6% -4.4% 4,428 17.5%
Staff Cost 1,286 11.0% 1,178 9.6% 9.2% 2,242 8.9%
Admn & Other Exp. 1,140 9.7% 1,097 8.9% 3.9% 2,240 8.8%
EBIDTA 2,815 24.1% 3,225 26.2% -12.7% 7,591 30.0%
Other Income 118 1.0% 137 1.1% -13.9% 311 1.2%
Interest 183 1.6% 285 2.3% -35.7% 580 2.3%
Amortisation of TM’s/ brands 1,202 10.3% 1,289 10.5% -6.7% 2,617 10.3%
Depreciation/Amortisation of other assets 299 2.6% 217 1.8% 37.7% 469 1.9%
PBT 1,249 10.7% 1,572 12.8% -20.5% 4,236 16.7%
Tax 252 2.2% 344 2.8% -26.7% 832 3.3%
PAT 997 8.5% 1,228 10.0% -18.8% 3,404 13.4%
Cash Profit (PAT + Dep. & Amortization) 2,498 21.4% 2,733 22.2% -8.6% 6,490 25.6%
EPS - Rs. 4.4 0.0% 5.4 -18.8% 15.0 0.1%
Cash EPS- Rs. 11.0 12.0 -8.6% 28.6

16
Summarized Balance Sheet
₹ in Millions
Unaudited Audited Unaudited Audited
As at
30.09.17
As at
31.03.17
As at
30.09.17
As at
31.03.17
Equity Non -Current Assets
Equity Share capital 227 227 Property, Plant and Equipment 6,841 6,966
Other Equity 17,331 17,320 Capital work-in-progress 571 129
Equity attributable to owners of the company 17,559 17,547 Investment Property 530 538
Non-Controlling Interest 12 14 Intangible Assets 11,186 12,393
Total Equity 17,570 17,561 Intangible assets under development 100 86
Goodwill on Consolidation 41 41
LIABILITIES Financial Assets
Non-Current Liabilities (i) Investments 1,365 944
Financial Liabilities (ii) Loans 59 48
(i) Other Financial Liabilities 117 117 Other Non-Current Assets 383 402
Provisions 268 239 21,077 21,547
Deferred tax liabilities (Net) 268 282 Current assets
Other Non-Current Liabilities 12 13 Inventories 1,832 1,792
665 650 Financial Assets
Current liabilities (i) Investments 2,048 333
Financial Liabilities (ii) Trade Receivables 1,537 970
(i) Borrowings 5,655 1,730 (iii) Cash & Cash Equivalents 405 284
(ii) Trade Payables 2,645 1,847 (iv) Bank Balances other than (iii) above 226 217
(iii) Other Financial Liabilities 1,066 3,380 (iv) Loans 76 39
Other Current Liabilities 260 229 (v) Others Financial Assets 14 12
Provisions 649 590 Current Tax Assets (Net) 231 9
Current Tax Liabilities (Net) 56 - Other Current Assets 1,123 783
10,332 7,776 7,492 4,439
Total Equity and Liabilities 28,568 25,987 Total Assets 28,568 25,987
ASSETSEQUITY AND LIABILITIES

17
Awards & Accolades
He On The Go Waterless Face Wash received 2 prestigious awards for
its campaign “The Flying Basin”
Engage 2017 - Best Practices Award for ‘Video Content for
Marketing & Promotion’ by Public Relations Society of India,
Kolkata Chapter
Indian Content Marketing Award - Best Content Marketing
Launch/Relaunch’ category award by Exchange4media
Manufacturing Units participated in different quality circle
competitions and won more than 18 awards (in Par Excellence, Gold &
Silver categories).

Thank You