Embed Size (px)
Citation preview
Q3 2014 Conference Call
Business & Financial Update, December 1, 2014

2

Participants and Agenda
Participants
• Ed Martin, CEO, Nalcor Energy
– Corporate Overview and Key Accomplishments
• Derrick Sturge, CFO, Nalcor Energy
– Q3 2014 Financial Results
• Conference Call and Webinar
4
Forward-Looking Information
Certain statements in this presentation are “forward-looking statements” based on Nalcor’s current expectations, estimates, projections and assumptions, subject to risks and uncertainties. Statements containing words such as “could”, “expect”, “may”, “anticipate”, “believe”, “intend”, “estimate”, “plan” and similar expressions constitute forward-looking statements. By their nature, forward-looking statements require Management to make assumptions and are not subject to important unknown risks and uncertainties, which may cause actual results in future periods to differ materially from forecasted results. While Management considers these assumptions to be reasonable and appropriate based on information currently available, there is a risk that they may not be accurate. Nalcor assumes no obligation to update or revise any forward-looking statements, whether as a result of new information, future events or any other reason.
5
Corporate Overview: Long-term
Our Potential
• Energy is a globally strategic resource, both oil/gas and hydroelectric
• Our province has an abundance of both
• Leadership and control is essential for ensuring full benefit for people of NL forever
• We are well positioned for a step change in prosperity
• Nalcor is a key element of the strategy
7
Nalcor – Newfoundland and Labrador’s Energy Company
• Wholly owned by the people of the province
• Tasked to take a lead role in the development of our energy resources
• A tool for maximizing NL benefits
• Long-term value generator
– Profit focused with social and economic objectives
8
9
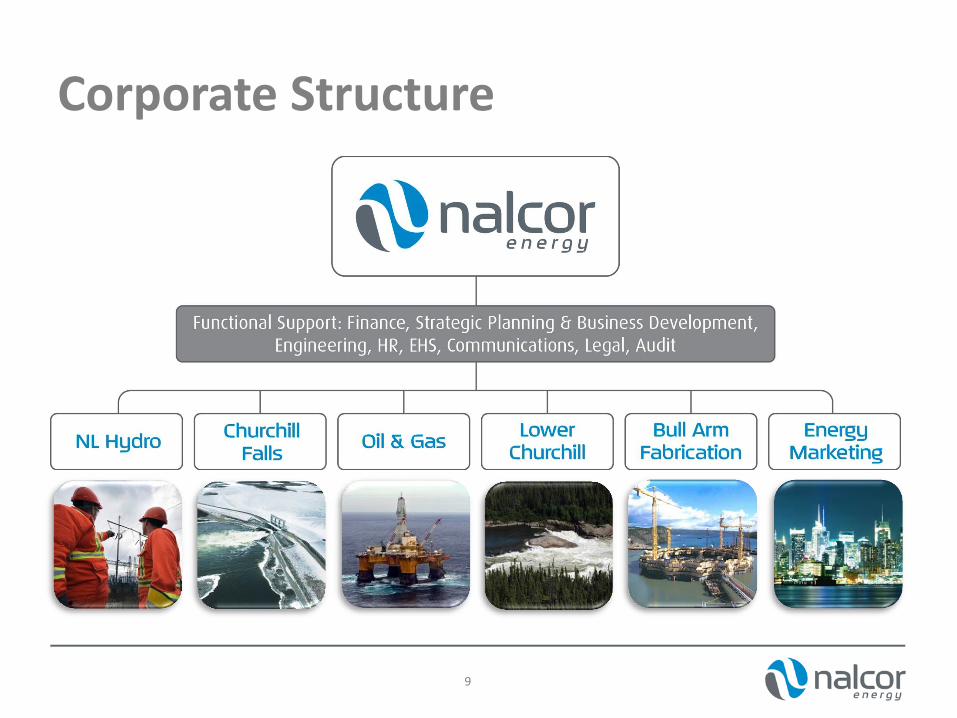
Corporate Structure
Our Focus
• Nalcor is founded on solid principles
• Significant progress achieved – much more to come
• Conservative projections indicate unprecedented dividend potential
10
Our Focus
• The Province is at a key energy transition point
– CF post 2041 becoming a current issue
– MF/LIL/ML and connection to North America imminent
– Oil and gas potential set for significant positive change
• Positioning next steps for success is essential
11
Our Vision
“To build a strong economic future for successive generations of
Newfoundlanders and Labradorians”
12
Our Strategy
• Ensure integrity of existing operating businesses
• Develop growth opportunities to build the future
13
Business Update: Medium Term
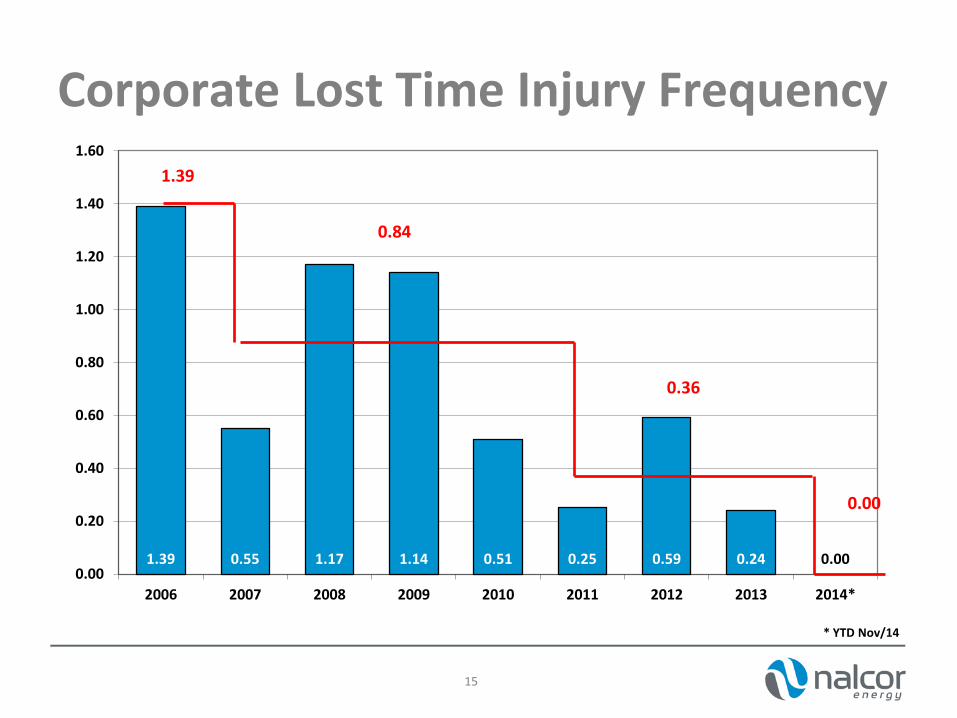
1.39 0.55 1.17 1.14 0.51 0.25 0.59 0.24 0.00 0.00
0.20
0.40
0.60
0.80
1.00
1.20
1.40
1.60
2006 2007 2008 2009 2010 2011 2012 2013 2014*
* YTD Nov/14
Corporate Lost Time Injury Frequency
15
0.84
0.36
0.00
1.39
What have we accomplished so far?
• Improved operating performance and asset management
– NL Hydro, CFLCo and Bull Arm
• Equity interests in oil and gas projects
– 4.9% Hebron
– 5.0% White Rose Expansion Projects
– 10% Hibernia Southern Extension
16
What have we accomplished so far?
• Offshore Exploration
– 2D Seismic and land management creating opportunity to kick offshore development into a much higher gear
• Muskrat Falls/LIL/ML
– Electricity game changer for province and eastern North America
– Federal Loan Guarantee
– Innu “New Dawn”
17
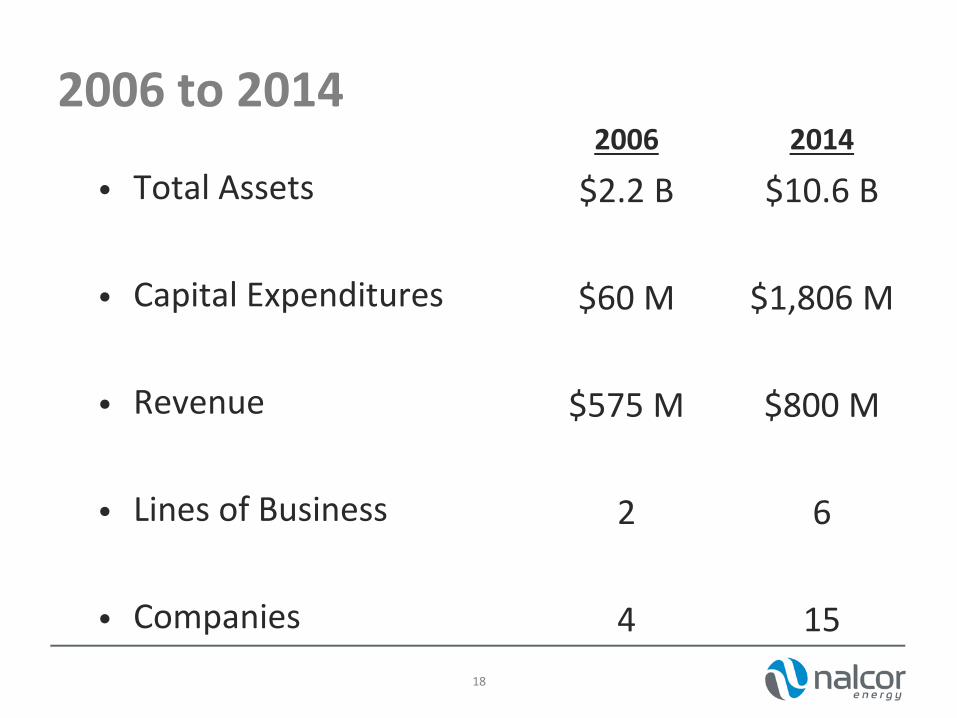
2006 to 2014 2006
$2.2 B
$60 M
$575 M
2
4
2014
$10.6 B
$1,806 M
$800 M
6
15
• Total Assets
• Capital Expenditures
• Revenue
• Lines of Business
• Companies
18
19
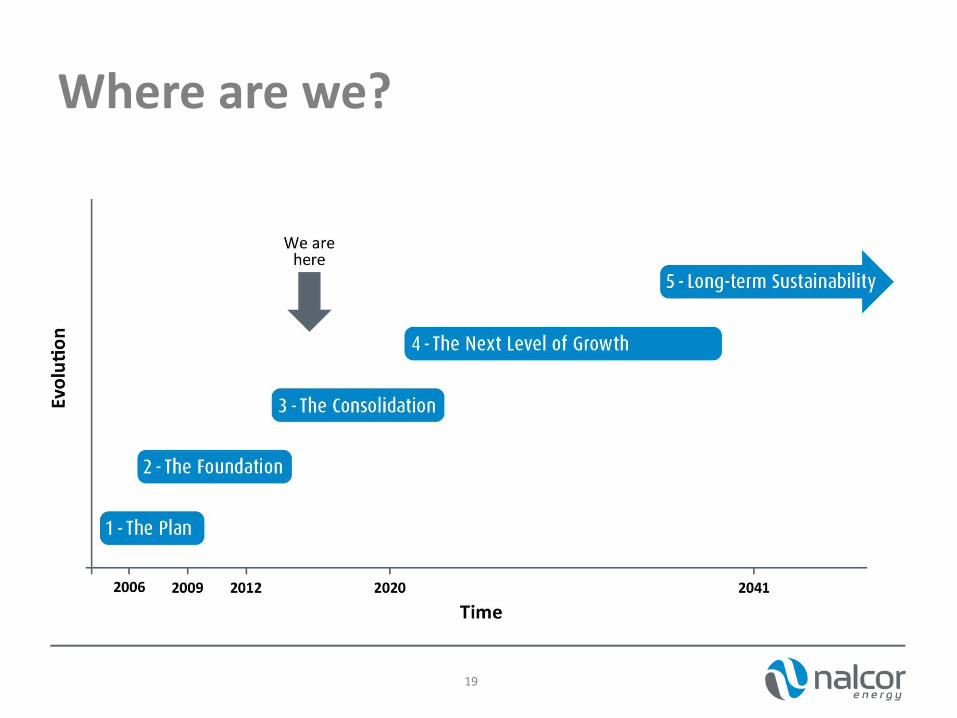
Where are we?
Poised for the future
• The foundation for developing and managing our energy future is in place
• Benefits of development will be maximized
• Nalcor was created to be the vehicle for this vision
• Much has been done; there is more to do
20
Opportunities Going Forward
• Slope and Deepwater exploration
• Bay du Nord development and much more
• Gull Island Project and other smaller hydro and wind
• Upper Churchill – time is rapidly approaching
• Revenues from royalties and dividends
• Industrial and employment benefits
21
Focus Areas in Medium Term
• Asset management and renewal of existing assets
• Execution of current capital projects
– MF/LIL/ML
– Hebron
– New 123 MW Gas Turbine
– 3rd Bay d’Espoir to Avalon Peninsula transmission line
• Continue to execute offshore exploration strategy
• Continue to adjust organization structure to;
– Accommodate interconnection to North America
– Reflect the growth of the company
22
Business Update: Short-term

24
Investing in our Provincial Electricity System
NL Hydro Focus Areas
• Safety
• Winter Readiness
• Continued focus on asset management and renewal program for existing assets
• Execution of major capital program
• General Rate Application and Interim Rates
• Continue to evolve the organization structure to receive MF power and connect to N.A.
25
26
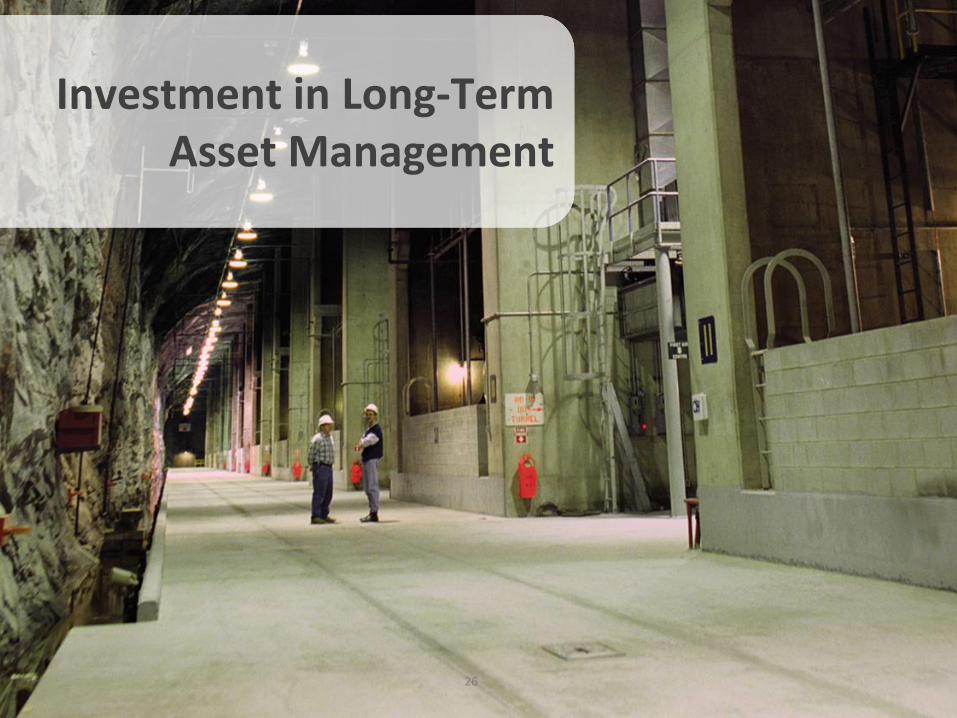
Investment in Long-Term Asset Management
Churchill Falls Focus Areas
27
• Safety
• Continued focus on asset management and renewal program for existing assets
• Execution of major capital renewal program
• Manage the legal actions in Quebec
• Continue to prepare for 2041

28
Pursuing Opportunities in Oil & Gas
Oil & Gas Focus Areas
• Safety
• Continued execution of Exploration Strategy
• Execution of capital projects
– Hebron Project
– Hibernia South
– White Rose Extension
• Efficient Operations
– White Rose and Hibernia South
29
30
Managing our Resources for Growth & Prosperity
Muskrat Falls Focus Areas
• Safety
• Continued focus on Project Execution;
– Cost
– Quality
– Schedule
31
32
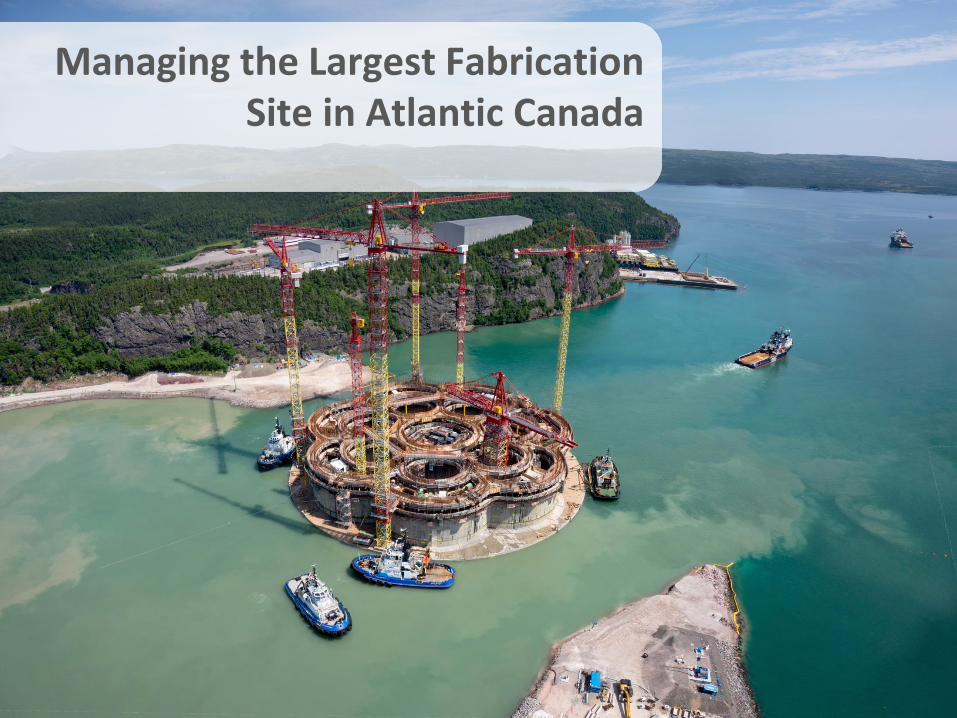
Managing the Largest Fabrication Site in Atlantic Canada
Bull Arm Focus Areas
• Cash flow management
• Site quality and effective change management
• Future planning post Hebron
33

34
Positioned for Long-Term Energy Marketing Needs
Energy Marketing Focus Areas
• Maximizing revenue and cash flow from current market sales activities
• New company - finalize the new organization
• Continue training in prep for …..
• Going live Q1 2015
35
Summary
• Significant growth to date and will continue into the future
• Long-term outlook for both Oil and Gas and electricity is exciting and excellent
• NL Hydro is ready for winter
• Further organizational evolution required to prepare for interconnection and adjust for growth which has occurred
36
Q3 2014 Financial Results

Overview
• 2014 Financial Highlights
• Financial Outlook
38
2014 YTD Financial Highlights • All amounts presented are in accordance with
International Financial Reporting Standards (IFRS).
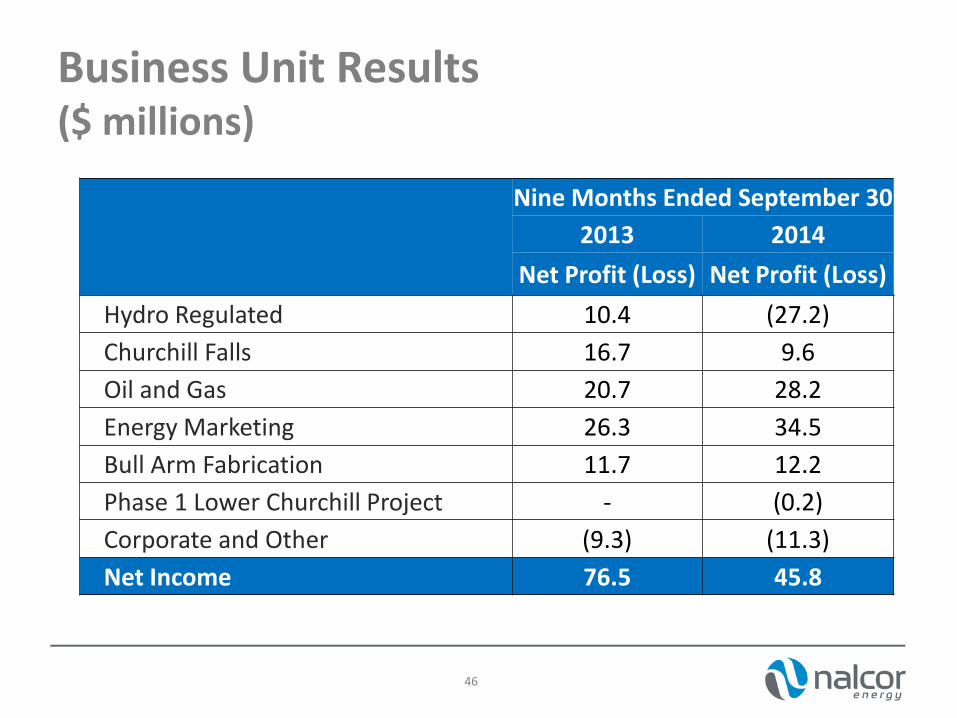
• Net profit of $ 45.8 million as of September 30, 2014
– Decrease of $30.7 million from same period in 2013 largely due to delays in obtaining regulatory approval of Hydro’s 2014 general rate application and interim rates.
39
2014 YTD Financial Highlights (cont’d.)
– Oil and Gas and Energy Marketing business segments both had higher earnings in the first nine months of 2014 compared to 2013.
– Hydro requires new rates to support higher costs and significant re-investment in capital assets
• An amended General Rate Application was filed on Nov 10, 2014; regulatory process is ongoing.
• PUB currently considering two separate applications; if approved would provide additional earnings of $55.6 million in 2014.
40
2014 YTD Financial Highlights (cont’d.)
• If the PUB approves these two applications in Q4, the positive earnings impact would be recorded in 2014.
• Continued to invest in all areas of the business
– Capital expenditures of $1.2 billion in first nine months of 2014.
– $620 million higher than same period in 2013, primarily due to higher capital expenditures on Lower Churchill.
41
2014 YTD Financial Highlights (cont’d.)
• Total assets of $10.2 billion at the end of Q3.
• Overall capital structure of 72:28 (Debt:Equity) at the end of Q3.
42
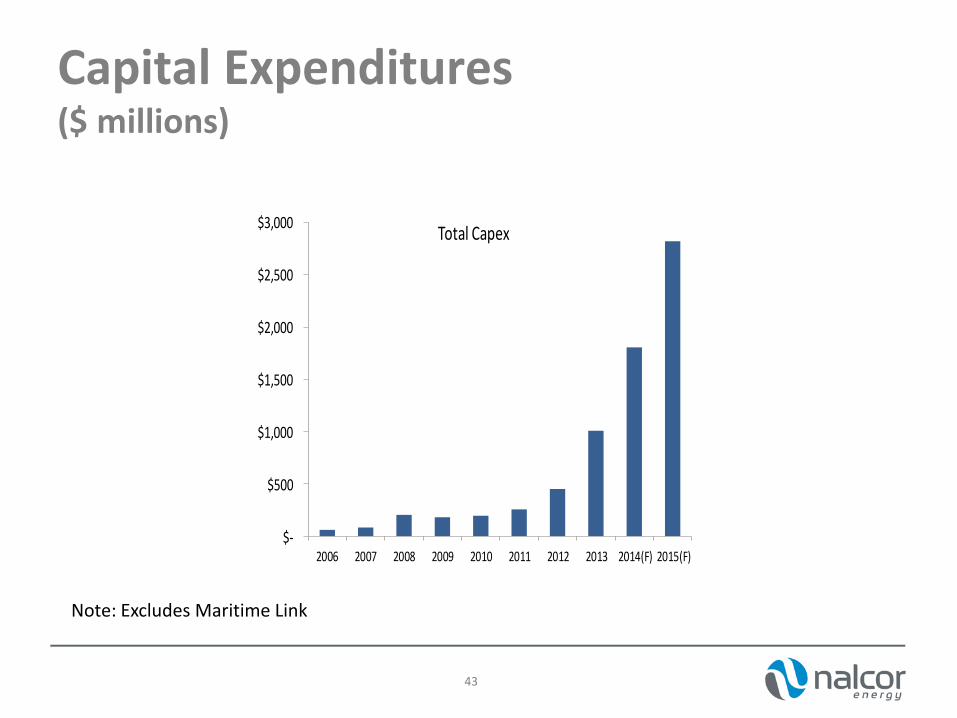
Capital Expenditures ($ millions)
$-
$500
$1,000
$1,500
$2,000
$2,500
$3,000
2006 2007 2008 2009 2010 2011 2012 2013 2014(F) 2015(F)
Total Capex
43
Note: Excludes Maritime Link
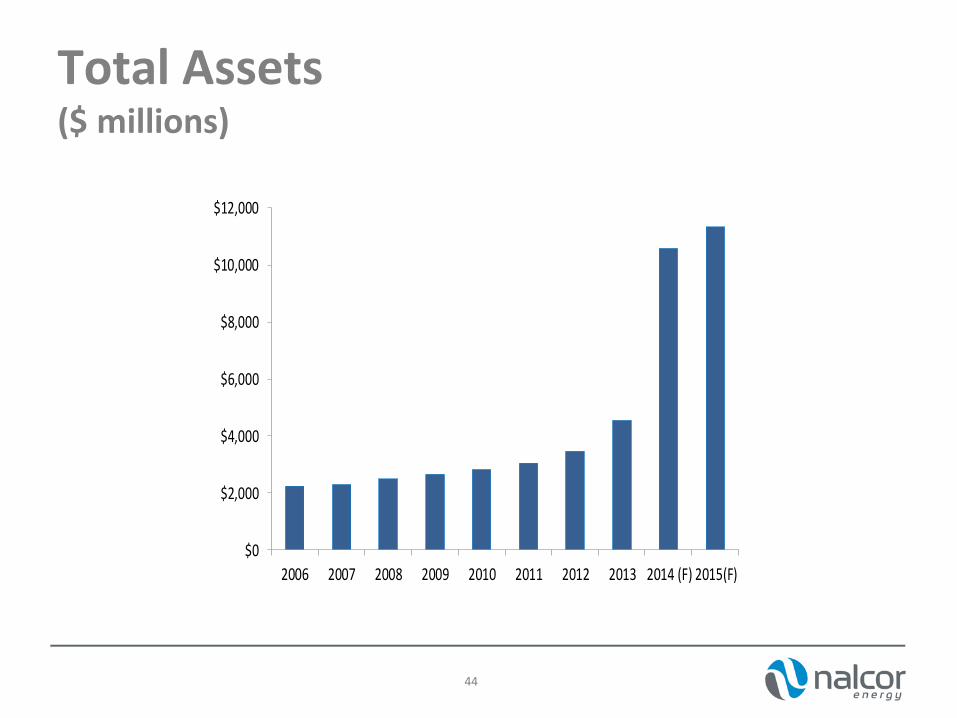
Total Assets ($ millions)
$0
$2,000
$4,000
$6,000
$8,000
$10,000
$12,000
2006 2007 2008 2009 2010 2011 2012 2013 2014 (F) 2015(F)
44
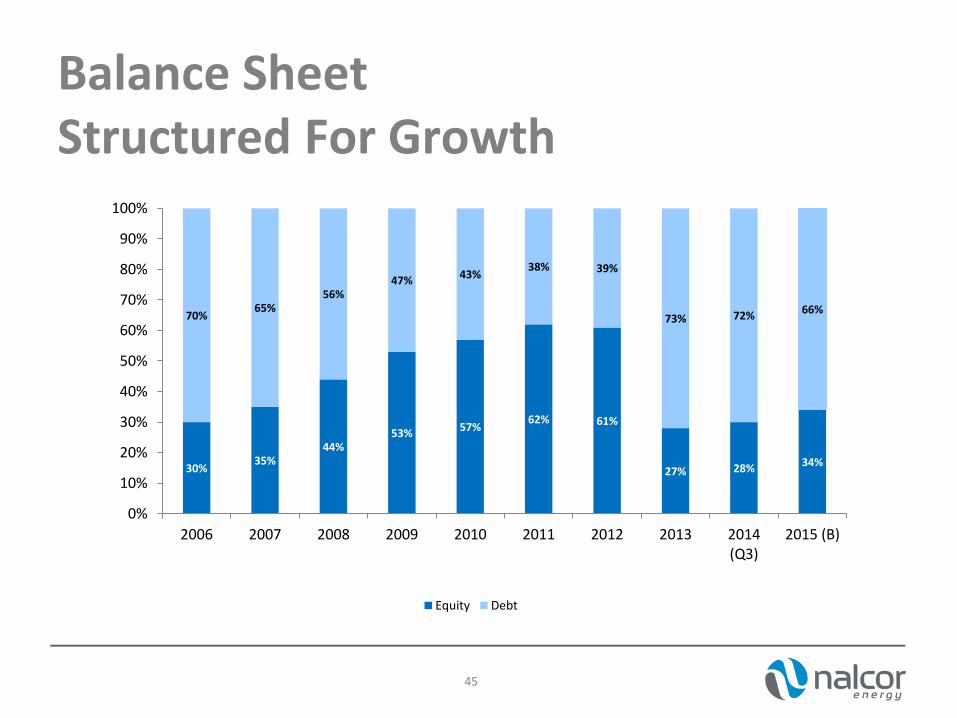
Balance Sheet Structured For Growth
30% 35%
44% 53% 57%
62% 61%
27% 28% 34%
70% 65%
56% 47% 43%
38% 39%
73% 72% 66%
0%
10%
20%
30%
40%
50%
60%
70%
80%
90%
100%
2006 2007 2008 2009 2010 2011 2012 2013 2014(Q3)
2015 (B)
Equity Debt
45
46
Business Unit Results ($ millions)
Nine Months Ended September 30
2013 2014
Net Profit (Loss) Net Profit (Loss)
Hydro Regulated 10.4 (27.2)
Churchill Falls 16.7 9.6
Oil and Gas 20.7 28.2
Energy Marketing 26.3 34.5
Bull Arm Fabrication 11.7 12.2
Phase 1 Lower Churchill Project - (0.2)
Corporate and Other (9.3) (11.3)
Net Income 76.5 45.8
Hydro Regulated • Net loss of $ 27.2 million as of September 30,
2014
– Decrease of $37.6 million from same period in 2013 largely due to delays in obtaining regulatory approval of Hydro’s general rate application and interim rates.
– Hydro is permitted to earn a return on equity of 8.8% (same as Newfoundland Power), resulting in annual net income of approximately $30 million.
47
Hydro Regulated (cont’d)
– Hydro has requested 2014 interim earnings relief on three occasions and has been denied by PUB each time.
– Amended GRA filed with the PUB on Nov 10, 2014 (included a fourth request for 2014 interim relief based on updated costs).
– Year over year sales to Newfoundland Power increased by 8%; production of Holyrood up 59% over same period in 2013.
48
Hydro Regulated (cont’d) • Capital expenditures of $143 million in first
nine months of 2014
– $84 million higher than same period in 2013.
– Increase primarily due to addition of new 123MW combustion turbine at Holyrood.
• Total Assets of $ 2.0 billion at the end of Q3, 2014
49
Hydro Regulated (cont’d)
• Target capital structure of 75/25 Debt:Equity
• $200 million, 3.6% bond issue maturing in 2045 issued on September 15, 2014
50
Churchill Falls • Net profit of $13.0 million as of September 30,
2014
– Decrease of $10.0 million from same period in 2013 primarily due to decrease in energy deliveries required by Hydro Quebec in 2014.
– Nalcor’s share is $9.6 million
• Capital expenditures of $37.2 million in the first nine months of 2014.
– $5.9 million higher than same period in 2013.
51
Churchill Falls cont’d
– Nalcor’s share is $23.9 million.
• Total Assets of $695.6 million at the end of Q3, 2014
– Nalcor’s share is $488.1 million.
• No debt in Churchill Falls
– All capital investments financed by internally generated cash flow.
52
Oil and Gas • Net profit of $28.2 million as of September 30,
2014
– Increase of $7.5 million from same period in 2013 largely due to higher production volumes and increased sales of seismic data.
– Average realized oil price for nine months ended Sept 30/14 was $108.81 USD/bbl (compared to $110.48 USD/bbl in 2013).
53
Oil & Gas cont’d
• Capital expenditures of $186.5 million during the first nine months of 2014
• Total Assets of $708 million at the end of Q3, 2014
• No debt, fully financed by equity
54
Energy Marketing • Net profit of $34.5 million as of September 30,
2014
– Increase of $8.2 million from same period in 2013 largely due to increased export market prices in the first half of 2014.
– Average realized export price of $43.73 USD/MWh in the first nine months of 2014, compared to $ 38.23 USD/MWh during the same period in 2013.
55
Energy Marketing cont’d
– Export electricity prices influenced by weather patterns in the North Eastern US:
• Colder than normal winter – positive impact on prices.
• Cooler than normal summer – negative impact on prices.
56
Bull Arm Fabrication • Net profit of $12.2 million as of September 30,
2014
– Revenue source is lease payments from ExxonMobil Canada Properties for use of site for construction of Hebron GBS.
– Increase of $0.5 million from same period in 2013 largely due to favourable foreign exchange rate on USD revenue.
57
Phase 1 Lower Churchill Project
• Capital expenditures of $878 million during the first nine months of 2014
– $468 million higher than during the same period in 2013.
• Total capital expenditures life to date of $1.9 billion.
• Total assets of $6.7 billion (including proceeds of Dec. 2013 bond issue).
58
Phase 1 Lower Churchill Project cont’d
• From an accounting perspective, IFRS requires Nalcor to include the costs incurred by Emera on the Maritime Link in Nalcor’s Consolidated Financial Statements. The Maritime Link assets continue to be owned and financed by Emera and costs will be recovered in Nova Scotia customers’ rates.
59
60
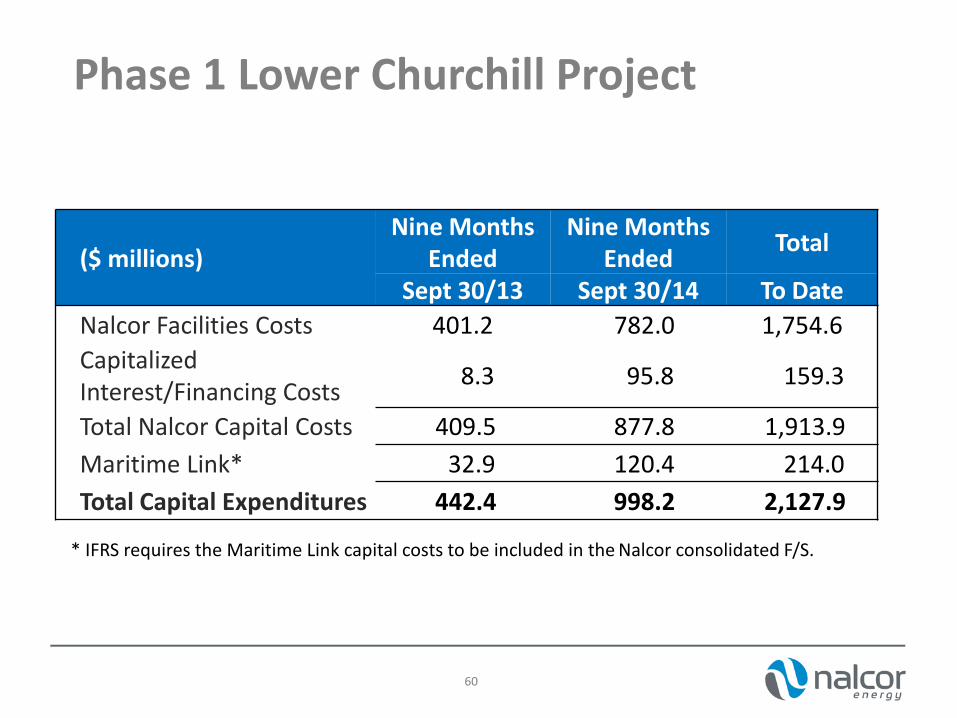
($ millions) Nine Months
Ended Nine Months
Ended Total
Sept 30/13 Sept 30/14 To Date
Nalcor Facilities Costs 401.2 782.0 1,754.6
Capitalized Interest/Financing Costs
8.3 95.8 159.3
Total Nalcor Capital Costs 409.5 877.8 1,913.9
Maritime Link* 32.9 120.4 214.0
Total Capital Expenditures 442.4 998.2 2,127.9
* IFRS requires the Maritime Link capital costs to be included in the Nalcor consolidated F/S.
Phase 1 Lower Churchill Project
Financial Outlook - 2014
• Decision anticipated from PUB in Q4 on two applications that could increase earnings by $55.6 million.
• Lower oil prices in Q4 will impact Oil & Gas results (36% of production hedged at average price of $105.00 USD/bbl).
• Planned maintenance outage at Massena, NY transmission facilities in October impacted sales into US market.
61
Financial Outlook - 2015
• Forecasting higher net profit in 2015, primarily driven by:
– Anticipated approval of rate increase for Hydro.
– Increased power sales in Churchill Falls as the result of a new power purchase agreement for the 225MW Twinco Block of energy.
– Continued earnings contribution from Oil & Gas, Energy Marketing and Bull Arm, but volatility on commodity prices.
62
Financial Outlook – 2015 cont’d
– Likely net profit impact from lower forecast oil prices but 26% of 2015 production currently hedged at $87.44 USD/bbl.
• Planned 2015 capital expenditures of $2.9 billion
– Includes $2.4 billion for Lower Churchill
• Planned long-term bond financing in Hydro of up to $250 million
63
Questions & Answers
64
65