Embed Size (px)
Citation preview
www.armco.us | (800) 858-1598
Copyright © 2017 All Right Reserved by ACES Risk Management Corp (ARMCO.) ARMCO makes no express or implied warranty regarding the information presented and assumes no responsibility for errors or omissions.
Executive Summary
QC Industry Trends - Overview
QC Industry Trends – by Category
QC Industry Trends - Credit Focus
About this Report
Q3 2016 ARMCO Mortgage QCIndustry Trends
ARMCO’s Mortgage QC Industry Trends Report represents an analysis of quality control findings
throughout the United States using extensive data derived from the ACES Analytics® benchmarking
software. This report is designed to provide business leaders and mortgage quality control professionals
meaningful information on nationwide loan quality trends.
“During the past 9 months, investors and lenders have been able to clarify the impact of TRID-related errors on their operations and fine- tune the associated risks – both short and long term.”
- Phil McCall, COO ARMCO
www.armco.us | (800) 858-1598
©ARMCO, ACES Risk Management 2017. All rights reserved. No part of the report may be reproduced, stored in a retrieval system or transmitted, in any form or by any means; electronic, mechanical, photocopying, recording or otherwise, without prior written permission. The information contained within should not be construed as a recommendation by ARMCO for any course of action regarding financial, legal of accounting matters.
1
Executive Summary
This report presents industry trends in mortgage quality control for the third quarter of 2016 based
on analysis of loan files and defects captured in the ACES Analytics benchmarking system. The ACES
Analytics benchmarking dataset includes post-closing quality control data from over 60 lenders,
comprising more than 65,000 unique loans. Defects are categorized using the Fannie Mae loan
defect taxonomy. An analysis of top-ranking defect categories for 2016 shows that Legal/Regulatory/
Compliance and Loan Package Documentation continue to be the leading defect categories.
The benchmark Critical Defect Rate drops to 1.27%, supporting a downward trend after
reaching a high of 1.92% in Q1 of 2016.
Overall defects associated with the Legal/Regulatory/Compliance category jump by
over 14%. However, the critical defects within the same category drop to a 12- month low,
comprising 22.69% of all critical defects. Changes in lender severity ratings are the cause
of this decrease.
Critical defects associated with Income/Employment lead all categories for “Credit
Related Defects”. The top reported critical defects are all associated with the
miscalculation of income.
Report highlights include:
www.armco.us | (800) 858-1598
©ARMCO, ACES Risk Management 2017. All rights reserved. No part of the report may be reproduced, stored in a retrieval system or transmitted, in any form or by any means; electronic, mechanical, photocopying, recording or otherwise, without prior written permission. The information contained within should not be construed as a recommendation by ARMCO for any course of action regarding financial, legal of accounting matters.
2
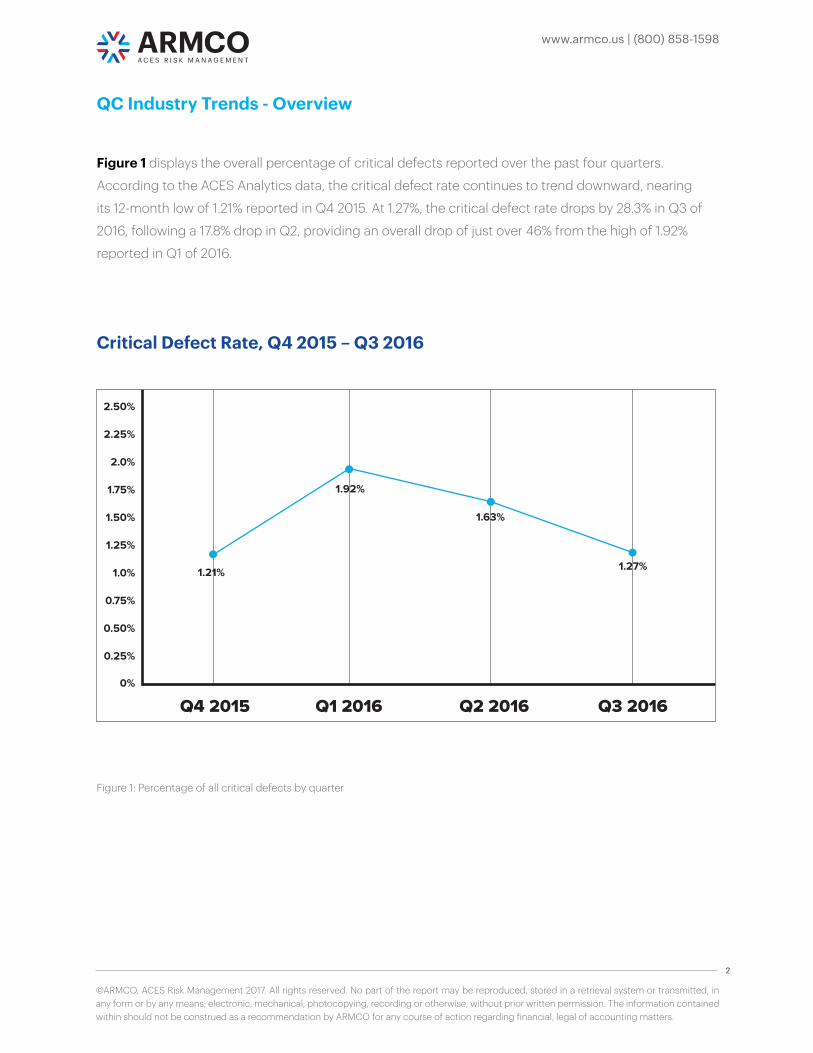
Figure 1 displays the overall percentage of critical defects reported over the past four quarters.
According to the ACES Analytics data, the critical defect rate continues to trend downward, nearing
its 12-month low of 1.21% reported in Q4 2015. At 1.27%, the critical defect rate drops by 28.3% in Q3 of
2016, following a 17.8% drop in Q2, providing an overall drop of just over 46% from the high of 1.92%
reported in Q1 of 2016.
QC Industry Trends - Overview
Figure 1: Percentage of all critical defects by quarter
Critical Defect Rate, Q4 2015 – Q3 2016
www.armco.us | (800) 858-1598
©ARMCO, ACES Risk Management 2017. All rights reserved. No part of the report may be reproduced, stored in a retrieval system or transmitted, in any form or by any means; electronic, mechanical, photocopying, recording or otherwise, without prior written permission. The information contained within should not be construed as a recommendation by ARMCO for any course of action regarding financial, legal of accounting matters.
3
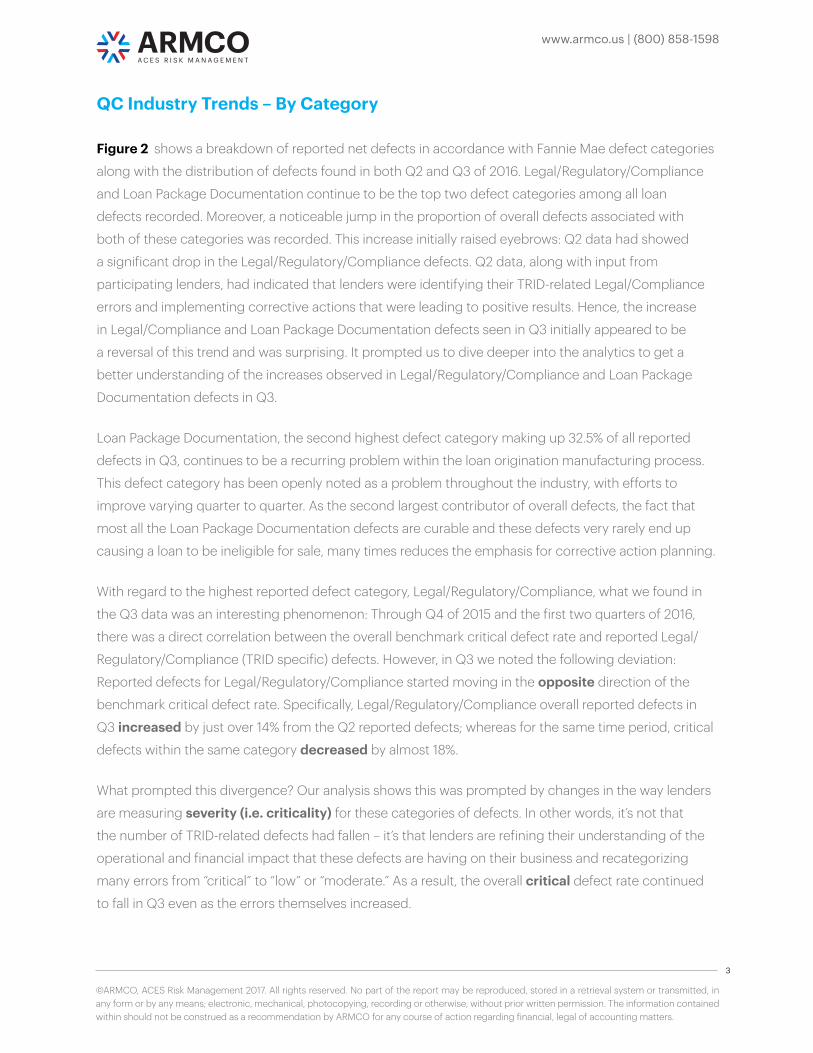
Figure 2 shows a breakdown of reported net defects in accordance with Fannie Mae defect categories
along with the distribution of defects found in both Q2 and Q3 of 2016. Legal/Regulatory/Compliance
and Loan Package Documentation continue to be the top two defect categories among all loan
defects recorded. Moreover, a noticeable jump in the proportion of overall defects associated with
both of these categories was recorded. This increase initially raised eyebrows: Q2 data had showed
a significant drop in the Legal/Regulatory/Compliance defects. Q2 data, along with input from
participating lenders, had indicated that lenders were identifying their TRID-related Legal/Compliance
errors and implementing corrective actions that were leading to positive results. Hence, the increase
in Legal/Compliance and Loan Package Documentation defects seen in Q3 initially appeared to be
a reversal of this trend and was surprising. It prompted us to dive deeper into the analytics to get a
better understanding of the increases observed in Legal/Regulatory/Compliance and Loan Package
Documentation defects in Q3.
Loan Package Documentation, the second highest defect category making up 32.5% of all reported
defects in Q3, continues to be a recurring problem within the loan origination manufacturing process.
This defect category has been openly noted as a problem throughout the industry, with efforts to
improve varying quarter to quarter. As the second largest contributor of overall defects, the fact that
most all the Loan Package Documentation defects are curable and these defects very rarely end up
causing a loan to be ineligible for sale, many times reduces the emphasis for corrective action planning.
With regard to the highest reported defect category, Legal/Regulatory/Compliance, what we found in
the Q3 data was an interesting phenomenon: Through Q4 of 2015 and the first two quarters of 2016,
there was a direct correlation between the overall benchmark critical defect rate and reported Legal/
Regulatory/Compliance (TRID specific) defects. However, in Q3 we noted the following deviation:
Reported defects for Legal/Regulatory/Compliance started moving in the opposite direction of the
benchmark critical defect rate. Specifically, Legal/Regulatory/Compliance overall reported defects in
Q3 increased by just over 14% from the Q2 reported defects; whereas for the same time period, critical
defects within the same category decreased by almost 18%.
What prompted this divergence? Our analysis shows this was prompted by changes in the way lenders
are measuring severity (i.e. criticality) for these categories of defects. In other words, it’s not that
the number of TRID-related defects had fallen – it’s that lenders are refining their understanding of the
operational and financial impact that these defects are having on their business and recategorizing
many errors from “critical” to “low” or “moderate.” As a result, the overall critical defect rate continued
to fall in Q3 even as the errors themselves increased.
QC Industry Trends – By Category
www.armco.us | (800) 858-1598
©ARMCO, ACES Risk Management 2017. All rights reserved. No part of the report may be reproduced, stored in a retrieval system or transmitted, in any form or by any means; electronic, mechanical, photocopying, recording or otherwise, without prior written permission. The information contained within should not be construed as a recommendation by ARMCO for any course of action regarding financial, legal of accounting matters.
4
Figure 2: Breakdown of defects by Fannie Mae categories for Q2 vs. Q3 2016.
Defect Rates by Fannie Mae Category, 2016 Q2 vs. Q3
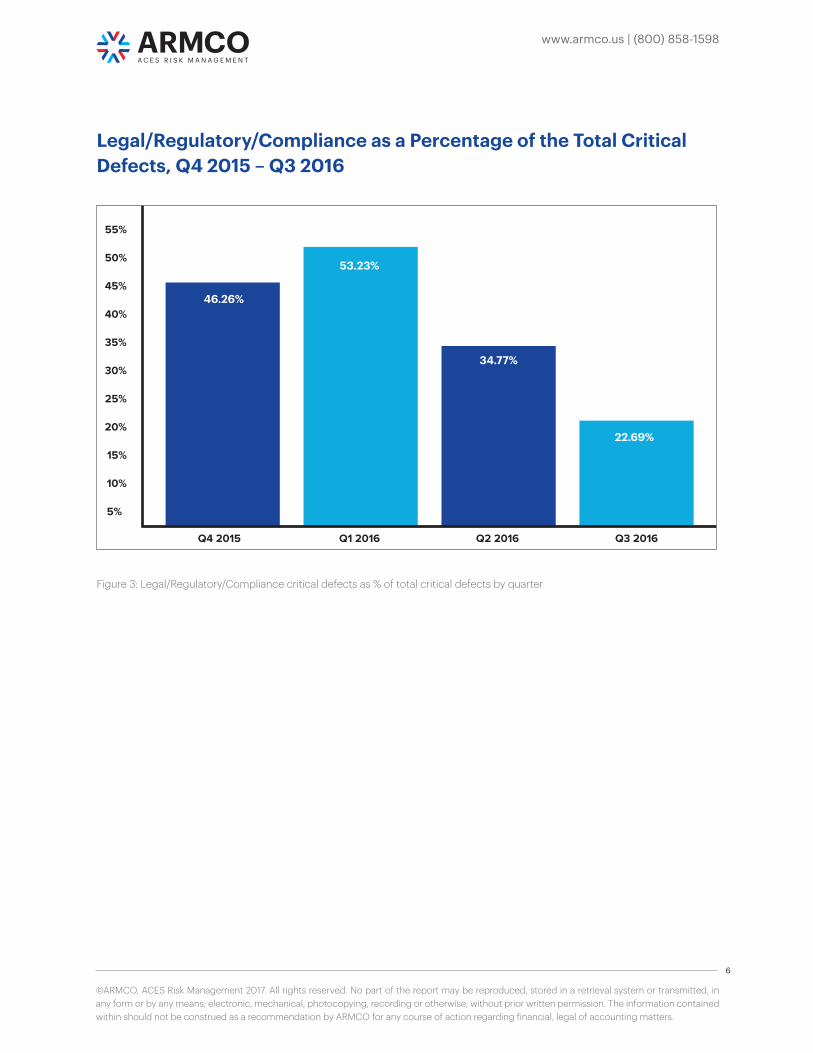
Figure 3 shows the proportion of Legal/Regulatory/Compliance defects relative to all critical defects
found in the most recent four quarters. As can be seen in the chart, the Legal/ Regulatory/Compliance
category showed a notable decrease in reported critical defects in Q3, even though as a percentage of
overall reported defects, this category rose to 38.9%, (a 14.4% increase from Q2 to Q3) and remained
the highest reported defect category.
The categorization of the severity level of TRID-related defects in the prior three quarters was
very consistent across our lender base. Across our broad span of lenders, methodologies for the
identification and reporting of TRID-related defects were fairly similar. As a comparison of overall
defects vs. critical defects, quarter to quarter we saw no deviations greater than 2% (I.e., the percentage
of overall defects was very much aligned with the percentage of critical defects). However, in our
review of Q3 data, we saw changes in lenders’ reporting processes. Specifically, the levels of severity
assigned to TRID-related defects are being downgraded across the board and also differ from lender
to lender. The Q3 data provides deep insight into evolving industry thinking around the relationship
between certain defects within the Legal/Regulatory/Compliance category and how they impact the
www.armco.us | (800) 858-1598
©ARMCO, ACES Risk Management 2017. All rights reserved. No part of the report may be reproduced, stored in a retrieval system or transmitted, in any form or by any means; electronic, mechanical, photocopying, recording or otherwise, without prior written permission. The information contained within should not be construed as a recommendation by ARMCO for any course of action regarding financial, legal of accounting matters.
5
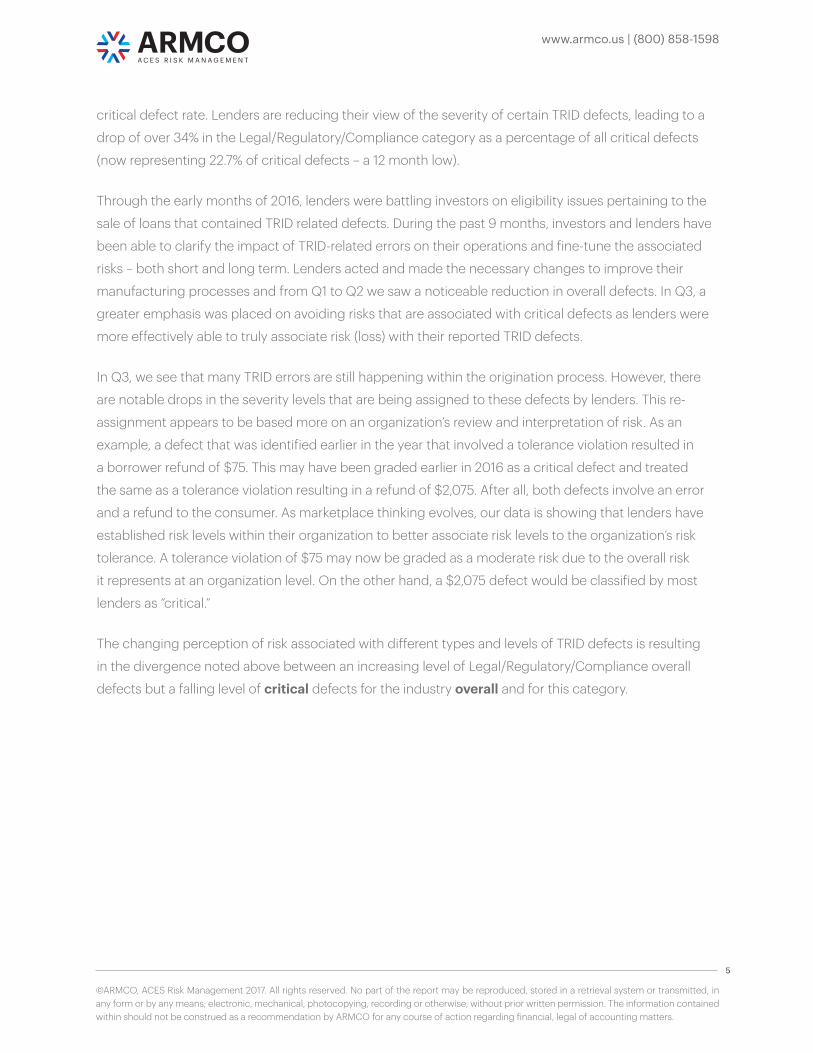
critical defect rate. Lenders are reducing their view of the severity of certain TRID defects, leading to a
drop of over 34% in the Legal/Regulatory/Compliance category as a percentage of all critical defects
(now representing 22.7% of critical defects – a 12 month low).
Through the early months of 2016, lenders were battling investors on eligibility issues pertaining to the
sale of loans that contained TRID related defects. During the past 9 months, investors and lenders have
been able to clarify the impact of TRID-related errors on their operations and fine-tune the associated
risks – both short and long term. Lenders acted and made the necessary changes to improve their
manufacturing processes and from Q1 to Q2 we saw a noticeable reduction in overall defects. In Q3, a
greater emphasis was placed on avoiding risks that are associated with critical defects as lenders were
more effectively able to truly associate risk (loss) with their reported TRID defects.
In Q3, we see that many TRID errors are still happening within the origination process. However, there
are notable drops in the severity levels that are being assigned to these defects by lenders. This re-
assignment appears to be based more on an organization’s review and interpretation of risk. As an
example, a defect that was identified earlier in the year that involved a tolerance violation resulted in
a borrower refund of $75. This may have been graded earlier in 2016 as a critical defect and treated
the same as a tolerance violation resulting in a refund of $2,075. After all, both defects involve an error
and a refund to the consumer. As marketplace thinking evolves, our data is showing that lenders have
established risk levels within their organization to better associate risk levels to the organization’s risk
tolerance. A tolerance violation of $75 may now be graded as a moderate risk due to the overall risk
it represents at an organization level. On the other hand, a $2,075 defect would be classified by most
lenders as “critical.”
The changing perception of risk associated with different types and levels of TRID defects is resulting
in the divergence noted above between an increasing level of Legal/Regulatory/Compliance overall
defects but a falling level of critical defects for the industry overall and for this category.
www.armco.us | (800) 858-1598
©ARMCO, ACES Risk Management 2017. All rights reserved. No part of the report may be reproduced, stored in a retrieval system or transmitted, in any form or by any means; electronic, mechanical, photocopying, recording or otherwise, without prior written permission. The information contained within should not be construed as a recommendation by ARMCO for any course of action regarding financial, legal of accounting matters.
6
Legal/Regulatory/Compliance as a Percentage of the Total Critical Defects, Q4 2015 – Q3 2016
Figure 3: Legal/Regulatory/Compliance critical defects as % of total critical defects by quarter
www.armco.us | (800) 858-1598
©ARMCO, ACES Risk Management 2017. All rights reserved. No part of the report may be reproduced, stored in a retrieval system or transmitted, in any form or by any means; electronic, mechanical, photocopying, recording or otherwise, without prior written permission. The information contained within should not be construed as a recommendation by ARMCO for any course of action regarding financial, legal of accounting matters.
7
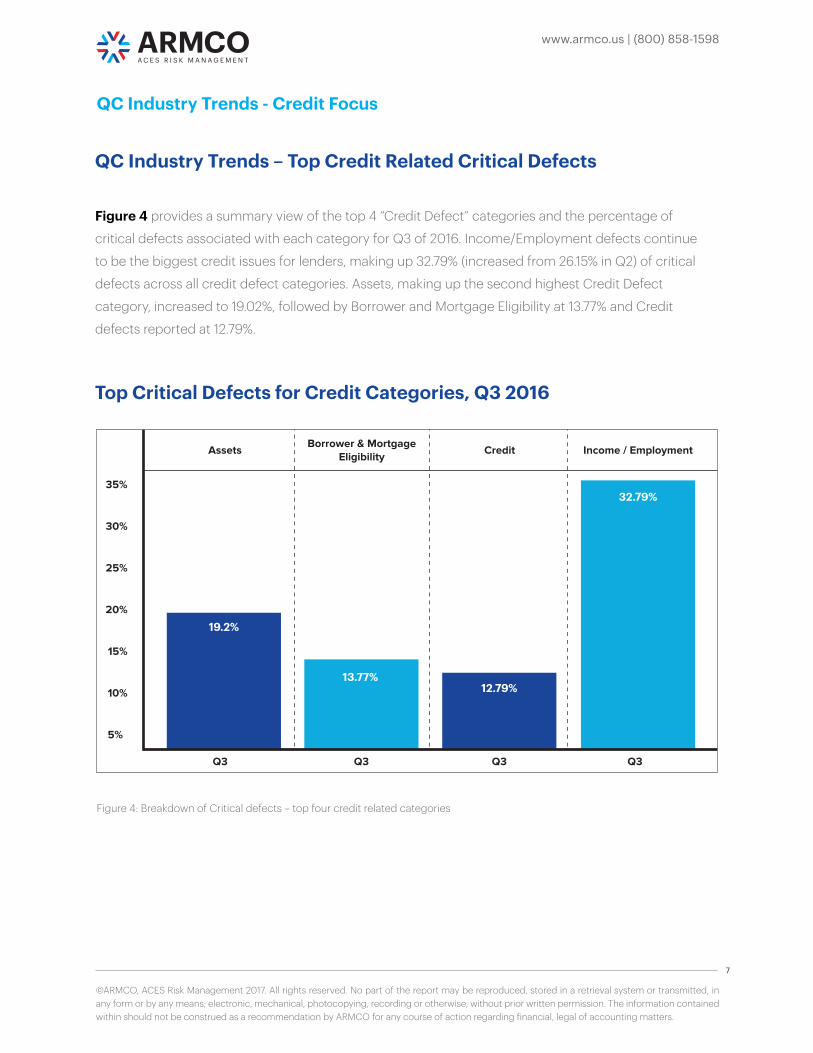
Figure 4: Breakdown of Critical defects – top four credit related categories
Top Critical Defects for Credit Categories, Q3 2016
QC Industry Trends – Top Credit Related Critical Defects
Figure 4 provides a summary view of the top 4 “Credit Defect” categories and the percentage of
critical defects associated with each category for Q3 of 2016. Income/Employment defects continue
to be the biggest credit issues for lenders, making up 32.79% (increased from 26.15% in Q2) of critical
defects across all credit defect categories. Assets, making up the second highest Credit Defect
category, increased to 19.02%, followed by Borrower and Mortgage Eligibility at 13.77% and Credit
defects reported at 12.79%.
QC Industry Trends - Credit Focus
www.armco.us | (800) 858-1598
©ARMCO, ACES Risk Management 2017. All rights reserved. No part of the report may be reproduced, stored in a retrieval system or transmitted, in any form or by any means; electronic, mechanical, photocopying, recording or otherwise, without prior written permission. The information contained within should not be construed as a recommendation by ARMCO for any course of action regarding financial, legal of accounting matters.
8
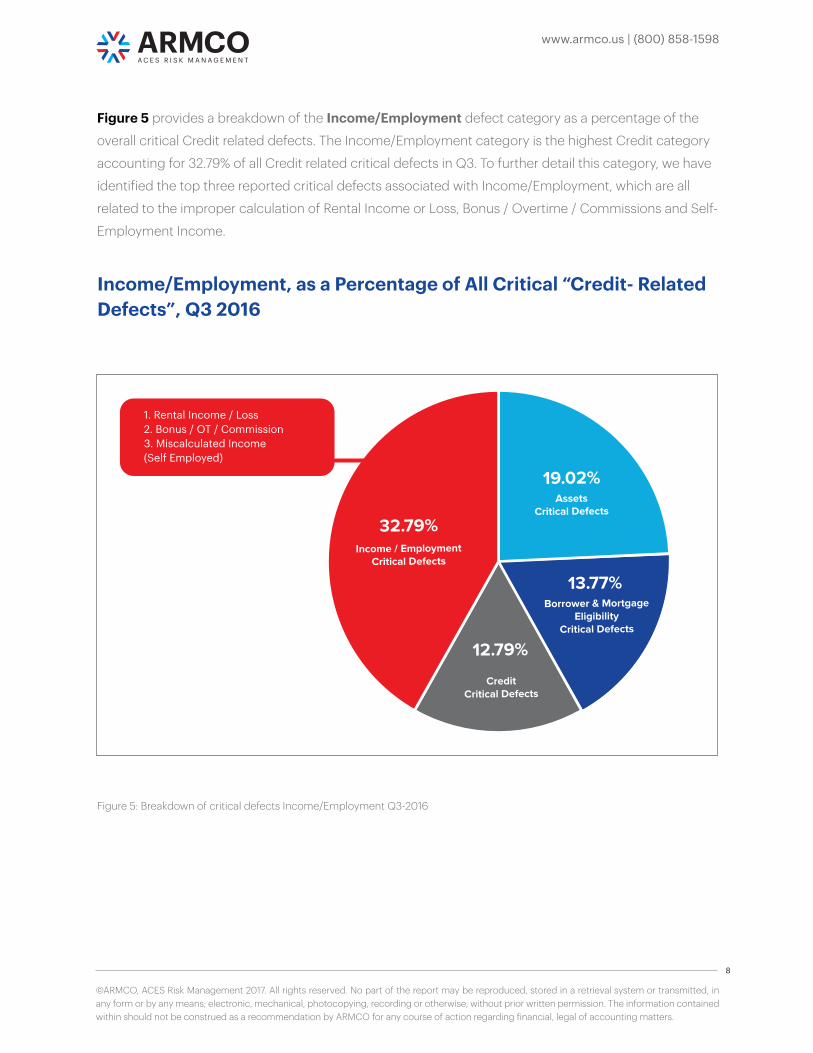
Figure 5: Breakdown of critical defects Income/Employment Q3-2016
Income/Employment, as a Percentage of All Critical “Credit- Related Defects”, Q3 2016
Figure 5 provides a breakdown of the Income/Employment defect category as a percentage of the
overall critical Credit related defects. The Income/Employment category is the highest Credit category
accounting for 32.79% of all Credit related critical defects in Q3. To further detail this category, we have
identified the top three reported critical defects associated with Income/Employment, which are all
related to the improper calculation of Rental Income or Loss, Bonus / Overtime / Commissions and Self-
Employment Income.
www.armco.us | (800) 858-1598
©ARMCO, ACES Risk Management 2017. All rights reserved. No part of the report may be reproduced, stored in a retrieval system or transmitted, in any form or by any means; electronic, mechanical, photocopying, recording or otherwise, without prior written permission. The information contained within should not be construed as a recommendation by ARMCO for any course of action regarding financial, legal of accounting matters.
9
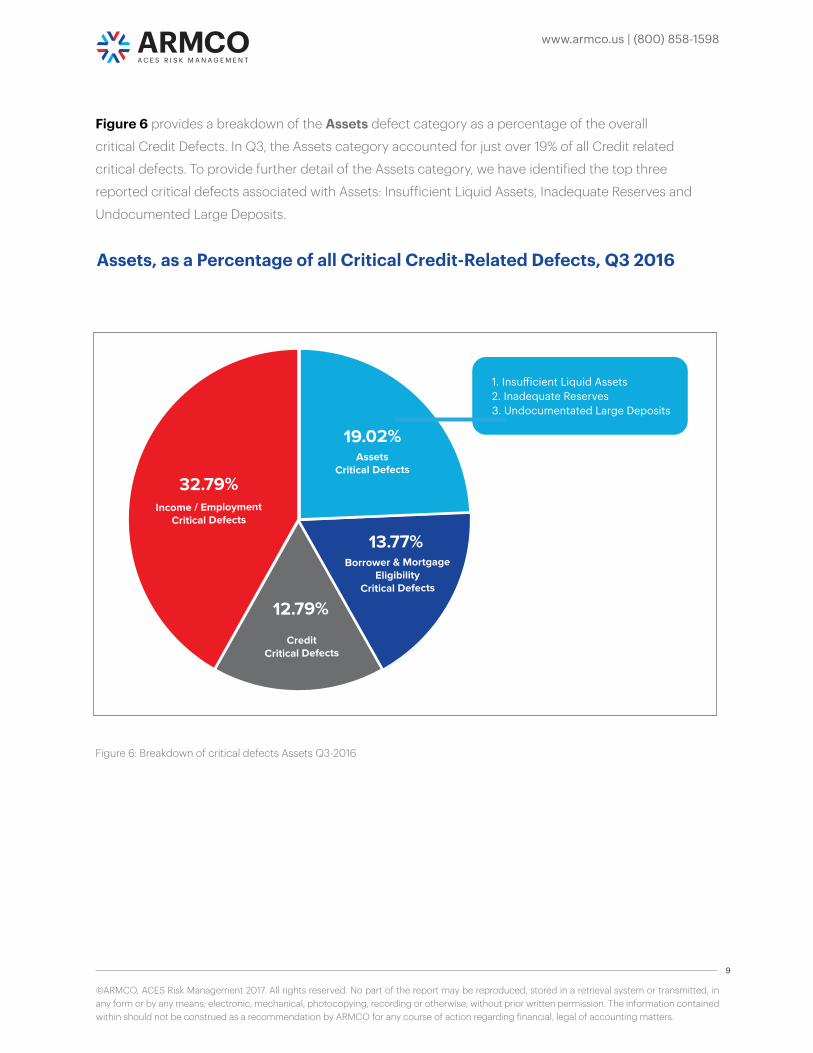
Figure 6 provides a breakdown of the Assets defect category as a percentage of the overall
critical Credit Defects. In Q3, the Assets category accounted for just over 19% of all Credit related
critical defects. To provide further detail of the Assets category, we have identified the top three
reported critical defects associated with Assets: Insufficient Liquid Assets, Inadequate Reserves and
Undocumented Large Deposits.
Figure 6: Breakdown of critical defects Assets Q3-2016
Assets, as a Percentage of all Critical Credit-Related Defects, Q3 2016
www.armco.us | (800) 858-1598
©ARMCO, ACES Risk Management 2017. All rights reserved. No part of the report may be reproduced, stored in a retrieval system or transmitted, in any form or by any means; electronic, mechanical, photocopying, recording or otherwise, without prior written permission. The information contained within should not be construed as a recommendation by ARMCO for any course of action regarding financial, legal of accounting matters.
10
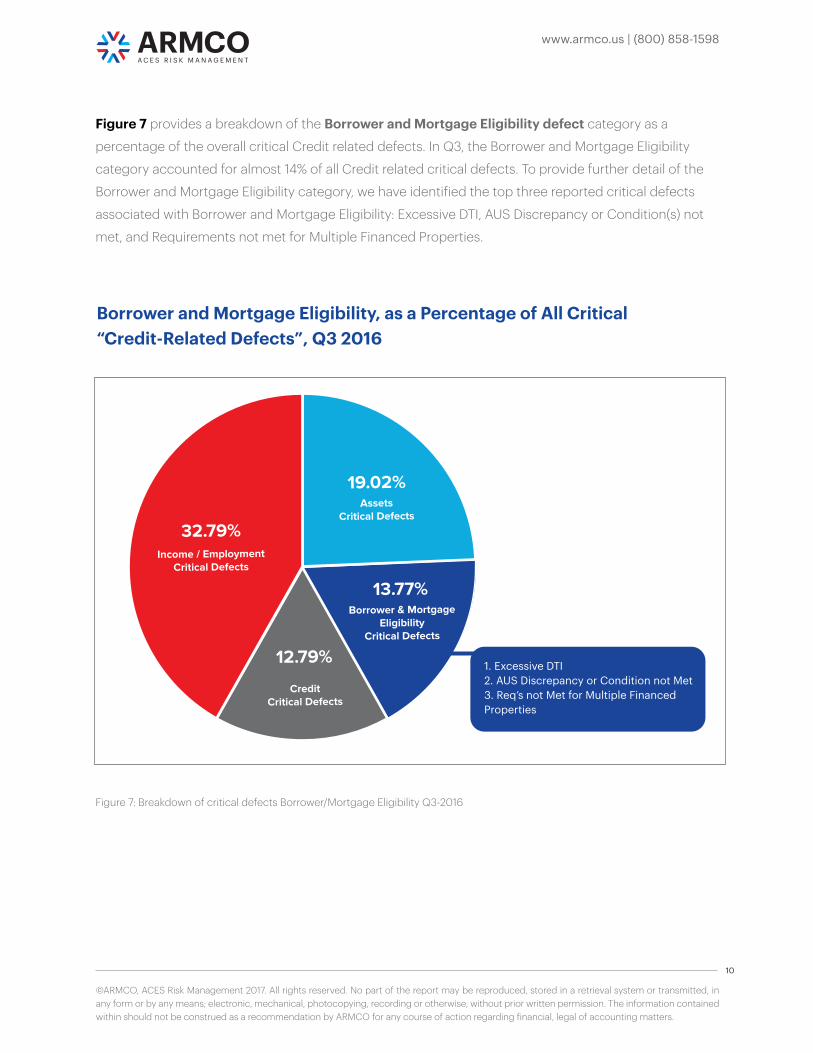
Figure 7 provides a breakdown of the Borrower and Mortgage Eligibility defect category as a
percentage of the overall critical Credit related defects. In Q3, the Borrower and Mortgage Eligibility
category accounted for almost 14% of all Credit related critical defects. To provide further detail of the
Borrower and Mortgage Eligibility category, we have identified the top three reported critical defects
associated with Borrower and Mortgage Eligibility: Excessive DTI, AUS Discrepancy or Condition(s) not
met, and Requirements not met for Multiple Financed Properties.
Figure 7: Breakdown of critical defects Borrower/Mortgage Eligibility Q3-2016
Borrower and Mortgage Eligibility, as a Percentage of All Critical “Credit-Related Defects”, Q3 2016
www.armco.us | (800) 858-1598
©ARMCO, ACES Risk Management 2017. All rights reserved. No part of the report may be reproduced, stored in a retrieval system or transmitted, in any form or by any means; electronic, mechanical, photocopying, recording or otherwise, without prior written permission. The information contained within should not be construed as a recommendation by ARMCO for any course of action regarding financial, legal of accounting matters.
11
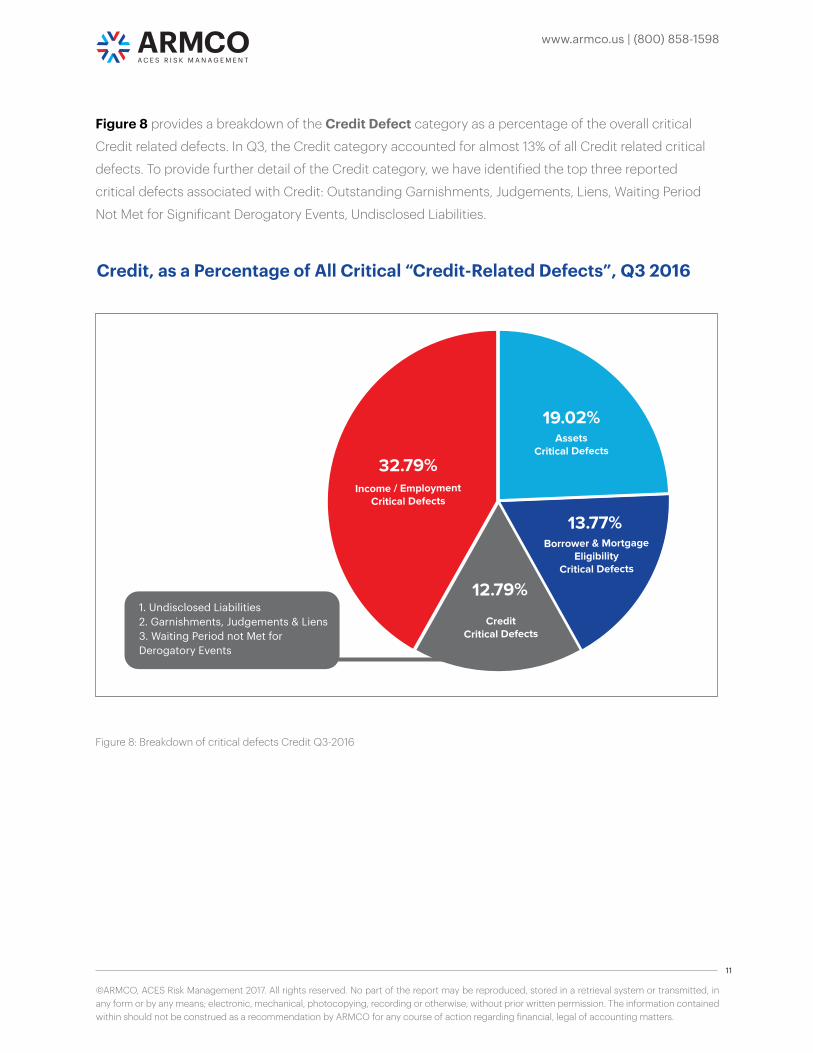
Figure 8 provides a breakdown of the Credit Defect category as a percentage of the overall critical
Credit related defects. In Q3, the Credit category accounted for almost 13% of all Credit related critical
defects. To provide further detail of the Credit category, we have identified the top three reported
critical defects associated with Credit: Outstanding Garnishments, Judgements, Liens, Waiting Period
Not Met for Significant Derogatory Events, Undisclosed Liabilities.
Figure 8: Breakdown of critical defects Credit Q3-2016
Credit, as a Percentage of All Critical “Credit-Related Defects”, Q3 2016
www.armco.us | (800) 858-1598
©ARMCO, ACES Risk Management 2017. All rights reserved. No part of the report may be reproduced, stored in a retrieval system or transmitted, in any form or by any means; electronic, mechanical, photocopying, recording or otherwise, without prior written permission. The information contained within should not be construed as a recommendation by ARMCO for any course of action regarding financial, legal of accounting matters.
12
In Q3 2016, as in the previous two quarters, Legal/Regulatory/Compliance defects were the major
driver of the overall defect rate as lenders continued to make adjustments in the implementation of
TRID requirements. At the same time, the reported increase in overall TRID defects and the decrease
in critical defects associated with TRID provides initial evidence that industry-wide changes are being
implemented to more accurately identify and measure defects in accordance with an individual
organization’s tolerance for risk. The industry appears to be gaining a comfort level with the TRID
requirements and how both short and long term risk can be managed. With the ability to dive deeper
into other defect categories, we can clearly identify the recurring defects from the top defect
categories provides insightful information as to where corrective action planning needs to be focused.
Fannie Mae has provided much guidance to lenders as to how defects are reported for “Credit Related
Defects” and what causes a defect, the risk associated with a defect and how to report these defects
under a standardized platform. To date, no similar guidance has been provided by the CFPB regarding
TRID effects. Based on our analysis of Q3 industry defect data, we would recommend that industry
groups advocate to the CFPB for similar standardization on the regulatory front. Guidance from the
CFPB regarding classification and severity of TRID-related defects could prove very beneficial to the
standardization of future industry reporting on this front.
The ARMCO Mortgage QC Industry Trends Report represents post-closing quality control analysis
throughout the United States using data and findings derived from mortgage lenders utilizing the ACES
Analytics benchmarking software. This report provides an in-depth analysis of residential mortgage
defects as reported during post- closing quality control audits. Data presented comprises net defects
and is categorized in accordance with the Fannie Mae loan defect taxonomy.
Fannie Mae Selling Guide – D1-1-01 Quality Standards and Measures:
At a minimum, the lender must identify any loans with a defect (loans not in
compliance with the Selling Guide or other related contractual terms and
agreements) and establish a methodology by which all loans with identified
defects can be categorized based on the severity of the defect. The lender must
define the severity levels appropriate to its organization and reporting needs,
however, the highest level of severity must be assigned to those loans with
defects resulting in the loan not being eligible as delivered to Fannie Mae.
Conclusion
About the ARMCO Mortgage QC Industry Trends Report
www.armco.us | (800) 858-1598
©ARMCO, ACES Risk Management 2017. All rights reserved. No part of the report may be reproduced, stored in a retrieval system or transmitted, in any form or by any means; electronic, mechanical, photocopying, recording or otherwise, without prior written permission. The information contained within should not be construed as a recommendation by ARMCO for any course of action regarding financial, legal of accounting matters.
13
ARMCO – ACES Risk Management delivers web-based audit technology solutions, as well as powerful
data and analytics, to the nation’s top mortgage lenders, servicers, investors and outsourcing
professionals. A trusted partner devoted to client relationships, ARMCO offers best-in-class quality
control and compliance software that provides U.S. banks, mortgage companies and service providers
the technology and data needed to support loan integrity, meet regulatory requirements, reduce risk
and drive positive business decisions. ARMCO’s flagship product, ACES Audit Technology™, is available
at any point in the mortgage loan lifecycle, to any size lender, and is user-definable. ACES standardizes
audit requirements, ties pre-funding reviews to post-closing quality control audits, enables seamless
trend analysis, identifies credit, compliance and process deficiencies and helps create manageable
action plans. For more information, visit www.armco.us or call 1-800-858-1598.
About ARMCO
MEDIA CONTACT:
Joe Bowerbank
Profundity Communications, Inc.
949.378.9685