Embed Size (px)
Citation preview

www.dxbentertainments.com
Q3 2016 Earning Results Presentation
13th November 2016

THIS PRESENTATION AND ITS CONTENTS ARE NOT FOR RELEASE, PUBLICATION OR DISTRIBUTION, IN WHOLE OR IN PART, DIRECTLY OR INDIRECTLY IN OR INTO ANY JURISDICTION WHERE SUCH DISTRIBUTION IS UNLAWFUL.
This presentation has been prepared and issued by DXB Entertainments PJSC (the “Company”). For the purposes of this notice, “presentation” means this document, its contents or any part of it, any oral presentation, any question or answer session and any written or oral material discussed or distributed during the presentation meeting.
The information set out in this presentation may be subject to updating, revision, verification and amendment and such information may change materially. Neither the Company, any of its parent or subsidiary undertakings, the subsidiary undertakings of such parent undertakings, nor any of such person’s respective directors, officers, employees, agents, affiliates or advisers is under an obligation to update or keep current the information contained in this presentation to which it relates or to provide the recipient of with access to any additional information that may arise in connection with it and any opinions expressed in this presentation are subject to change without notice. None of the Company or any of its parent or subsidiary undertakings, or the subsidiary undertakings of such parent undertakings, and any of such person’s respective directors, officers, employees, agents, affiliates or advisers shall have any liability whatsoever (in negligence or otherwise) for any loss whatsoever arising from any use of this presentation, or otherwise arising in connection with this presentation.
This presentation is an advertisement for the purposes of the United Kingdom Prospectus Rules and the information contained herein are not an offer of securities for sale in the United States nor any other jurisdiction. This presentation does not constitute or form part of, and should not be construed as, any offer, invitation, solicitation or recommendation to purchase, sell or subscribe for any securities in any jurisdiction nor should it or any part of it form the basis of, or be relied on in connection with, any contract or commitment whatsoever.
This presentation is for information purposes and convenient reference. It is not definitive advice, nor should it be relied upon as such. This presentation does not purport to contain all of the information that may be required to evaluate any potential transaction and should not be relied on in connection with any such potential transaction. Any projection, estimate, forecast or other ‘forward-looking’ statement in this presentation only illustrates hypothetical performance under specified assumptions of events or conditions, and is not a reliable indicator of future performance.
To the extent available, the industry and market data contained in this presentation may have come from official or third party sources. Such third party industry publications, studies and surveys generally state that the data contained therein have been obtained from sources believed to be reliable, but that there is no guarantee of the accuracy or completeness of such data. While the Company believes that each of these publications, studies and surveys has been prepared by a reputable source, the Company has not independently verified the data contained therein. In addition, certain of the industry and market data contained in this presentation come from the Company's own internal research and estimates based on the knowledge and experience of the Company's management in the market in which the Company operates. While the Company generally believes that such research and estimates are reasonable and reliable, they, and their underlying methodology and assumptions, have not been verified by any independent source for accuracy or completeness and are subject to change without notice. Accordingly, undue reliance should not be placed on any of the industry or market data contained in this presentation.
You agree to be bound by the foregoing limitations and conditions and, in particular, will be deemed to have represented, warranted and undertaken that you have read and agree to comply with the contents of this notice.
LEGO ®, the LEGO logo and LEGOLAND ® are trademarks of the LEGO Group. ©2016 The LEGO Group. LEGOLAND IS A PART OF MERLIN ENTERTAINMENTS plc.
DISCLAIMER

CONTENT
Highlights of Q3 2016
Project Update
Corporate and Operational Update
Financial Summary
3

01 / Highlights of Q3 2016

Q3 2016 Performance Highlights
30 Sep2016
(AED m)
31 Dec2015
(AED m)
Property and equipment, investment properties, inventories, advances and other receivables
8,747 5,307
Cash and other financial assets 3,286 3,319
Total assets* 12,033 8,626
Financial HighlightsProject and Corporate Highlights
Project Highlights
Dubai Parks and Resorts has opened to the paying public
• LEGOLAND® Dubai and Riverland™ Dubai opened on31 October 2016
• Bollywood Parks™ Dubai opening on 17 November 2016
• MOTIONGATE™ Dubai opening on 16 December 2016
• Broken ground on Six Flags Dubai
Due to rounding, numbers presented may not add up precisely to the totals provided and percentages may not precisely reflect the absolute figures. 30 September 2016 figures are unaudited.
Corporate Highlights
• Changed the name of the company to DXB Entertainments PJSC
• Over 84% of total available space at Riverland™ Dubai leased at the end of September with 51 lease proposals signed
• Signed exclusive agreement with Gulf Islamic Investment (GII) to develop and invest in smart parking services
• Vinit Shah becomes Chief Business Development and Strategy Officer
5
* includes 1,676 million for Six Flags Dubai and Business Development
For the period ended 30 September 2016, the Company had no operating revenue
Loss for the period ended 30 September 2016 was 196 million AED
Drawn down AED 3.3 billion of banking facility

Favourable tourism growth trends
WesternEurope21%
GCC25%
MENA11% South Asia
16%
Americas
6%North Asia and South-East Asia
9%
RUSSIA, CIS, EE
5%
Africa 5%
Australasia
2%
6
Top Source Markets For Visitors To Dubai(‘000 visitors YOY Jan – Aug 2016 | 15)
Jan-Aug 2016 2015 % change
1 KSA 1,117 1,064 5%
2 INDIA 1,085 989 10%
3 UK 798 765 4%
4 OMAN 781 660 18%
5 USA 394 398 -1%
6 PAKISTAN 390 343 14%
7 CHINA 347 307 13%
8 IRAN 299 316 -5%
9 Germany 294 301 -2%
10 KUWAIT 293 300 -2%
15 RUSSIA 135 132 3%
Source of Visitor by Region (% in YTD August2016)
Sources: DTCM and Mastercard Global Destination Index.
Dubai is the 4th most visited city in the world after London, Paris and Bangkok
2015
2014 $10.9 Billion
$11.68 Billion
International overnight visitor spending in Dubai
Total Overnight International Visitors
9.58m YTD August 2016

02 / Project Update

Dubai Parks and Resorts opening timeline
8
Dubai Parks and Resorts Opening Schedule
31 October 2016 LEGOLAND® DubaiRiverland™ Dubai
17 November 2016 Bollywood Parks™ Dubai
16 December 2016 MOTIONGATE™ Dubai

Overall project completion snapshotCompleted in 2014
Major IP agreements
Operator agreements
Major government approvals
Theme park ride orders
Overall construction Achieved 2015 Q3 2016
Infrastructure 70% 98%
Facilities 49% 93%
Structure works 88% 100%
MEP 29% 90%
Envelope & Façade 30% 94%
Finishes 24% 87%
Area Development 10% 80%
Ride systems Achieved 2015
Q32016
Overall 68% 95%
Production 89% 100%
Delivery 63% 100%
Installation and Commissioning
9% 70%
Achieved 2015
Design 100%
Show systems Achieved 2015
Q3 2016
Overall 23% 92%
Production 32% 95%
Delivery 14% 88%
Installation and Commissioning
0% 42%
Achieved 2015
Q32016
Procurement 89% 100%
42 contractors
18,000workers on site
Due to rounding, numbers presented may not add up precisely to the totals provided and percentages may not precisely reflect the absolute figures. 30 September 2016 figures are unaudited.
9
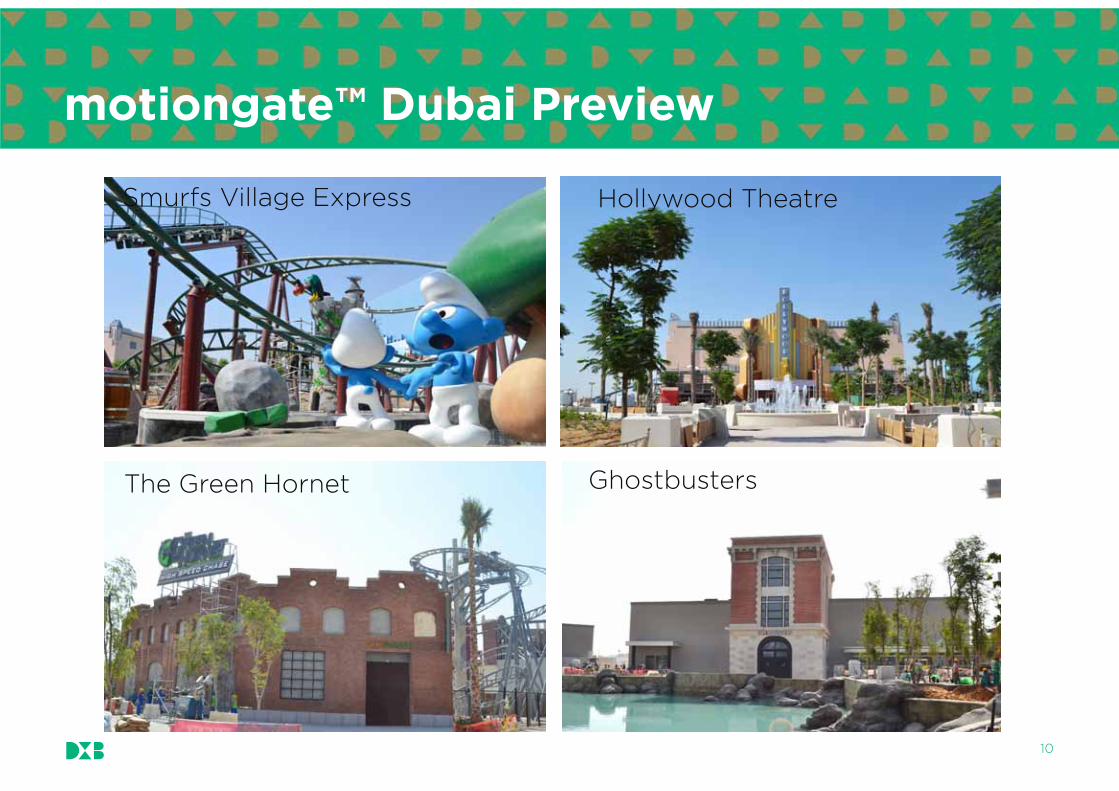
motiongate™ Dubai Preview
DreamWorks Building
Smurfs Village Express Hollywood Theatre
The Green Hornet
10
Ghostbusters

Bollywood Parks™ Dubai Preview
SholayBollywood Parks™ Dubai
LagaanBollywood Parks™ Dubai
11

12
LEGOLAND® Dubai
LEGO® CITY AIRPORT
LEGOLAND® Dubai opening
THE BIG SHOP
Dragon roller coaster

13
Riverland™ Dubai
French Village
French Village
Riverland™ Dubai
Boardwalk

Detailed design ongoing Project consultants design team on site. Ride procurement plan in place for all rides. 5 rides procurement in final
stages. Earthworks and grading substantially completed. Package awarded for Access Road
Six Flags Dubai update
14

03 / Corporate and Operational Update

16
Sales and Marketing Update
Launch of day pass sales
4th October 2016Launch of tickets sales of LEGOLAND® Dubai
15th October 2016Launch of ticket sales for Bollywood Parks™ Dubai
Tour and travel operators
70 international Tour Operator agreements signed
125 Destination Management Company agreements signed

17
Sponsorship partners

18
Dubai Parks and Resorts Wins 2016 ‘Leisure Project of the Year’ at the Construction Innovation Awards ME 2016

19
Theme Park Operations Update
Smart Parking Service agreementSigned an exclusive agreement with Gulf Islamic Investments to develop and invest in smart parking services at Dubai Parks and Resorts
RehearsalsRehearsals completed for Ninjago cast, with Jaan E Jigar, the Dabangg stunt show and Step Up on going
Staff trainingAll front line POS ticket sales training has been completed, and majority of F&B/retail POS training completed
Ride and maintenance staff training on going in line with ride delivery schedules

20
Leasing Update – Riverland™ Dubai
Leasing at Riverland™ Dubai (as at 30 September 2016)
139%Achieved of total
revenue of projected revenue in 2017
84% Of total lease space signed
51Total lease proposals
signed

Male63%
Female37%
21
Human Resources Update
Employee breakdown(as at end of September)
1800 employees from 74 countries
Theme parks72%
Retail and Hospitality
8%
Corporate and Services
20%

04 / Q3 2016 Financial Summary

Key Indicators (AED million) TOTAL
Total assets as at30 September 2016
2,693 1,139 1,342 687 561
Infrastructure and others
12,0335,611
Pre-opening expenses(Project to date)
55 41 40 6 9 417266
RiverlandTM Dubai formerly known as Riverpark. Due to rounding, numbers presented may not add up precisely to the totals provided and percentages may not precisely reflect the absolute figures. 30 September 2016 figures are unaudited.
23
Q3 2016 Financial Summary
Total at the end of Q3 2016 2,748 1,180 1,382 693 570 12,4505,877

24
Interim Financial Informationfor the nine months ended 30 September 2016
Key highlightsAssets
Property and Equipment and Investment Properties: Increased to AED 8,379 million (Dec 2015:AED 4,937 million) includes land and capital work in progress amounting to AED 493 million inrelation to SF Dubai project (Dec 2015: Nil).
Advances to contractors and other receivables: Decreased to AED 344 million (Dec 2015: AED 372 million)
Due from a related party and Inventories: Increased to AED 24 million (Dec 2015: Nil)
Cash and other financial assets: AED 3,286 million (Dec 2015: AED 3,317 million)
Equity and liabilities
Share capital: AED 8,000 million (Dec 2015: AED 6,322 million)
Accumulated Losses and other reserves: AED 391 million (Dec 2015: AED 144 million)
Bank facilities: Drawn down AED 3,301 million (Dec 2015: AED 1,461 million)
Trade and other payables: Increased to AED 1,299 million (Dec 2015: AED 1,177 million)
Due to a related party: Reduced to AED Nil million (Dec 2015: AED 13 million)
Operations
The Company has not commenced its revenue generating activities and losses for the period were AED 196 million (September 2015: AED 58 million)
Events during the period
Six Flags Dubai right issue concluded in June 2016, issued share capital increased by AED 1,678million
Total Assets AED 12,033 million
(Dec 2015: AED 8,626 million)
Due to rounding, numbers presented may not add up precisely to the totals provided and percentages may not precisely reflect the absolute figures. 3o September 2016 figures are unaudited. Advances include interest receivable
Property and
equipment66%
Investment properties4%
Inventories0%
Due from a related party0%
Advances to contractors and
other receivables3%
Other financial assets
0%
Cash and bank
balances27%
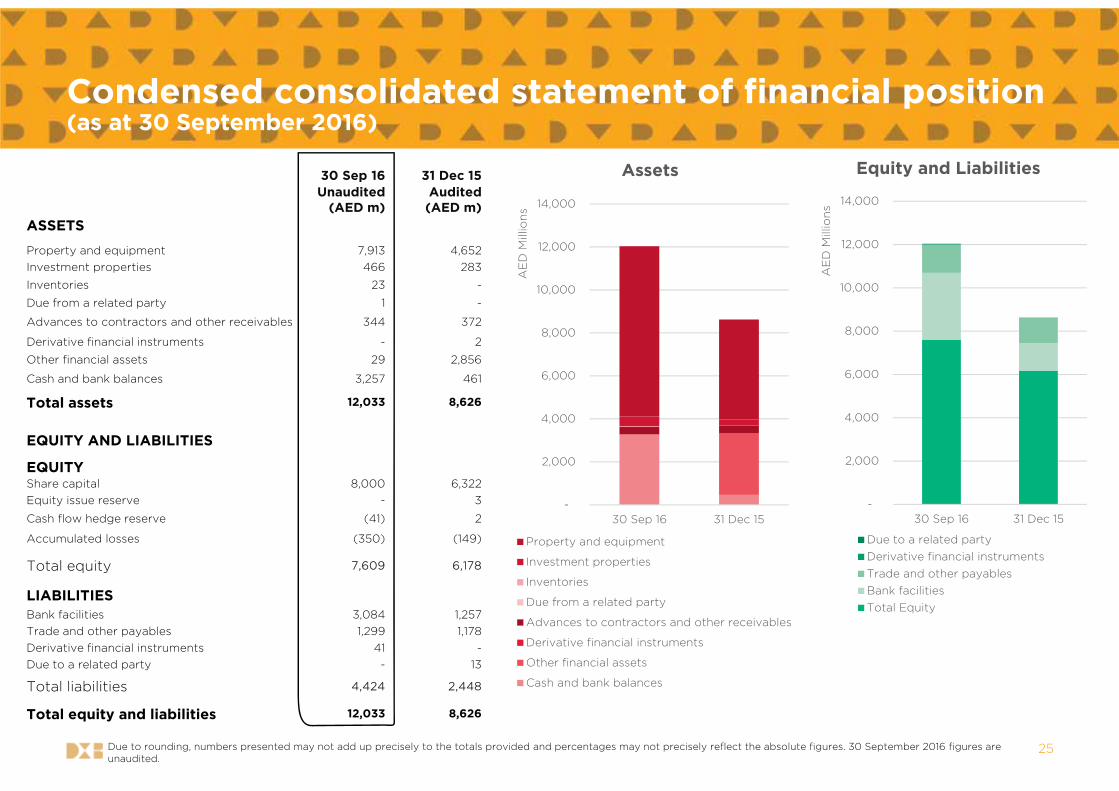
30 Sep 16 31 Dec 15Unaudited
(AED m) Audited (AED m)
ASSETS
Property and equipment 7,913 4,652 Investment properties 466 283
Inventories 23 -
Due from a related party 1 -
Advances to contractors and other receivables 344 372
Derivative financial instruments - 2
Other financial assets 29 2,856
Cash and bank balances 3,257 461
Total assets 12,033 8,626
EQUITY AND LIABILITIES
EQUITYShare capital 8,000 6,322 Equity issue reserve - 3
Cash flow hedge reserve (41) 2
Accumulated losses (350) (149)
Total equity 7,609 6,178
LIABILITIESBank facilities 3,084 1,257 Trade and other payables 1,299 1,178 Derivative financial instruments 41 -Due to a related party - 13
Total liabilities 4,424 2,448
Total equity and liabilities 12,033 8,626
25
Condensed consolidated statement of financial position (as at 30 September 2016)
Due to rounding, numbers presented may not add up precisely to the totals provided and percentages may not precisely reflect the absolute figures. 30 September 2016 figures are unaudited.
-
2,000
4,000
6,000
8,000
10,000
12,000
14,000
30 Sep 16 31 Dec 15A
ED
Mill
ion
s
Assets
Property and equipment
Investment properties
Inventories
Due from a related party
Advances to contractors and other receivables
Derivative financial instruments
Other financial assets
Cash and bank balances
-
2,000
4,000
6,000
8,000
10,000
12,000
14,000
30 Sep 16 31 Dec 15
AE
D M
illio
ns
Equity and Liabilities
Due to a related partyDerivative financial instrumentsTrade and other payablesBank facilitiesTotal Equity

Condensed consolidated statement of comprehensive income(for the nine months ended 30 September 2016)
Loss for the nine months ended 30 Sep 2016
Due to rounding, numbers presented may not add up precisely to the totals provided and percentages may not precisely reflect the absolute figures. 30 September 2016 figures are unaudited.
30 Sep 16 30 Sep 15
Unaudited(AED m)
Unaudited (AED m)
General and administrative expenses (176) (71)
Marketing and selling expenses (60) (12)
Other operating expenses (8) -
Interest Income 54 36
Amortization of borrowing costs (6) (11)
Loss for the period (196) (58)
Other comprehensive income
Cash flow hedge - loss on fair value (42) (7)
Total comprehensive loss for the period (237) (66)
Loss per share:
Basic and diluted loss per share (fils) (0.029) (0.010)
26
(196)
(58)
(250)
(200)
(150)
(100)
(50)
-30 Sep 16 30 Sep 15
AE
D M
illio
ns

27
Interim condensed consolidated statement of cash flows (for the nine months ended 30 September 2016)
30 Sep 16 30 Sep 15Unaudited
(AED m) Unaudited
(AED m)
Operating ActivitiesLoss for the period (196) (58)Adjustments for:Depreciation Expense 6 2 Interest Income (54) (36)Amortisation of borrowing cost 6 11 Provision for employees' end of service indemnity 2 2 (Decrease)/Increase in advances to contractors and other receivables 52 (283)Increase in inventories (23) -Increase in trade and other payables 118 393
Net cash (used in)/generated by operating activities (89) 31
Investing activitiesDecrease in other financial assets 2,827 1,364 Additions to property and equipment (3,168) (1,643)Additions to investment properties (183) (73)Interest received 46 23 Net cash used in investing activities (478) (329)
Financing ActivitiesProceeds from issuance of share capital 1,678 -Share issue cost (9) -Proceeds from bank facilities 1,840 585 Borrowing cost paid (44) -Finance cost paid (90) -Movement in restricted cash (14) -(Decrease)/increase In due to a related party (13) 32 Net cash generated by financing activity 3,348 617
Net decrease in cash and cash equivalent 2,781 319 Cash and cash equivalent at the beginning of the period 364 163 Cash and cash equivalent at the end of the period 3,145 482
Movement in Cash(for the nine months ended 30 Sep 2016)
Due to rounding, numbers presented may not add up precisely to the totals provided and percentages may not precisely reflect the absolute figures. 30 September 2016 figures are unaudited.
(89)
2,827
(3,351)
46
3,348
(4,000)
(3,000)
(2,000)
(1,000)
-
1,000
2,000
3,000
4,000
Mill
ion
s
Operating
Investing-Other Financial Assets
Investing-Property and equipment and Investment properties
Investing-Other
Financing

28
Maintaining initial revenue projections for 2017:
6.7M visits
AED 2.4BN revenueLikely to have a slightly higher cost structure due to an increase in staff costs and facilities management costs. Company continues to identify means to mitigate costs.
2017 Outlook

Contact us
29
Investor Relations Contacts
Marwa GoudaHead of Investor Relations
Abdulrahman Al-SuwaidiInvestor Relations Officer
www.dxbentertainments.com/investor-relations
DXB Entertainments PJSC
Emaar Square, Building 1, Level 2PO Box 123311, DubaiUnited Arab Emirates
Tel: +971 4 8200 820Fax: +971 4 5114 998
www.dxbentertainments.com

Download the DXB Entertainments IR App
30
Our new Investor Relations App is available for download on the iTunes App store and the Google Play store!