Embed Size (px)
Citation preview
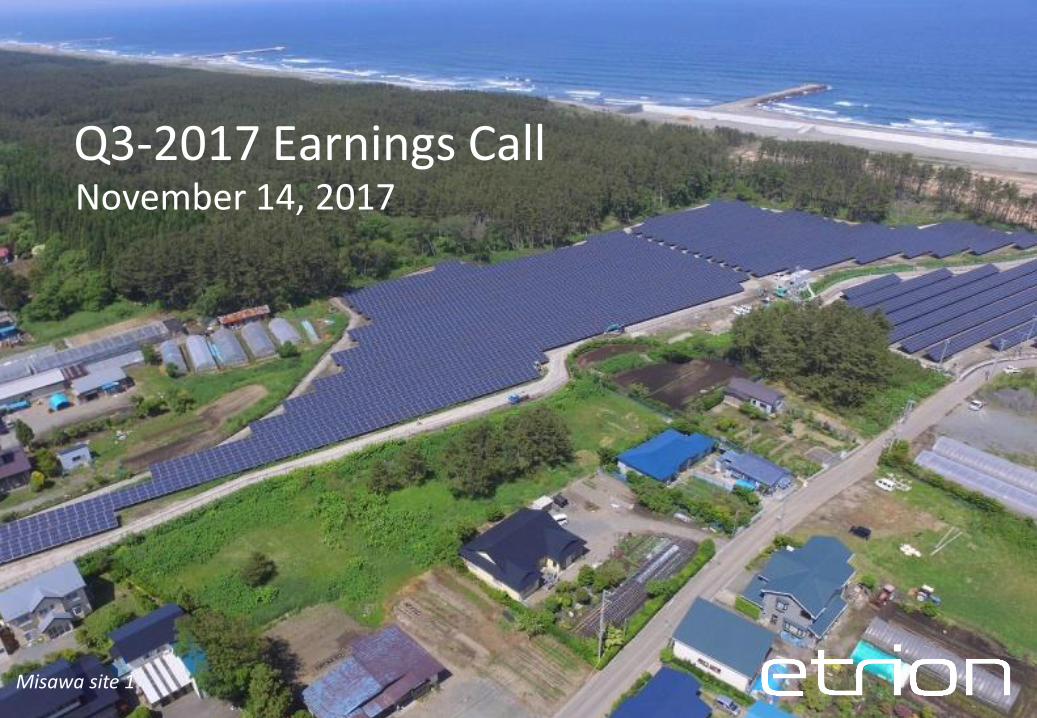
1Misawa site 1
Q3-2017 Earnings CallNovember 14, 2017
2
DISCLAIMERThese materials and the information contained herein are being presented by Etrion Corporation (the “Company”).
These materials do not constitute or form part of any offer or invitation to sell or issue, or any solicitation of any offer to purchase or subscribe for, any securities, nor shall part, or all, of these materials ortheir distribution form the basis of, or be relied on in connection with, any contract or investment decision in relation to any securities. These materials do not constitute any form of commitment orrecommendation on the part of the Company.
These materials do not purport to be all-inclusive or to contain all the information that prospective investors may desire in analyzing and deciding whether or not to hold or transact in the Company’s shares.These materials are not a prospectus or an offer document and has not been prepared, approved or registered in accordance with the Swedish Financial Instruments Trading Act (Sw. lag (1991:980) om handelmed finansiella instrument) or any other Swedish or foreign law. Accordingly, these materials have not been subject to review or approval by the Swedish Financial Supervisory Authority or any other Swedishor foreign authority.
Recipients of these materials must rely on their own examination of the legal, taxation, financial and other consequences of any possible holding or transaction involving the Company’s shares, including themerits and risks involved. Recipients should not treat the contents of these materials as advice relating to legal, taxation or other matters and are advised to consult their own professional advisors concerningthe acquisition, holding or disposal of shares in the Company.
Although the Company has endeavored to contribute towards giving a correct and complete picture of the Company herein, neither the Company nor any of its directors, officers, employees or agents nor anyother person can be held liable for loss or damage of any kind, whether direct or indirect, arising from use of these materials or their contents or otherwise arising in connection therewith. More specifically,the Company and its directors, officers employees and agents assume no responsibility whatsoever and makes no representation or warranty, expressed or implied, for the contents of these materials,including its accuracy, completeness or verification for any other statement made or purported to be made by any of them, or on their behalf.
These materials as well as any other information provided by or on behalf of the Company shall be governed by Swedish law. Any dispute, controversy or claim arising out of or in connection with suchinformation or related matters shall be finally settled by arbitration in accordance with the Arbitration Rules of the Arbitration Institute of the Stockholm Chamber of Commerce. The place of arbitration shallbe Stockholm.
FORWARD-LOOKING STATEMENTS
This presentation contains certain “forward-looking information”. All statements, other than statements of historical fact, that address activities, events or developments that the Company believes, expectsor anticipates will or may occur in the future (including, without limitation, statements relating to: the Company’s growth plans; the timing and scope of solar projects under development or new solar projectsanticipated to be developed by the Company; anticipated production and revenue from the Company’s solar projects; the possibility of spot electricity prices increasing in Chile; the possibility of thetransmission grid in Chile being expanded; and expected returns from the Company’s solar projects in Japan constitute forward-looking information. This forward-looking information reflects the currentexpectations or beliefs of the Company based on information currently available to the Company as well as certain assumptions including, without limitation, assumptions with respect to: the ability of theCompany to acquire and develop additional renewable energy projects as and when anticipated; project and financing costs; and anticipated production and revenue from the Company's current and futuresolar projects. Forward-looking information is subject to a number of significant risks and uncertainties and other factors that may cause the actual results of the Company to differ materially from thosediscussed in the forward-looking information, and even if such actual results are realized or substantially realized, there can be no assurance that they will have the expected consequences to, or effects on theCompany. Factors that could cause actual results or events to differ materially from current expectations include, but are not limited to: the risk that the Company may not be able to identify and/or acquireadditional renewable energy projects on economic terms; uncertainties with respect to the receipt or timing of all applicable permits for the development of current and additional renewable energy projects;the possibility of project cost overruns; the risk that the Company may not be able to obtain project financing on anticipated terms; the risk of reductions in FiT and spot market prices for electricity; and thepossibility that the Company's projects will not produce power at the anticipated levels.
Any forward-looking information speaks only as of the date on which it is made and, except as may be required by applicable securities laws, the Company disclaims any intent or obligation to update anyforward-looking information, whether as a result of new information, future events or results or otherwise. Although the Company believes that the assumptions inherent in the forward-looking informationare reasonable, forward-looking information is not a guarantee of future performance and accordingly undue reliance should not be put on such information due to the inherent uncertainty therein.
Where information in this presentation has been sourced from a third party, the Company confirms that the information has been accurately reproduced and so far as the Company is able to ascertain frominformation published by that third party, and so far as the Company is aware, no facts have been omitted which would render the reproduced information inaccurate or misleading.
These materials and the information contained herein are not an offer of securities for sale in the United States or elsewhere and are not for publication or distribution to persons in the United States (withinthe meaning of Regulation S under the U.S. Securities Act of 1933, as amended (the Securities Act)). The securities in the Company have not been and will not be registered under the Securities Act and may notbe offered or sold in the United States except pursuant to an exemption from the registration requirements of the Securities Act.
3
CORPORATE OVERVIEW
4
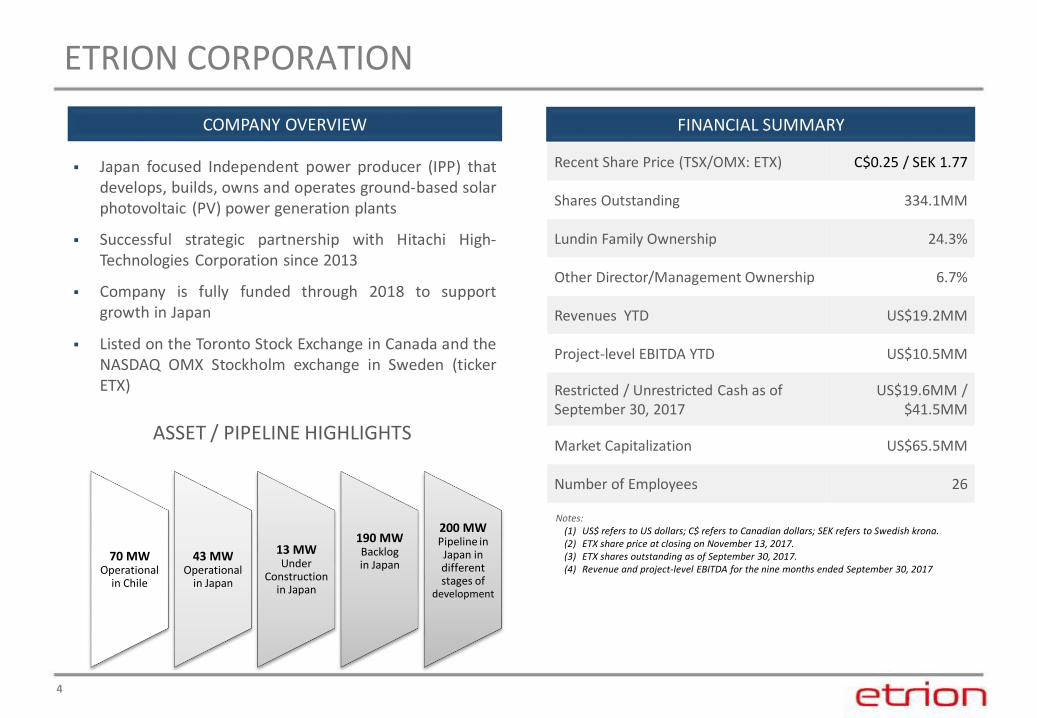
ETRION CORPORATION
▪ Japan focused Independent power producer (IPP) thatdevelops, builds, owns and operates ground-based solarphotovoltaic (PV) power generation plants
▪ Successful strategic partnership with Hitachi High-Technologies Corporation since 2013
▪ Company is fully funded through 2018 to supportgrowth in Japan
▪ Listed on the Toronto Stock Exchange in Canada and theNASDAQ OMX Stockholm exchange in Sweden (tickerETX)
Notes: (1) US$ refers to US dollars; C$ refers to Canadian dollars; SEK refers to Swedish krona. (2) ETX share price at closing on November 13, 2017. (3) ETX shares outstanding as of September 30, 2017.(4) Revenue and project-level EBITDA for the nine months ended September 30, 2017
COMPANY OVERVIEW
70 MW Operational
in Chile
43 MW Operational
in Japan
13 MW Under
Construction in Japan
190 MW Backlog in Japan
200 MW Pipeline in Japan in different stages of
development
ASSET / PIPELINE HIGHLIGHTS
FINANCIAL SUMMARY
Recent Share Price (TSX/OMX: ETX) C$0.25 / SEK 1.77
Shares Outstanding 334.1MM
Lundin Family Ownership 24.3%
Other Director/Management Ownership 6.7%
Revenues YTD US$19.2MM
Project-level EBITDA YTD US$10.5MM
Restricted / Unrestricted Cash as of September 30, 2017
US$19.6MM / $41.5MM
Market Capitalization US$65.5MM
Number of Employees 26
FINANCIAL SUMMARY
5
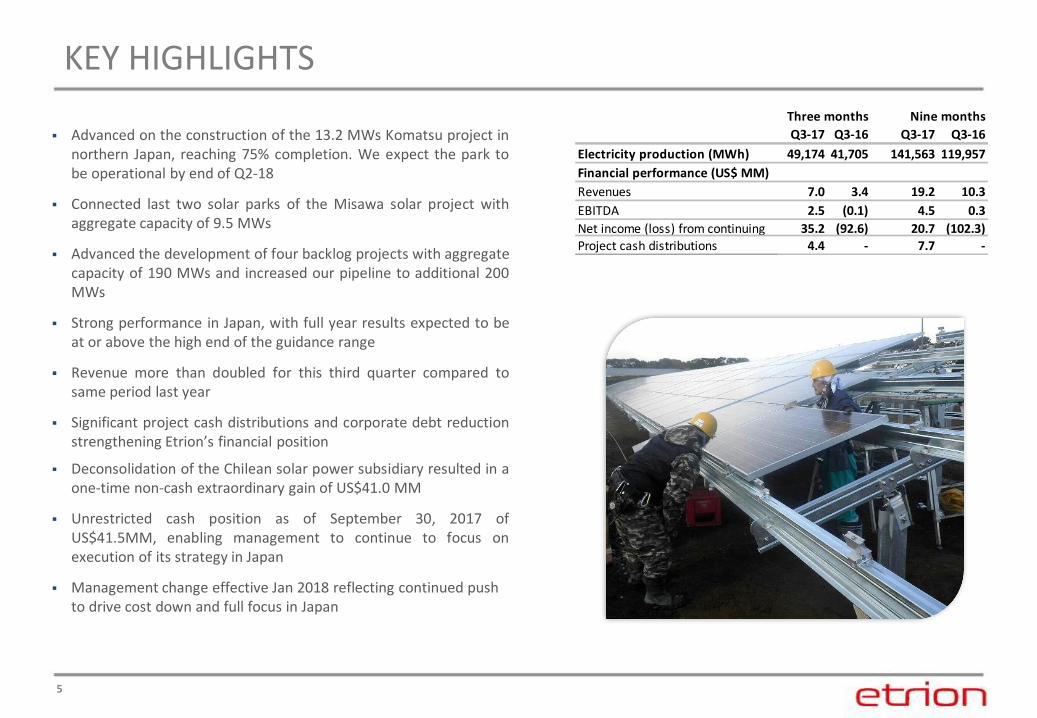
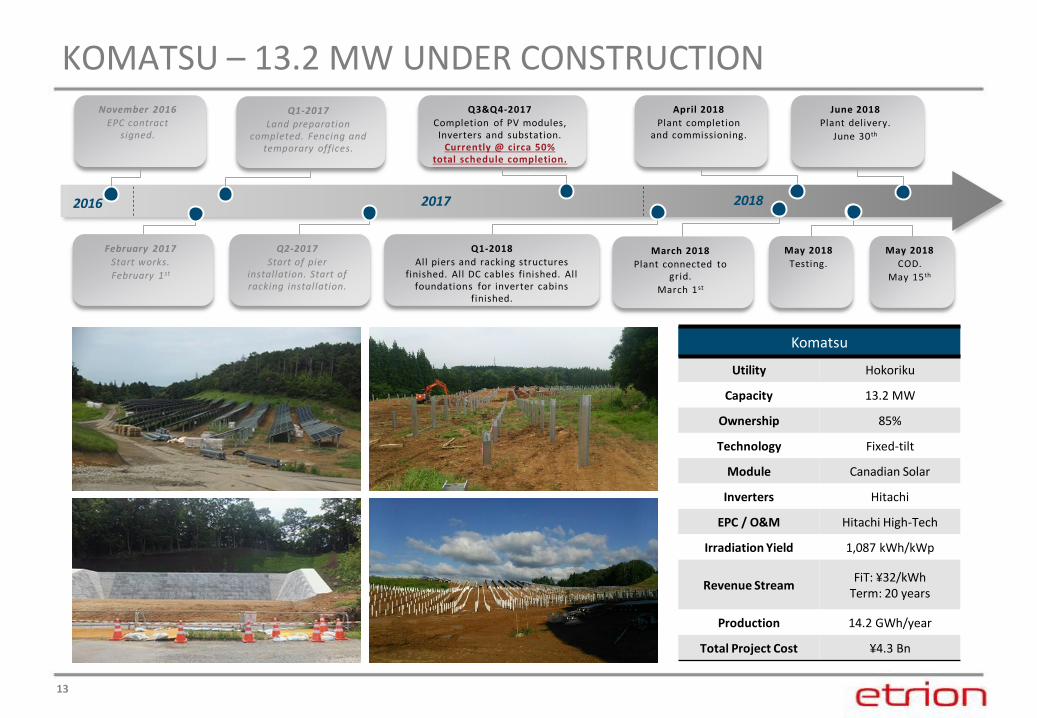
▪ Advanced on the construction of the 13.2 MWs Komatsu project innorthern Japan, reaching 75% completion. We expect the park tobe operational by end of Q2-18
▪ Connected last two solar parks of the Misawa solar project withaggregate capacity of 9.5 MWs
▪ Advanced the development of four backlog projects with aggregatecapacity of 190 MWs and increased our pipeline to additional 200MWs
▪ Strong performance in Japan, with full year results expected to beat or above the high end of the guidance range
▪ Revenue more than doubled for this third quarter compared tosame period last year
▪ Significant project cash distributions and corporate debt reductionstrengthening Etrion’s financial position
▪ Deconsolidation of the Chilean solar power subsidiary resulted in aone-time non-cash extraordinary gain of US$41.0 MM
▪ Unrestricted cash position as of September 30, 2017 ofUS$41.5MM, enabling management to continue to focus onexecution of its strategy in Japan
▪ Management change effective Jan 2018 reflecting continued push to drive cost down and full focus in Japan
KEY HIGHLIGHTS
Q3-17 Q3-16 Q3-17 Q3-16
Electricity production (MWh) 49,174 41,705 141,563 119,957
Financial performance (US$ MM)
Revenues 7.0 3.4 19.2 10.3
EBITDA 2.5 (0.1) 4.5 0.3
Net income (loss) from continuing 35.2 (92.6) 20.7 (102.3)Project cash distributions 4.4 - 7.7 -
Three months Nine months
6
JAPAN
7
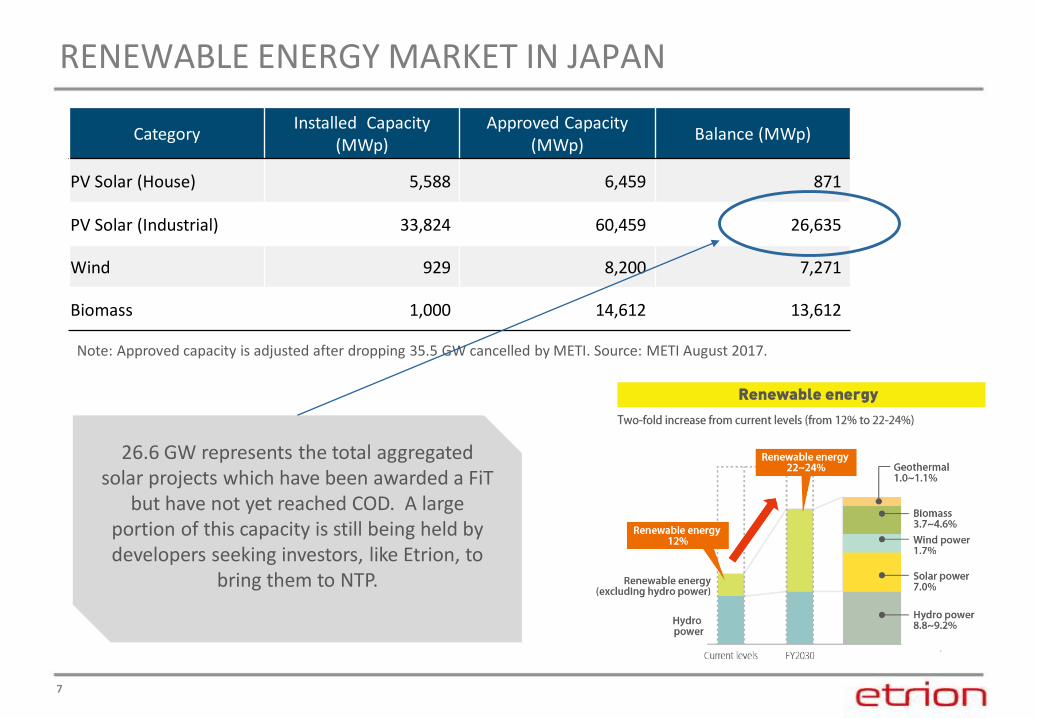
RENEWABLE ENERGY MARKET IN JAPAN
Note: Approved capacity is adjusted after dropping 35.5 GW cancelled by METI. Source: METI August 2017.
CategoryInstalled Capacity
(MWp)Approved Capacity
(MWp)Balance (MWp)
PV Solar (House) 5,588 6,459 871
PV Solar (Industrial) 33,824 60,459 26,635
Wind 929 8,200 7,271
Biomass 1,000 14,612 13,612
26.6 GW represents the total aggregated solar projects which have been awarded a FiT
but have not yet reached COD. A large portion of this capacity is still being held by developers seeking investors, like Etrion, to
bring them to NTP.
8
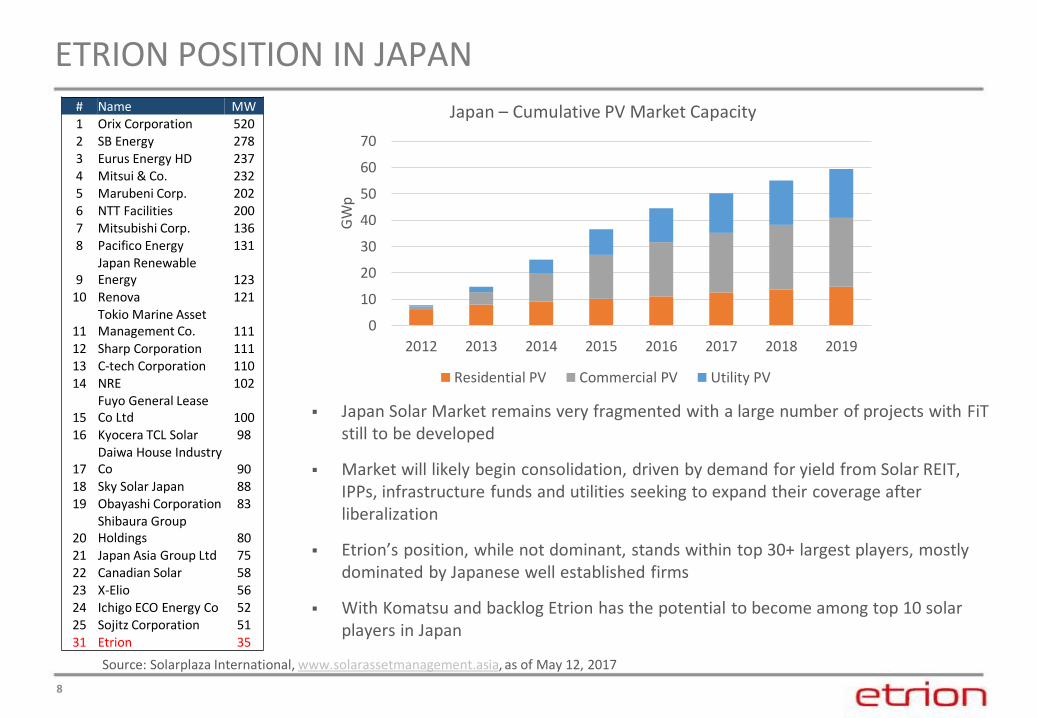
ETRION POSITION IN JAPAN
▪ Japan Solar Market remains very fragmented with a large number of projects with FiTstill to be developed
▪ Market will likely begin consolidation, driven by demand for yield from Solar REIT, IPPs, infrastructure funds and utilities seeking to expand their coverage after liberalization
▪ Etrion’s position, while not dominant, stands within top 30+ largest players, mostly dominated by Japanese well established firms
▪ With Komatsu and backlog Etrion has the potential to become among top 10 solar players in Japan
# Name MW 1 Orix Corporation 5202 SB Energy 2783 Eurus Energy HD 2374 Mitsui & Co. 2325 Marubeni Corp. 2026 NTT Facilities 2007 Mitsubishi Corp. 1368 Pacifico Energy 131
9Japan Renewable Energy 123
10 Renova 121
11Tokio Marine Asset Management Co. 111
12 Sharp Corporation 11113 C-tech Corporation 11014 NRE 102
15Fuyo General Lease Co Ltd 100
16 Kyocera TCL Solar 98
17Daiwa House Industry Co 90
18 Sky Solar Japan 8819 Obayashi Corporation 83
20Shibaura Group Holdings 80
21 Japan Asia Group Ltd 7522 Canadian Solar 5823 X-Elio 5624 Ichigo ECO Energy Co 5225 Sojitz Corporation 5131 Etrion 35
Source: Solarplaza International, www.solarassetmanagement.asia, as of May 12, 2017
0
10
20
30
40
50
60
70
2012 2013 2014 2015 2016 2017 2018 2019G
Wp
Japan – Cumulative PV Market Capacity
Residential PV Commercial PV Utility PV
9
ETRION BUSINESS
10
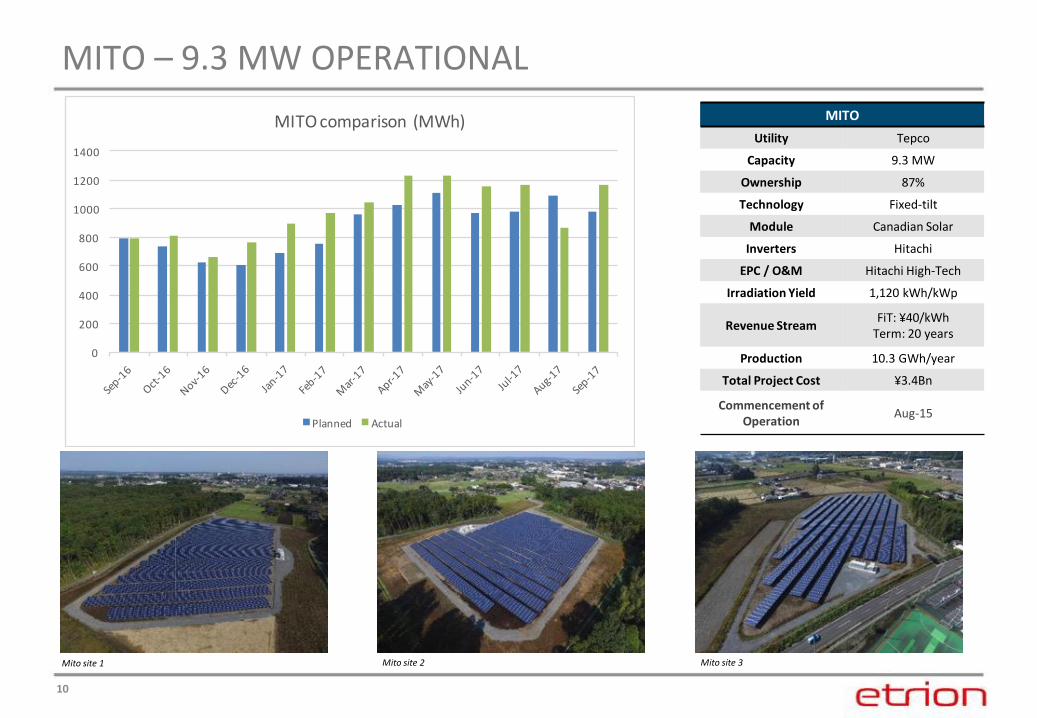
MITO – 9.3 MW OPERATIONAL
MITO
Utility Tepco
Capacity 9.3 MW
Ownership 87%
Technology Fixed-tilt
Module Canadian Solar
Inverters Hitachi
EPC / O&M Hitachi High-Tech
Irradiation Yield 1,120 kWh/kWp
Revenue StreamFiT: ¥40/kWh
Term: 20 years
Production 10.3 GWh/year
Total Project Cost ¥3.4Bn
Commencement of Operation
Aug-15
Mito site 1 Mito site 2 Mito site 3
0
200
400
600
800
1000
1200
1400
MITOcomparison(MWh)
Planned Actual
11
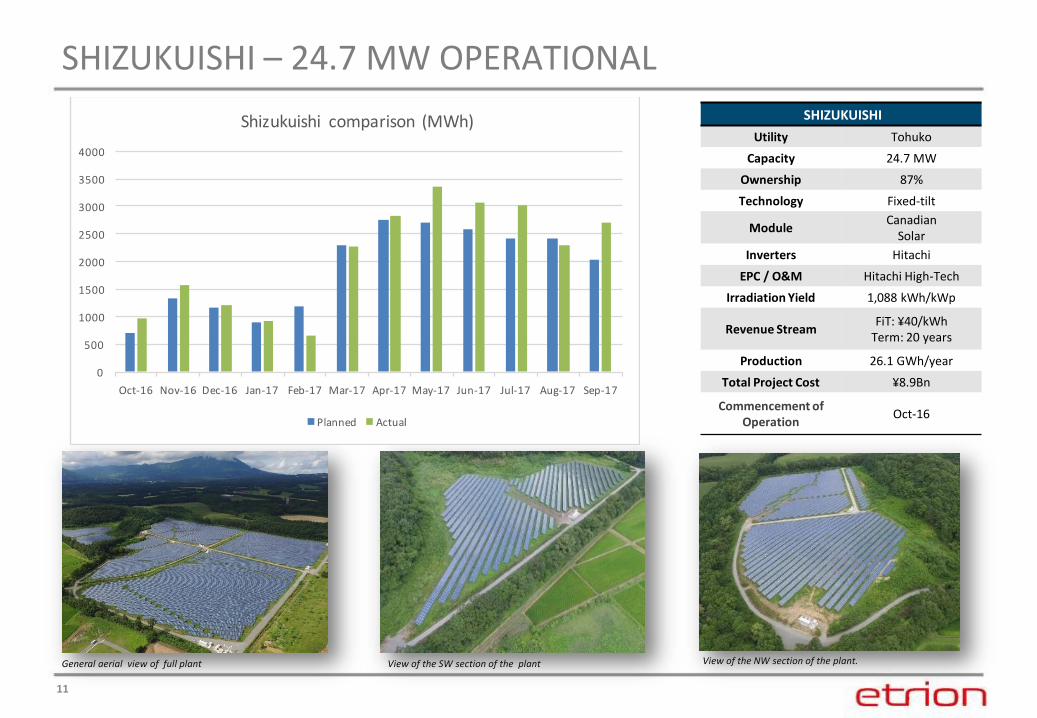
SHIZUKUISHI – 24.7 MW OPERATIONAL
SHIZUKUISHI
Utility Tohuko
Capacity 24.7 MW
Ownership 87%
Technology Fixed-tilt
ModuleCanadian
Solar
Inverters Hitachi
EPC / O&M Hitachi High-Tech
Irradiation Yield 1,088 kWh/kWp
Revenue StreamFiT: ¥40/kWh
Term: 20 years
Production 26.1 GWh/year
Total Project Cost ¥8.9Bn
Commencement of Operation
Oct-16
General aerial view of full plant View of the NW section of the plant. View of the SW section of the plant
12
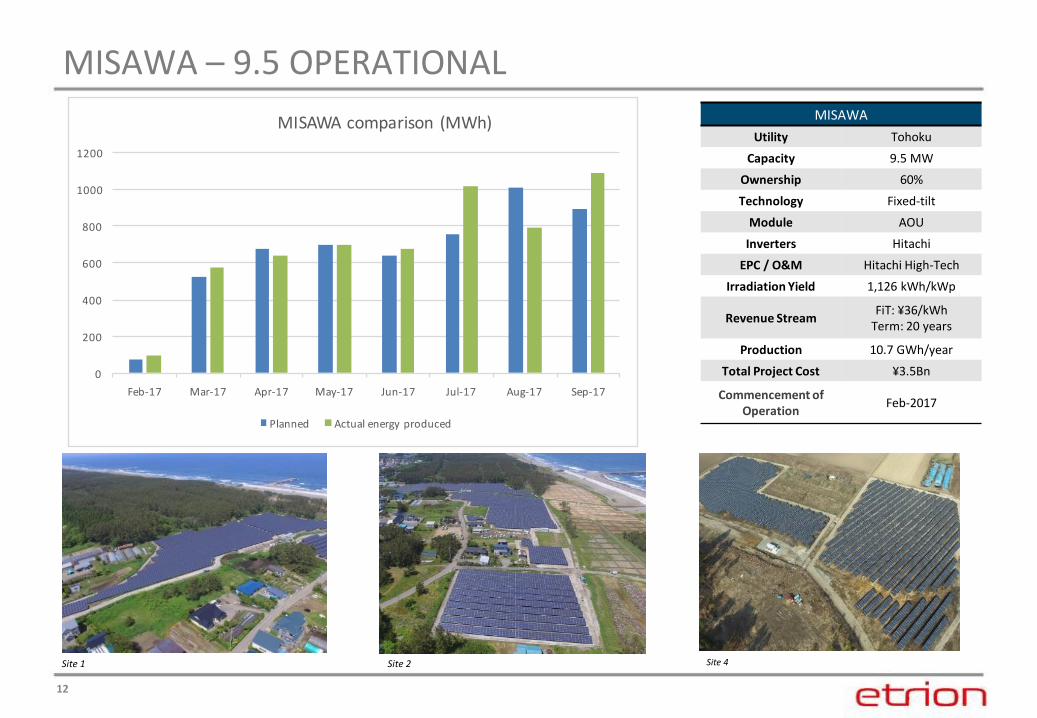
MISAWA – 9.5 OPERATIONAL
Site 4
MISAWA
Utility Tohoku
Capacity 9.5 MW
Ownership 60%
Technology Fixed-tilt
Module AOU
Inverters Hitachi
EPC / O&M Hitachi High-Tech
Irradiation Yield 1,126 kWh/kWp
Revenue StreamFiT: ¥36/kWh
Term: 20 years
Production 10.7 GWh/year
Total Project Cost ¥3.5Bn
Commencement of Operation
Feb-2017
Site 1 Site 2
13
KOMATSU – 13.2 MW UNDER CONSTRUCTION
2016 2017
November 2016
EPC contract signed.
Q1-2018
All piers and racking structures finished. All DC cables finished. All
foundations for inverter cabins finished.
February 2017
Start works.
February 1st
March 2018
Plant connected to grid.
March 1st
May 2018
Testing.
Q3&Q4-2017
Completion of PV modules,Inverters and substation.
Currently @ circa 50% total schedule completion.
Q2-2017
Start of pier installation. Start of racking installation.
Q1-2017
Land preparation completed. Fencing and
temporary offices.
April 2018
Plant completion and commissioning.
2018
May 2018
COD.
May 15 th
Komatsu
Utility Hokoriku
Capacity 13.2 MW
Ownership 85%
Technology Fixed-tilt
Module Canadian Solar
Inverters Hitachi
EPC / O&M Hitachi High-Tech
Irradiation Yield 1,087 kWh/kWp
Revenue StreamFiT: ¥32/kWh
Term: 20 years
Production 14.2 GWh/year
Total Project Cost ¥4.3 Bn
June 2018
Plant delivery.
June 30 th
14
BACKLOG ACTIVITIES
15
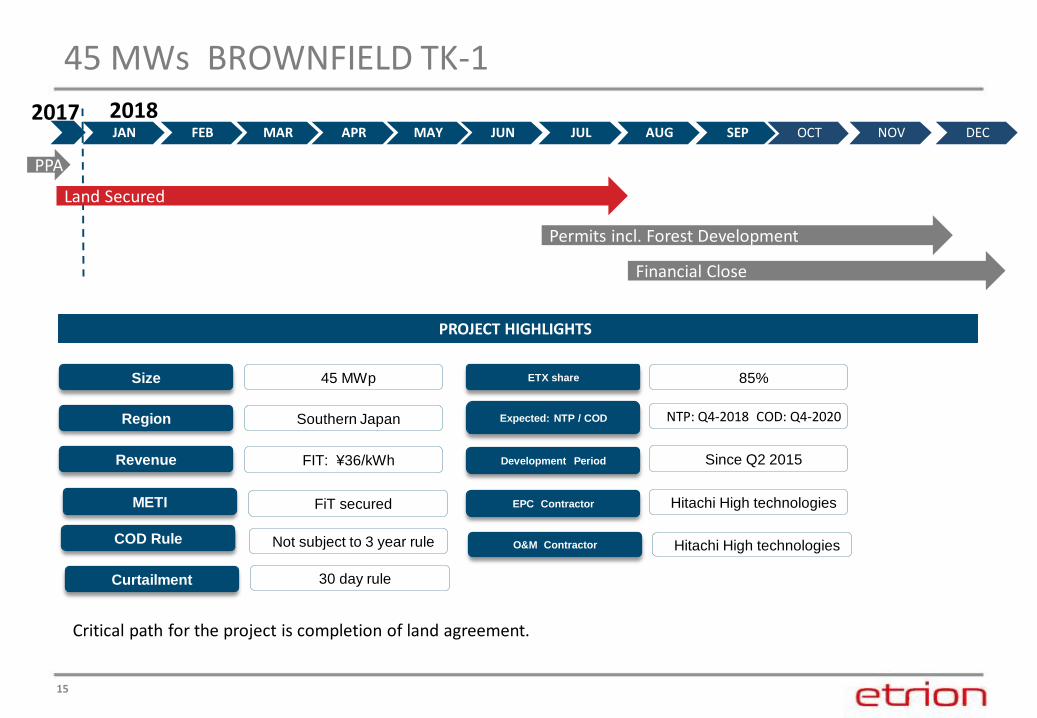
45 MWs BROWNFIELD TK-1
JAN FEB MAR APR MAY JUN JUL AUG SEP OCT NOV DEC
2018
PROJECT HIGHLIGHTS
Financial Close
Permits incl. Forest Development
PPA
2017
Size 45 MWp
Region Southern Japan
Revenue FIT: ¥36/kWh
Expected: NTP / COD NTP: Q4-2018 COD: Q4-2020
ETX share 85%
Development Period Since Q2 2015
FiT securedMETI EPC Contractor Hitachi High technologies
Critical path for the project is completion of land agreement.
Hitachi High technologiesO&M ContractorCOD Rule Not subject to 3 year rule
Curtailment 30 day rule
Land Secured
16
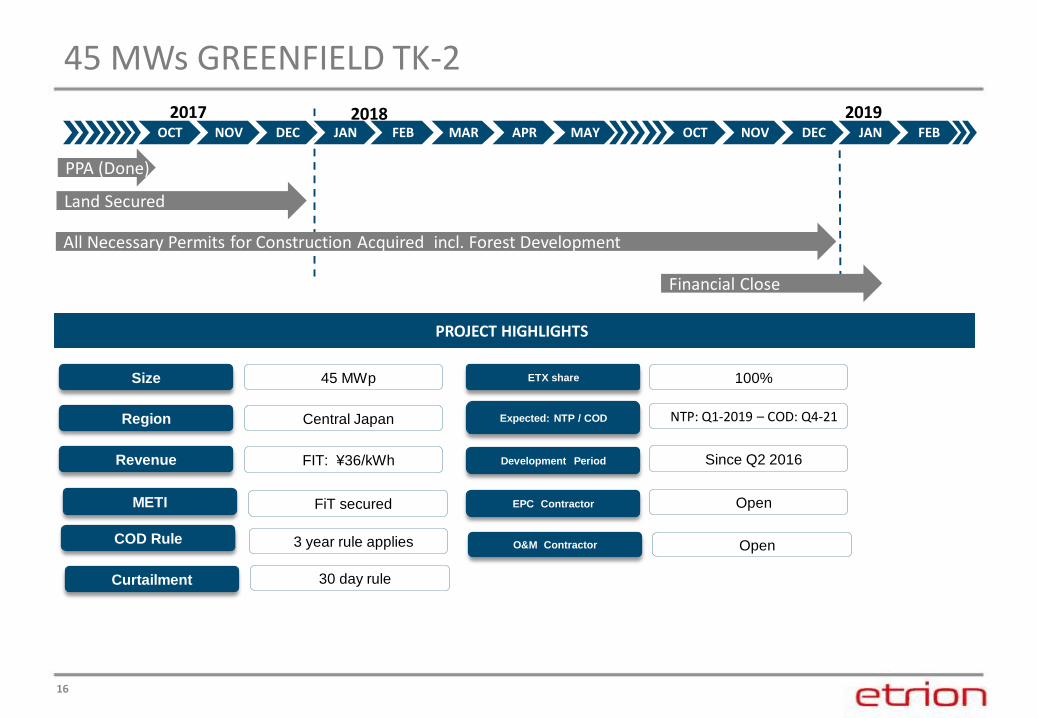
45 MWs GREENFIELD TK-2
OCT NOV DEC JAN FEB MAR APR MAY OCT NOV DEC JAN FEB
Land Secured
2017 2018
PROJECT HIGHLIGHTS
Financial Close
All Necessary Permits for Construction Acquired incl. Forest Development
PPA (Done)
2019
Size 45 MWp
Region Central Japan
Revenue FIT: ¥36/kWh
Expected: NTP / COD NTP: Q1-2019 – COD: Q4-21
ETX share 100%
Development Period Since Q2 2016
FiT securedMETI EPC Contractor Open
OpenO&M ContractorCOD Rule 3 year rule applies
Curtailment 30 day rule
17
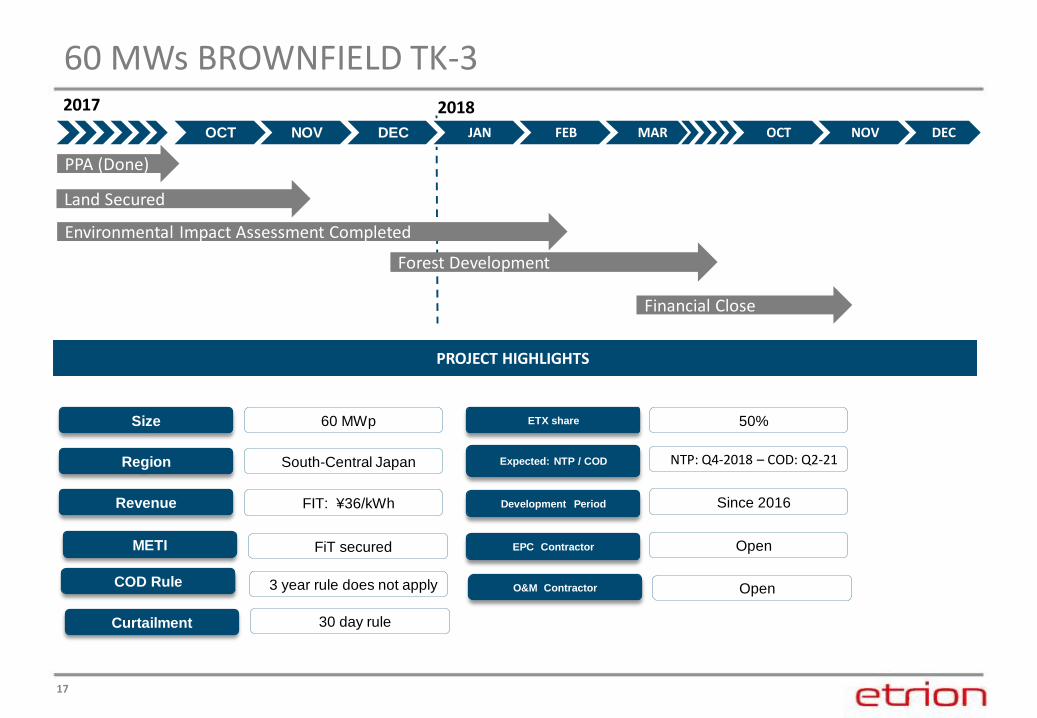
60 MWs BROWNFIELD TK-3
OCT NOV DEC JAN FEB MAR OCT NOV DEC
Land Secured
Environmental Impact Assessment Completed
2017 2018
PROJECT HIGHLIGHTS
PPA (Done)
Financial Close
Forest Development
Size 60 MWp
Region South-Central Japan
Revenue FIT: ¥36/kWh
Expected: NTP / COD NTP: Q4-2018 – COD: Q2-21
ETX share 50%
Development Period Since 2016
FiT securedMETI EPC Contractor Open
OpenO&M ContractorCOD Rule 3 year rule does not apply
Curtailment 30 day rule
18
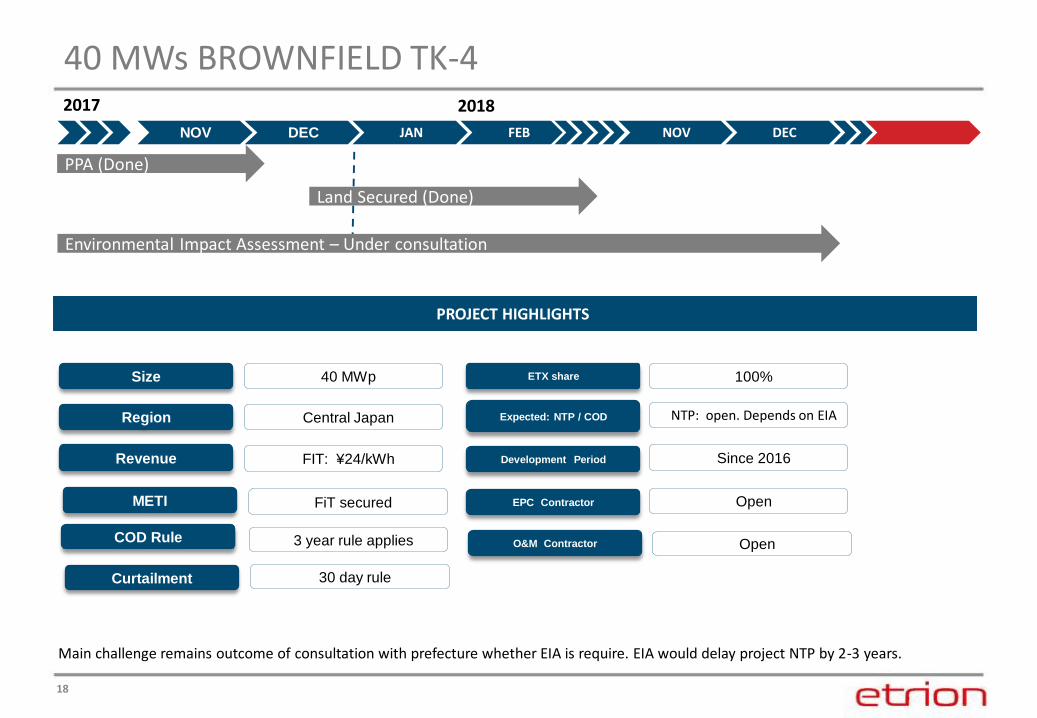
40 MWs BROWNFIELD TK-4
NOV DEC JAN FEB NOV DEC
Land Secured (Done)
2017 2018
PPA (Done)
Environmental Impact Assessment – Under consultation
PROJECT HIGHLIGHTS
Size 40 MWp
Region Central Japan
Revenue FIT: ¥24/kWh
Expected: NTP / COD NTP: open. Depends on EIA
ETX share 100%
Development Period Since 2016
FiT securedMETI EPC Contractor Open
OpenO&M ContractorCOD Rule 3 year rule applies
Curtailment 30 day rule
Main challenge remains outcome of consultation with prefecture whether EIA is require. EIA would delay project NTP by 2-3 years.
19
Q3-2017 FINANCIAL REVIEW
20
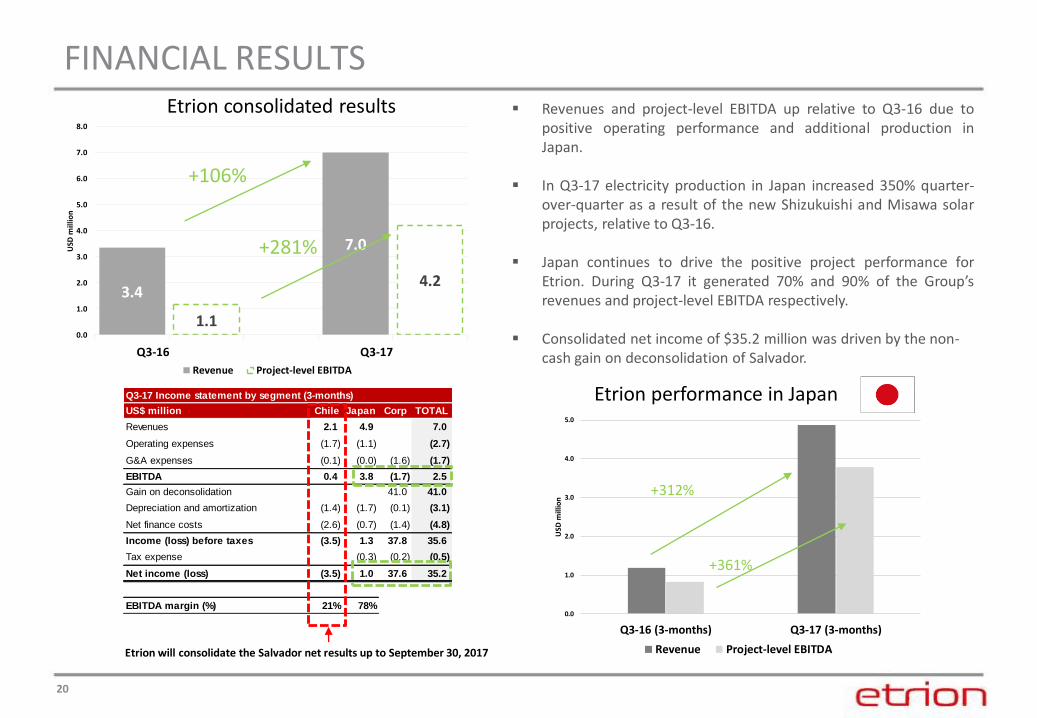
0.0
1.0
2.0
3.0
4.0
5.0
Q3-16 (3-months) Q3-17 (3-months)
USD
mill
ion
Revenue Project-level EBITDA
Q3-17 Income statement by segment (3-months)
US$ million Chile Japan Corp TOTAL
Revenues 2.1 4.9 7.0
Operating expenses (1.7) (1.1) (2.7)
G&A expenses (0.1) (0.0) (1.6) (1.7)
EBITDA 0.4 3.8 (1.7) 2.5
Gain on deconsolidation 41.0 41.0
Depreciation and amortization (1.4) (1.7) (0.1) (3.1)
Net finance costs (2.6) (0.7) (1.4) (4.8)
Income (loss) before taxes (3.5) 1.3 37.8 35.6
Tax expense (0.3) (0.2) (0.5)
Net income (loss) (3.5) 1.0 37.6 35.2
EBITDA margin (%) 21% 78%
3.4
7.0
1.1
4.2
0.0
1.0
2.0
3.0
4.0
5.0
6.0
7.0
8.0
Q3-16 Q3-17
USD
mill
ion
Revenue Project-level EBITDA
FINANCIAL RESULTS
+106%
+281%
▪ Revenues and project-level EBITDA up relative to Q3-16 due topositive operating performance and additional production inJapan.
▪ In Q3-17 electricity production in Japan increased 350% quarter-over-quarter as a result of the new Shizukuishi and Misawa solarprojects, relative to Q3-16.
▪ Japan continues to drive the positive project performance forEtrion. During Q3-17 it generated 70% and 90% of the Group’srevenues and project-level EBITDA respectively.
▪ Consolidated net income of $35.2 million was driven by the non-cash gain on deconsolidation of Salvador.
Etrion will consolidate the Salvador net results up to September 30, 2017
Etrion performance in Japan
+312%
+361%
Etrion consolidated results
21
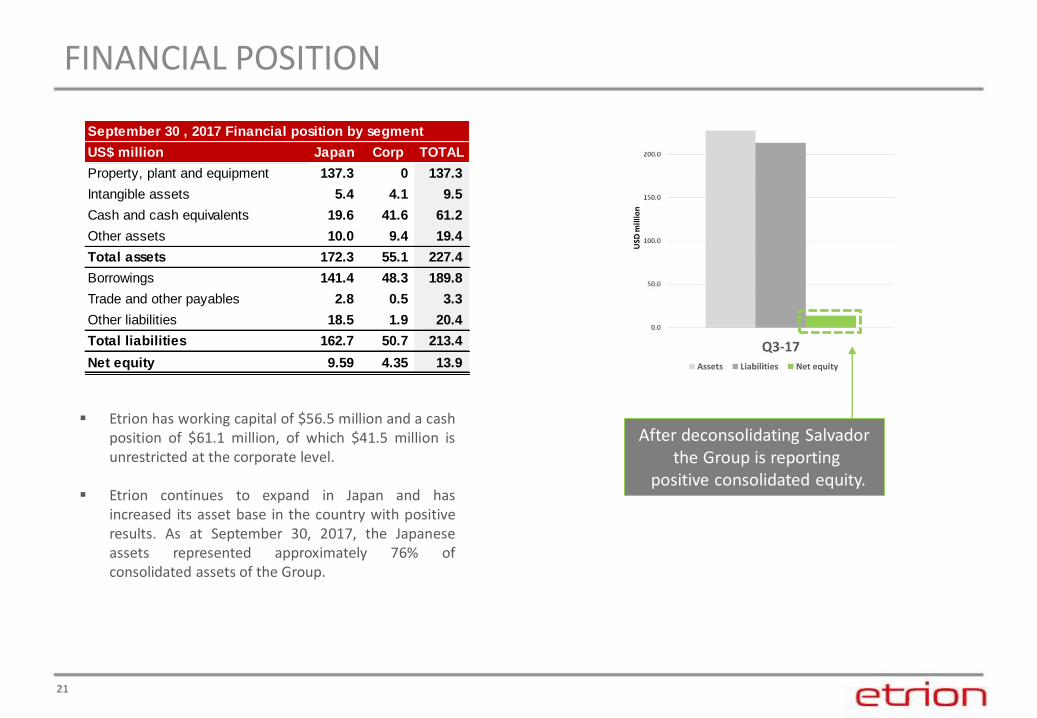
FINANCIAL POSITION
After deconsolidating Salvadorthe Group is reporting
positive consolidated equity.
▪ Etrion has working capital of $56.5 million and a cashposition of $61.1 million, of which $41.5 million isunrestricted at the corporate level.
▪ Etrion continues to expand in Japan and hasincreased its asset base in the country with positiveresults. As at September 30, 2017, the Japaneseassets represented approximately 76% ofconsolidated assets of the Group.
September 30 , 2017 Financial position by segment
US$ million Japan Corp TOTAL
Property, plant and equipment 137.3 0 137.3
Intangible assets 5.4 4.1 9.5
Cash and cash equivalents 19.6 41.6 61.2
Other assets 10.0 9.4 19.4
Total assets 172.3 55.1 227.4
Borrowings 141.4 48.3 189.8
Trade and other payables 2.8 0.5 3.3
Other liabilities 18.5 1.9 20.4
Total liabilities 162.7 50.7 213.4
Net equity 9.59 4.35 13.9
22
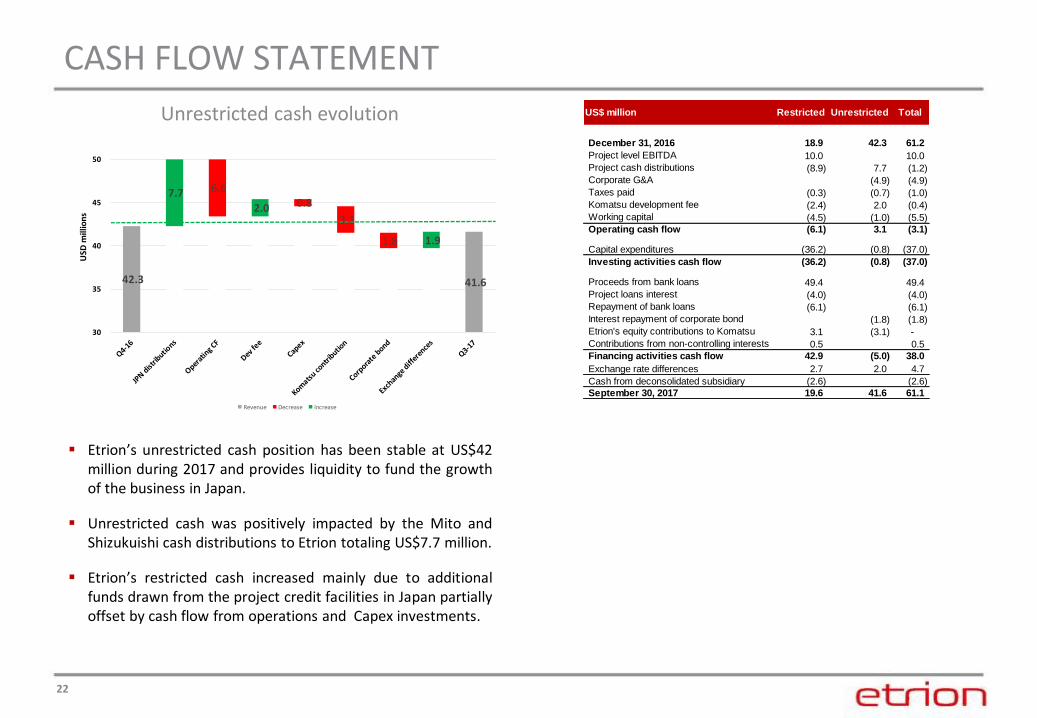
CASH FLOW STATEMENT
▪ Etrion’s unrestricted cash position has been stable at US$42million during 2017 and provides liquidity to fund the growthof the business in Japan.
▪ Unrestricted cash was positively impacted by the Mito andShizukuishi cash distributions to Etrion totaling US$7.7 million.
▪ Etrion’s restricted cash increased mainly due to additionalfunds drawn from the project credit facilities in Japan partiallyoffset by cash flow from operations and Capex investments.
Unrestricted cash evolution
41.6
6.6 0.8
3.1
1.8
7.7
2.0
1.9
42.3
30
35
40
45
50
USD
mill
ion
s
Revenue Decrease Increase
US$ million Restricted Unrestricted Total
December 31, 2016 18.9 42.3 61.2
Project level EBITDA 10.0 10.0
Project cash distributions (8.9) 7.7 (1.2)
Corporate G&A (4.9) (4.9)
Taxes paid (0.3) (0.7) (1.0)
Komatsu development fee (2.4) 2.0 (0.4)
Working capital (4.5) (1.0) (5.5)
Operating cash flow (6.1) 3.1 (3.1)
Capital expenditures (36.2) (0.8) (37.0)
Investing activities cash flow (36.2) (0.8) (37.0)
Proceeds from bank loans 49.4 49.4
Project loans interest (4.0) (4.0)
Repayment of bank loans (6.1) (6.1)
Interest repayment of corporate bond (1.8) (1.8)
Etrion's equity contributions to Komatsu 3.1 (3.1) -
Contributions from non-controlling interests 0.5 0.5
Financing activities cash flow 42.9 (5.0) 38.0
Exchange rate differences 2.7 2.0 4.7
Cash from deconsolidated subsidiary (2.6) (2.6)
September 30, 2017 19.6 41.6 61.1
23
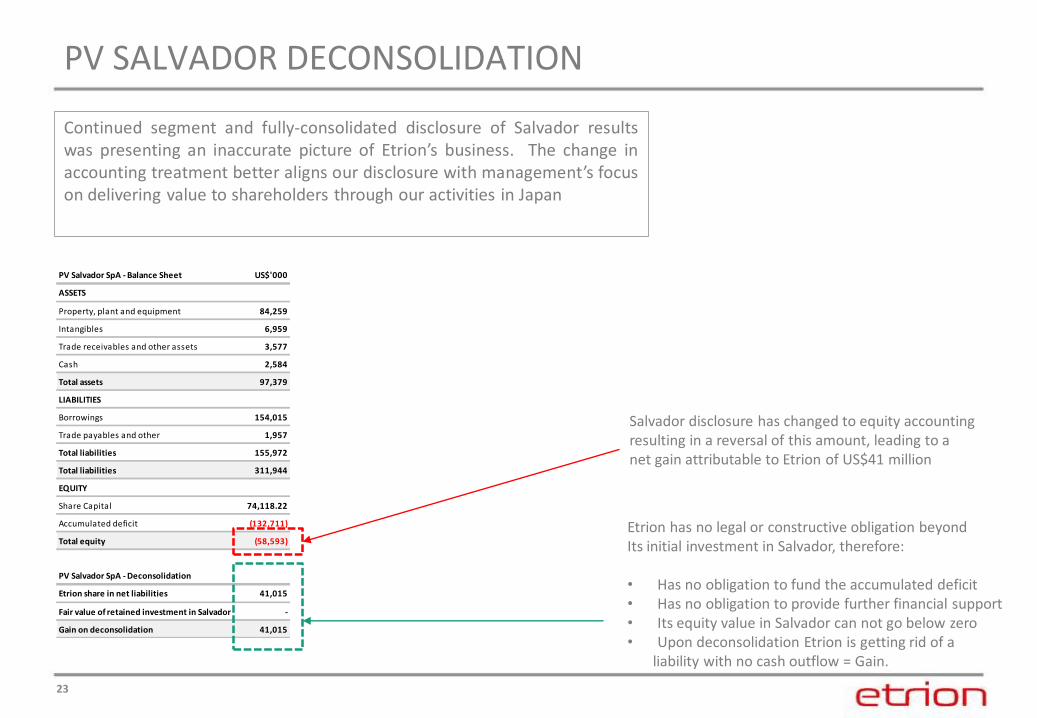
PV SALVADOR DECONSOLIDATION
PV Salvador SpA - Balance Sheet US$'000
ASSETS
Property, plant and equipment 84,259
Intangibles 6,959
Trade receivables and other assets 3,577
Cash 2,584
Total assets 97,379
LIABILITIES
Borrowings 154,015
Trade payables and other 1,957
Total liabilities 155,972
Total liabilities 311,944
EQUITY
Share Capital 74,118.22
Accumulated deficit (132,711)
Total equity (58,593)
PV Salvador SpA - Deconsolidation
Etrion share in net liabilities 41,015
Fair value of retained investment in Salvador -
Gain on deconsolidation 41,015
Salvador disclosure has changed to equity accountingresulting in a reversal of this amount, leading to a net gain attributable to Etrion of US$41 million
Etrion has no legal or constructive obligation beyond Its initial investment in Salvador, therefore:
• Has no obligation to fund the accumulated deficit• Has no obligation to provide further financial support• Its equity value in Salvador can not go below zero• Upon deconsolidation Etrion is getting rid of a
liability with no cash outflow = Gain.
Continued segment and fully-consolidated disclosure of Salvador resultswas presenting an inaccurate picture of Etrion’s business. The change inaccounting treatment better aligns our disclosure with management’s focuson delivering value to shareholders through our activities in Japan
24
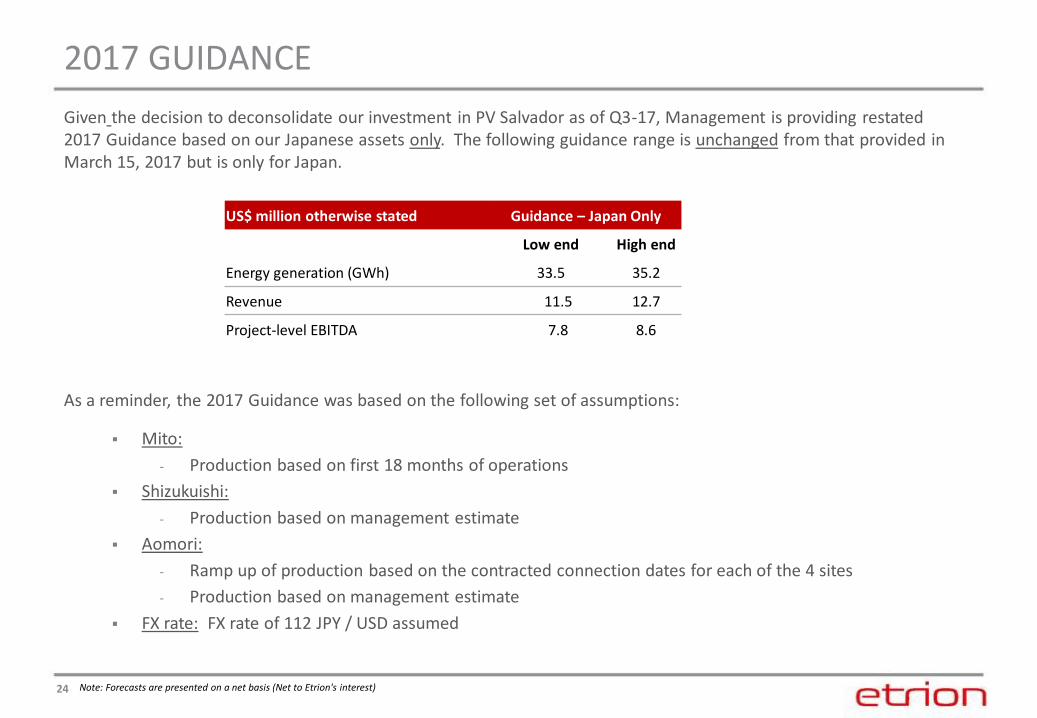
2017 GUIDANCE
Note: Forecasts are presented on a net basis (Net to Etrion's interest)
Given the decision to deconsolidate our investment in PV Salvador as of Q3-17, Management is providing restated 2017 Guidance based on our Japanese assets only. The following guidance range is unchanged from that provided in March 15, 2017 but is only for Japan.
As a reminder, the 2017 Guidance was based on the following set of assumptions:
▪ Mito:
- Production based on first 18 months of operations
▪ Shizukuishi:
- Production based on management estimate
▪ Aomori:
- Ramp up of production based on the contracted connection dates for each of the 4 sites
- Production based on management estimate
▪ FX rate: FX rate of 112 JPY / USD assumed
US$ million otherwise stated Guidance – Japan Only
Low end High end
Energy generation (GWh) 33.5 35.2
Revenue 11.5 12.7
Project-level EBITDA 7.8 8.6
25
SUMMARY
26
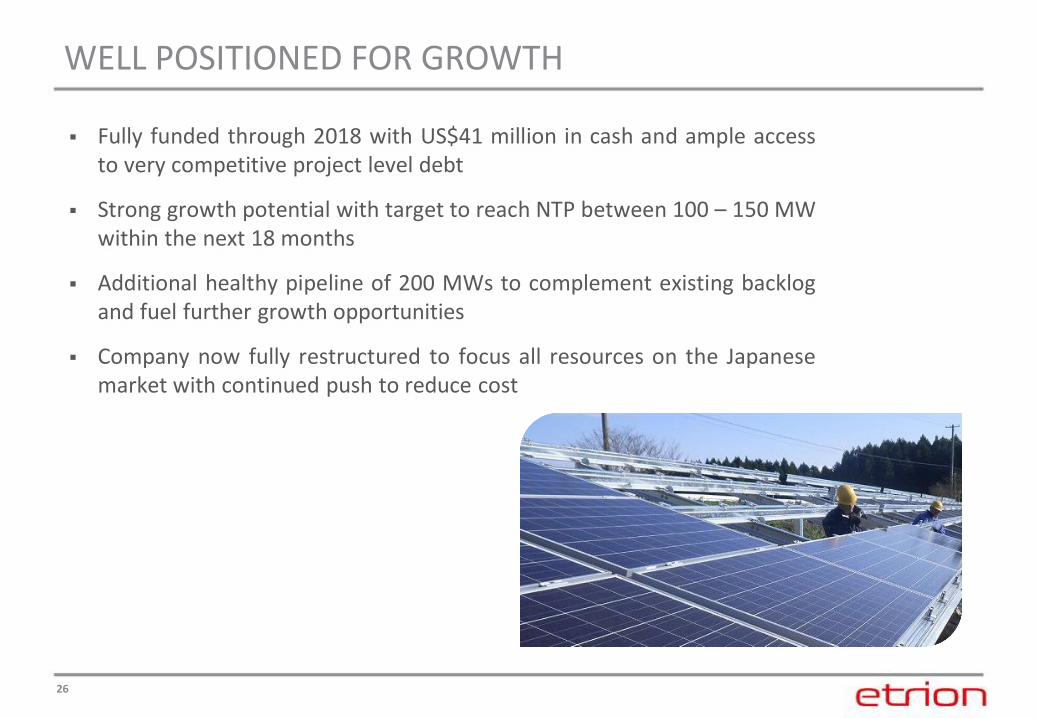
WELL POSITIONED FOR GROWTH
▪ Fully funded through 2018 with US$41 million in cash and ample accessto very competitive project level debt
▪ Strong growth potential with target to reach NTP between 100 – 150 MWwithin the next 18 months
▪ Additional healthy pipeline of 200 MWs to complement existing backlogand fuel further growth opportunities
▪ Company now fully restructured to focus all resources on the Japanesemarket with continued push to reduce cost
27
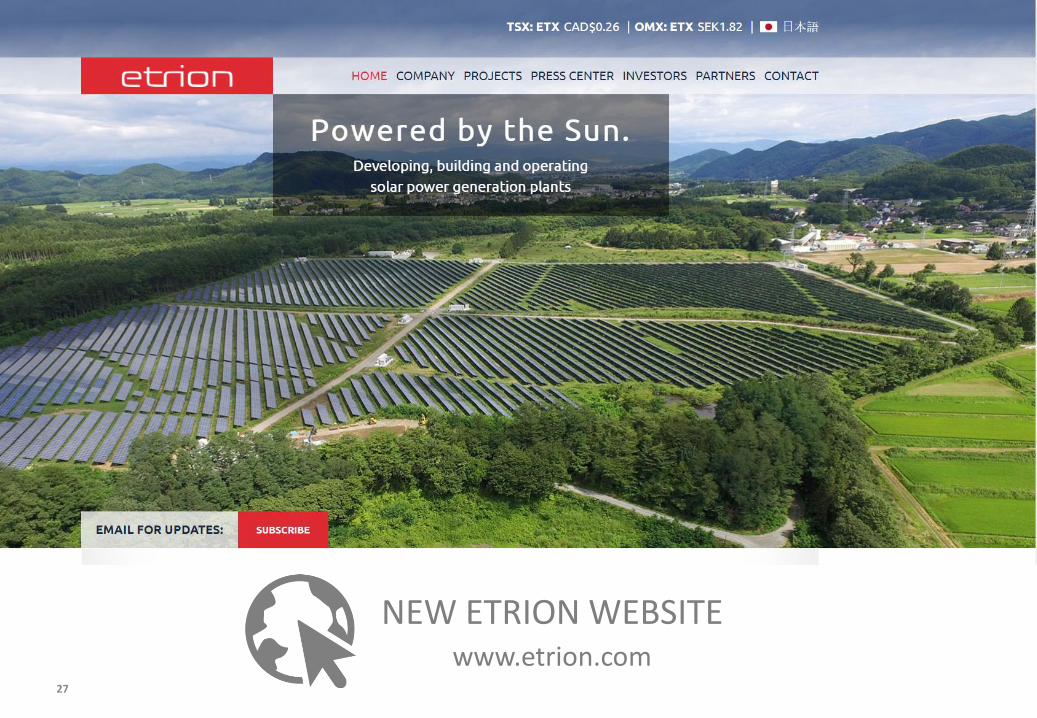
NEW ETRION WEBSITEwww.etrion.com
28
Etrion Corporation
40 SW 13 Street, PH-1Miami, FL 33130, USA
Phone: +1 786.636.6449
www.etrion.com
Contact Information