Embed Size (px)
Citation preview
1investor.arrow.com
Third Quarter
CFO CommentaryAs reflected in our earnings release, there are a number of items that impact the comparability of our results with those in the trailing quarter and prior quarter of last year. The discussion of our results may exclude these items to give you a better sense of our operating results. As always, the operating information we provide to you should be used as a complement to GAAP numbers. For a complete reconciliation between our GAAP and non-GAAP results, please refer to our earnings release and the earnings reconciliation found at the end of this document.
The following reported and adjusted information included in this CFO commentary is unaudited and should be read in conjunction with the company’s Form 10-Q for the quarterly period ended September 29, 2018, and the Annual Report on Form 10-K as filed with the Securities and Exchange Commission.
Third-quarter 2018
diluted earnings per
share increased 33%
year over year; non-
GAAP diluted
earnings per share
increased 21% year
over year.
Third-Quarter 2018 CFO Commentary
2investor.arrow.com
Third-Quarter SummaryMarket conditions remained favorable in the third quarter and our investments
in engineering and working capital produced good returns. This resulted in
record third-quarter sales, gross profit, operating income, and earnings per
share. Third-quarter sales were near the high end of our expectation. We
delivered strong leverage on our growth with operating income, net income,
and earnings per share all growing faster than sales.
Record third-quarter global components sales were above the midpoint of our
expectation. Global component sales increased 11% year over year. Growth
was broad-based, across regions and industries. Americas sales increased
13% year over year. Europe sales increased 11% year over year, and
increased 13% year over year adjusted for changes in foreign currencies, the
22nd straight quarter of adjusted year-over-year growth. Asia sales increased
8% year over year. Global components delivered strong leverage as operating
income increased 28% year over year.
Record third-quarter enterprise computing solutions sales increased 6% year
over year and increased 9% year over year adjusted for an acquisition, two
divestitures, and changes in foreign currencies. Sales were above the high end
of our expectation. Americas sales increased 7% year over year and increased
13% year over year as adjusted. Europe sales increased 3% year over year
and increased 2% year over year as adjusted. Third-quarter enterprise
computing solutions operating income decreased 13% year over year,
including a $6 million tax adjustment outside the United States.
Please note, 2017 figures have been adjusted for new accounting standards.
Record third-quarter
sales, gross profit,
operating income, and
earnings per share.
Third-Quarter 2018 CFO Commentary
3investor.arrow.com
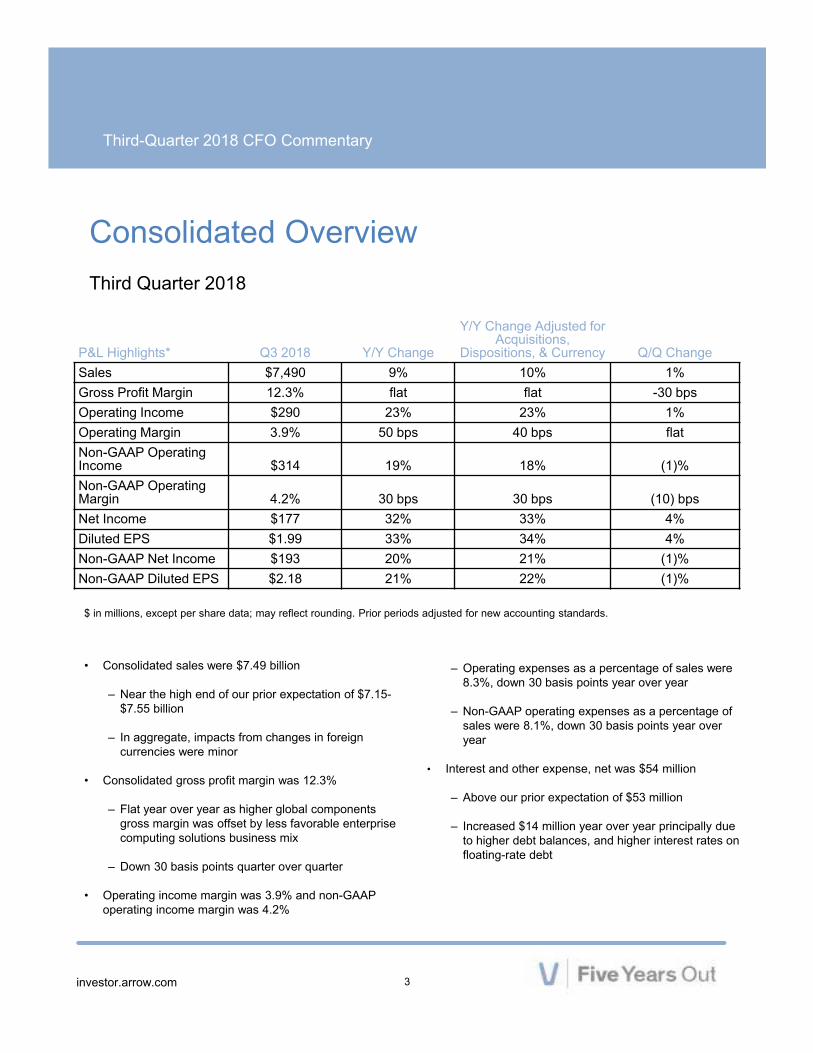
P&L Highlights* Q3 2018 Y/Y Change
Y/Y Change Adjusted forAcquisitions,
Dispositions, & Currency Q/Q ChangeSales $7,490 9% 10% 1%Gross Profit Margin 12.3% flat flat -30 bpsOperating Income $290 23% 23% 1%Operating Margin 3.9% 50 bps 40 bps flatNon-GAAP Operating Income $314 19% 18% (1)%Non-GAAP Operating Margin 4.2% 30 bps 30 bps (10) bpsNet Income $177 32% 33% 4%Diluted EPS $1.99 33% 34% 4%Non-GAAP Net Income $193 20% 21% (1)%Non-GAAP Diluted EPS $2.18 21% 22% (1)%
Consolidated OverviewThird Quarter 2018
$ in millions, except per share data; may reflect rounding. Prior periods adjusted for new accounting standards.
• Consolidated sales were $7.49 billion
– Near the high end of our prior expectation of $7.15-$7.55 billion
– In aggregate, impacts from changes in foreign currencies were minor
• Consolidated gross profit margin was 12.3%
– Flat year over year as higher global components gross margin was offset by less favorable enterprise computing solutions business mix
– Down 30 basis points quarter over quarter
• Operating income margin was 3.9% and non-GAAP operating income margin was 4.2%
– Operating expenses as a percentage of sales were 8.3%, down 30 basis points year over year
– Non-GAAP operating expenses as a percentage of sales were 8.1%, down 30 basis points year over year
• Interest and other expense, net was $54 million
– Above our prior expectation of $53 million
– Increased $14 million year over year principally due to higher debt balances, and higher interest rates on floating-rate debt
Third-Quarter 2018 CFO Commentary
4investor.arrow.com
• Effective tax rate for the quarter was 24.3%, and non-GAAP effective tax rate was 24.4%
– Non-GAAP effective tax rate was in line with our longer term range of 23.5-25.5%
• Diluted shares outstanding were 89 million
– In-line with our prior expectation of 89 million
• Diluted earnings per share were $1.99
– Above our prior expectation of $1.79 - $1.91
• Non-GAAP diluted earnings per share were $2.18
– Toward the higher end of our prior expectation of $2.09 - $2.21
– Strengthening U.S. dollar negatively impacted earnings per share by approximately $.02 compared to the third quarter of 2017
A reconciliation of non-GAAP adjusted financial measures,
including sales, as adjusted, operating income, as
adjusted, net income attributable to shareholders, as
adjusted, and net income per share, as adjusted, to GAAP
financial measures is presented in the reconciliation tables
included herein.
Third-Quarter 2018 CFO Commentary
5investor.arrow.com
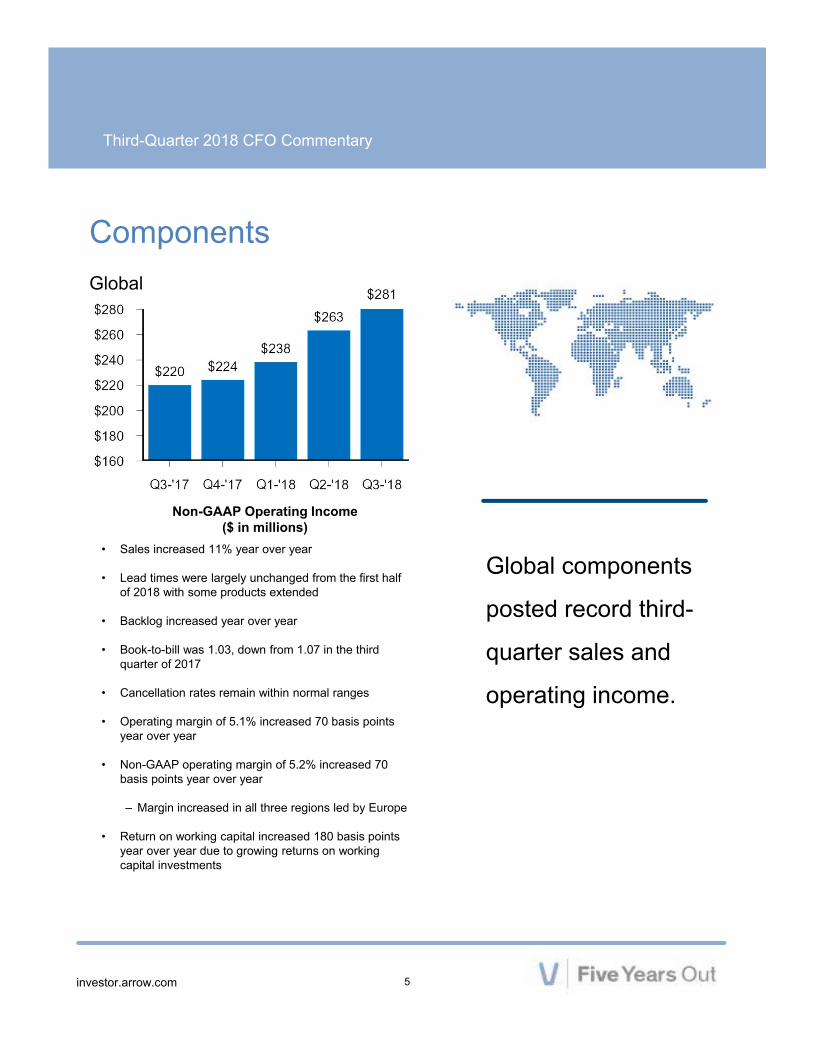
ComponentsGlobal
• Sales increased 11% year over year
• Lead times were largely unchanged from the first half of 2018 with some products extended
• Backlog increased year over year
• Book-to-bill was 1.03, down from 1.07 in the third quarter of 2017
• Cancellation rates remain within normal ranges
• Operating margin of 5.1% increased 70 basis points year over year
• Non-GAAP operating margin of 5.2% increased 70 basis points year over year
– Margin increased in all three regions led by Europe
• Return on working capital increased 180 basis points year over year due to growing returns on working capital investments
Global components
posted record third-
quarter sales and
operating income.
Non-GAAP Operating Income ($ in millions)
Third-Quarter 2018 CFO Commentary
6investor.arrow.com
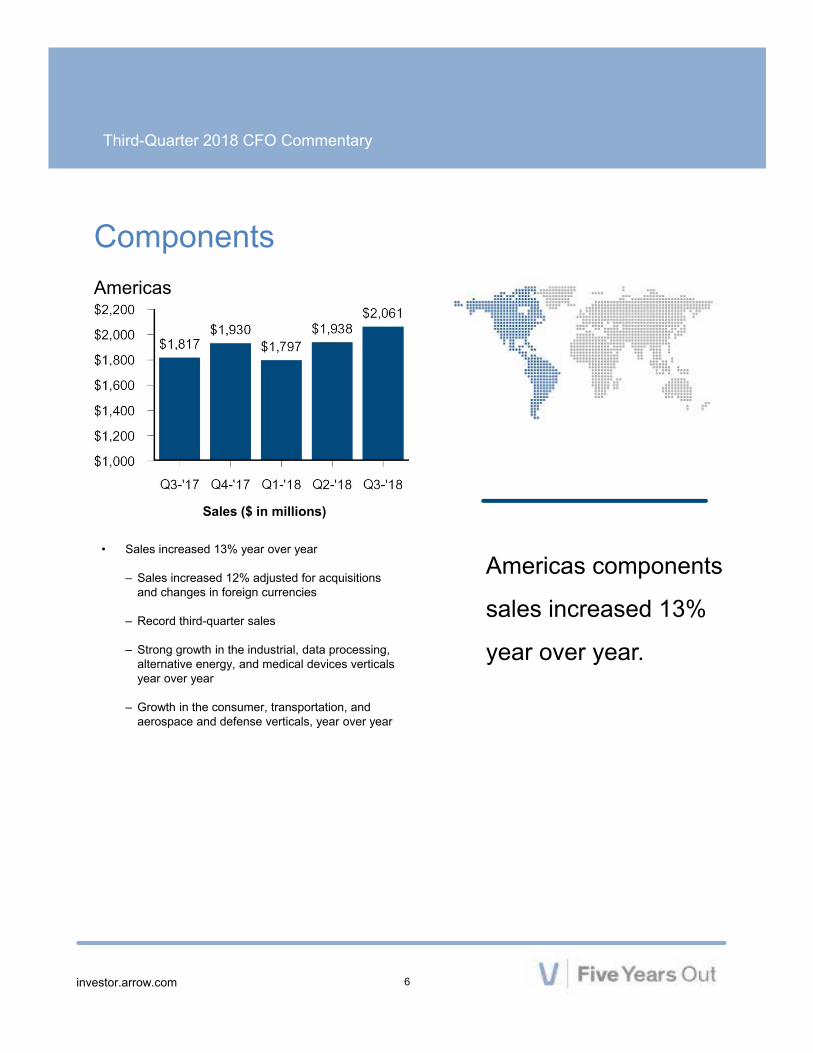
ComponentsAmericas
• Sales increased 13% year over year
– Sales increased 12% adjusted for acquisitions and changes in foreign currencies
– Record third-quarter sales
– Strong growth in the industrial, data processing, alternative energy, and medical devices verticals year over year
– Growth in the consumer, transportation, and aerospace and defense verticals, year over year
Americas components
sales increased 13%
year over year.
Sales ($ in millions)
Third-Quarter 2018 CFO Commentary
7investor.arrow.com
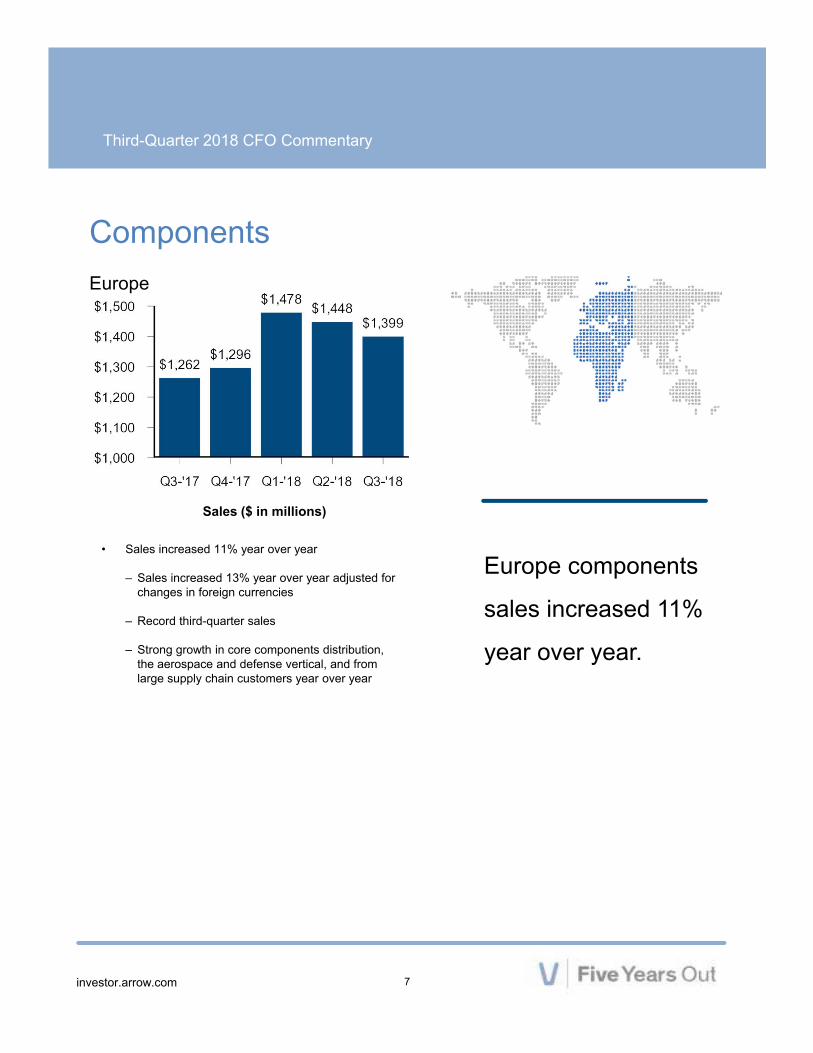
ComponentsEurope
• Sales increased 11% year over year
– Sales increased 13% year over year adjusted for changes in foreign currencies
– Record third-quarter sales
– Strong growth in core components distribution, the aerospace and defense vertical, and from large supply chain customers year over year
Europe components
sales increased 11%
year over year.
Sales ($ in millions)
Third-Quarter 2018 CFO Commentary
8investor.arrow.com
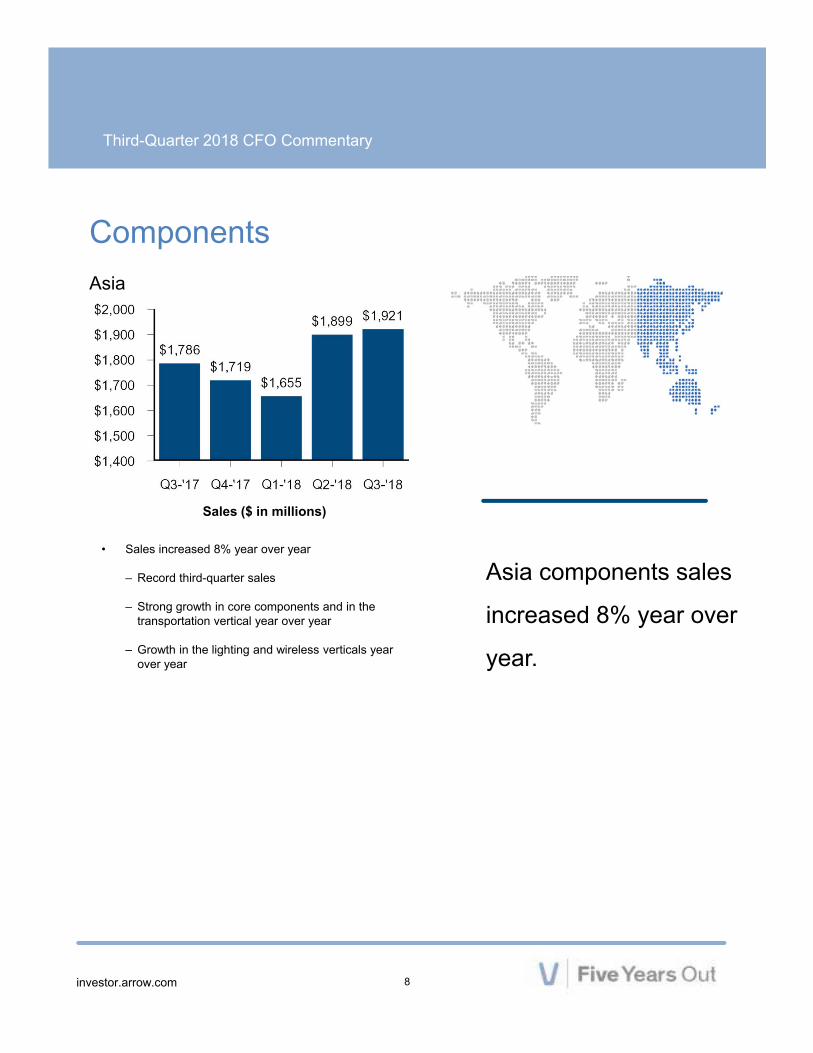
ComponentsAsia
• Sales increased 8% year over year
– Record third-quarter sales
– Strong growth in core components and in the transportation vertical year over year
– Growth in the lighting and wireless verticals year over year
Asia components sales
increased 8% year over
year.
Sales ($ in millions)
Third-Quarter 2018 CFO Commentary
9investor.arrow.com
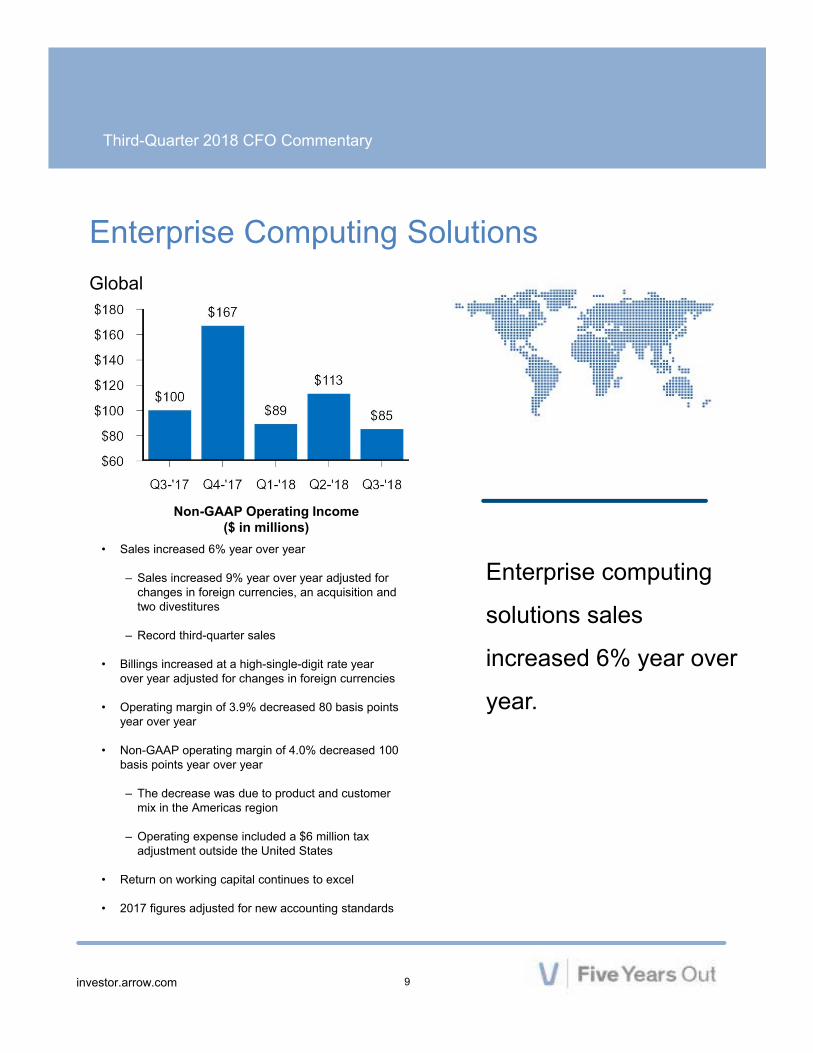
Enterprise Computing SolutionsGlobal
• Sales increased 6% year over year
– Sales increased 9% year over year adjusted for changes in foreign currencies, an acquisition and two divestitures
– Record third-quarter sales
• Billings increased at a high-single-digit rate year over year adjusted for changes in foreign currencies
• Operating margin of 3.9% decreased 80 basis points year over year
• Non-GAAP operating margin of 4.0% decreased 100 basis points year over year
– The decrease was due to product and customer mix in the Americas region
– Operating expense included a $6 million tax adjustment outside the United States
• Return on working capital continues to excel
• 2017 figures adjusted for new accounting standards
Enterprise computing
solutions sales
increased 6% year over
year.
Non-GAAP Operating Income ($ in millions)
Third-Quarter 2018 CFO Commentary
10investor.arrow.com
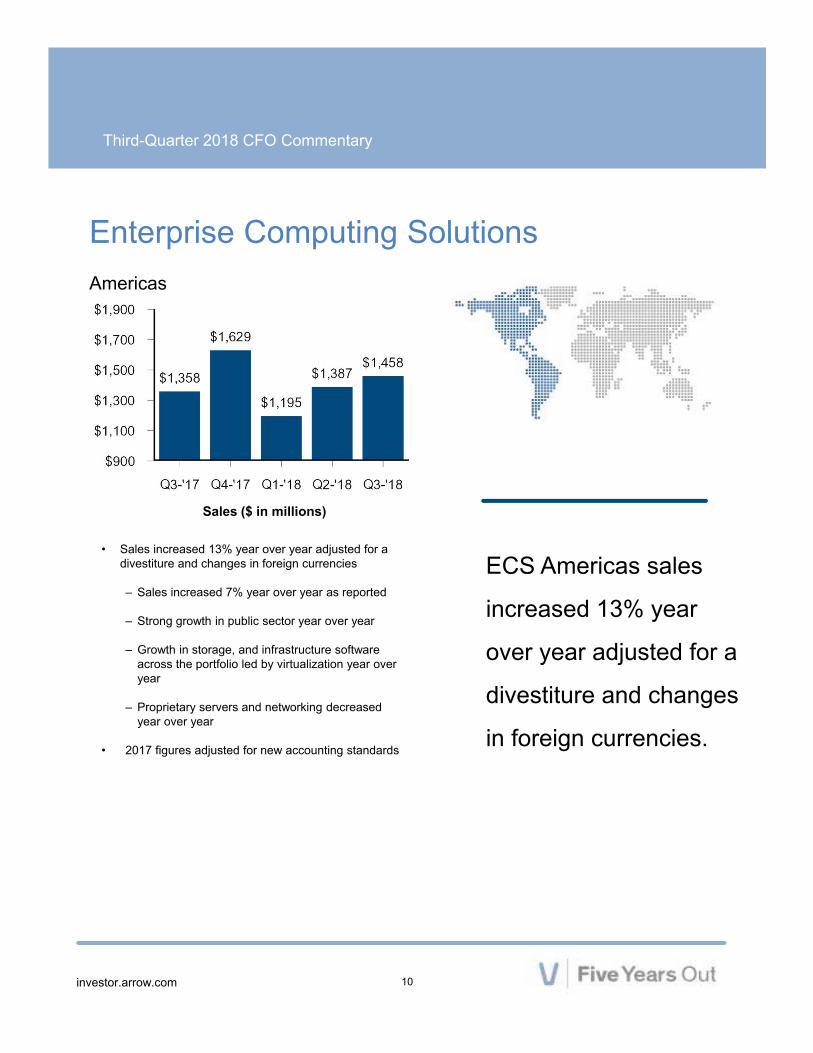
Enterprise Computing SolutionsAmericas
• Sales increased 13% year over year adjusted for a divestiture and changes in foreign currencies
– Sales increased 7% year over year as reported
– Strong growth in public sector year over year
– Growth in storage, and infrastructure software across the portfolio led by virtualization year over year
– Proprietary servers and networking decreased year over year
• 2017 figures adjusted for new accounting standards
ECS Americas sales
increased 13% year
over year adjusted for a
divestiture and changes
in foreign currencies.
Sales ($ in millions)
Third-Quarter 2018 CFO Commentary
11investor.arrow.com
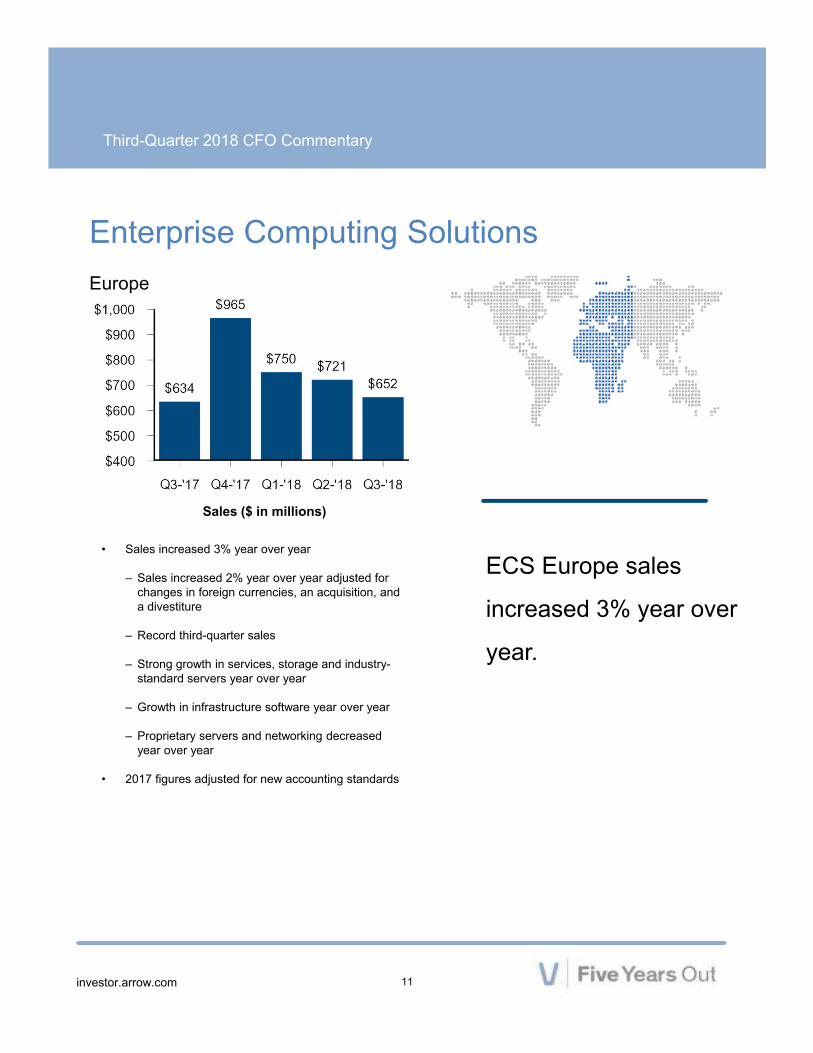
Enterprise Computing SolutionsEurope
• Sales increased 3% year over year
– Sales increased 2% year over year adjusted for changes in foreign currencies, an acquisition, and a divestiture
– Record third-quarter sales
– Strong growth in services, storage and industry-standard servers year over year
– Growth in infrastructure software year over year
– Proprietary servers and networking decreased year over year
• 2017 figures adjusted for new accounting standards
ECS Europe sales
increased 3% year over
year.
Sales ($ in millions)
Third-Quarter 2018 CFO Commentary
12investor.arrow.com
Cash Flow from Operations
Cash flow from operating activities was $494 million as
we captured returns on working capital investments. In
addition, more than $200 million cash flow was related
to mismatched timing of receivables and inventory
positions at the end of the second quarter.
Working Capital
Working capital to sales was 16.9% in the quarter, up 70
basis points year over year. Return on working capital
was 24.8% in the quarter, up 100 basis points year over
year.
Return on Invested Capital
Return on invested capital was 10.9% in the quarter, up
80 basis points year over year, and ahead of our
weighted average cost of capital.
Share Buyback
We repurchased approximately 0.3 million shares of our
stock for $20 million. Total cash returned to
shareholders over the last 12 months was
approximately $105 million.
Debt and Liquidity
Net-debt-to-last-12-months EBITDA ratio is
approximately 2.2x. Total liquidity of $2.6 billion when
including cash of $474 million.
We repurchased
approximately $20 million
of our stock in the third
quarter.
Third-Quarter 2018 CFO Commentary
13investor.arrow.com
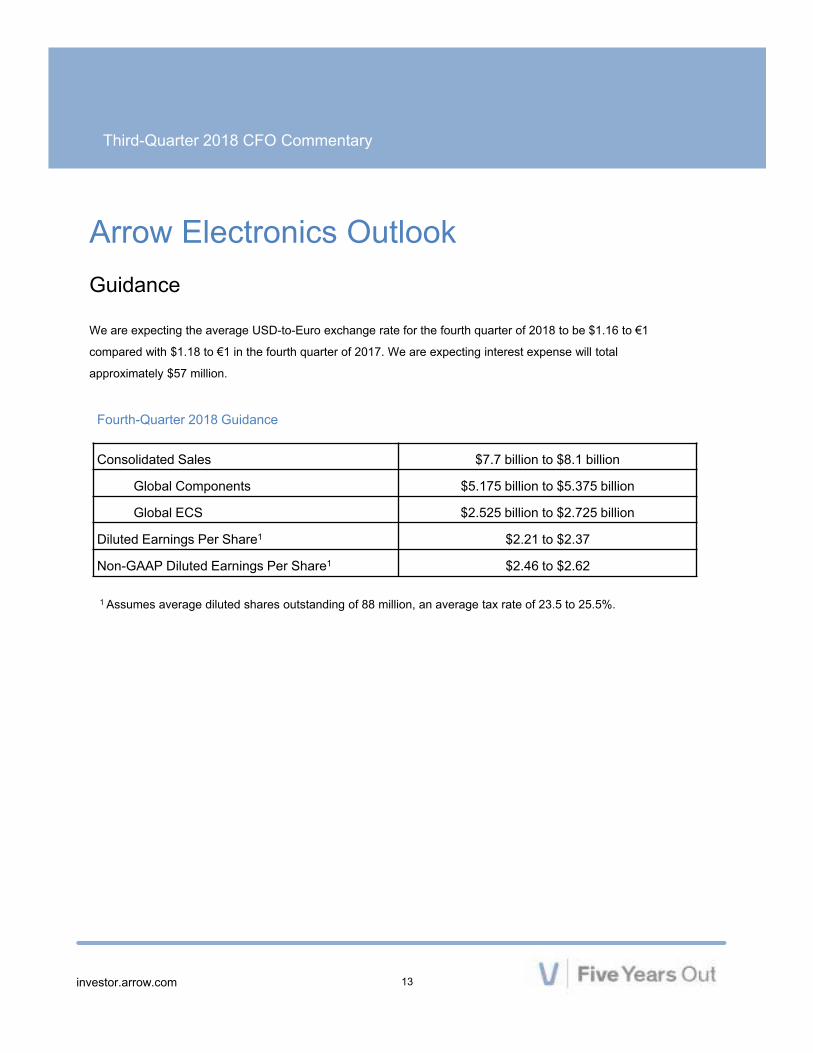
Arrow Electronics OutlookGuidance
We are expecting the average USD-to-Euro exchange rate for the fourth quarter of 2018 to be $1.16 to €1
compared with $1.18 to €1 in the fourth quarter of 2017. We are expecting interest expense will total
approximately $57 million.
Fourth-Quarter 2018 Guidance
Consolidated Sales $7.7 billion to $8.1 billion
Global Components $5.175 billion to $5.375 billion
Global ECS $2.525 billion to $2.725 billion
Diluted Earnings Per Share1 $2.21 to $2.37
Non-GAAP Diluted Earnings Per Share1 $2.46 to $2.62
1 Assumes average diluted shares outstanding of 88 million, an average tax rate of 23.5 to 25.5%.
Third-Quarter 2018 CFO Commentary
14investor.arrow.com
Risk Factors
The discussion of the company’s
business and operations should be
read together with the risk factors
contained in Item 1A of its 2017
Annual Report on Form 10-K, filed
with the Securities and Exchange
Commission, which describe various
risks and uncertainties to which the
company is or may become subject.
If any of the described events occur,
the company’s business, results of
operations, financial condition,
liquidity, or access to the capital
markets could be materially adversely
affected.
Information Relating to Forward-Looking StatementsThis press release includes forward-looking statements that are subject to numerous assumptions, risks, and uncertainties, which could cause actual results or facts to differ materially from such statements for a variety of reasons, including, but not limited to: industry conditions, company’s implementation of its new enterprise resource planning system, changes in product supply, pricing and customer demand, competition, other vagaries in the global components and global enterprise computing solutions markets, changes in relationships with key suppliers, increased profit margin pressure, effects of additional actions taken to become more efficient or lower costs, risks related to the integration of acquired businesses, changes in legal and regulatory matters, and the company’s ability to generate additional cash flow. Forward-looking statements are those statements which are not statements of historical fact. These forward-looking statements can be identified by forward-looking words such as “expects,” “anticipates,” “intends,” “plans,” “may,” “will,” “believes,” “seeks,” “estimates,” and similar expressions. Shareholders and other readers are cautioned not to place undue reliance on these forward-looking statements, which speak only as of the date on which they are made. The company undertakes no obligation to update publicly or revise any of the forward-looking statements.
For a further discussion of factors to consider in connection with these forward-looking statements, investors should refer to Item 1A Risk Factors of the company’s Annual Report on Form 10-K for the year ended December 31, 2017.
Third-Quarter 2018 CFO Commentary
15investor.arrow.com
Certain Non-GAAP Financial Information
The company believes that such non-GAAP financial information is useful to investors to assist in assessing and understanding the company’s operating performance.
In addition to disclosing financial results that are determined in accordance with accounting principles generally accepted in the United States (“GAAP”), the company also provides certain non-GAAP financial information relating to sales, operating income, net income attributable to shareholders, and net income per basic and diluted share. The company provides sales, income, or expense on a non-GAAP basis adjusted for the impact of changes in foreign currencies, intangible amortization, and the impact of acquisitions/dispositions by adjusting the company’s operating results for businesses acquired/disposed, including the amortization expense related to intangible assets, as if the acquisitions/dispositions had occurred at the beginning of the earliest period presented (referred to as “impact of acquisitions” and "impact of dispositions"). Operating income, net income attributable to shareholders, and net income per basic and diluted share are adjusted to exclude identifiable intangible amortization, restructuring, integration, and other charges, and certain charges, credits, gains, and losses that the company believes impact the comparability of its results of operations. These charges, credits, gains, and losses arise out of the company’s efficiency enhancement initiatives, acquisitions/dispositions (including intangible assets amortization expense), and financing activities. A reconciliation of the company’s non-GAAP financial information to GAAP is set forth in the tables herein.
The company believes that such non-GAAP financial information is useful to investors to assist in assessing and understanding the company’s operating performance and underlying trends in the company’s business because management considers these items referred to above to be outside the company’s core operating results. This non-GAAP financial information is among the
primary indicators management uses as a basis for evaluating the company’s financial and operating performance. In addition, the company’s Board of Directors may use this non-GAAP financial information in evaluating management performance and setting management compensation.
The presentation of this additional non-GAAP financial information is not meant to be considered in isolation or as a substitute for, or alternative to, operating income, net income attributable to shareholders and net income per basic and diluted share determined in accordance with GAAP. Analysis of results and outlook on a non-GAAP basis should be used as a complement to, and in conjunction with, data presented in accordance with GAAP.
Third-Quarter 2018 CFO Commentary
16investor.arrow.com
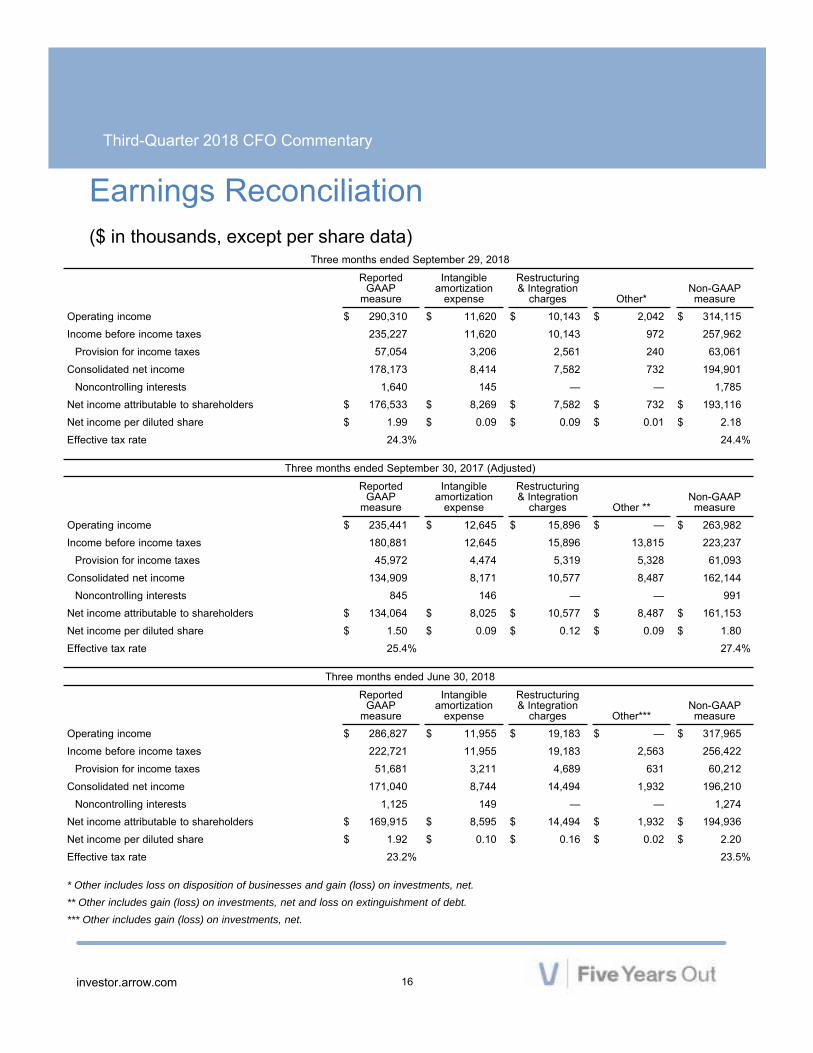
Three months ended September 29, 2018
ReportedGAAP
measure
Intangibleamortization
expense
Restructuring& Integration
charges Other*Non-GAAPmeasure
Operating income $ 290,310 $ 11,620 $ 10,143 $ 2,042 $ 314,115Income before income taxes 235,227 11,620 10,143 972 257,962
Provision for income taxes 57,054 3,206 2,561 240 63,061Consolidated net income 178,173 8,414 7,582 732 194,901
Noncontrolling interests 1,640 145 — — 1,785Net income attributable to shareholders $ 176,533 $ 8,269 $ 7,582 $ 732 $ 193,116Net income per diluted share $ 1.99 $ 0.09 $ 0.09 $ 0.01 $ 2.18Effective tax rate 24.3% 24.4%
Three months ended September 30, 2017 (Adjusted)Reported
GAAPmeasure
Intangibleamortization
expense
Restructuring& Integration
charges Other **Non-GAAPmeasure
Operating income $ 235,441 $ 12,645 $ 15,896 $ — $ 263,982Income before income taxes 180,881 12,645 15,896 13,815 223,237
Provision for income taxes 45,972 4,474 5,319 5,328 61,093Consolidated net income 134,909 8,171 10,577 8,487 162,144
Noncontrolling interests 845 146 — — 991Net income attributable to shareholders $ 134,064 $ 8,025 $ 10,577 $ 8,487 $ 161,153Net income per diluted share $ 1.50 $ 0.09 $ 0.12 $ 0.09 $ 1.80Effective tax rate 25.4% 27.4%
Three months ended June 30, 2018
ReportedGAAP
measure
Intangibleamortization
expense
Restructuring& Integration
charges Other***Non-GAAPmeasure
Operating income $ 286,827 $ 11,955 $ 19,183 $ — $ 317,965Income before income taxes 222,721 11,955 19,183 2,563 256,422
Provision for income taxes 51,681 3,211 4,689 631 60,212Consolidated net income 171,040 8,744 14,494 1,932 196,210
Noncontrolling interests 1,125 149 — — 1,274Net income attributable to shareholders $ 169,915 $ 8,595 $ 14,494 $ 1,932 $ 194,936Net income per diluted share $ 1.92 $ 0.10 $ 0.16 $ 0.02 $ 2.20Effective tax rate 23.2% 23.5%
* Other includes loss on disposition of businesses and gain (loss) on investments, net.** Other includes gain (loss) on investments, net and loss on extinguishment of debt.*** Other includes gain (loss) on investments, net.
Earnings Reconciliation($ in thousands, except per share data)