Embed Size (px)
Citation preview
Q3-2018: Performance
review
January 31, 2018

2
Certain statements in these slides are forward-looking statements.
These statements are based on management's current expectations and
are subject to uncertainty and changes in circumstances. Actual results
may differ materially from those included in these statements due to a
variety of factors. More information about these factors is contained in
ICICI Bank's filings with the US Securities and Exchange Commission.
All financial and other information in these slides, other than financial
and other information for specific subsidiaries where specifically
mentioned, is on an unconsolidated basis for ICICI Bank Limited only
unless specifically stated to be on a consolidated basis for ICICI Bank
Limited and its subsidiaries. Please also refer to the statement of
unconsolidated, consolidated and segmental results required by Indian
regulations that has, along with these slides, been filed with the stock
exchanges in India where ICICI Bank’s equity shares are listed and with
the New York Stock Exchange and the US Securities and Exchange
Commission, and is available on our website www.icicibank.com

3
Savings
Investments
Capital
flows
Protection
Credit

4
₹ 10.5 trillion
Consolidated
assets
19,122
Largest branch +
ATM network
among private
sector banks
₹ 2.7 trillion
Granular retail
portfolio
Period-end CASA
ratio
50.4% ` 51 billion
Operating profit in
Q3-2018
Tier-1 capital
adequacy
15.04%1
Scale & strength
1. Standalone Bank; including profits for 9M-2018
5
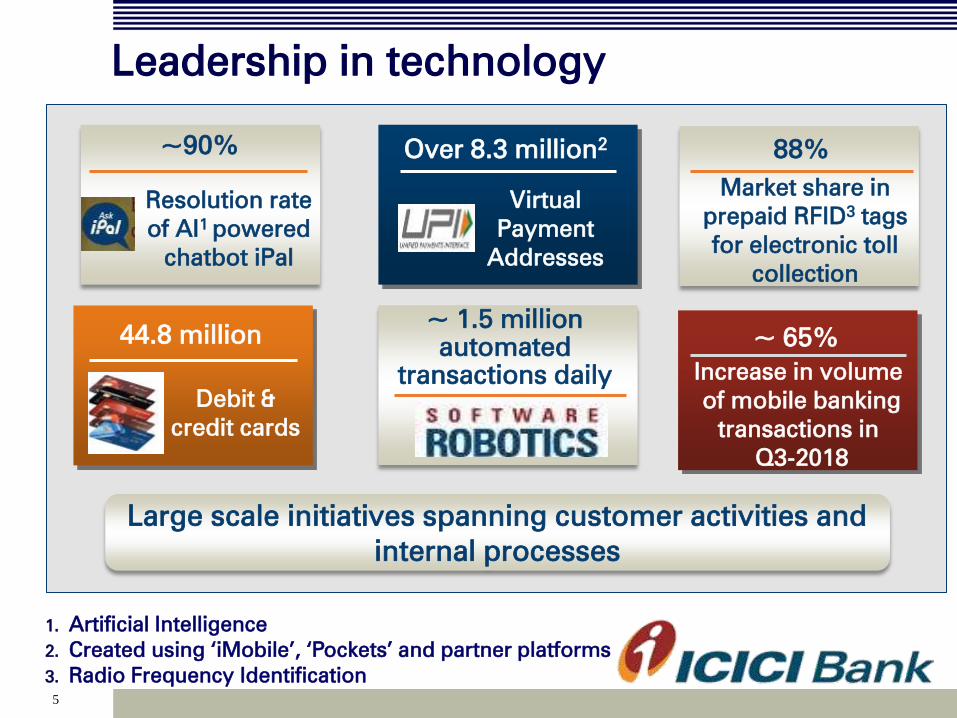
~90%
88%
Debit &
credit cards
~ 65% 44.8 million
Increase in volume
of mobile banking
transactions in
Q3-2018
Large scale initiatives spanning customer activities and
internal processes
Market share in
prepaid RFID3 tags
for electronic toll
collection
Resolution rate
of AI1 powered
chatbot iPal
Virtual
Payment
Addresses
Over 8.3 million2
~ 1.5 million
automated
transactions daily
Leadership in technology
1. Artificial Intelligence
2. Created using ‘iMobile’, ‘Pockets’ and partner platforms
3. Radio Frequency Identification

6
Q3-2018 review

7
P&L indicators
Q3-2018 review
Credit quality
Subsidiaries
Capital
Growth
Highlights

8
P&L indicators
Q3-2018 review
Credit quality
Subsidiaries
Capital
Growth
Highlights

9
Accelerated growth in loan portfolio
Improving asset quality trends
Improving portfolio mix
Q3-2018: Highlights (1/2)
• Domestic loan growth improved to 15.6% at Dec 31, 2017 y-o-y
from 12.8% y-o-y at Sep 30, 2017
• Retail loan growth increased to 22.2% y-o-y at Dec 31, 2017 from
18.6% y-o-y at Sep 30, 2017
• Proportion of retail loans increased to 54.2% at Dec 31, 2017
from 48.9% at Dec 31, 2016
• Continued decline in gross NPA additions
• Decline in net NPA ratio from 4.43% at Sep 30, 2017 to 4.20% at
Dec 31, 2017
• 160 bps sequential increase in provision coverage ratio to 60.9%1
1. Including cumulative technical/ prudential write-offs

10
Q3-2018: Highlights (2/2)
1. Excluding treasury gains and exchange gains related to overseas operations
2. Including profits for 9M-2018
Healthy deposit growth
Strong capital position
Continued strong operating performance
• 14% y-o-y growth in average CASA deposits during Q3-2018
• Domestic NIM maintained above 3.5%
• 9.7% y-o-y growth in core operating profit1
• Tier I ratio of 15.04%2 at Dec 31, 2017

11
P&L indicators
Q3-2018 review
Credit quality
Subsidiaries
Capital
Growth
Highlights

12
1.Overseas portfolio decreased by 9.1% y-o-y in US$ terms
Total domestic
Y-o-Y growth (%)
15.6%
Loan portfolio
Retail
22.2%
SME
15.2%
Corporate
4.2%
Overseas1
(14.5)%
Total loans of ₹ 5,053.87 billion at December 31, 2017; y-o-y
growth of 10.5%
Loan growth led by retail
Excluding non-performing loans, restructured loans and loans to
companies included in drilldown exposures, growth in the
domestic corporate portfolio was ~ 15%

13
Share of retail loans in
total loans increased
from 48.9% at Dec 31,
2016 to 54.2% at Dec
31, 2017
Increasing share of retail loans
Balance sheet (assets): slide 57

14
Retail loan growth at 22.2%
y-o-y
1. Vehicle loans include auto loans: 10.3%, commercial business: 6.0% and two-wheeler
loans: 0.1%
2. Others include dealer funding: 1.3% and loan against securities: 0.7%
Total retail loans at ` 2,740
billion at Dec 31, 2017
Growth across retail products
2
1
15
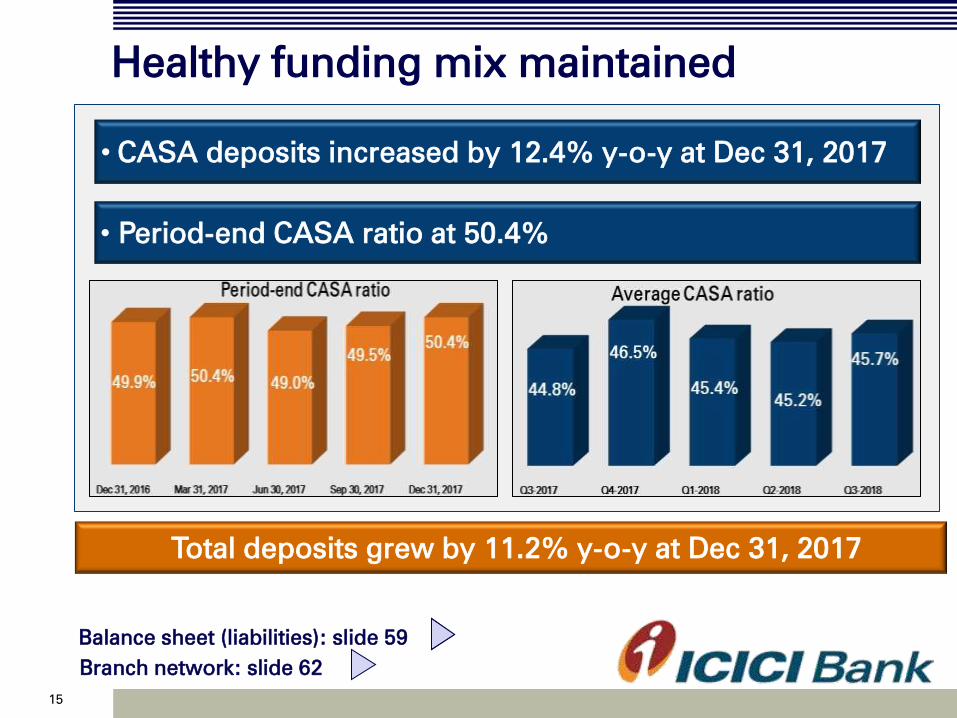
Healthy funding mix maintained
Branch network: slide 62
Balance sheet (liabilities): slide 59
Total deposits grew by 11.2% y-o-y at Dec 31, 2017
• CASA deposits increased by 12.4% y-o-y at Dec 31, 2017
• Period-end CASA ratio at 50.4%
16
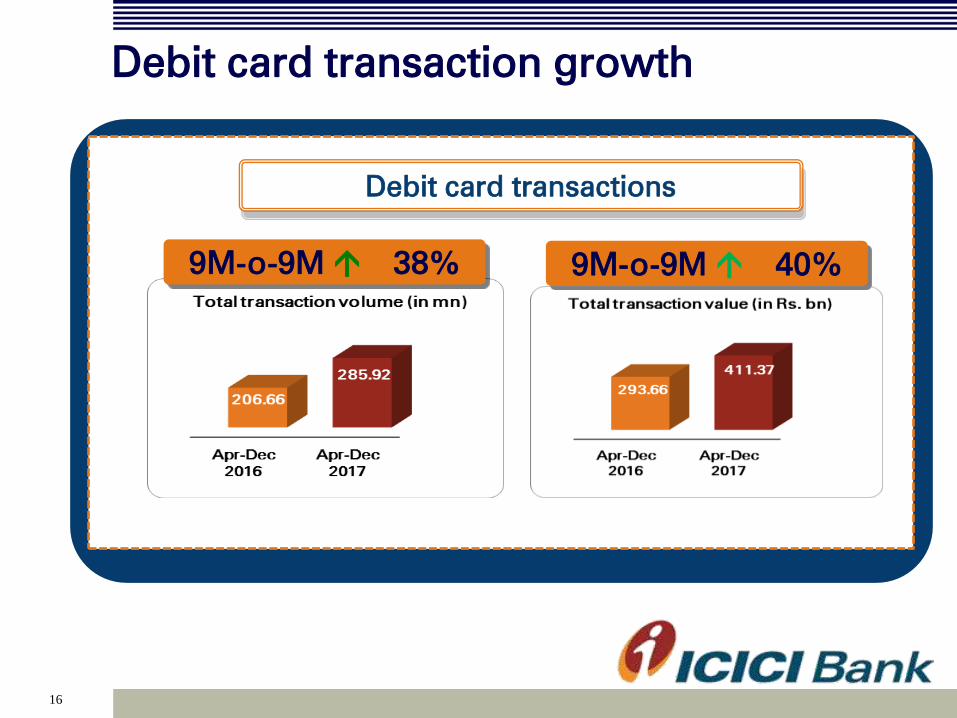
Debit card transaction growth
9M-o-9M 40%
Debit card transactions
9M-o-9M 38%

17
Credit card transaction growth
Credit card transactions
9M-o-9M 47% 9M-o-9M 34%
18
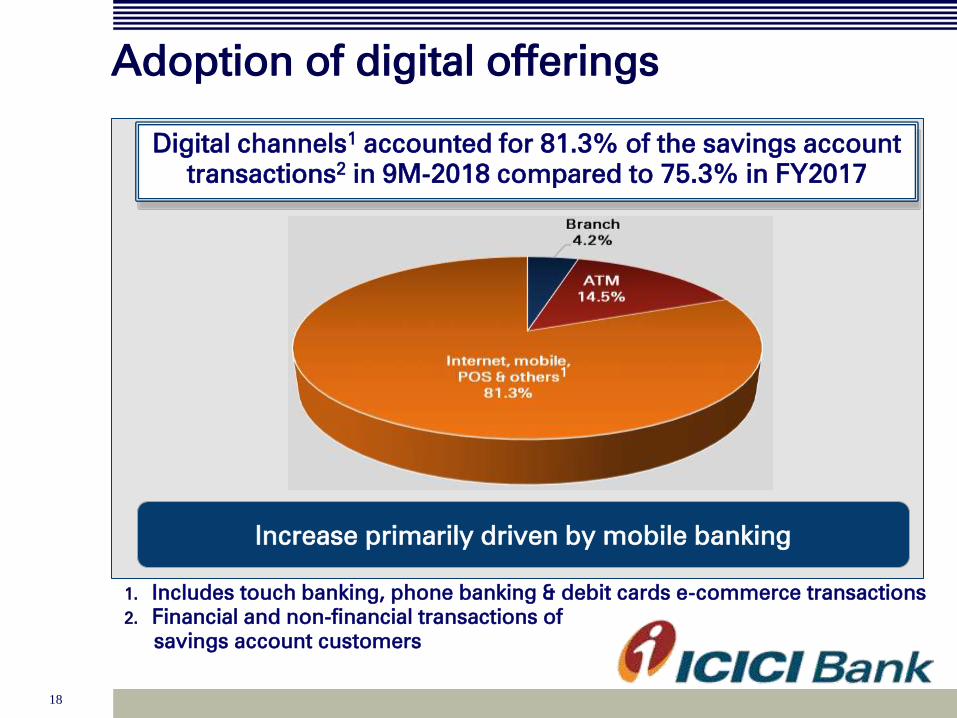
Adoption of digital offerings
1. Includes touch banking, phone banking & debit cards e-commerce transactions
2. Financial and non-financial transactions of
savings account customers
Digital channels1 accounted for 81.3% of the savings account
transactions2 in 9M-2018 compared to 75.3% in FY2017
Increase primarily driven by mobile banking
1

19
P&L indicators
Q3-2018 review
Credit quality
Subsidiaries
Capital
Growth
Highlights

20
1. Includes addition of ₹ 8.79 billion of loan to a central public sector owned power company
2. Increase in outstanding of existing NPA due to exchange
rate movement
3. Relating to accounts classified as NPA in prior periods
4. Based on customer assets
` billion FY
2017
Q3-
2017
Q4-
2017
Q1-
2018
Q2-
2018
Q3-
2018
Opening gross NPA
267.21 325.48 380.85 425.52 431.48 444.89
Add: gross additions
335.44 70.37 112.89 49.76 46.74
43.80
- of which:
slippages from
-restructured assets 45.20 2.39 18.03 14.76 3.72 1.97
-drilldown 194.95 29.43 79.57 3.59 11.351
6.14
- Existing NPA2 & non-
fund devolvement3
19.35 20.40 0.40 1.95 2.20 1.46
- Loans under RBI
resolution schemes
0.32 - 0.32 1.11 1.92 20.22
Less: recoveries & upgrades 25.38 6.25 14.13 27.75 10.29 11.08
Net additions 310.06 64.12 98.76 22.01 36.45 32.72
Less: write-offs & sale
151.75 8.75 54.09 16.05 23.04 17.22
Closing gross NPAs 425.52 380.85 425.52 431.48 444.89 460.39
Gross NPA ratio
7.89% 7.20% 7.89% 7.99% 7.87% 7.82%
Movement of NPA (1/2)
21
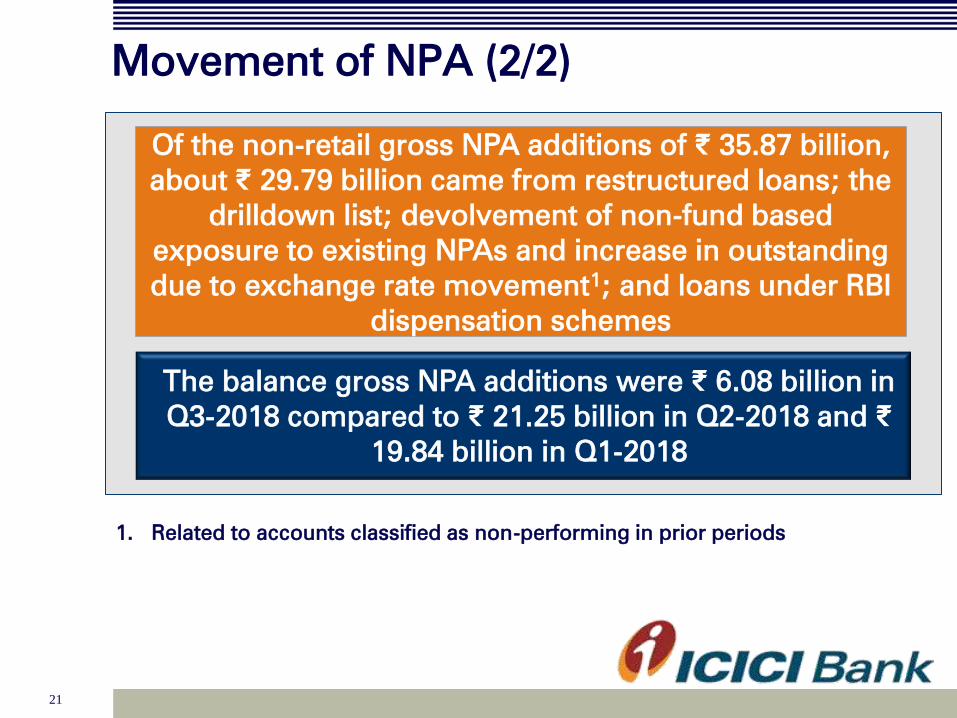
Of the non-retail gross NPA additions of ₹ 35.87 billion,
about ₹ 29.79 billion came from restructured loans; the
drilldown list; devolvement of non-fund based
exposure to existing NPAs and increase in outstanding
due to exchange rate movement1; and loans under RBI
dispensation schemes
Movement of NPA (2/2)
The balance gross NPA additions were ₹ 6.08 billion in
Q3-2018 compared to ₹ 21.25 billion in Q2-2018 and ₹
19.84 billion in Q1-2018
1. Related to accounts classified as non-performing in prior periods

22
Proceedings under IBC
• During Q2-2018, RBI directed banks to initiate
insolvency resolution process for additional accounts
under the provisions of IBC by December 31, 2017 if a
resolution plan where the residual debt is not rated
investment grade by two external credit rating agencies
is not implemented by December 13, 2017
• At December 31, 2017, the Bank had outstanding loans
and non-fund facilities amounting to ₹ 100.61 billion and
₹ 13.35 billion respectively
• The provisions held against these outstanding loans
increased from 31.5% at September 30, 2017 to 36.4%
at December 31, 2017
• Of the above 18 accounts, insolvency proceedings in
respect of 16 accounts have been initiated under the
provisions of the IBC

23
Asset quality and provisioning (1/2)
` billion December
31, 2016
September
30, 2017
December
31, 2017
Gross NPAs
380.85 444.89 460.39
Less: cumulative provisions
179.30
203.59 222.29
Net NPAs 201.55 241.30 238.10
Net NPA ratio
3.96% 4.43% 4.20%
Retail NPAs (` billion) December
31, 2016
September
30, 2017
December
31, 2017
Gross retail NPAs
39.69 43.51 46.86
- as a % of gross retail advances
1.75% 1.66% 1.69%
Net retail NPAs 13.59 16.60 18.48
- as a % of net retail advances
0.61% 0.64% 0.67%
Provisioning coverage ratio at 60.9% including cumulative
technical/ prudential write-offs

24
Asset quality and provisioning (2/2)
• Net investment in security receipts of ARCs was `
34.45 billion at December 31, 2017 (September 30,
2017 : ₹ 34.78 billion)
• Non-fund outstanding to restructured assets: ` 4.10
billion at December 31, 2017 (September 30, 2017 : `
4.15 billion)
• Outstanding general provision on standard assets: `
25.701 billion at December 31, 2017
• Includes additional general provision of ₹ 1.99 billion
made in 9M-2018 on standard loans to borrowers
1. Excludes specific provisions against standard assets

25
Loans under RBI resolution schemes1
1. Excludes NPA
2. Loans aggregating ` 17.26 billion also under SDR or change in management outside SDR
3. Including project under implementation
4. Represents loans, credit substitutes and shares under
S4A package
December 2017 Standard
restructured Drilldown Others Total
Strategic debt restructuring (SDR)
- Implemented 3.27 24.59 3.62 31.48
- Invoked - - 0.71 0.71
Change in management outside SDR3
- Implemented - 63.99 - 63.99
- Invoked - - 6.06 6.06
Flexible restructuring under the 5/25 scheme
- Implemented
24.782
1.97
26.75
S4A implemented4
0.94 - 5.88 6.82
Loans under RBI resolution schemes at Sep 30, 2017: slide 60
26
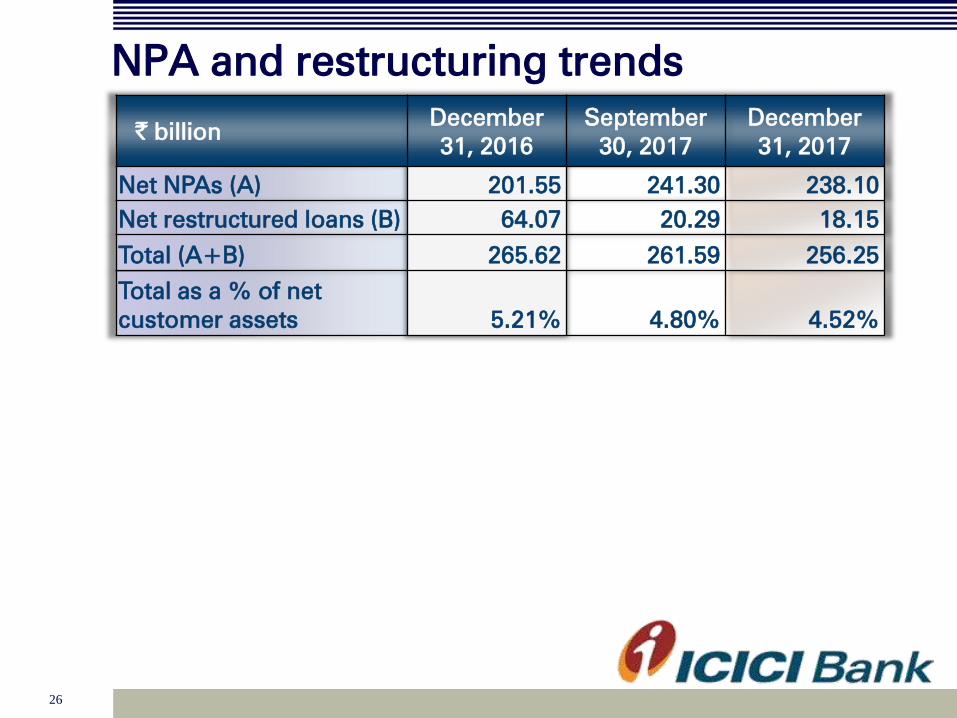
NPA and restructuring trends
` billion December
31, 2016
September
30, 2017
December
31, 2017
Net NPAs (A)
201.55 241.30 238.10
Net restructured loans (B)
64.07 20.29 18.15
Total (A+B) 265.62 261.59 256.25
Total as a % of net
customer assets
5.21% 4.80% 4.52%

27
Portfolio trends and approach

Portfolio composition over the years
28
1. Including impact of exchange rate movement
% of total
advances
March
31, 2012
March
31, 2013
March
31, 2014
March
31, 2015
March
31, 2016
March 31,
2017
Dec 31,
2017
Retail 38.0% 37.0% 39.0% 42.4% 46.6% 51.8% 54.2%
Domestic
corporate 28.6% 32.5% 30.1% 28.8% 27.5% 27.3% 26.9%
SME 6.0% 5.2% 4.4% 4.4% 4.3% 4.8% 4.9%
International1 27.4% 25.3% 26.5% 24.3% 21.6% 16.1% 14.0%
Total
advances
(` billion) 2,537 2,902 3,387 3,875 4,353 4,642 5,054

Sector-wise exposures
29
1. Top 10 based on position at Dec 31, 2017
Top 10 sectors1: % of total
exposure of the Bank
March 31,
2013
March 31,
2014
March
31, 2015
March
31, 2016
March
31, 2017
Dec 31,
2017
Retail finance 18.9%
22.4% 24.7% 27.1% 31.9% 33.9%
Electronics & engineering 8.3% 8.2% 7.6% 7.3% 6.9% 7.0%
Services – finance 6.0% 4.9% 4.2% 4.9% 6.2% 6.9%
Banks 8.8% 8.6% 7.8% 8.0% 6.0% 6.7%
Crude petroleum/refining &
petrochemicals 6.6% 6.2% 7.0% 5.7% 5.5% 5.4%
Power 6.4% 5.9% 5.5% 5.4% 5.1% 4.8%
Road, port, telecom, urban
development & other infra 6.0% 6.0% 5.9% 5.8% 5.3% 4.3%
Construction 4.2% 4.4% 4.0% 3.4% 3.1% 3.4%
Services - non finance 5.1% 5.2% 5.0% 4.9% 4.0% 3.4%
Iron/steel & products 5.1% 5.0% 4.8% 4.5% 3.6% 3.1%
Total (` billion) 7,585 7,828 8,535 9,428 9,372 9,849
30
In April 2016, the Bank had identified power, iron &
steel, mining, cement and rigs sectors as the key
sectors impacted by the uncertainties and challenges
in the operating environment
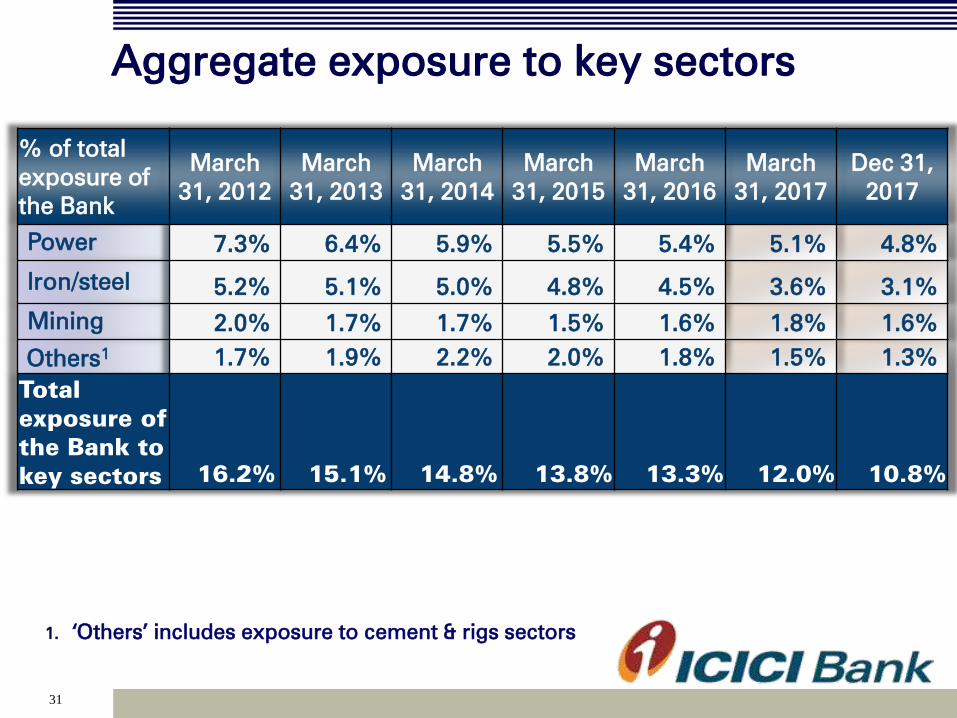
Aggregate exposure to key sectors
31
% of total
exposure of
the Bank
March
31, 2012
March
31, 2013
March
31, 2014
March
31, 2015
March
31, 2016
March
31, 2017
Dec 31,
2017
Power 7.3% 6.4% 5.9% 5.5% 5.4% 5.1% 4.8%
Iron/steel 5.2% 5.1% 5.0% 4.8% 4.5% 3.6% 3.1%
Mining 2.0% 1.7% 1.7% 1.5% 1.6% 1.8% 1.6%
Others1 1.7% 1.9% 2.2% 2.0% 1.8% 1.5% 1.3%
Total
exposure of
the Bank to
key sectors 16.2% 15.1% 14.8% 13.8% 13.3% 12.0% 10.8%
1. ‘Others’ includes exposure to cement & rigs sectors

Further drilldown: approach
32
All internally ‘below investment grade’ rated companies
in key sectors across domestic corporate, SME and
international branches portfolios
Promoter entities internally ‘below investment grade’
where the underlying is partly linked to the key sectors
SDR and 5/25 refinancing relating
to key sectors included
Fund-based limits and non-fund based outstanding to
above categories considered
1
2
3
4
Loans already classified as restructured and non-
performing excluded 5

Further drilldown: sector-wise details
33
At September 30, 2017 At December 31, 2017
` billion Exposure 1,2,3
% of total
exposure Exposure
1,2,3 % of total
exposure
Power 68.37 0.7%
65.26 0.7%
Mining 57.50 0.6%
57.78 0.6%
Iron/steel 40.14 0.4%
44.27 0.4%
Promoter entities4
25.83 0.3%
19.16 0.2%
Others5
4.06 0.0%
4.15 0.0%
1. Aggregate fund based limits and non-fund based outstanding
2. Includes investment exposure
3. Includes non-fund based outstanding in respect of accounts included in the
drilldown exposure where the fund based outstanding has been classified as non-
performing during earlier periods
4. Includes promoter entities where underlying is partly linked to the key sectors
5. ‘Others’ includes exposure to cement & rigs sectors
6. In addition to above, the non-fund based outstanding to borrowers classified as
non-performing was ₹ 22.02 bn at December 31, 2017 compared to ₹ 21.19 bn at
September 30, 2017

34
Further drilldown: movement
₹ billion
Aggregate exposure1,2,3,4
Q3-2018
Opening balance 195.90
Net decrease in exposure (4.86)
Upgrades to ‘investment grade’ (0.08)
Downgrades to ‘below investment grade’
6.49
Classified as non-performing5
(6.83)
Closing balance 190.62
1. Aggregate fund based limits and non-fund based outstanding
2. Includes investment exposure
3. Includes promoter entities where underlying is partly linked to the key sectors
4. Includes non-fund based outstanding in respect of accounts included in the
drilldown exposure where the fund based outstanding has been classified as
non-performing during earlier periods
5. Includes investment exposure relating to accounts classified as non-performing
6. In addition to above, the non-fund based outstanding to borrowers classified as
non-performing was ₹ 22.02 bn at December 31, 2017 compared to ₹ 21.19 bn at
September 30, 2017

35
P&L indicators
Q3-2018 review
Credit quality
Subsidiaries
Capital
Growth
Highlights

36
Profit & loss statement
` billion FY
2017
Q3-
2017
9M-
2017
Q2-
2018
Q3-
2018
9M-
2018
NII
217.37 53.63 157.75 57.09 57.05 170.04
Non-interest
income
195.05 39.39 164.88 51.86 31.67 117.41
- Fee income 94.52 24.95 70.07 25.70 26.39 75.86
- Other income1
14.76 5.51 14.08 4.23 4.62 10.38
- Treasury income2
85.77
8.93 80.73 21.93 0.66 31.17
Total income
412.42 93.02 322.63 108.95 88.72 287.45
1. As per the RBI guidelines dated Apr 18, 2017, banks are not permitted to recognize
proportionate exchange gains or losses held in the FCTR in the P&L account. Other
income includes net foreign exchange gain relating to overseas operations amounting
to ₹ 2.88 bn in 9M-2017 which was reversed in Q4-2017
2. Includes profit on sale of shareholding in insurance subsidiaries of ` 56.82 billion in 9M-
2017 and ` 20.12 billion in 9M-2018
37
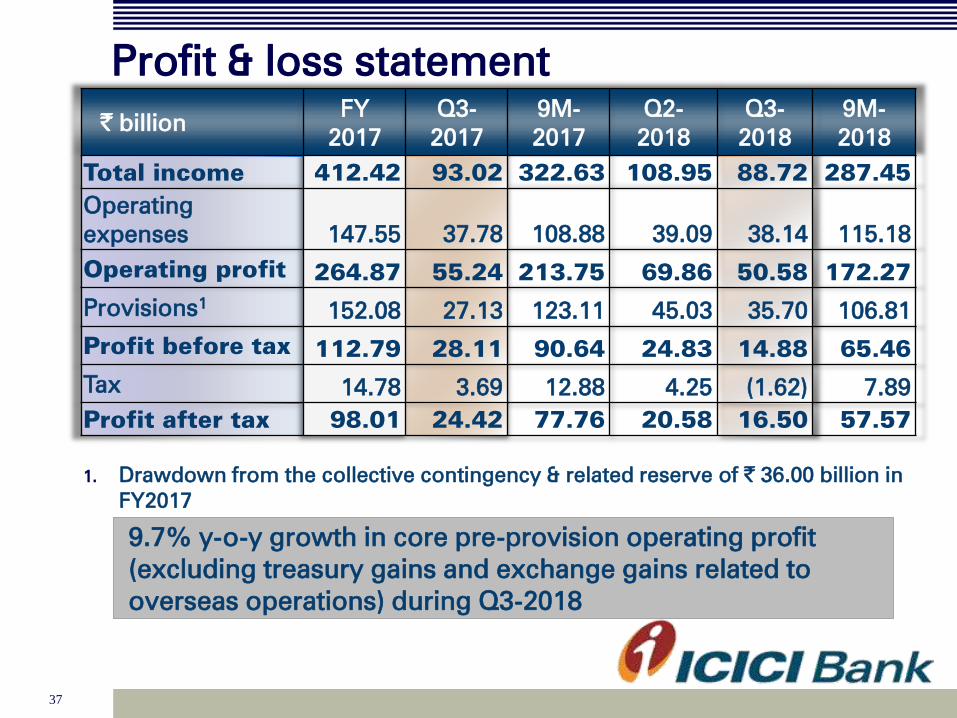
Profit & loss statement
` billion FY
2017
Q3-
2017
9M-
2017
Q2-
2018
Q3-
2018
9M-
2018
Total income
412.42 93.02 322.63 108.95 88.72 287.45
Operating
expenses
147.55 37.78 108.88 39.09 38.14 115.18
Operating profit 264.87 55.24 213.75 69.86 50.58 172.27
Provisions1
152.08 27.13 123.11 45.03 35.70 106.81
Profit before tax 112.79 28.11 90.64 24.83 14.88 65.46
Tax 14.78 3.69 12.88 4.25 (1.62) 7.89
Profit after tax 98.01 24.42 77.76 20.58 16.50 57.57
1. Drawdown from the collective contingency & related reserve of ` 36.00 billion in
FY2017
9.7% y-o-y growth in core pre-provision operating profit
(excluding treasury gains and exchange gains related to
overseas operations) during Q3-2018

38
Yield, cost & margin
Movement in yield,
costs & margins
(Percent)1
FY2017 Q3-
2017
9M-
2017
Q2-
2018
Q3-
2018
9M-
2018
Yield on total interest-
earning assets
8.09 7.92 8.07 7.78 7.53 7.72
- Yield on advances
8.88 8.76 8.88 8.67 8.47 8.61
Cost of funds
5.45 5.39 5.55 5.04 4.90 5.03
- Cost of deposits
5.39 5.30 5.48 4.91 4.74 4.90
Net interest margin
3.25 3.12 3.14 3.27 3.14 3.23
- Domestic 3.59 3.51 3.46 3.57 3.53 3.57
- Overseas 1.30 0.83 1.38 0.95 0.29 0.65
1. Annualised for all interim periods
• No interest on income tax refund in Q3-2018 compared to
` 0.79 billion in Q2-2018 (` 4.51 billion in FY2017, ` 1.39
billion in Q3-2017)
39
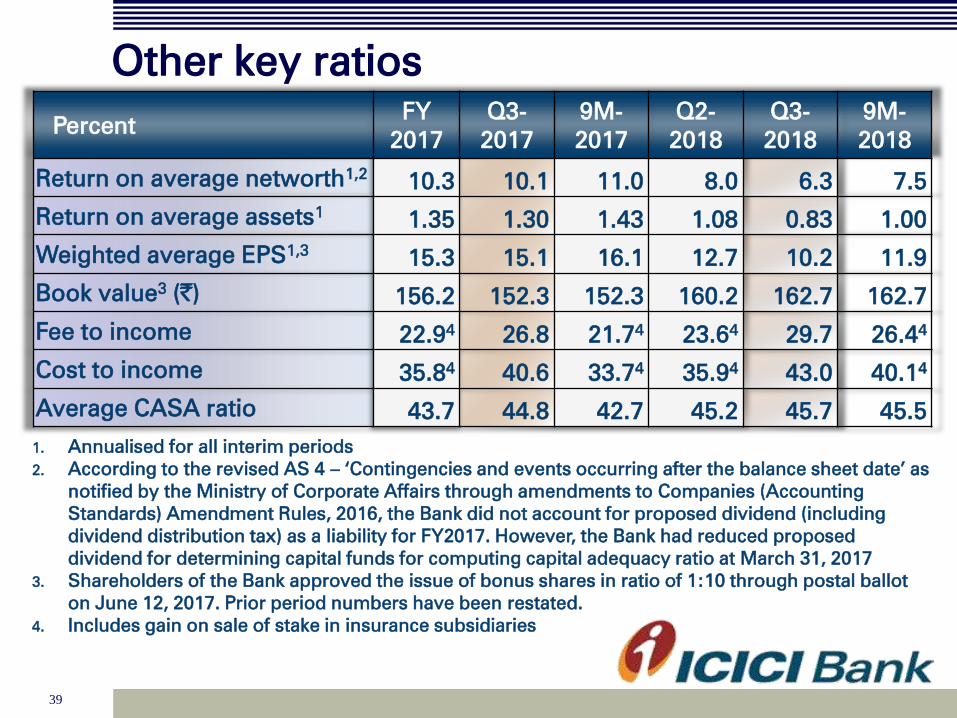
Other key ratios
Percent
FY
2017
Q3-
2017
9M-
2017
Q2-
2018
Q3-
2018
9M-
2018
Return on average networth1,2
10.3
10.1 11.0 8.0 6.3 7.5
Return on average assets1
1.35 1.30 1.43 1.08 0.83 1.00
Weighted average EPS1,3
15.3 15.1 16.1 12.7 10.2 11.9
Book value3 (`)
156.2 152.3 152.3 160.2 162.7 162.7
Fee to income 22.94
26.8 21.74 23.6
4 29.7 26.4
4
Cost to income 35.84
40.6 33.74 35.9
4 43.0 40.1
4
Average CASA ratio 43.7 44.8 42.7 45.2 45.7 45.5
1. Annualised for all interim periods
2. According to the revised AS 4 – ‘Contingencies and events occurring after the balance sheet date’ as
notified by the Ministry of Corporate Affairs through amendments to Companies (Accounting
Standards) Amendment Rules, 2016, the Bank did not account for proposed dividend (including
dividend distribution tax) as a liability for FY2017. However, the Bank had reduced proposed
dividend for determining capital funds for computing capital adequacy ratio at March 31, 2017
3. Shareholders of the Bank approved the issue of bonus shares in ratio of 1:10 through postal ballot
on June 12, 2017. Prior period numbers have been restated.
4. Includes gain on sale of stake in insurance subsidiaries

40
Consolidated profit & loss statement
` billion FY2017 Q3-
2017
9M-
2017
Q2-
2018
Q3-
2018
9M-
2018
NII
261.04 64.55 190.07 69.32 69.40 205.77
Non-interest
income 524.58 125.66 390.81 148.04 130.04 392.00
- Fee income 110.52 29.65 81.90 31.48 32.37 93.94
- Premium
income
312.03 80.04 213.97 91.72 94.18 256.88
- Other income
102.031
15.971
94.941
24.84 3.49 41.18
Total income 785.62 190.21 580.88 217.36 199.44 597.77
1. As per the RBI guidelines dated Apr 18, 2017, banks are not permitted to recognize
proportionate exchange gains or losses held in the FCTR in the P&L account. Other
income includes net foreign exchange gain relating to overseas operations
amounting to ₹ 2.88 bn in 9M-2017 which were reversed in Q4-2017
41
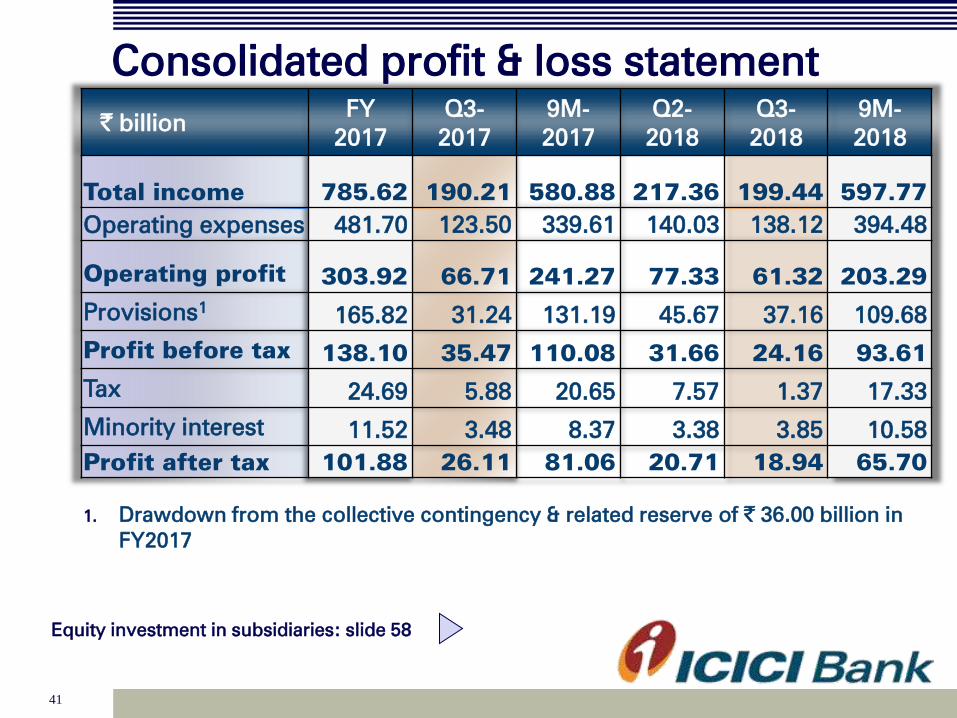
Consolidated profit & loss statement
` billion FY
2017
Q3-
2017
9M-
2017
Q2-
2018
Q3-
2018
9M-
2018
Total income 785.62 190.21 580.88 217.36 199.44 597.77
Operating expenses
481.70 123.50 339.61 140.03 138.12 394.48
Operating profit 303.92 66.71 241.27 77.33 61.32 203.29
Provisions1
165.82 31.24 131.19 45.67 37.16 109.68
Profit before tax 138.10 35.47 110.08 31.66 24.16 93.61
Tax 24.69 5.88 20.65 7.57 1.37 17.33
Minority interest 11.52 3.48 8.37 3.38 3.85 10.58
Profit after tax 101.88 26.11 81.06 20.71 18.94 65.70
Equity investment in subsidiaries: slide 58
1. Drawdown from the collective contingency & related reserve of ` 36.00 billion in
FY2017

42
Key ratios (consolidated)
Percent
FY
2017
Q3-
2017
9M-
2017
Q2-
2018
Q3-
2018
9M-
2018
Return on average
networth1,2,3
10.3 10.4 11.0 7.7 6.9 8.2
Weighted average
EPS (`)1,4
15.9 16.2 16.8 12.8 11.7 13.6
Book value (`)3
163 159 159 168 171 171
1. Based on quarterly average networth
2. Annualised for all interim periods
3. According to the revised AS 4 – ‘Contingencies and events occurring after the balance
sheet date’ as notified by the Ministry of Corporate Affairs through amendments to
Companies (Accounting Standards) Amendment Rules, 2016, the Bank had not
accounted for proposed dividend (including dividend distribution tax) as a liability for
FY2017. However, the Bank had reduced proposed dividend for determining capital
funds for computing capital adequacy ratio at March 31, 2017
4. Shareholders of the Bank approved the issue of bonus shares in ratio of 1:10 through
postal ballot on June 12, 2017. Prior period numbers have been restated
Consolidated balance sheet: slide 66

43
P&L indicators
Q3-2018 review
Credit quality
Subsidiaries
Capital
Growth
Highlights
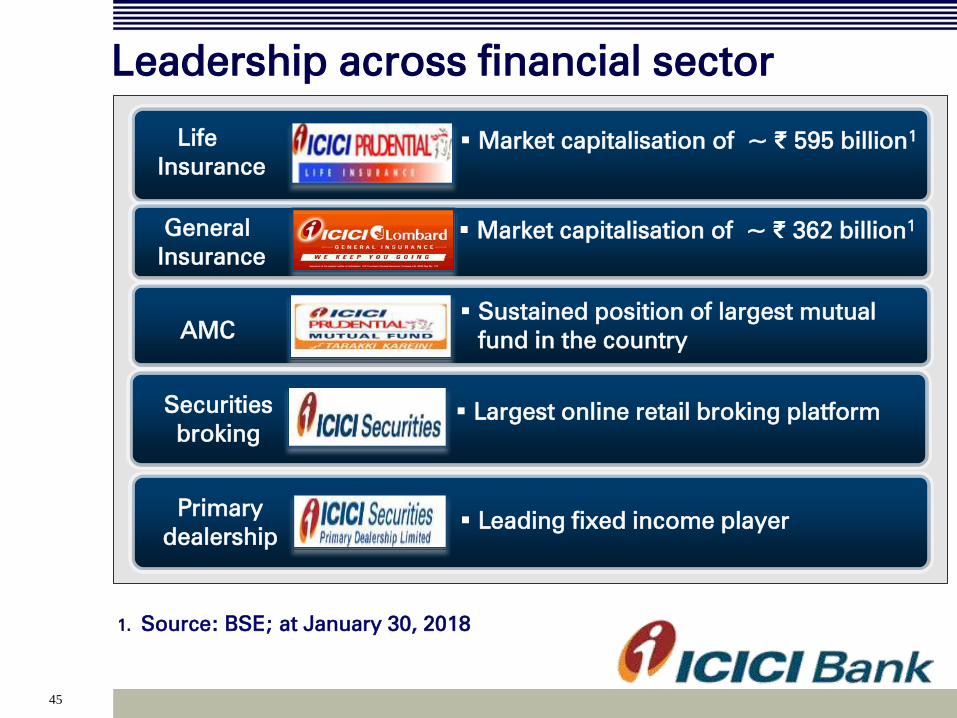
Business Key highlights Market capitalisation of ~ ₹ 595 billion1 Life
Insurance
Market capitalisation of ~ ₹ 362 billion1
General
Insurance
Sustained position of largest mutual
fund in the country AMC
Largest online retail broking platform Securities
broking
Leading fixed income player Primary
dealership
Leadership across financial sector
1. Source: BSE; at January 30, 2018
45

45
Domestic subsidiaries

46
ICICI Life (1/2)
1. All expenses (including commission) / (Total premium – 90% of single premium)
2. Source: IRDAI, Life insurance council; Retail weighted received premium basis
The company continues to retain its market leadership
among the private players with an overall market share of
13.1%2 and private market share of 23.3%
2 in 9M-2018
` billion FY2017 Q3-2017 Q2-2018 Q3-2018
New business premium 78.63 20.97 22.80 23.17
Renewal premium 144.91 36.49 43.19 45.39
Total premium 223.54 57.46 65.99 68.56
Profit after tax 16.82 4.50 4.21 4.52
Assets under management 1,229.19 1,136.11 1,305.91 1,383.04
Annualized premium
equivalent (APE) 66.25 18.45 18.69 20.05
Expense ratio1 15.1% 14.0% 14.1% 13.9%

47
ICICI Life (2/2)
• Proportion of protection business increased from 3.9%
in FY2017 to 4.1% in 9M-2018
• Value of New Business (VNB) margins1 increased from
8.0% in FY2016 and 10.1% in FY2017 to 13.7% in 9M-
2018
• Indian Embedded Value at ₹ 172.10 billion at September
30, 2017 compared to at ₹ 161.84 billion at March 31,
2017
1. FY2016 and FY2017 based on actual costs; for 9M-2018, based on management
forecast of costs for FY2018

48
ICICI General
` billion FY2017 Q3-2017 Q2-2018 Q3-2018
Gross written premium 109.60 25.42 32.34 30.02
Profit before tax 9.10 2.25 2.86 3.22
Profit after tax 7.02 2.20 2.04 2.32
Sustained leadership in private sector with an overall
market share of 8.7%1 and private sector market share
of 17.9%1 in 9M-2018
1. Source: General Insurance Council

49
Other subsidiaries
Slide 63
Profit after tax
(` billion) FY2017 Q3-2017 Q2-2018 Q3-2018
ICICI Prudential Asset
Management 4.80 1.32 1.56 1.61
ICICI Securities Primary
Dealership 4.12 1.82 0.52 (0.31)
ICICI Home Finance 1.83 0.36 0.14 0.30
ICICI Venture 0.09 0.03 (0.01) 0.02
Profit after tax of ICICI Securities on a consolidated
basis was ₹ 1.53 bn in Q3-2018
50
Overseas subsidiaries
51
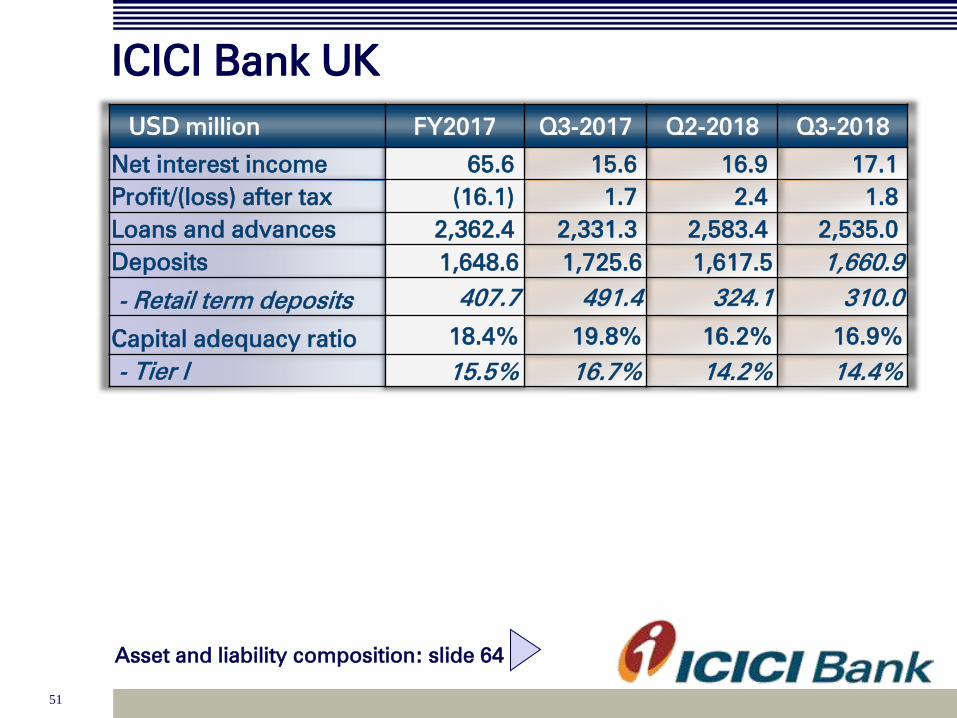
ICICI Bank UK
Asset and liability composition: slide 64
USD million FY2017 Q3-2017 Q2-2018 Q3-2018
Net interest income
65.6 15.6 16.9 17.1
Profit/(loss) after tax
(16.1) 1.7 2.4 1.8
Loans and advances 2,362.4 2,331.3 2,583.4 2,535.0
Deposits 1,648.6 1,725.6 1,617.5 1,660.9
- Retail term deposits 407.7 491.4 324.1 310.0
Capital adequacy ratio 18.4% 19.8% 16.2% 16.9%
- Tier I
15.5% 16.7% 14.2% 14.4%

52
ICICI Bank Canada
Asset and liability composition: slide 65
CAD million FY2017 Q3-2017 Q2-2018 Q3-2018
Net interest income
77.2 18.5 19.0 19.6
Profit/(loss) after tax
(33.0) (34.6) 12.8 8.4
Loans and advances 5,593.6 5,755.7 5,579.5 5,577.7
- Insured mortgages 3,454.3 3,093.2 3,223.5 3,112.8
Deposits 2,556.1 2,595.7 2,529.6 2,576.5
Capital adequacy ratio 21.8% 24.7% 21.2% 21.1%
- Tier I
21.8% 24.7% 21.2% 21.1%
53
P&L indicators
Q3-2018 review
Credit quality
Subsidiaries
Capital
Growth
Highlights

54
Capital adequacy
Excess Tier-1 ratio of 6.69% over the minimum requirement of
8.35% as per current RBI guidelines
• Capital ratios significantly higher
than regulatory requirements
• Tier-1 capital is composed almost
entirely of core equity capital
• Substantial scope to raise Additional
Tier-1 and Tier-2 capital
Dec 31, 2017
Tie
r I
CA
R
18.10%1
15.04%1
Standalone
Capital adequacy ratios: slide 67
Risk weighted assets flat y-o-y compared to 7.4%
y-o-y growth in total assets
1. Including profits for 9M-2018
During the quarter, the Bank raised ₹ 4.75 billion by way of
issuance of Additional Tier-I bonds
CE
T1
14.19%1

55
Sharp focus on strategic priorities: 4x4
agenda
Robust funding profile Digital leadership & strong
customer franchise
Continued cost efficiency Focus on capital efficiency
including value unlocking
Monitoring focus Improvement in portfolio
mix
Concentration risk
reduction Resolution of stress cases
En
han
cin
g
fran
ch
ise
Po
rtfo
lio
qu
ality

56
Thank you

57
Balance sheet: assets
1. Rural Infrastructure Development Fund
` billion December 31,
2016
September
30, 2017
December 31,
2017
Cash & bank balances 611.67 533.62 558.64
Investments 1,689.87 1,799.35 1,798.07
- SLR investments 1,227.35 1,231.49 1,248.46
- Equity investment in
subsidiaries 105.82 102.90 102.90
Advances 4,574.69 4,827.80 5,053.87
Fixed & other assets 701.74 717.25 724.91
- RIDF 1and related 260.58 238.71 249.44
Total assets 7,577.97 7,878.02 8,135.49
Increasing share of retail loans: slide 13
58
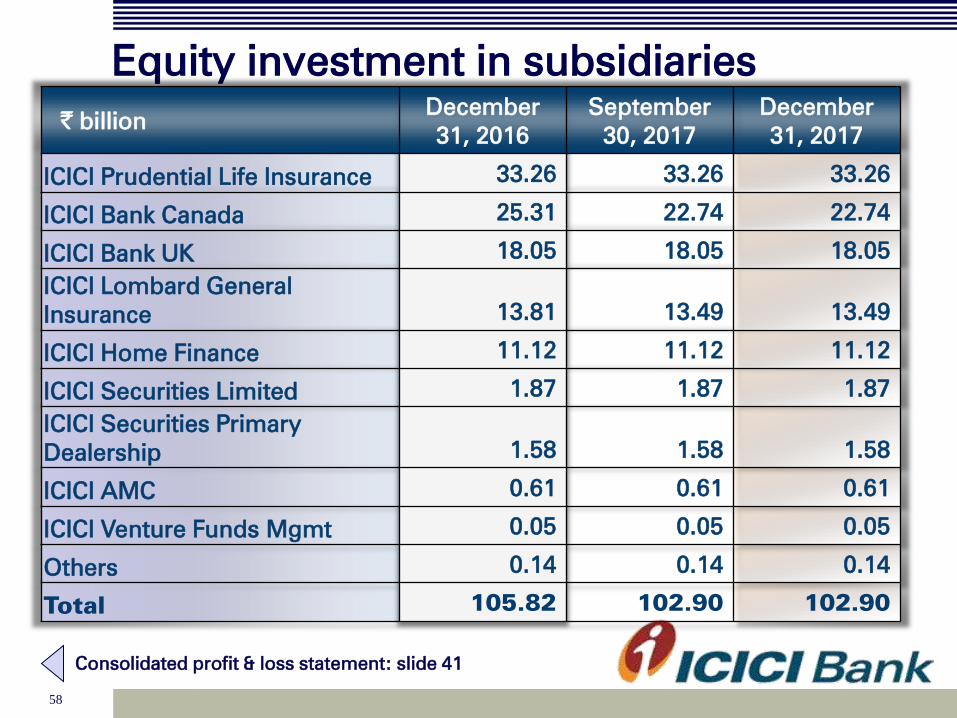
Equity investment in subsidiaries
` billion December
31, 2016
September
30, 2017
December
31, 2017
ICICI Prudential Life Insurance 33.26 33.26 33.26
ICICI Bank Canada 25.31 22.74 22.74
ICICI Bank UK 18.05 18.05 18.05
ICICI Lombard General
Insurance 13.81 13.49 13.49
ICICI Home Finance 11.12 11.12 11.12
ICICI Securities Limited 1.87 1.87 1.87
ICICI Securities Primary
Dealership 1.58 1.58 1.58
ICICI AMC 0.61 0.61 0.61
ICICI Venture Funds Mgmt 0.05 0.05 0.05
Others 0.14 0.14 0.14
Total 105.82 102.90 102.90
Consolidated profit & loss statement: slide 41
59
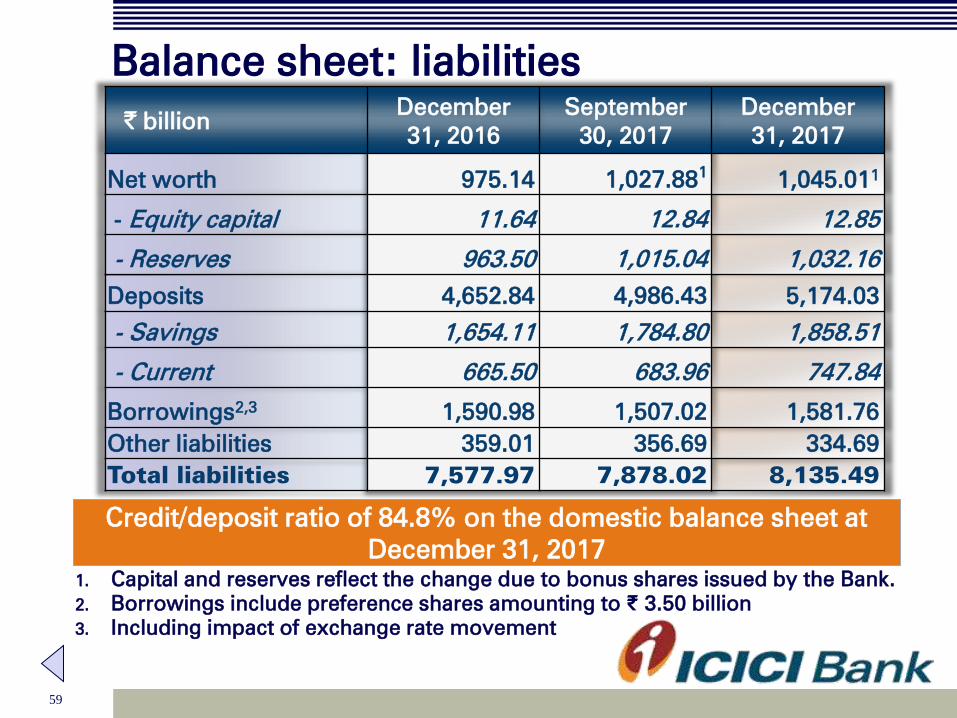
Balance sheet: liabilities
1. Capital and reserves reflect the change due to bonus shares issued by the Bank.
2. Borrowings include preference shares amounting to ₹ 3.50 billion
3. Including impact of exchange rate movement
` billion December
31, 2016
September
30, 2017
December
31, 2017
Net worth
975.14 1,027.881
1,045.011
- Equity capital
11.64 12.84
12.85
- Reserves
963.50 1,015.04 1,032.16
Deposits 4,652.84 4,986.43 5,174.03
- Savings 1,654.11 1,784.80 1,858.51
- Current 665.50 683.96 747.84
Borrowings2,3
1,590.98 1,507.02 1,581.76
Other liabilities
359.01 356.69 334.69
Total liabilities 7,577.97 7,878.02 8,135.49
Credit/deposit ratio of 84.8% on the domestic balance sheet at
December 31, 2017
60
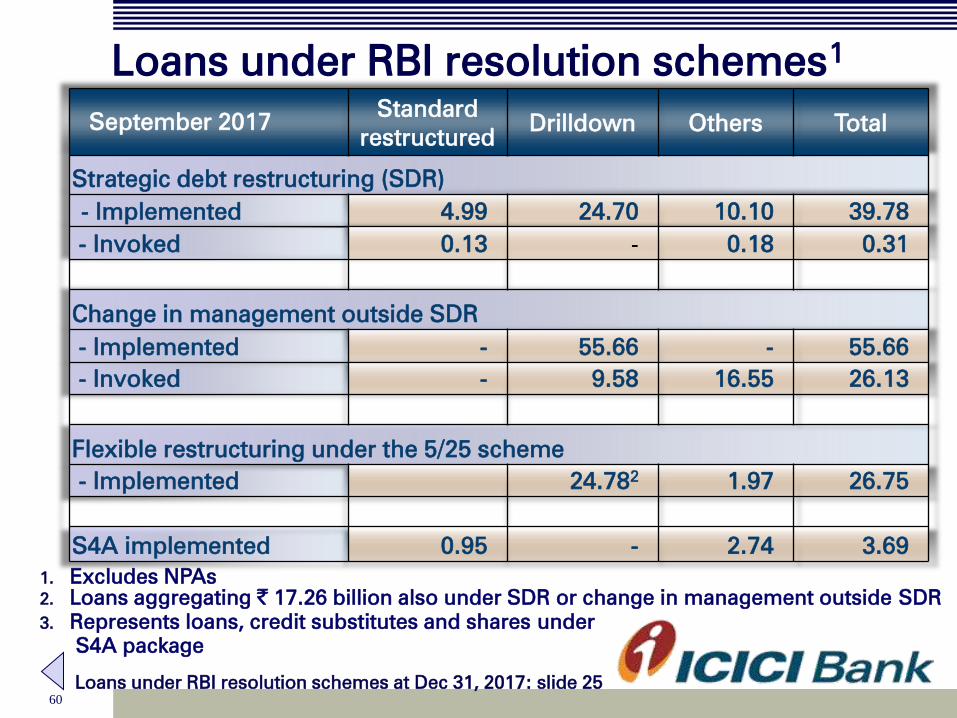
Loans under RBI resolution schemes1
1. Excludes NPAs
2. Loans aggregating ` 17.26 billion also under SDR or change in management outside SDR
3. Represents loans, credit substitutes and shares under
S4A package
September 2017 Standard
restructured Drilldown Others Total
Strategic debt restructuring (SDR)
- Implemented 4.99 24.70 10.10 39.78
- Invoked 0.13 - 0.18 0.31
Change in management outside SDR
- Implemented - 55.66 - 55.66
- Invoked - 9.58 16.55 26.13
Flexible restructuring under the 5/25 scheme
- Implemented 24.782
1.97 26.75
S4A implemented 0.95 - 2.74 3.69
Loans under RBI resolution schemes at Dec 31, 2017: slide 25

61
Composition of borrowings
1. Includes preference share capital ` 3.50 billion
2. Including impact of exchange rate movement
Healthy funding mix maintained: slide 15
Raised ₹ 4.75 billion by way of issuance of Additional Tier-1
bonds in Q3-2018
` billion December
31, 2016
September
30, 2017
December
31, 2017
Domestic
713.52 720.25 775.22
- Capital instruments1
315.83 296.48 295.38
- Other borrowings 397.62 423.77 479.84
- Long term infrastructure
bonds 172.25 194.97 194.92
Overseas2
877.46 786.77 806.54
- Capital instruments - - -
- Other borrowings 877.46 786.77 806.54
Total borrowings2
1,590.98 1,507.02 1,581.76

62
Extensive franchise
Healthy funding mix maintained: slide 15
Branches At Mar
31, 2015
At Mar
31, 2016
At Mar
31, 2017
At Dec
31, 2017
% share
at Dec 31,
2017
Metro 1,011 1,159 1,287 1,288 26.5%
Urban 933 997 1,050 1,051 21.6%
Semi urban 1,217 1,341 1,442 1,448 29.8%
Rural 889 953 1,071 1,073 22.1%
Total branches 4,050 4,450 4,850 4,860 100.0%
Total ATMs 12,451 13,766 13,882 14,262 -
63
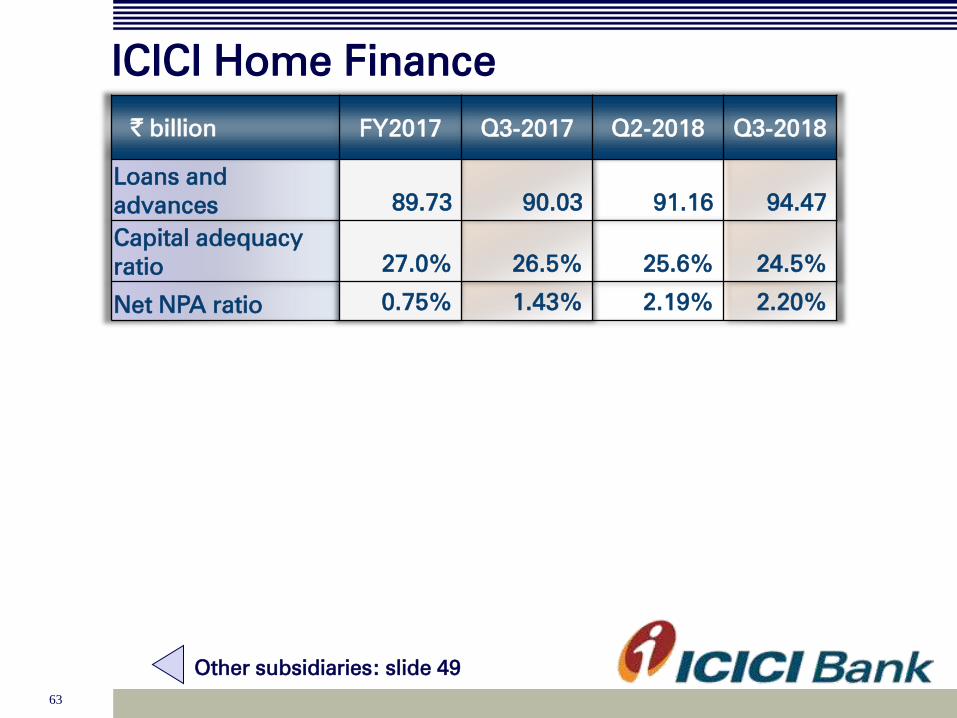
ICICI Home Finance
Other subsidiaries: slide 49
` billion FY2017 Q3-2017 Q2-2018 Q3-2018
Loans and
advances 89.73 90.03 91.16 94.47
Capital adequacy
ratio 27.0% 26.5% 25.6% 24.5%
Net NPA ratio 0.75% 1.43% 2.19% 2.20%
64
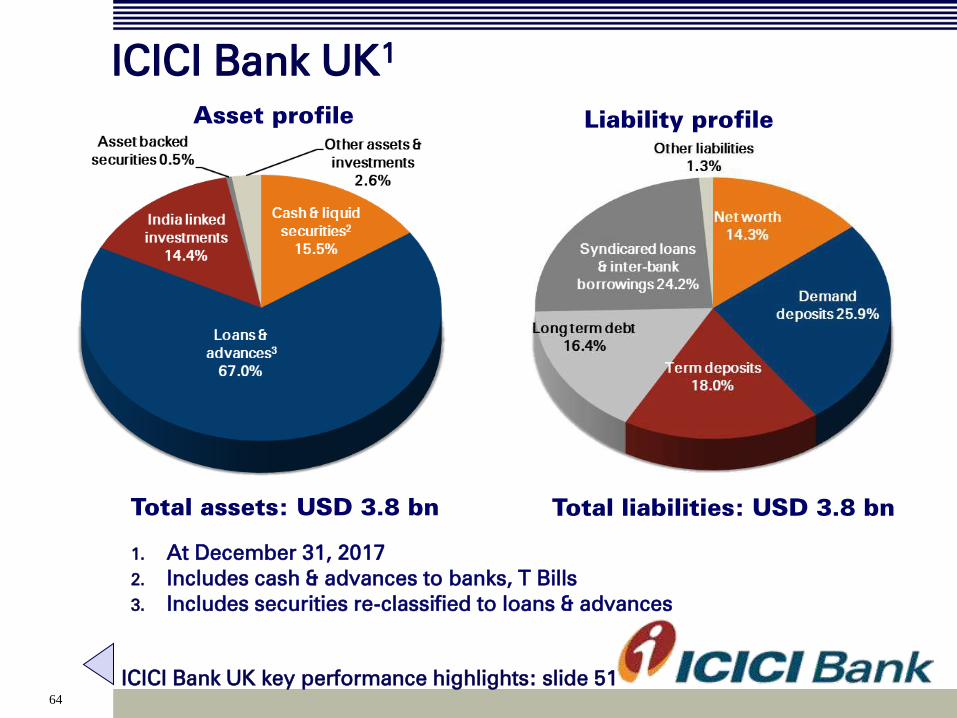
ICICI Bank UK1
ICICI Bank UK key performance highlights: slide 51
1. At December 31, 2017
2. Includes cash & advances to banks, T Bills
3. Includes securities re-classified to loans & advances
Asset profile Liability profile
3
2
Total liabilities: USD 3.8 bn Total assets: USD 3.8 bn

65
ICICI Bank Canada1
ICICI Bank Canada key performance highlights: slide 52
Asset profile
Total liabilities: CAD 6.2 bn Total assets: CAD 6.2 bn
2
3
1. At Dec 31, 2017
2. Includes cash & placements with banks and government securities
3. Based on IFRS, securitised portfolio of CAD 2,924.9 mn considered as part of insured
mortgage portfolio at December 31, 2017
4. As per IFRS, proceeds of CAD 2,891.8 mn from sale of securitised portfolio considered
as part of borrowings at September 30, 2017
Liability profile

66
Consolidated balance sheet
Key ratios (consolidated): slide 42
` billion December
31, 2016
September
30, 2017
December
31, 2017
Cash & bank balances
663.53 570.07 617.22
Investments
3,047.21 3,400.52 3,450.38
Advances 5,107.04 5,382.04 5,597.41
Fixed & other assets 811.19 856.05 871.76
Total assets
9,628.97 10,208.68 10,536.77
Net worth1
1,020.32 1,081.04 1,100.83
Minority interest
45.36 56.29 57.62
Deposits 4,895.21 5,217.81 5,403.87
Borrowings 2,000.27 1,995.42 2,042.54
Liabilities on policies in force 1,070.90 1,230.08 1,307.46
Other liabilities 596.91 628.04 624.45
Total liabilities
9,628.97 10,208.68 10,536.77
1. Capital and reserves reflect the change due to bonus shares issued by the Bank.

67
Standalone capital adequacy
Basel III September 30, 20171
December 31, 20171
₹ billion % ₹ billion %
Total capital
1,100.40 17.56% 1,100.61 17.65%
- Tier I
908.50 14.50% 908.54 14.57%
- of which: CET1 859.91 13.72% 854.66 13.71%
- Tier II 191.90 3.06% 192.07 3.08%
Risk weighted assets
6,267.62 6,235.52
- On balance sheet 5,427.82 5,436.10
- Off balance sheet 839.80 799.42
Including the profits for 9M-2018, the standalone capital adequacy
ratio for the Bank as per Basel III norms would have been 18.10%, the
Tier I ratio would have been 15.04% and CET1 ratio would have been
14.19% at December 31, 2017
1. In line with the applicable guidelines, the Basel III capital ratios reported by the
Bank for the interim periods do not include profits for the period

68
Consolidated capital adequacy
Basel III September 30, 20171
December 31, 20171
% %
Total capital
17.14% 17.24%
- Tier I
14.30% 14.37%
- Tier II 2.84% 2.87%
Including the profits for 9M-2018, the consolidated capital adequacy
ratio for the Bank as per Basel III norms would have been 17.72% and
the Tier I ratio would have been 14.87% at December 31, 2017
Capital adequacy: slide 54
1. In line with the applicable guidelines, the Basel III capital ratios reported by the
Bank for the interim periods do not include profits for the period