Embed Size (px)
Citation preview

8 November 2018
Q3 2018 results
INM
AR
SA
T >
Q3 2
018 R
esu
lts

Rupert PearceChief Executive Officer
Performance review
INM
AR
SA
T >
Q3 2
018 R
esu
lts
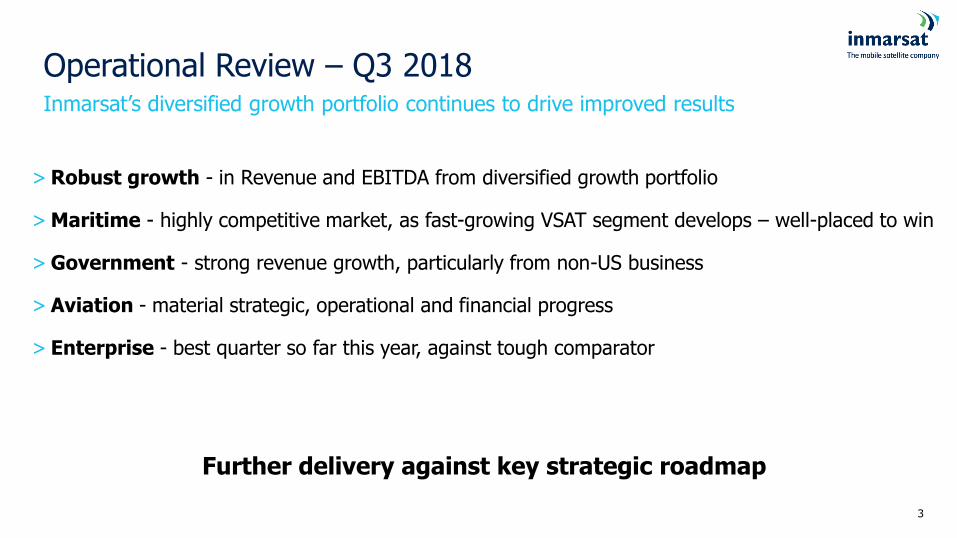
˃ Robust growth - in Revenue and EBITDA from diversified growth portfolio
˃ Maritime - highly competitive market, as fast-growing VSAT segment develops – well-placed to win
˃ Government - strong revenue growth, particularly from non-US business
˃ Aviation - material strategic, operational and financial progress
˃ Enterprise - best quarter so far this year, against tough comparator
Further delivery against key strategic roadmap
3
Inmarsat’s diversified growth portfolio continues to drive improved results
Operational Review – Q3 2018

4
Market remains highly competitive, as fast-growing VSAT segment develops – well-placed to win
Maritime – Q3 2018 performance
L-band Ka-band
> 25% market share in VSAT today (2016: 15%)
> 60% of all new industry VSAT installations are FX
> Continued high proportion of new customer installations
> Growing share of installations by distribution partners
> On-going efforts to capture market share across all verticals
> FX remains the fundamental driver of long term value in Maritime
> Rapid migration of vessels from mid-market to VSAT (inc.FX) – impacting FB revenues
> 1,400+ migrations from FB to FX in YTD
> Competitive pressures, principally from Ku-band VSAT, especially low-end crew VSAT
> Responding with enhanced product offerings, targeted incentives and new sales strategies – in FB and FX
> L-band competition remains modest
> c.4,000 vessels installed
> Further building new business pipeline
Fleet XpressFleet BroadBandFleet One
Inmarsat remains well positioned to win leading market share in $2.6 billion emerging Maritime market

US International
Higher underlying revenues from Boeing partnership
New major customer win in Q3 -further validation of our market
leadership position
On-going sectoral diversification, e.g. FirstNet
Increased product usage from key customers – particularly in L-band
Continued success in geographic & service
diversification
Government – Q3 2018 performance Strong growth performance, particularly from non-US business
5
Further progress in building long term contracted revenue base

6
Aviation – Q3 2018 performance
Core business
> Higher customer usage in SwiftBroadband
> JetConneX achieving material market penetration in BGA
> Further strong underlying performance from Classic Aero
> Progress on launch of SB-Safety
> Double digit improvement in revenue and cash flow
In-flight Connectivity
> 321 aircraft installed, including first for EAN
> Further increase in aircraft in service
> On track for several customer launches in the coming quarters, including over the European Aviation Network
> GX Aviation selected by a number of new customers
> Double digit improvement in revenue and cash flow
Material strategic, operational and financial progress
Further market share gains in IFC and improved market position in Core business

Strengthens drive to create global leadership position in IFC
Aviation: Panasonic strategic partnership
Key benefits for Inmarsat > Exclusive provider of Ka-band IFC capacity to Panasonic> GX the priority service for all future Panasonic IFC installations > Access to Panasonic’s downstream IFE & IFC presence,
relationships and capabilities > Major validation of Ka-band and GX
Leading global mobile satellite provider
Market leader in IFC and IFE

8
Enterprise – Q3 2018 performance Best quarter so far this year, against tough comparator
Legacy business performed well
> Strong performance in BGAN and satellite phones, against tough comparator
> Fixed-to-mobile impacted by on-going VOIP migration
New growth foundations being established around “Internet-of-Things”
> Further growth in M2M
> Initial progress on “proof-of-concept” IoT projects inMining and Agritech
Inmarsat remains well positioned for future long term growth opportunities

Base Case
9
Multiple paths to additional growth & value creation –off a solid base
Diversified portfolio to drive Revenue, EBITDA and FCF growth
Solid foundation of L-band based BGAN family of services(BGAN, Fleet Broadband, Swift Broadband, GSPS) in Maritime, Aviation Core, Government & Enterprise
High growth in GX services to incumbency markets(FX, GX, JX) in Maritime, Aviation Core, Government & Enterprise
In-Flight ConnectivityGX & EAN
GovtStrategic deals
& Op tempo
Internetof Things
LigadoSpectrum
China & IndiaDigital services
Double digit growth
Moderate growth
Enables meaningful moderation in infrastructure capex after 2020
INM
AR
SA
T >
Q3 2
018 R
esu
lts
Tony BatesChief Financial Officer
Financial Review

Group Income statement – Q3 and YTD 2018
11
$m Q3 2018 Q3 2017 Change YTD 2018 YTD 2017 Change
Revenue 369.3 356.2 13.1 1,086.5 1,039.9 46.6
Direct costs (61.4) (47.2) (14.2) (179.6) (133.7) (45.9)
Gross margin 307.9 309.0 (1.1) 906.9 906.2 0.7
Indirect costs (101.4) (115.7) 14.3 (327.4) (333.2) 5.8
EBITDA 206.5 193.3 13.2 579.5 573.0 6.5
Depreciation & Amortisation (115.0) (103.4) (11.6) (347.5) (297.5) (50.0)
Asset impairments (6.6) (3.0) (3.6) (6.4) (3.4) (3.0)
Net financing costs* (26.7) (19.8) (6.9) (79.2) (69.4) (9.8)
Adjusted profit before tax 58.2 67.1 (8.9) 146.4 202.7 (56.3)
Tax (11.7) (10.8) (0.9) (24.4) (35.4) 11.0
Change in value of derivative 181.2 56.4 124.8 (26.1) (15.8) (10.3)
Statutory profit after tax 227.7 112.7 115.0 95.9 151.5 (55.6)
* Before change in value of derivative
12
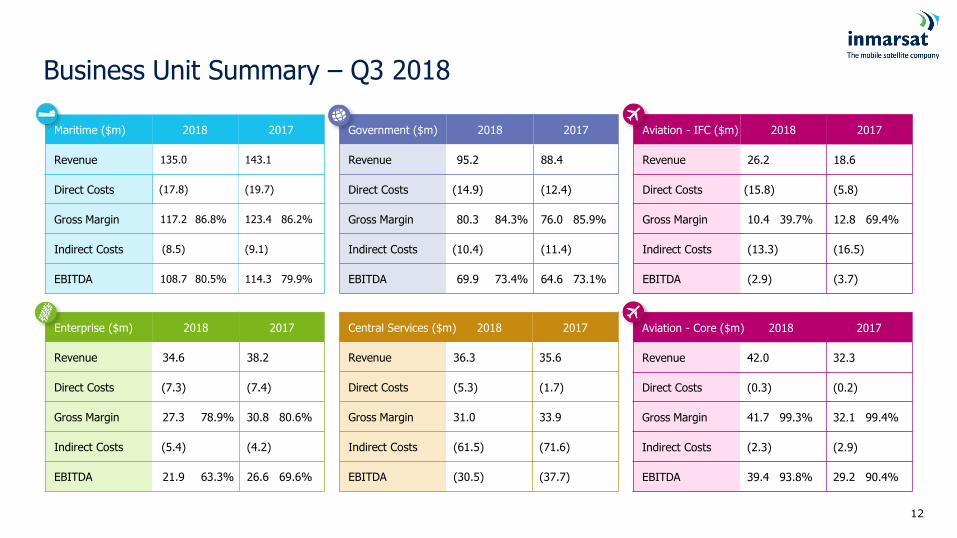
Business Unit Summary – Q3 2018
Maritime ($m) 2018 2017
Revenue 135.0 143.1
Direct Costs (17.8) (19.7)
Gross Margin 117.2 86.8% 123.4 86.2%
Indirect Costs (8.5) (9.1)
EBITDA 108.7 80.5% 114.3 79.9%
Government ($m) 2018 2017
Revenue 95.2 88.4
Direct Costs (14.9) (12.4)
Gross Margin 80.3 84.3% 76.0 85.9%
Indirect Costs (10.4) (11.4)
EBITDA 69.9 73.4% 64.6 73.1%
Aviation - IFC ($m) 2018 2017
Revenue 26.2 18.6
Direct Costs (15.8) (5.8)
Gross Margin 10.4 39.7% 12.8 69.4%
Indirect Costs (13.3) (16.5)
EBITDA (2.9) (3.7)
Enterprise ($m) 2018 2017
Revenue 34.6 38.2
Direct Costs (7.3) (7.4)
Gross Margin 27.3 78.9% 30.8 80.6%
Indirect Costs (5.4) (4.2)
EBITDA 21.9 63.3% 26.6 69.6%
Central Services ($m) 2018 2017
Revenue 36.3 35.6
Direct Costs (5.3) (1.7)
Gross Margin 31.0 33.9
Indirect Costs (61.5) (71.6)
EBITDA (30.5) (37.7)
Aviation - Core ($m) 2018 2017
Revenue 42.0 32.3
Direct Costs (0.3) (0.2)
Gross Margin 41.7 99.3% 32.1 99.4%
Indirect Costs (2.3) (2.9)
EBITDA 39.4 93.8% 29.2 90.4%

˃ VSAT revenue up $7.3m, 23.0%, to $39.0m− Market share gains continue
− Vessels up 1,812 to 5,772
− ARPU impacted by channel mix and market capture strategy
˃ FleetBroadband revenue down $11.6m, 13.4%, to $75.0m− FB vessels down 3,300 – principally due to VSAT migrations
− Increased pressure from competitive VSAT being addressed by product and service enhancements
− ARPU impacted by high end customers moving to VSAT
˃ Fleet One revenue up to $1.7m − Annualised run rate of c.$8m (FY 2017: $5.0m)
˃ Other product revenue down $4.1m, 17.5% to $19.4m
˃ Improved Gross Margin % (due to mix) and lower indirect costs
˃ EBITDA $5.6m, 4.9%, lower to $108.7m
˃ Success-based cash capex up slightly to $13.0m
13
Maritime Results – Q3 2018
143.1
114.3135.0
108.7
0
100
Q3 2017 Q3 2018
Revenue EBITDA
Margin80.5%
Margin79.9%
$m
75.039.0
1.7 19.4
201786.6
31.7
1.3 23.5
2018
Q3 Revenue ($ in millions)
FleetBroadband VSAT Fleet One Other

88.4
64.6
95.2
69.9
0
10
20
30
40
50
60
70
80
90
100
$m
Q3 2017 Q3 2018
Revenue EBITDA
Margin73.4%
Margin73.1%
˃ US revenue up 1.5%:− Large contract renewed on more favourable terms earlier in 2018
˃ Revenue up 21.1% outside the US:− Increased product usage across key customers
˃ Slightly lower Gross Margin % (due to mix) but lower indirect costs
˃ EBITDA up $5.3m, 8.2%
14
Government Results – Q3 2018

˃ Aviation revenue up $17.3m, 34.0%, to $68.2m
˃ Core revenues up $9.7m, 30.0%, to $42.0m− SwiftBroadband up 9.4%
− JetConneX up by factor of 4x
− Classic Aero up 16.9%
˃ IFC revenues up $7.6m, 40.9%, to $26.2m− Including $3.3m of GX airtime revenue
− Lower gross margin % due to mix and some contractual start-up costs
˃ Indirect costs down $3.8m to $15.6m− Mainly due to lower IFC marketing spend
˃ EBITDA up $11.0m to $36.5m, EBITDA % margin of 53.5% (Q3 2017: 50.1%)
− Margins expected to be no less than 45% in 2018, (from previous guidance of c.40%) before returning to at least 2016 levels of c.60% in 2021
˃ Cash capex down $19.7m to $10.7m − Lower spend on on-board equipment for customers
15
Aviation Results Q3 2018
32.3
18.6
42.0
26.2
29.2
-3.7
39.4
-2.9
-10
0
10
20
30
40
50
Core IFC
Revenue Q3 2017 Revenue Q3 2018
EBITDA Q3 2017 EBITDA Q3 2018
$m
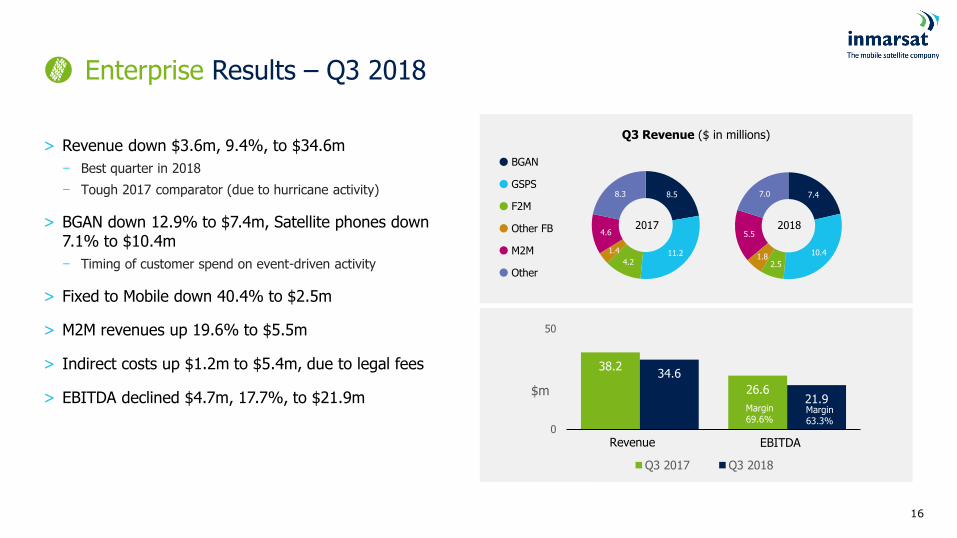
˃ Revenue down $3.6m, 9.4%, to $34.6m
− Best quarter in 2018
− Tough 2017 comparator (due to hurricane activity)
˃ BGAN down 12.9% to $7.4m, Satellite phones down 7.1% to $10.4m
− Timing of customer spend on event-driven activity
˃ Fixed to Mobile down 40.4% to $2.5m
˃ M2M revenues up 19.6% to $5.5m
˃ Indirect costs up $1.2m to $5.4m, due to legal fees
˃ EBITDA declined $4.7m, 17.7%, to $21.9m
16
Enterprise Results – Q3 2018
38.2
26.6
34.6
21.9
0
50
Q3 2017 Q3 2018
Revenue EBITDA
Margin63.3%
Margin69.6%
$m
7.4
10.4
2.51.8
5.5
7.0
2017
8.5
11.24.2
1.4
4.6
8.3
2018
Q3 Revenue ($ in millions)
BGAN
GSPS
F2M
Other FB
M2M
Other

17
Group Cash Flow – Q3 & YTD 2018
US$m Q3 2018 Q3 2017 Change YTD 2018 YTD 2017 Change
EBITDA 206.5 193.3 13.2 579.5 573.0 6.5
Working capital/non-cash items 3.2 (5.6) 8.8 (58.4) 16.4 (74.8)
Operating cash flow 209.7 187.7 22.0 521.1 589.4 (68.3)
Capital expenditure (157.5) (101.0) (56.5) (415.3) (409.2) (6.1)
Interest paid (17.9) (22.7) (4.8) (77.6) (77.5) (0.1)
Tax paid* 2.5 (1.5) 4.0 3.9 (18.1) 22.0
Free cash flow 36.8 62.5 (25.7) 32.1 84.6 (52.5)
Dividends paid (1.1) (0.1) (1.0) (40.0) (118.0) 78.0
Other movements - (5.1) (5.1) 1.4 (7.7) 9.1
Net cash flow 35.7 57.3 (21.6) (6.5) (41.1) 34.6
Opening net debt 2,139.5 2,005.7 (133.8) 2,078.6 1,894.8 (183.8)
Net cash flow (35.7) (58.2) 22.5 6.5 41.1 (34.6)
Other 11.9 4.5 8.4 30.6 16.1 14.5
Closing net debt 2,115.7 1,952.0 (163.7) 2,115.7 1,952.0 (163.7)
* Legacy tax issue remains open

18
Capital Expenditure – Q3 and YTD 2018
Major infrastructure projects: Relates to GX-5 and I-6 spend satellite design, build, launch and ground infrastructure costs.
Success-based capex: Equipment installed on customer platforms (e.g. vessels and aircraft) increasing due to installation programmes in IFC and FX.
Other: Primarily infrastructure maintenance, IT and capitalised product and service development costs.
This analysis of capital expenditure is on an accruals basis, with the timing adjustment to cash capex being shown separately, and is exclusive of capitalised interest.
US$m Q3 2018 Q3 2017 Change YTD 2018 YTD 2017 Change
Major infrastructure projects 88.1 40.7 (47.4) 225.8 244.2 18.4
Success-based capex 16.2 32.2 16.0 61.3 93.0 31.7
Other 20.8 36.3 15.5 68.3 95.1 26.8
Cash flow timing 32.4 (8.2) (40.6) 59.9 (23.1) (83.0)
Total cash capital expenditure 157.5 101.0 (56.5) 415.3 409.2 (6.1)

19
Medium term guidance unchanged, updated revenue & EBITDA guidance for 2018
Future Guidance
Medium term revenue, EBITDA & Free Cash Flow (excluding Ligado):
> Targeting mid-single digit % increase in revenue on average over 2018 to 2022
> EBITDA and Free Cash Flow expected to steadily improve
2018 Revenue & EBITDA (excluding Ligado):
> Expected to be at least in line with current market consensus
Leverage:
˃ To normally remain below 3.5x
Capex:
> Capex of $500m to $600m pa over 2018 to 2020
> Based on current management plans, infrastructure capex to meaningfully moderate after 2020, reflecting:
New, lower cost, satellite technologies
Constellation cycle, including completion of I-6 programme
More line-fit in IFC
XL to FX migration complete
GX revenues:
> Annual GX revenues at a run rate of $500m by the end of 2020
Leverage:
˃ To normally remain below 3.5x

Q&A
INM
AR
SA
T >
Q3 2
018 R
esu
lts

Disclaimer
These materials have been prepared by or on behalf of Inmarsat plc and its affiliates (“Inmarsat”, “we”, “us” or our”). The information provided within thesematerials, together with all or any other information relating to Inmarsat whether written, oral or in a visual or an electronic form (including, without limitation, in amagnetic or digital form) transmitted or made available to you (“Information”) is highly confidential. You agree not to reproduce or disclose to others theInformation or any portion or derivative of it except as expressly agreed to in writing by us.
The Information is for information and discussion purposes only and you agree not to use the Information for any other purpose. It is not intended to form thebasis of any investment decision or decision to enter into any transaction with Inmarsat. The Information does not constitute an offer or invitation to purchase anyshares in Inmarsat and its issue shall not be taken as any form of commitment on the part of Inmarsat to proceed with any transaction.
The Information, including any statement of fact or opinion, has been provided by or on behalf of us and has not been independently verified and does not purportto be comprehensive. Neither Inmarsat (nor any of our respective officers, employees, advisers and agents) accept any responsibility for, nor make anyrepresentation or warranty, express or implied, as to the truth, accuracy or completeness of the Information. In particular, no representation or warranty (whetherexpress or implied) is given as to the achievement or reasonableness of any future projections, management estimates, prospects or returns or any of theassumptions underlying them. The only representations and warranties which you will be entitled to rely on are those that may be included in a definitive writtenagreement with us. You should conduct your own investigation of Inmarsat and the Information. We do not assume any obligation to provide you with access toany additional information or to update the Information or to correct any inaccuracies in Information.
The Information may contain ‘forward-looking statements’. These forward-looking statements involve risks, uncertainties and other factors that may cause ouractual results, performance or achievements, or industry results, to be materially different from those projected in the forward-looking statements. These factorsinclude general economic and business conditions; changes in technology; timing or delay in signing, commencement, implementation and performance orprogrammes, or the delivery of products or services under them; structural change in the satellite industry; relationships with customers; competition; and ability toattract personnel. You are cautioned not to rely on these forward-looking statements, which speak only as of the date of these materials. We undertake noobligation to update or revise any forward-looking statement to reflect any change in our expectations or any change in events, conditions or circumstances.
You acknowledge that some or all of the Information may be information which is not public or otherwise generally available and is of a kind such that a personwho has that information would be prohibited or restricted from using it to deal in the securities of Inmarsat under Part V of the Criminal Justice Act 1993 or otherapplicable insider dealing, market abuse or similar law. You shall not use the Information, while it is not public or generally available, to deal, or to encourageanyone else to deal, in any of those securities. You shall not otherwise use or disclose any Information in a way that amounts to market abuse under the EUMarket Abuse Regulation or contravenes Part V of the Criminal Justice Act 1993 or any other applicable insider dealing, market abuse or similar law. Misuse ofsome or all of the Information may constitute behaviour amounting to market abuse under the EU Market Abuse Regulation.
Copyright © 2018, Inmarsat plc and its affiliates.21