Embed Size (px)
Citation preview

Q3 2021 ResultsOctober 2021
Safe HarbourThis presentation contains forward-looking statements that are based on our management’s current estimates, beliefs and assumptions, which are based on management’s perception of historic trends, current conditions and expected future developments, as well as other factors management believes are appropriate in the circumstances. Although we believe that the plans, intentions, expectations, assumptions and strategies reflected in these forward-looking statements are reasonable, these statements relate to future events or our future financial performance, and involve known and unknown risks, uncertainties and other factors that may cause our actual results to be materially different from any future results expressed or implied by these forward-looking statements. Although the forward-looking statements contained in this presentation are based upon what we believe are reasonable assumptions, investors are cautioned against placing undue reliance on these statements since actual results may vary from the forward-looking statements. Forward-looking statements involve known and unknown risks, uncertainties and other factors, which are, in some cases, beyond our control and which could materially affect our results. These risks include the risks due to the uncertainty around the duration and scope of the COVID-19 pandemic and the impact of the pandemic and actions taken in response on global and regional economies and economic activity and are described in further detail in our Management's Discussion and Analysis for the year ended December 31, 2020 and in the section entitled “Risk Factors” in our Annual Information Form for the year ended December 31, 2020 available on www.sec.gov and on www.sedar.com and elsewhere in our filings with regulatory agencies. If one or more of these risks or uncertainties occur, or if our underlying assumptions prove to be incorrect, actual results may vary significantly from those expressed, implied or projected by the forward-looking statements. References to long-term trends in our model are forward-looking and made as of the current date. Nothing in this presentation should be regarded as a representation by any person that these long-term trends will be achieved and we undertake no duty to update these long-term trends or any other forward-looking statements contained in this presentation, except as required by law.
We believe that the case studies presented in this presentation provide a representative sample of how our merchants have been able to use various features of our platform to grow their respective businesses. References in this presentation to increased visits, growth and sales following implementation of our platform do not necessarily mean that our platform was the only factor contributing to such increases.
To supplement the financial measures prepared in accordance with generally accepted accounting principles (GAAP), we use non-GAAP financial measures that exclude certain items. Non-GAAP financial measures are not prepared in accordance with GAAP; therefore, the information is not necessarily comparable to other companies and should be considered as a supplement to, not a substitute for, or superior to, the corresponding measures calculated in accordance with GAAP. Please refer to the slides titled “Non-GAAP Financial Measures” and “Reconciliation of GAAP to Non-GAAP Figures” for further information.
This presentation contains information concerning our industry, including information relating to the size of the markets in which we participate, that are based on industry surveys and publications or other publicly available information, other third-party survey data and research reports. This information involves many assumptions and limitations, there can be no guarantee as to the accuracy or reliability of such assumptions and you are cautioned not to give undue weight to this information. While we believe this information to be reliable, it has not been independently verified. This presentation contains trademarks, service marks, trade names and copyrights of Shopify and other companies, which are the property of their respective owners.
October 2021
2

Retail is changing.
4
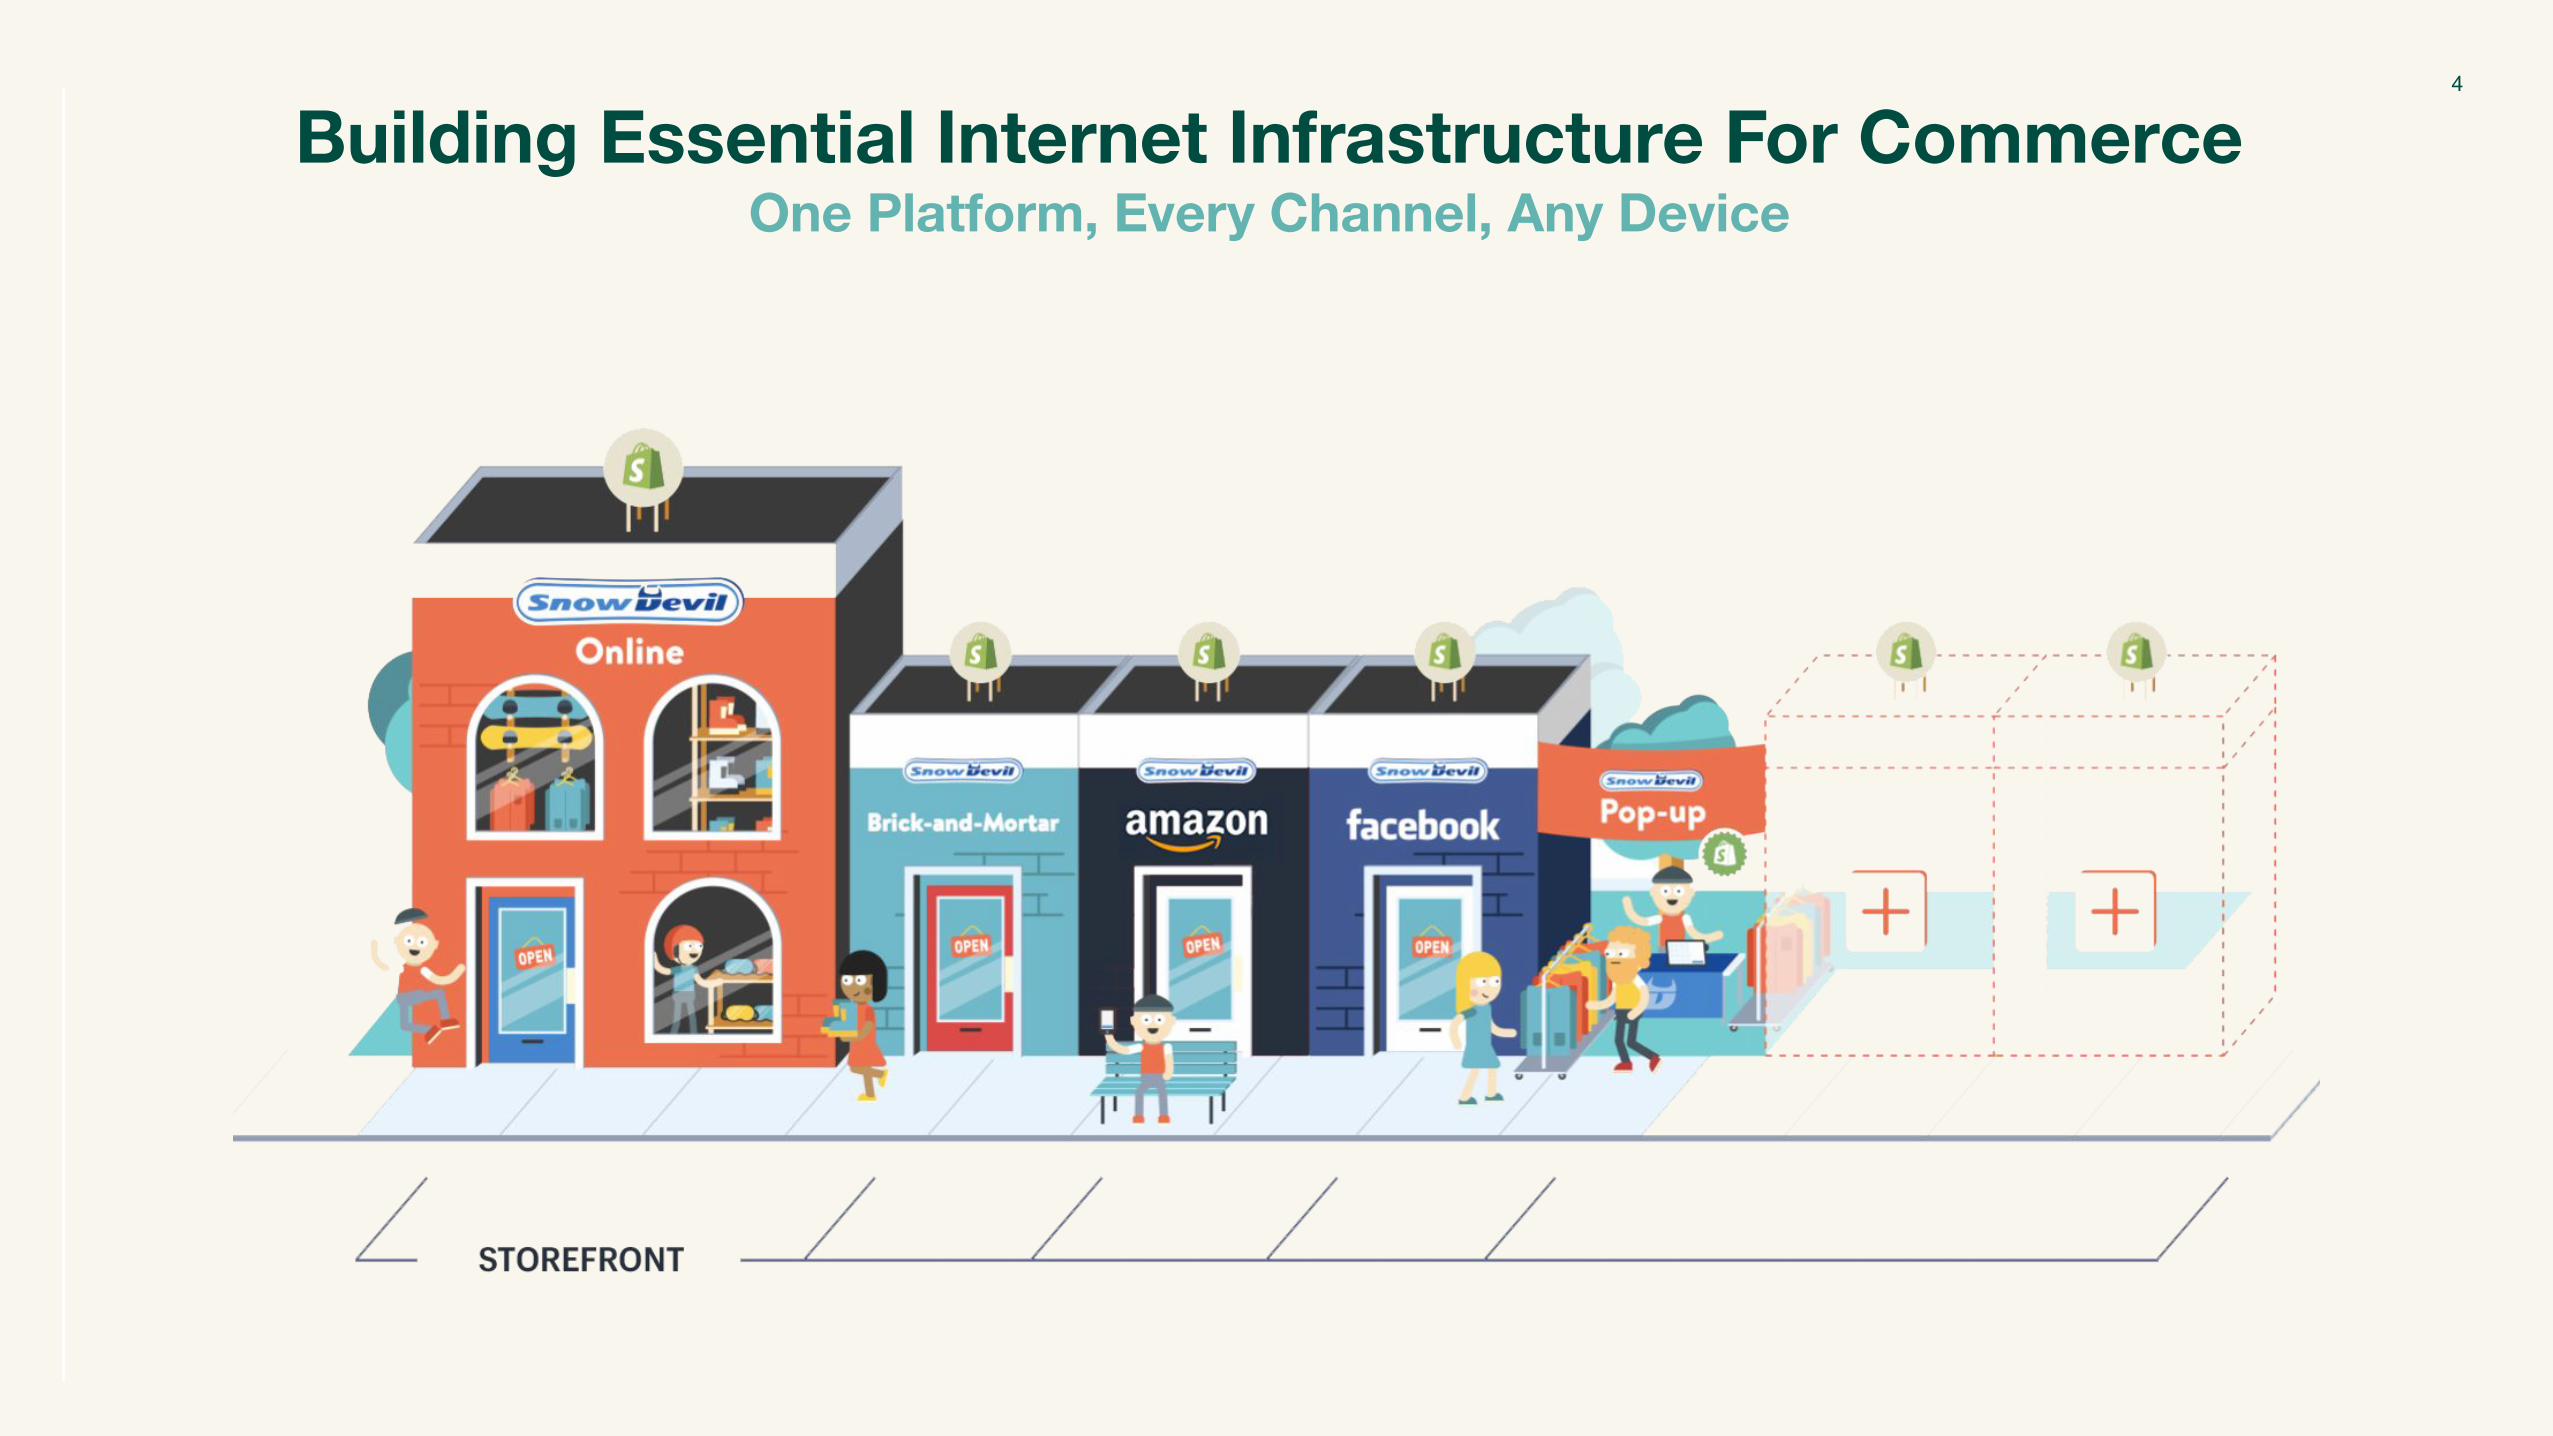
Building Essential Internet Infrastructure For CommerceOne Platform, Every Channel, Any Device

5
Inventory & Fulfillment ShippingOrder Management
AnalyticsMarketingPayments AppsCapital
Making Commerce Creative, and the Important EasySingle Integrated Back Office
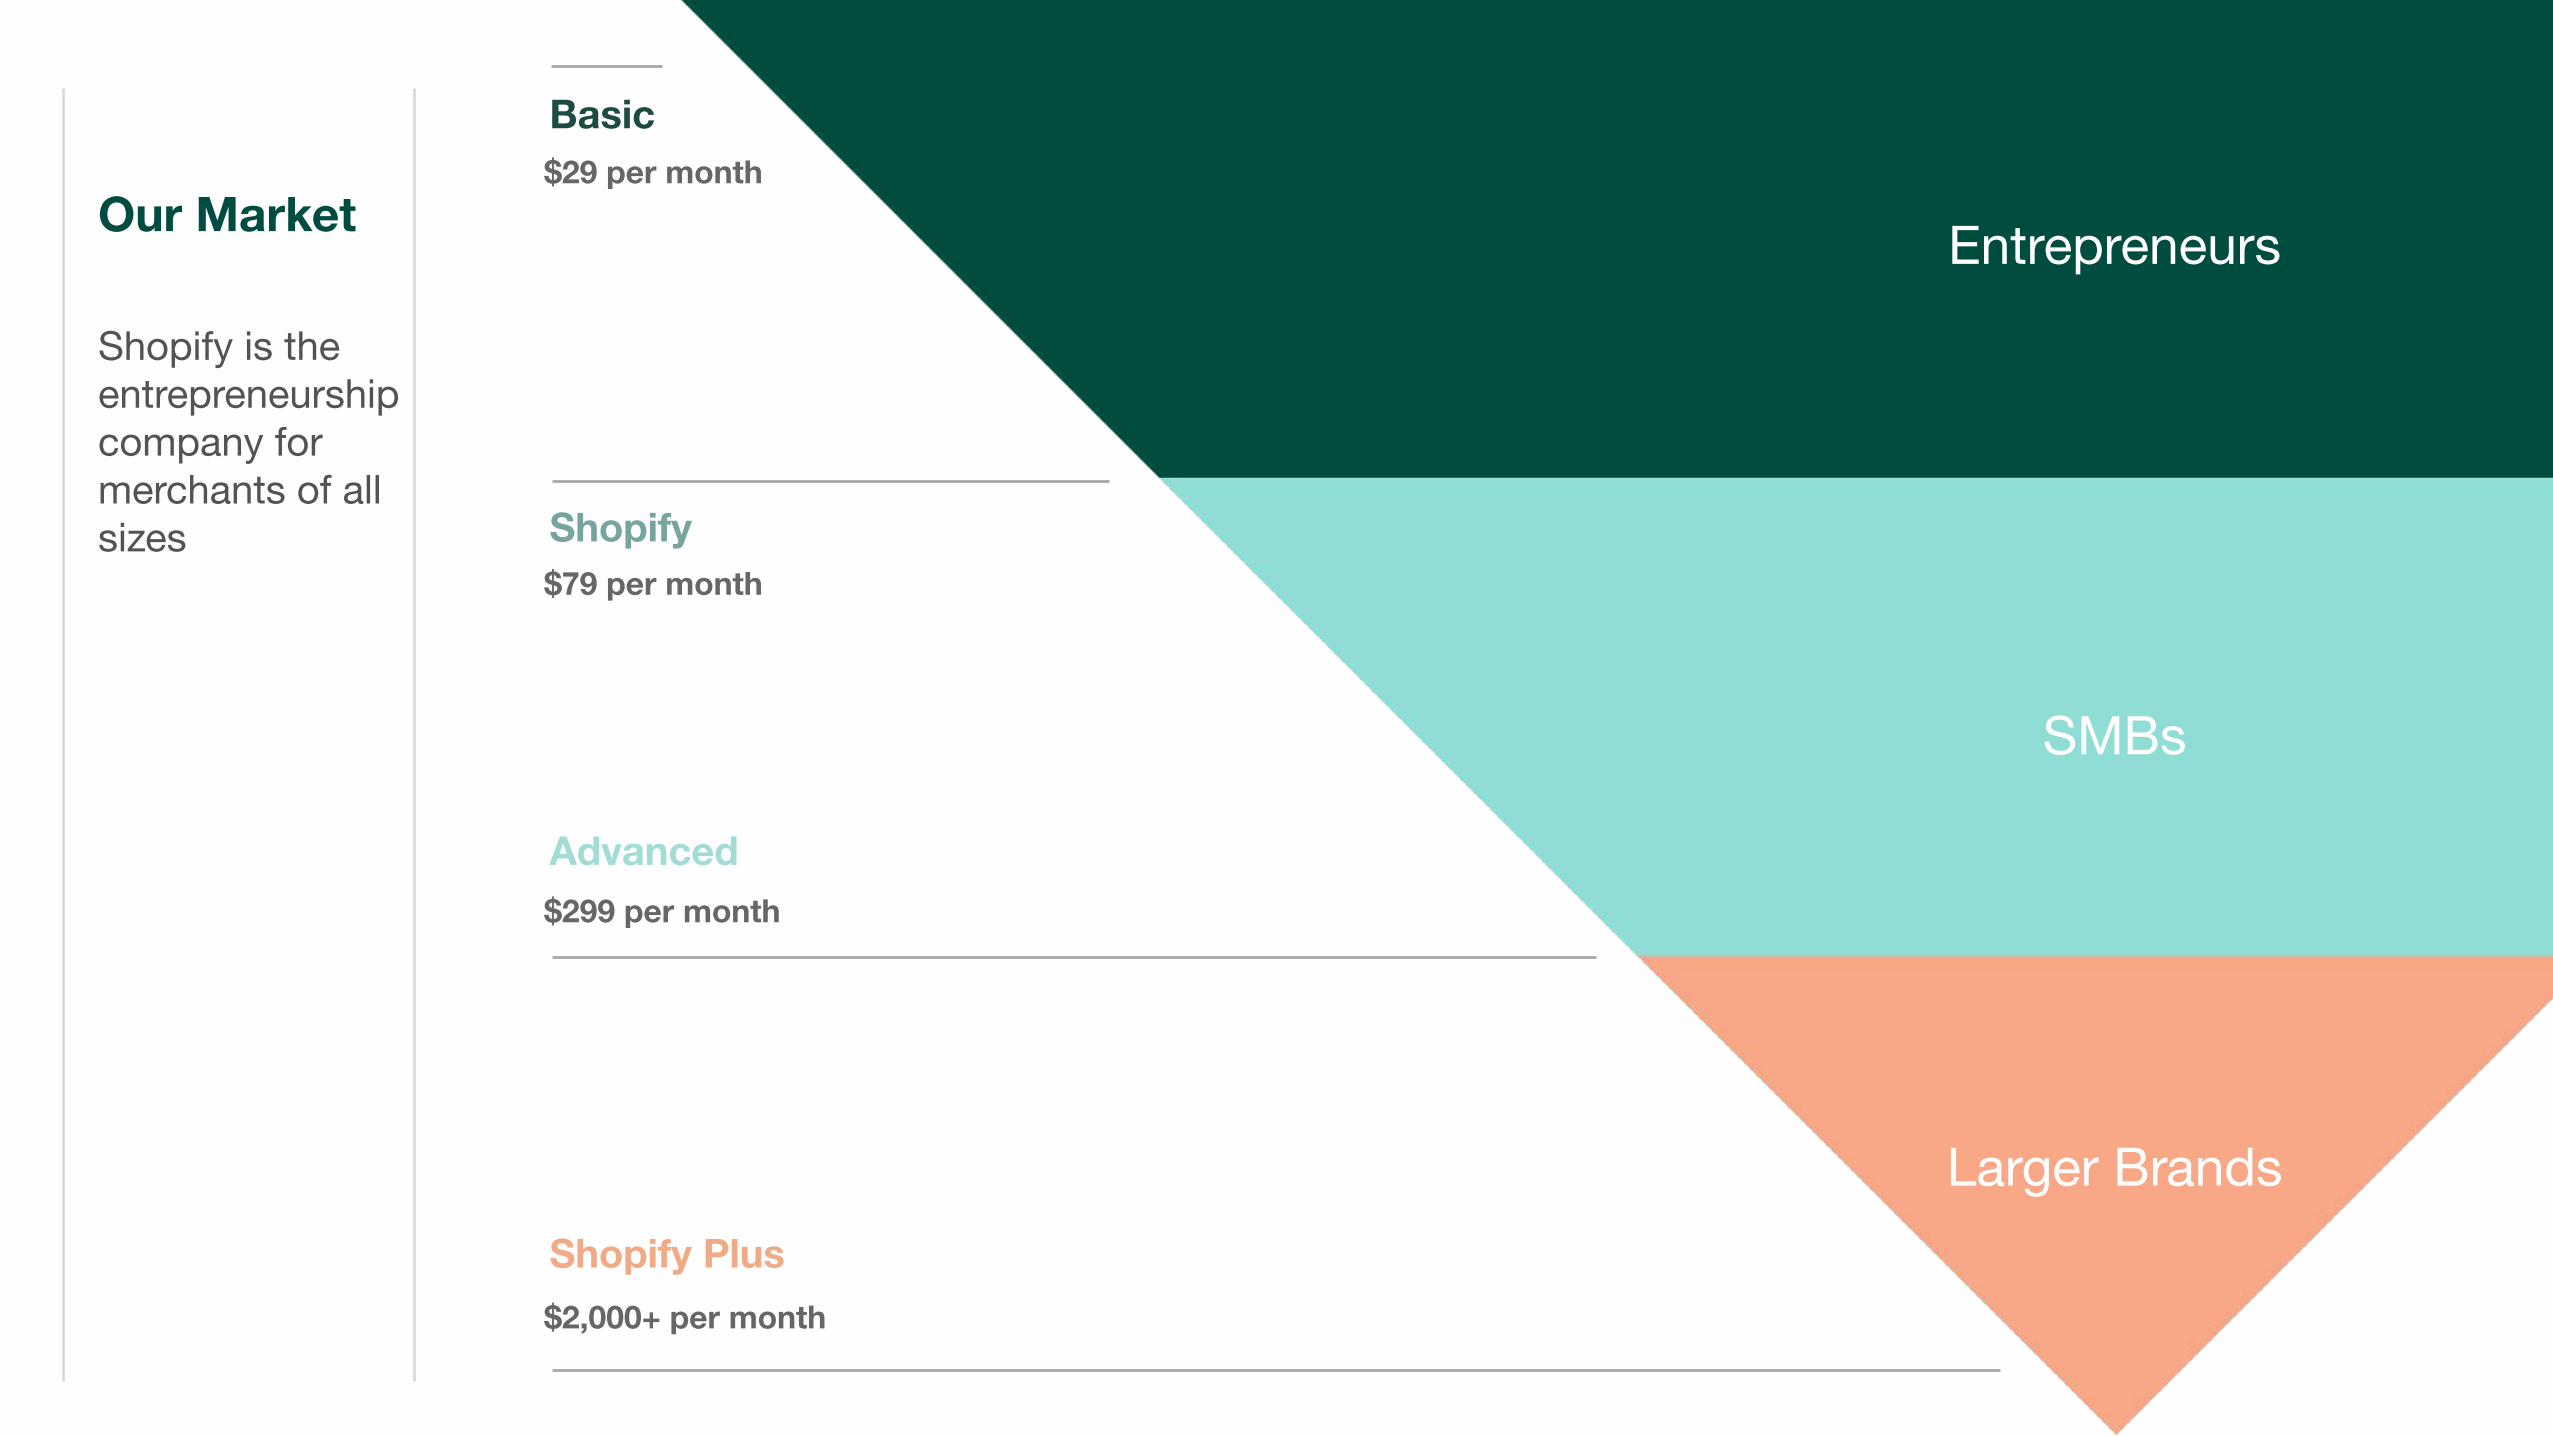
Our Market
Basic
Shopify
Advanced
Shopify Plus
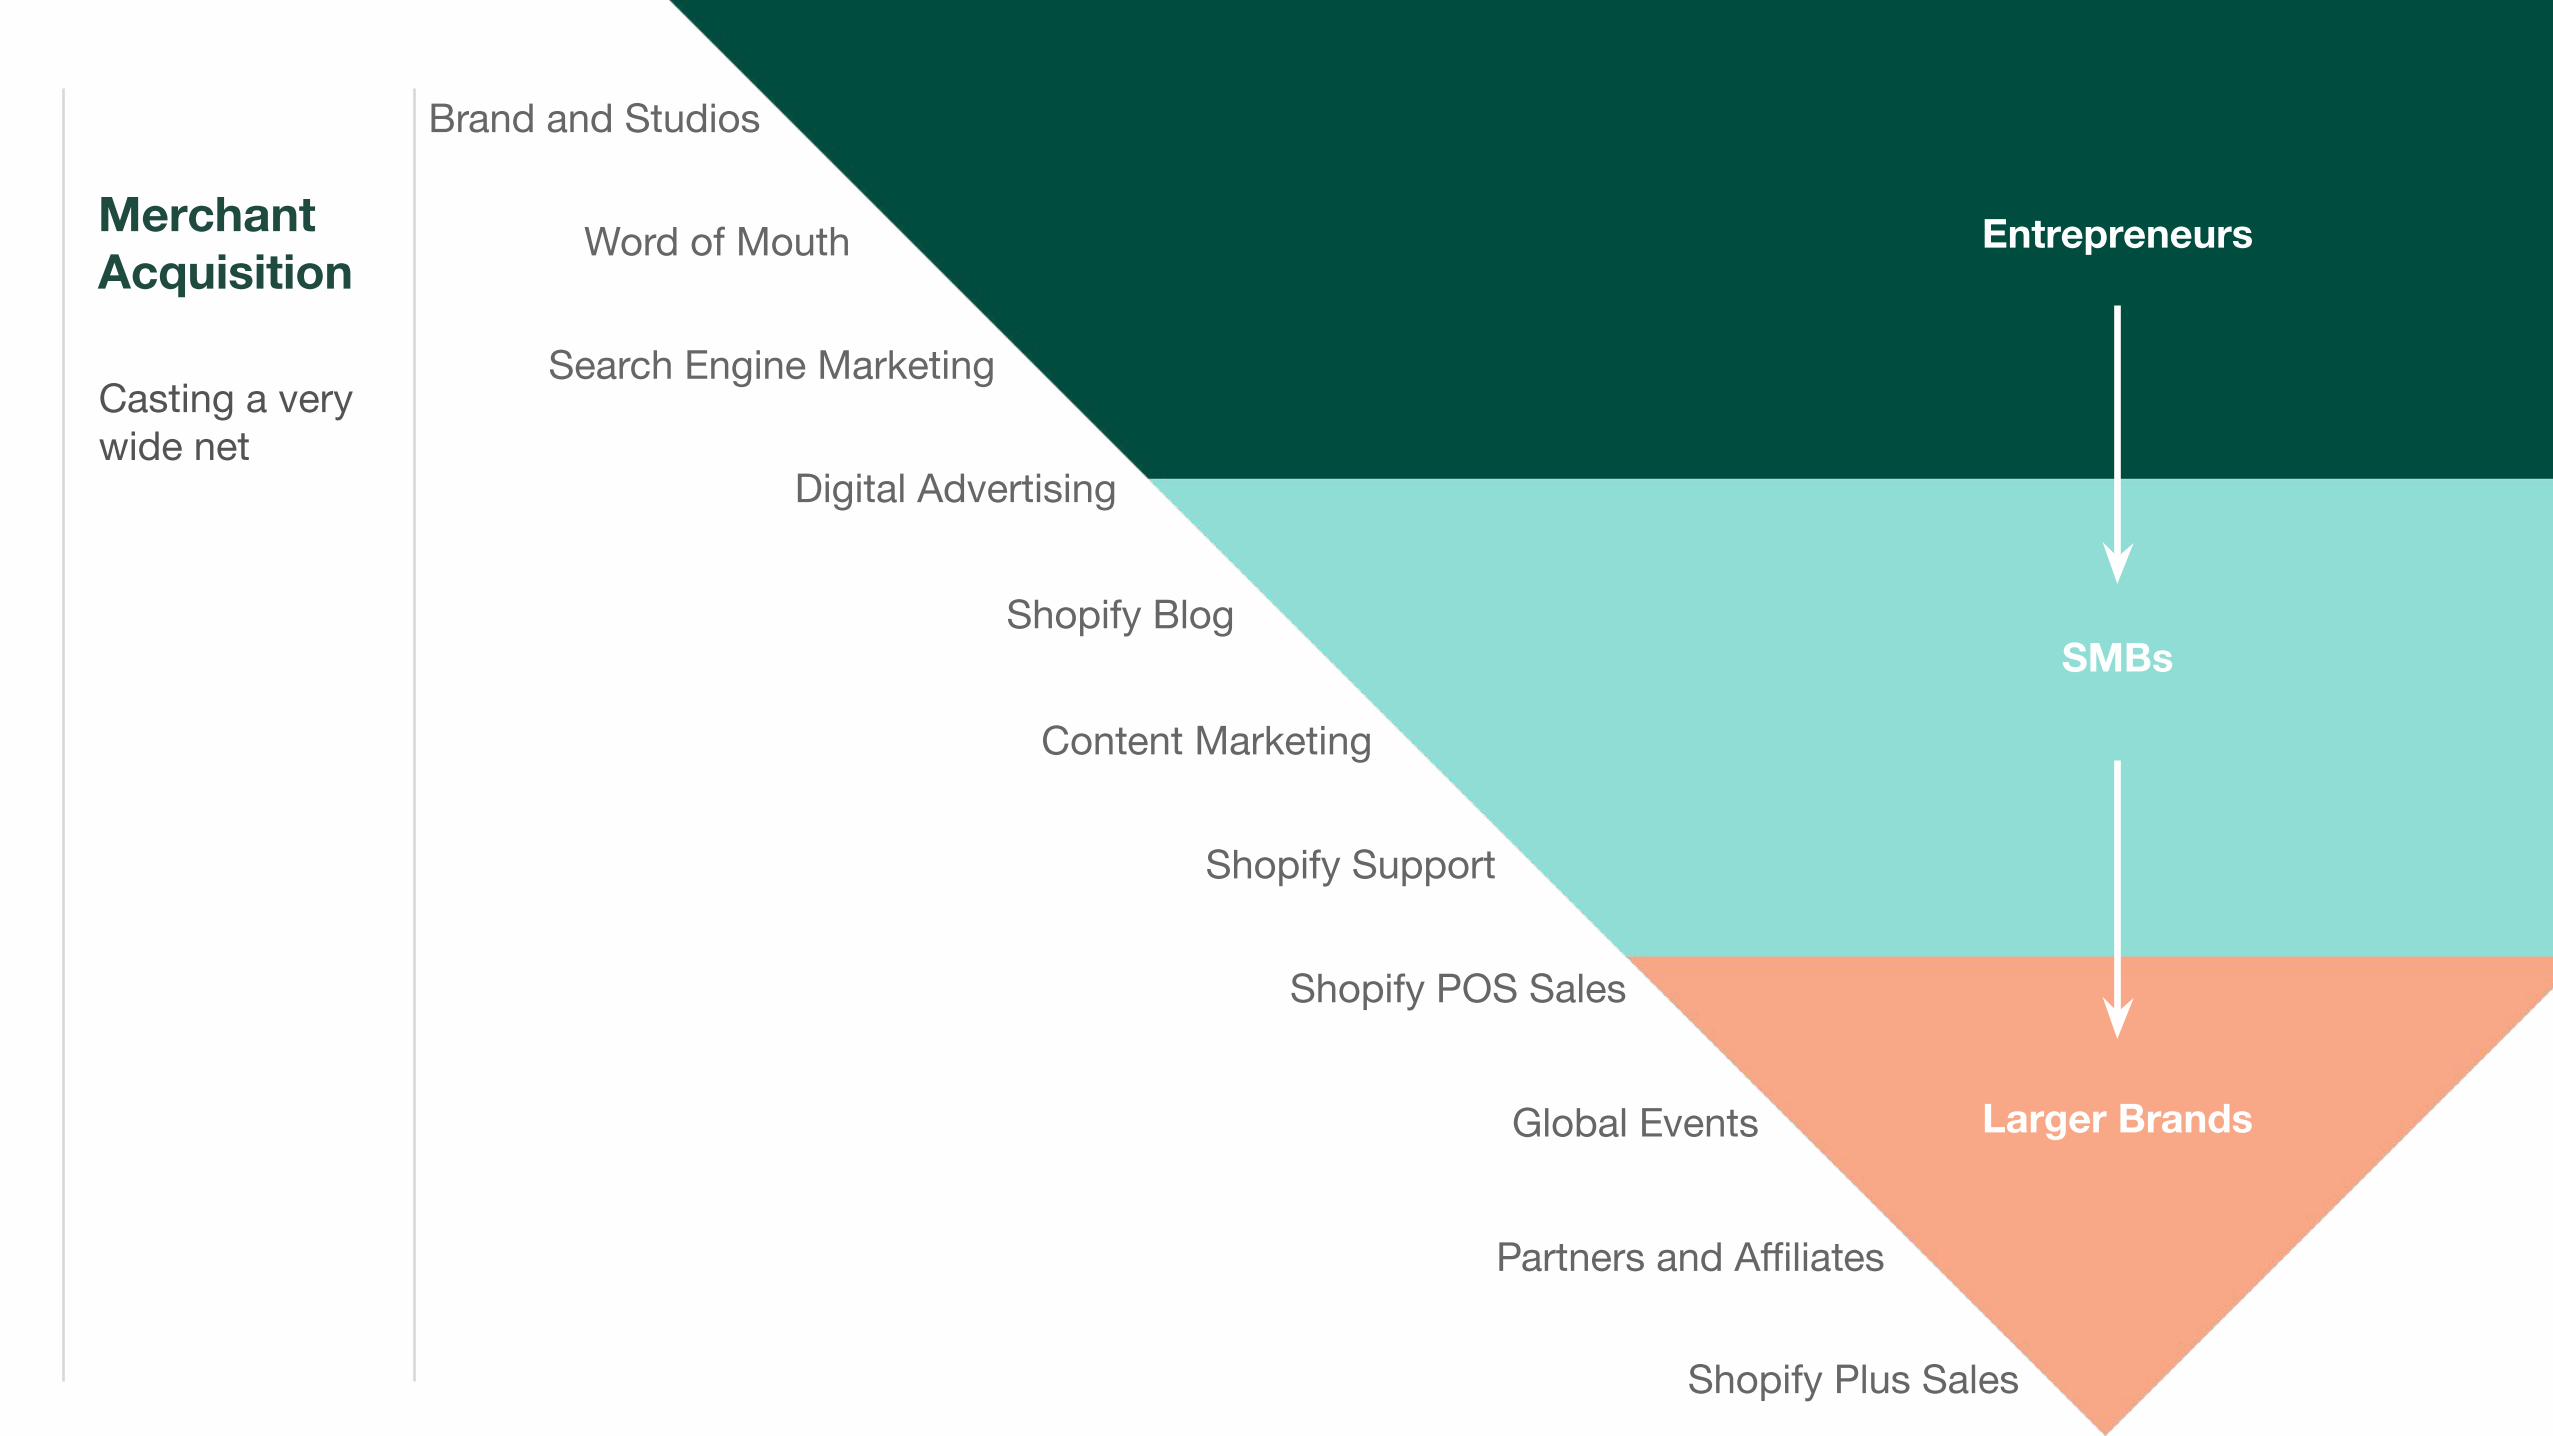
Entrepreneurs
SMBs
Larger Brands
$29 per month
$79 per month
$299 per month
$2,000+ per month
Shopify is the entrepreneurship company for merchants of all sizes
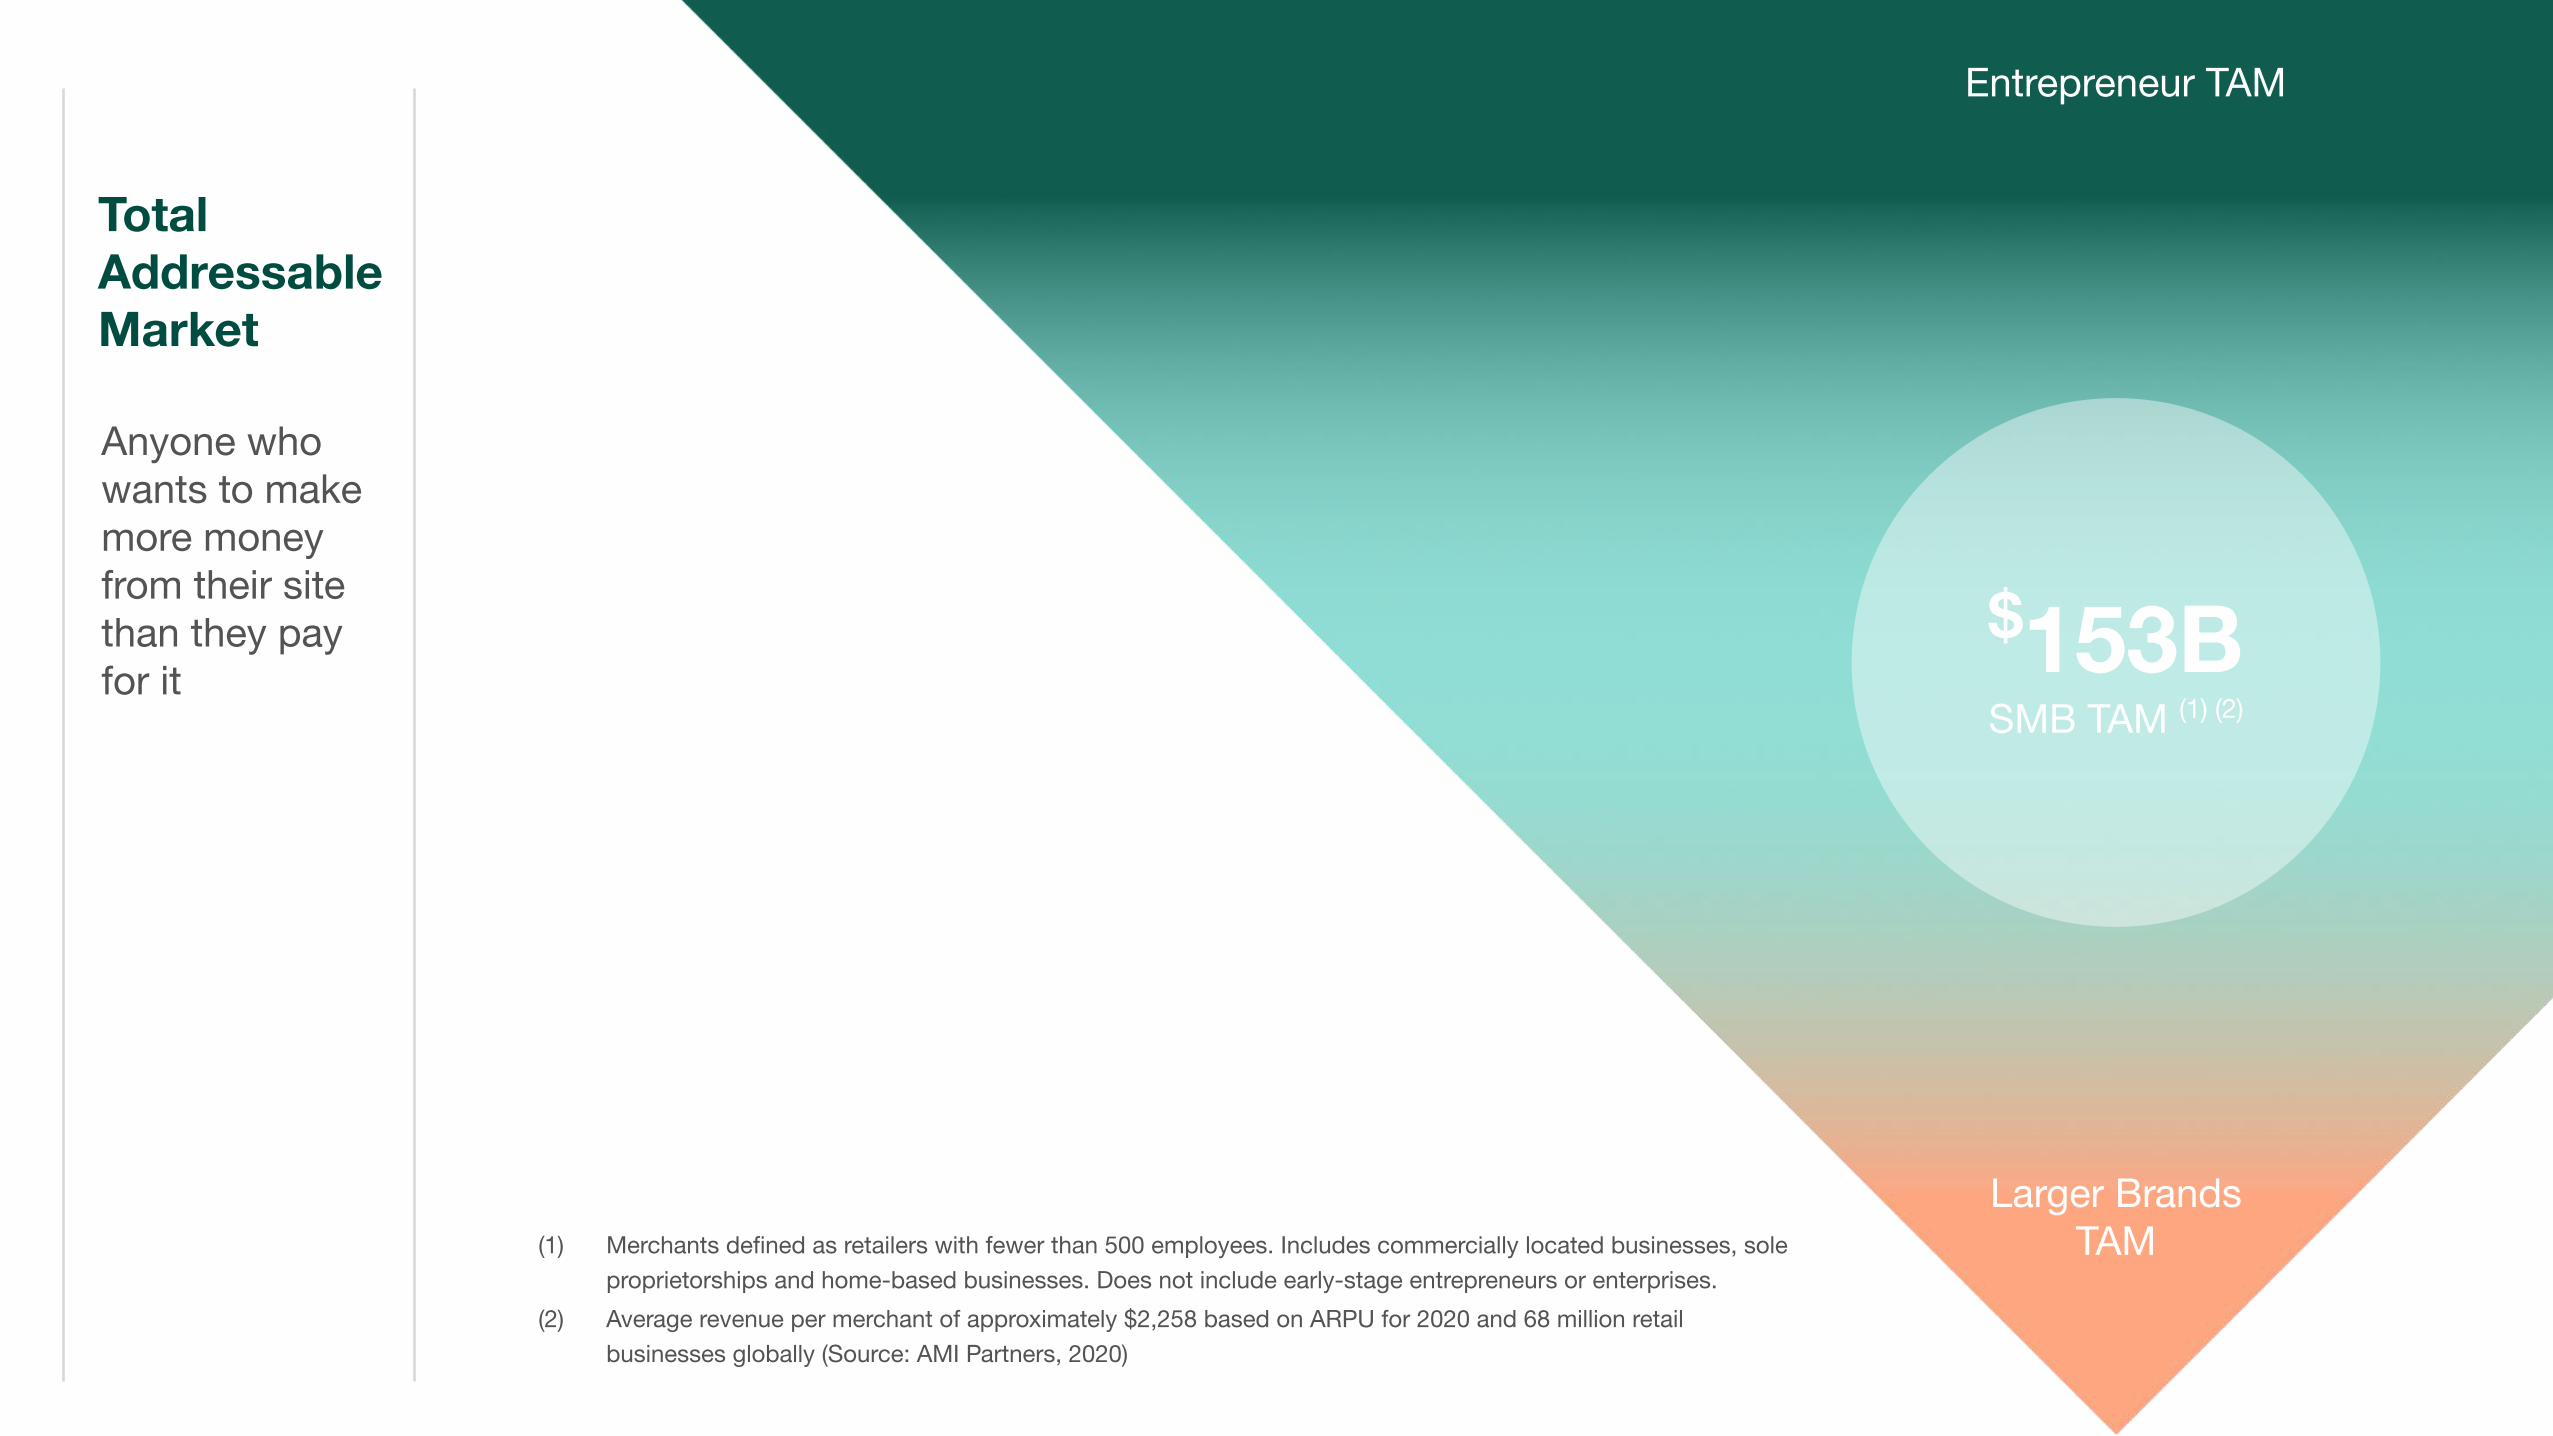
TotalAddressableMarket
(1) Merchants defined as retailers with fewer than 500 employees. Includes commercially located businesses, sole proprietorships and home-based businesses. Does not include early-stage entrepreneurs or enterprises.
(2) Average revenue per merchant of approximately $2,258 based on ARPU for 2020 and 68 million retail businesses globally (Source: AMI Partners, 2020)
Anyone who wants to make more money from their site than they pay for it
Entrepreneur TAM
Larger BrandsTAM
$153BSMB TAM (1) (2)
Entrepreneurs
SMBs
Larger Brands
Merchant Acquisition
Casting a very wide net
Shopify Plus Sales
Partners and Affiliates
Global Events
Content Marketing
Shopify Blog
Digital Advertising
Search Engine Marketing
Brand and Studios
Shopify POS Sales
Word of Mouth
Shopify Support

9
Entrepreneur
Merchant Profile
Le Cordon Bleu Paris-trained chefs, Yami and Anthony Rosemond, moved from France to America to start Pastreez, an online bakery that sells authentic french pastries. In the early stages of their business they went to farmers markets and collected emails for free macarons. Now that their focus has shifted primarily online, they leverage Shopify to remarket to the email subscribers they gained at these events.
Since joining the platform in 2017, Pastreez has taken advantage of Shopify’s suite of payment solutions to process sales on their online store including Shopify Payments, Shop Pay, and Shop Pay Installments. They’ve also utilised our Local Pickup functionality to allow customers to buy online and pickup at their brick-and-mortar location in California.

10
SMB
Merchant Profile
Sarah Resnick’s childhood passion for fiber crafts led her to start Gist Yarn, an online business selling materials and yarns for weaving. When Sarah launched Gist Yarn in 2017, her initial goal was to find beautiful materials and sell them to makers like herself. Since then her business has expanded into making her own line of yarn and producing a podcast to build a community for makers and weavers.
Gist Yarn leverages Shopify’s omnichannel capabilities to drive traffic from social channels to their online store. They also utilise Shopify’s suite of payment solutions to process sales on their website including Shopify Payments, Shop Pay, and Shop Pay Installments.
11
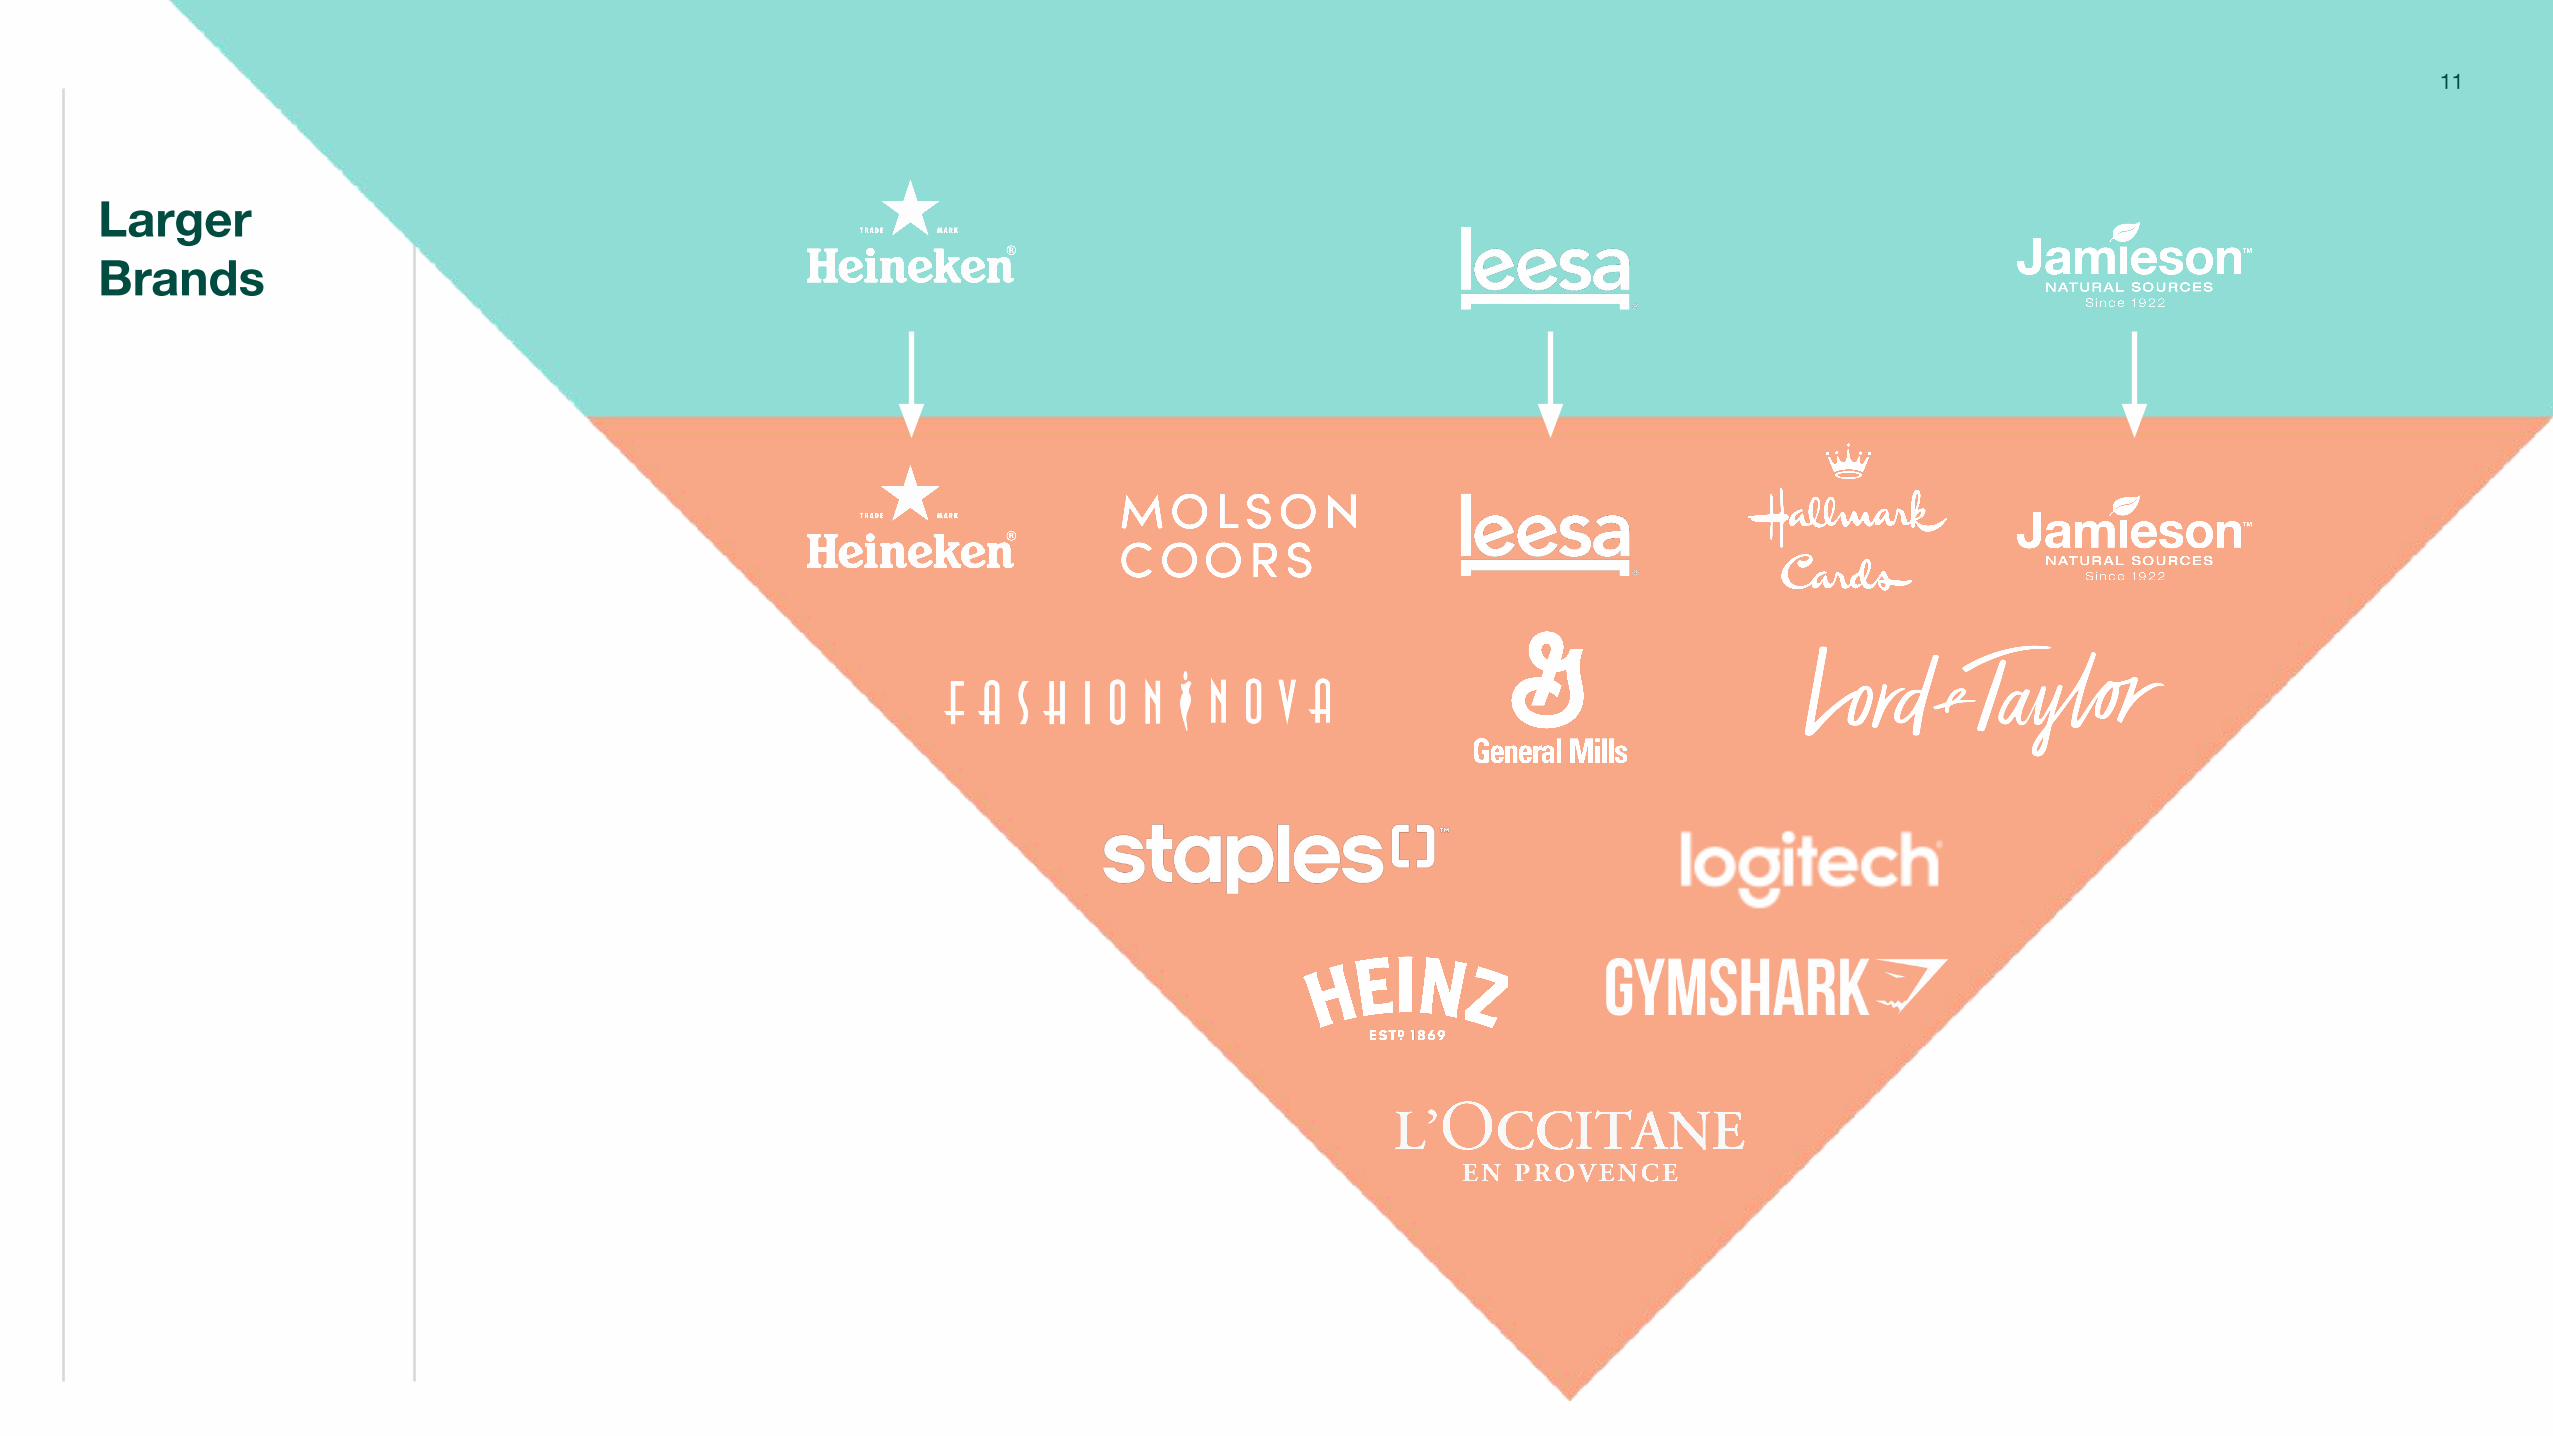
Larger Brands
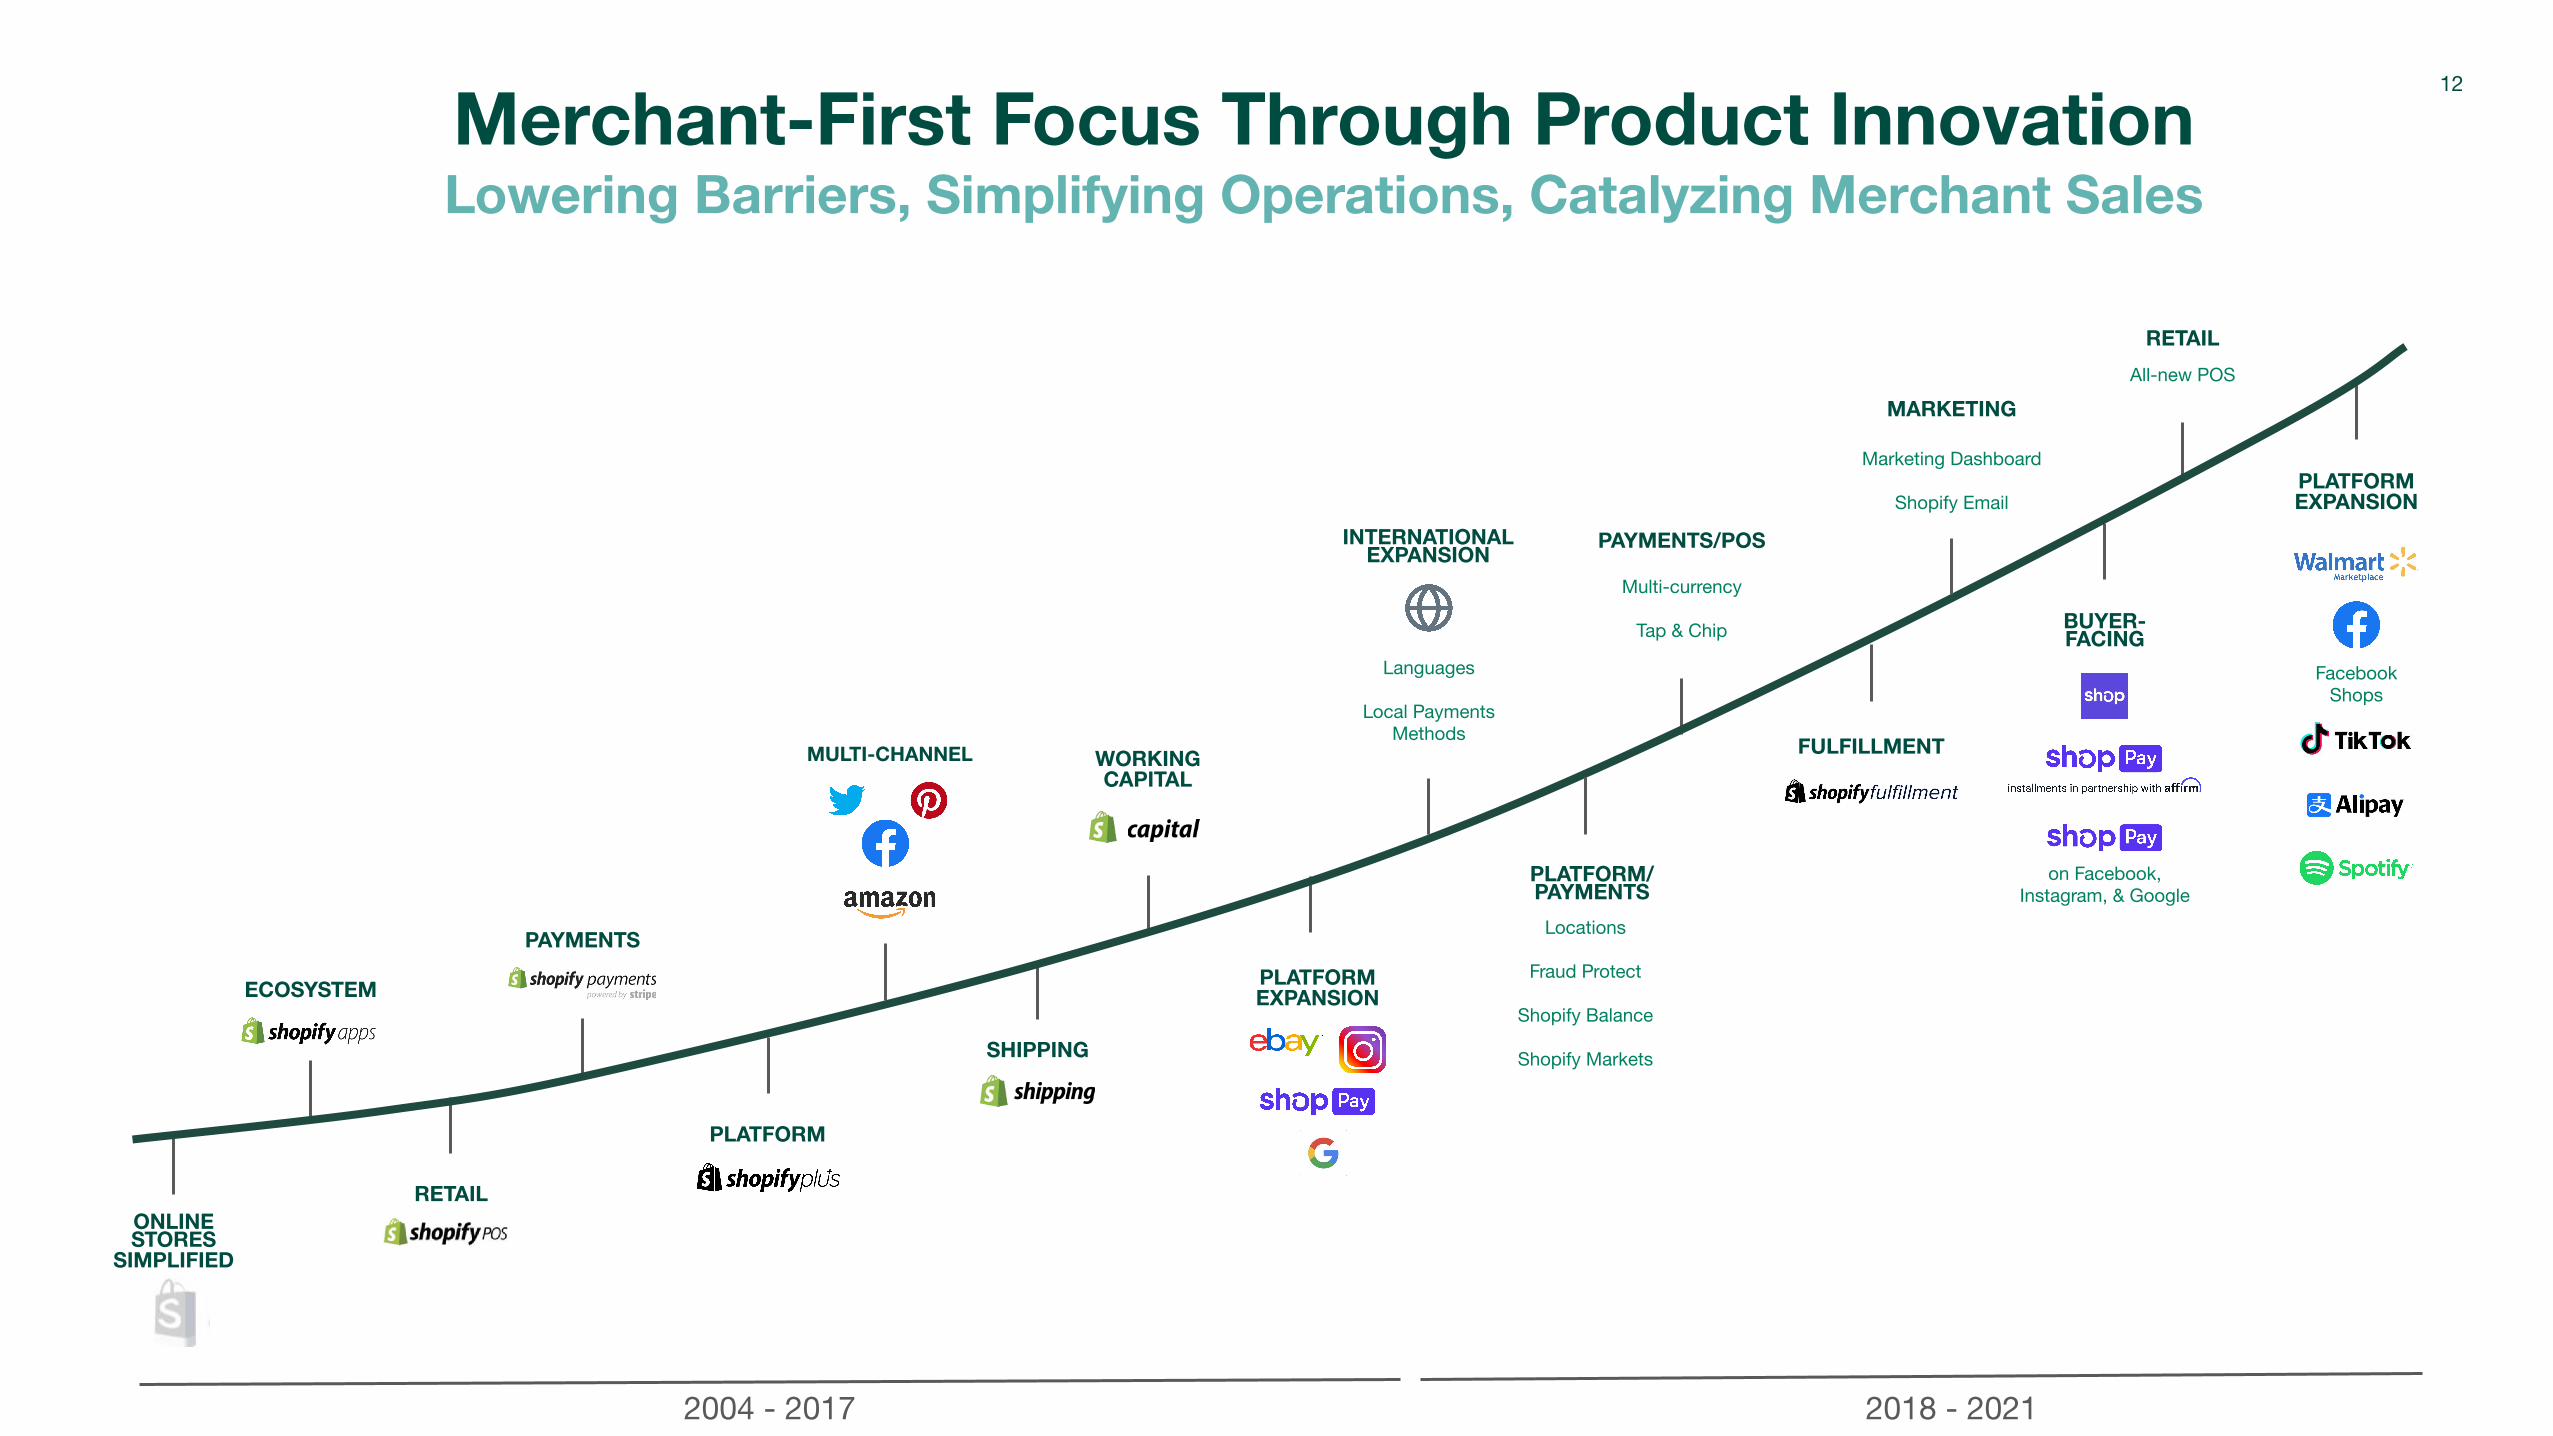
Merchant-First Focus Through Product InnovationLowering Barriers, Simplifying Operations, Catalyzing Merchant Sales
ONLINE STORES
SIMPLIFIED
ECOSYSTEM
RETAIL
PAYMENTS
PLATFORM
MULTI-CHANNEL
SHIPPING
WORKINGCAPITAL
PLATFORMEXPANSION
Languages
Local Payments Methods
INTERNATIONAL EXPANSION
PLATFORM/ PAYMENTS
Locations
Fraud Protect
Shopify Balance
Shopify Markets
Multi-currency
Tap & Chip
PAYMENTS/POS
FULFILLMENT
Marketing Dashboard
Shopify Email
MARKETING
BUYER-FACING
All-new POS
RETAIL
2004 - 2017 2018 - 2021
PLATFORMEXPANSION
Facebook Shops
12
on Facebook, Instagram, & Google
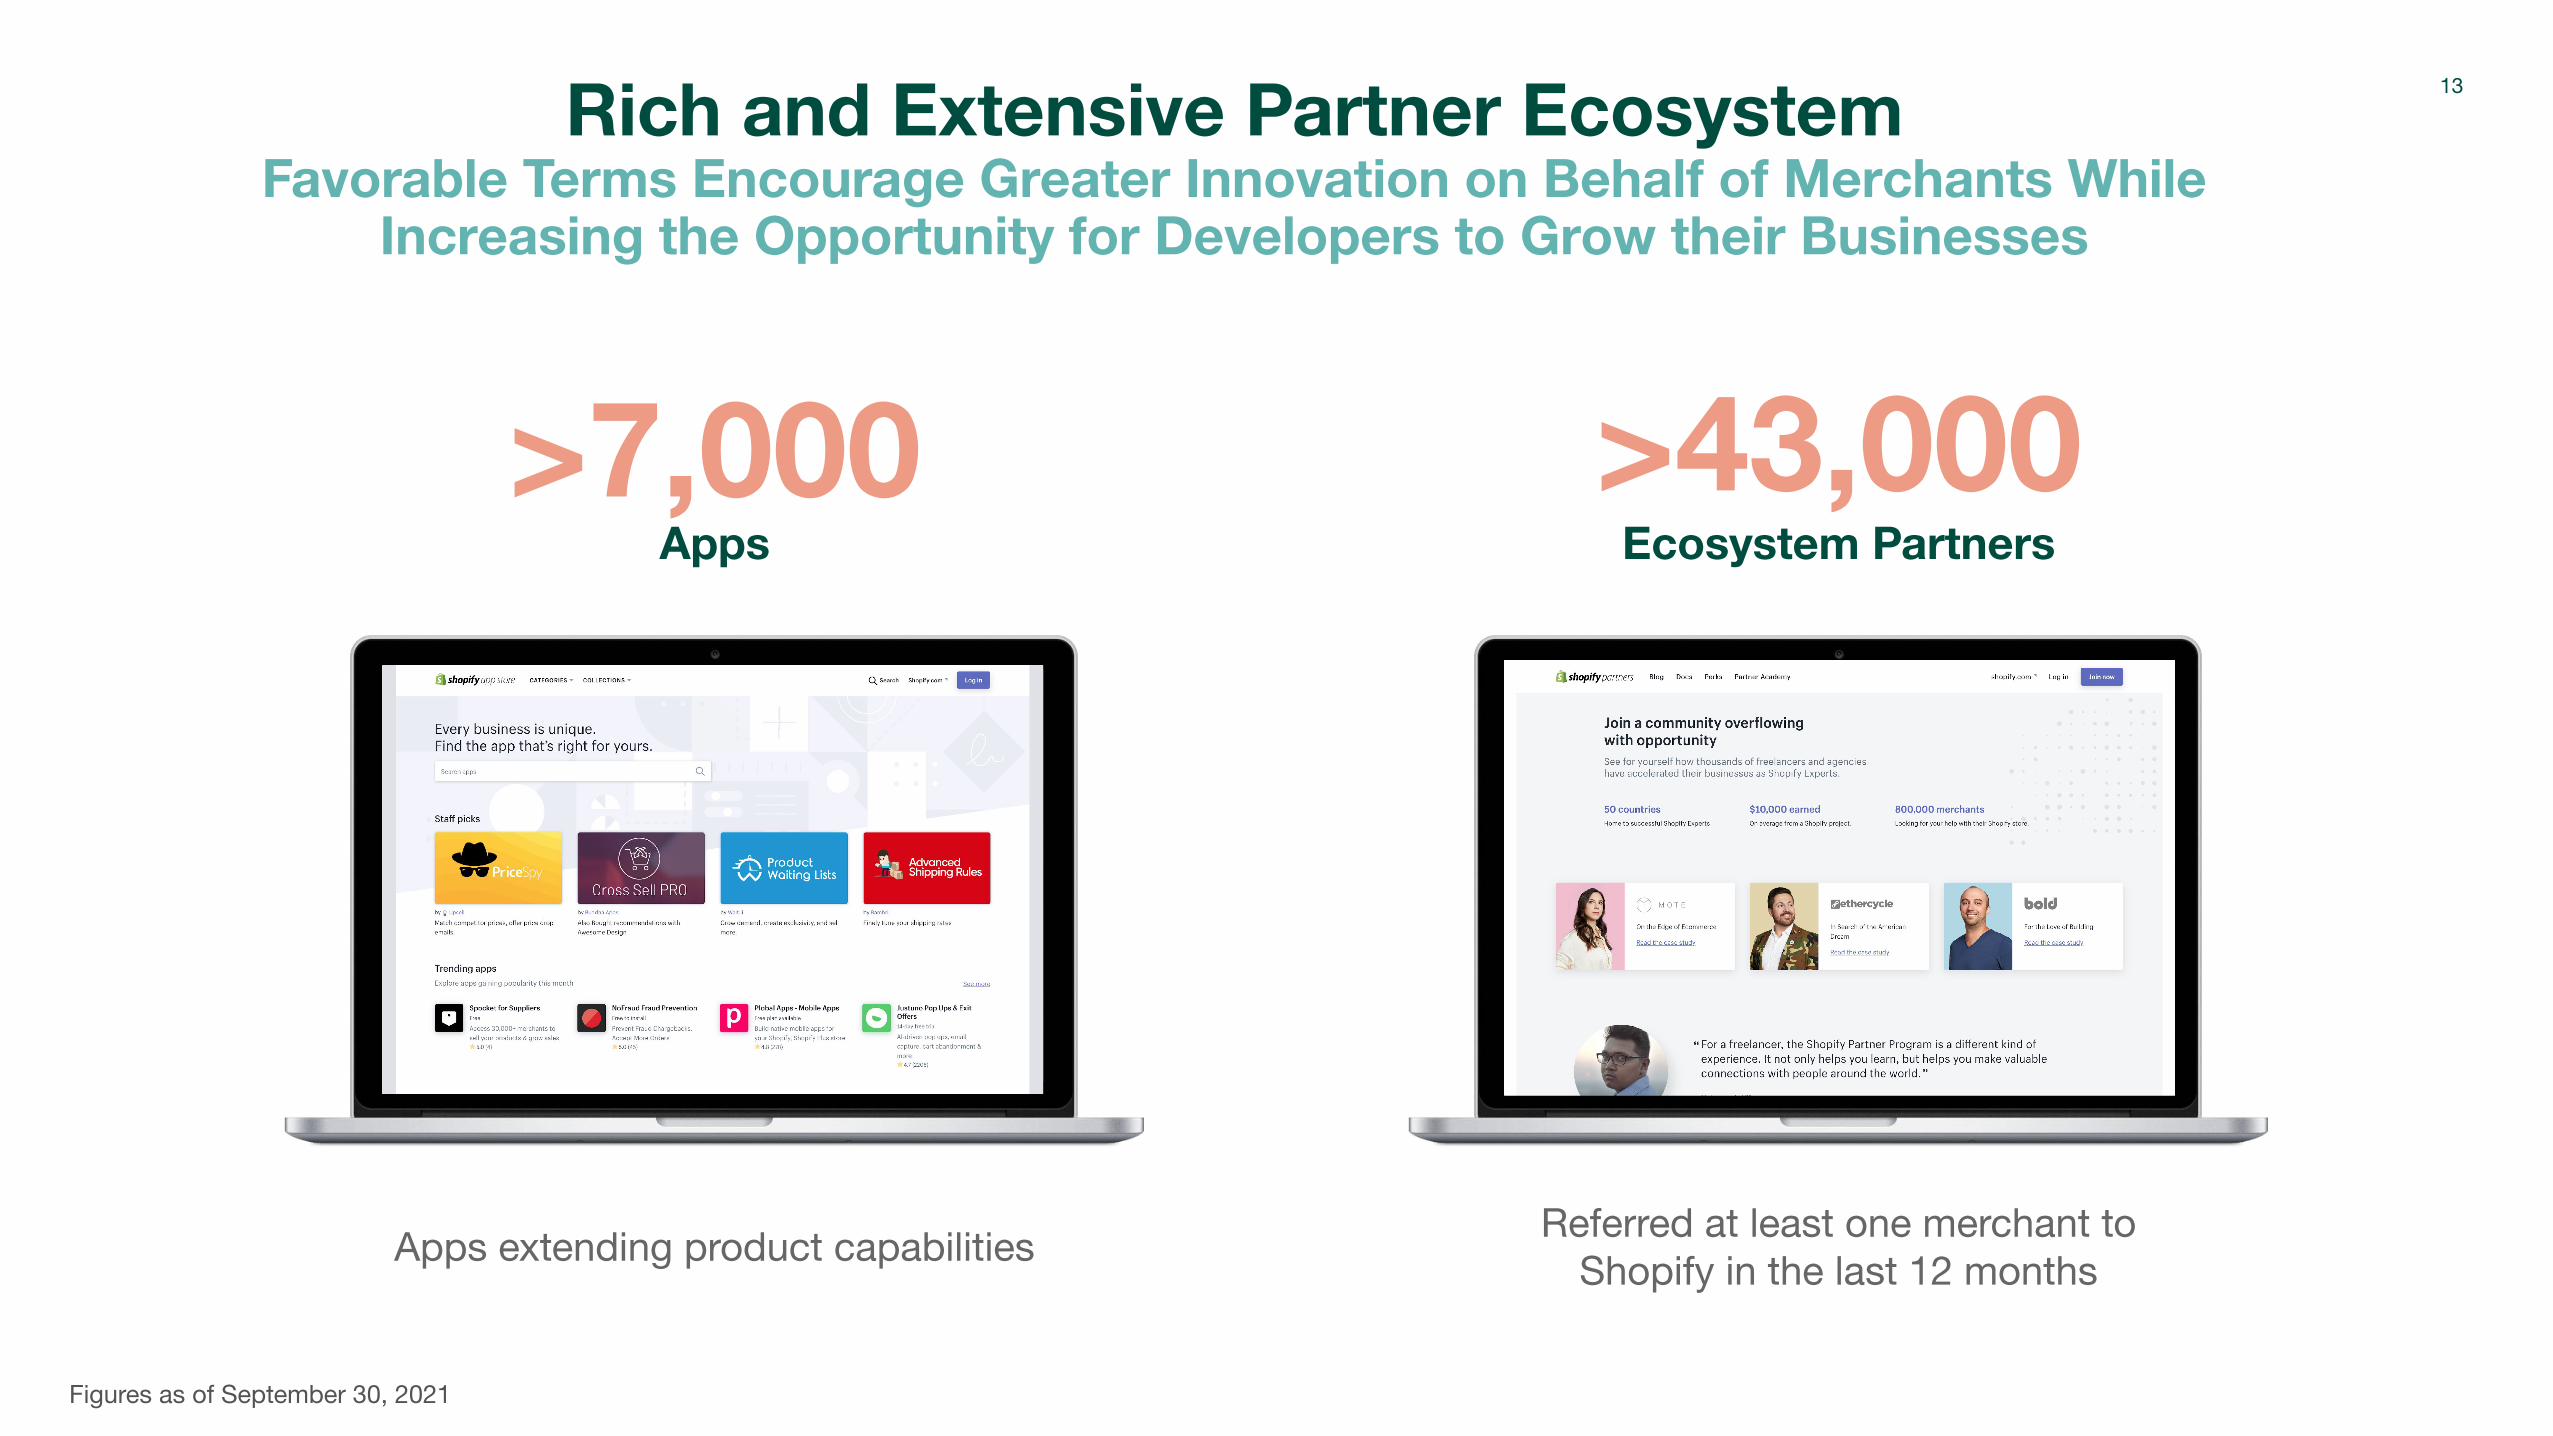
Rich and Extensive Partner EcosystemFavorable Terms Encourage Greater Innovation on Behalf of Merchants While
Increasing the Opportunity for Developers to Grow their Businesses
>7,000
Apps extending product capabilities Referred at least one merchant to Shopify in the last 12 months
>43,000Apps Ecosystem Partners
13
Figures as of September 30, 2021
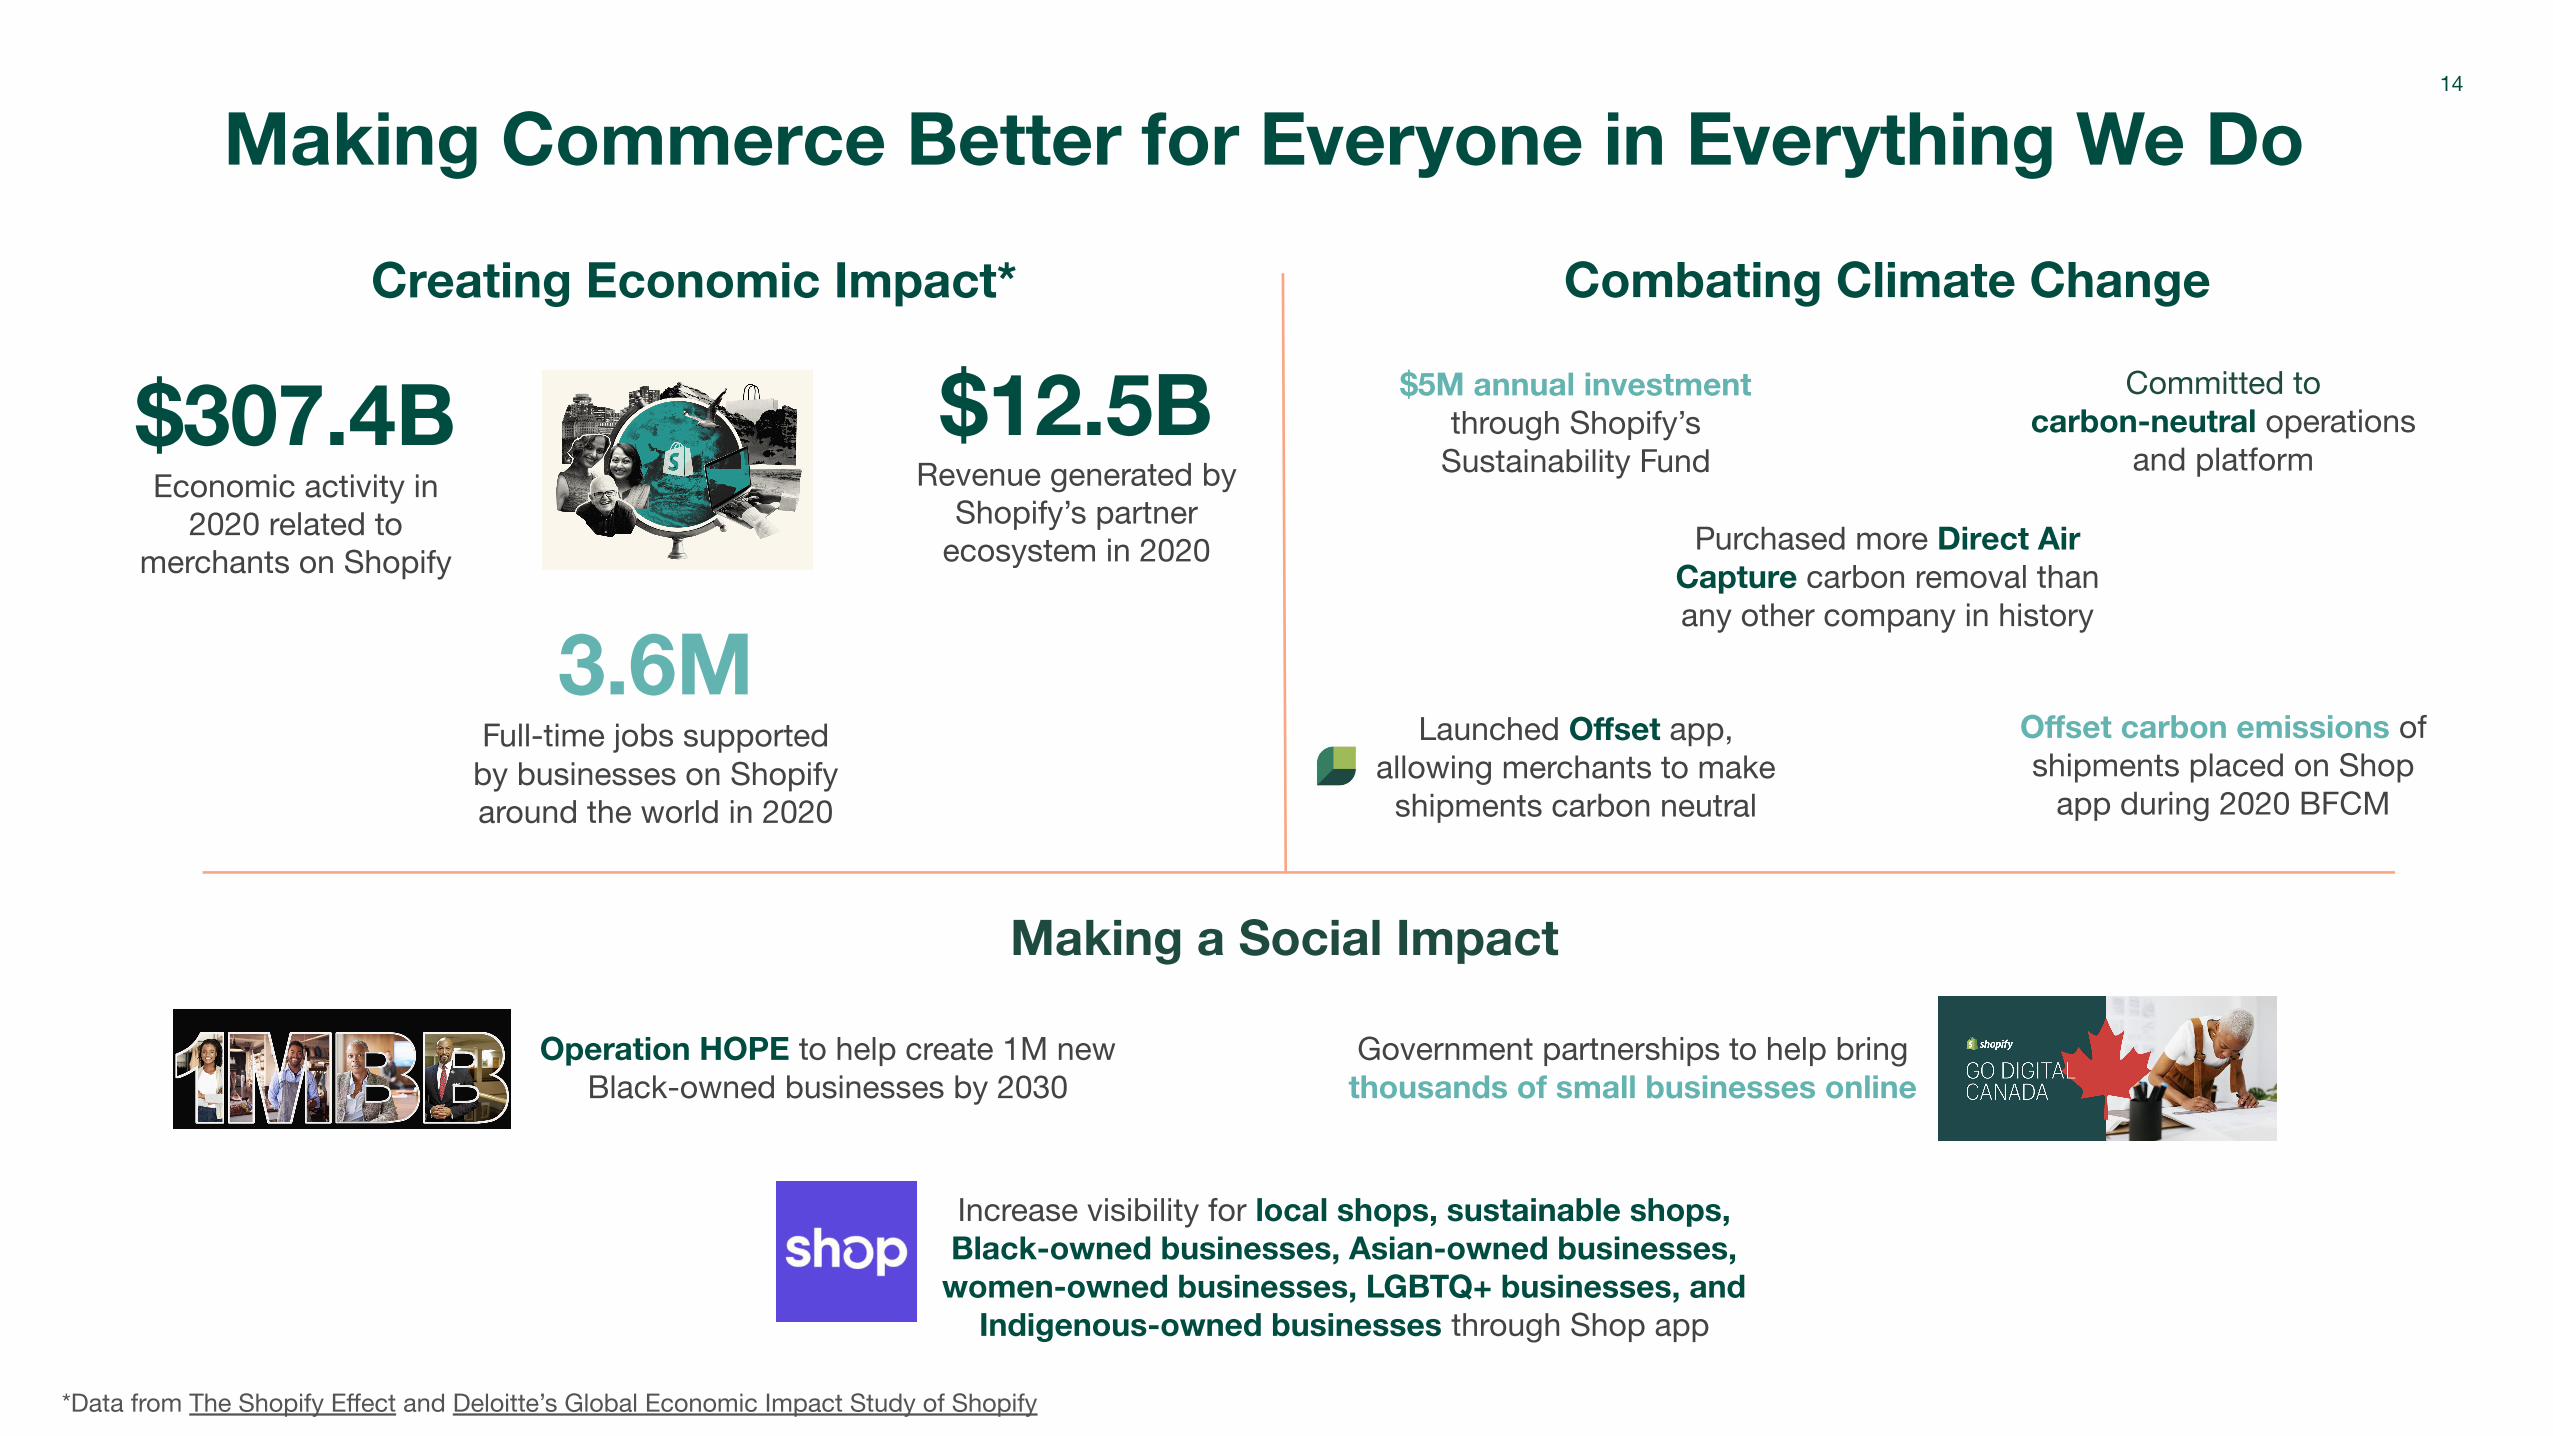
Making Commerce Better for Everyone in Everything We Do 14
$307.4B Economic activity in
2020 related to merchants on Shopify
Creating Economic Impact* Combating Climate Change
Making a Social Impact
3.6MFull-time jobs supported
by businesses on Shopify around the world in 2020
$12.5B Revenue generated by
Shopify’s partner ecosystem in 2020
Committed to carbon-neutral operations
and platform
*Data from The Shopify Effect and Deloitte’s Global Economic Impact Study of Shopify
$5M annual investment through Shopify’s
Sustainability Fund
Launched Offset app, allowing merchants to make
shipments carbon neutral
Offset carbon emissions of shipments placed on Shop
app during 2020 BFCM
Operation HOPE to help create 1M new Black-owned businesses by 2030
Government partnerships to help bring thousands of small businesses online
Increase visibility for local shops, sustainable shops, Black-owned businesses, Asian-owned businesses,
women-owned businesses, LGBTQ+ businesses, and Indigenous-owned businesses through Shop app
Purchased more Direct Air Capture carbon removal than any other company in history

Growth-Minded Culture
Recruit talented, deeply caring individuals
Digital by Design allows employees to easily work almost anywhere in the world
Invest heavily in personal growth and development
Global reach

The Numbers

Strong & Competitive Market PositionShare of U.S. Retail Ecommerce Sales 2020
Source: eMarketer, October 2020, Shopify* Market share based on Shopify’s 2020 US GMV (excluding merchant sales made through POS)
17
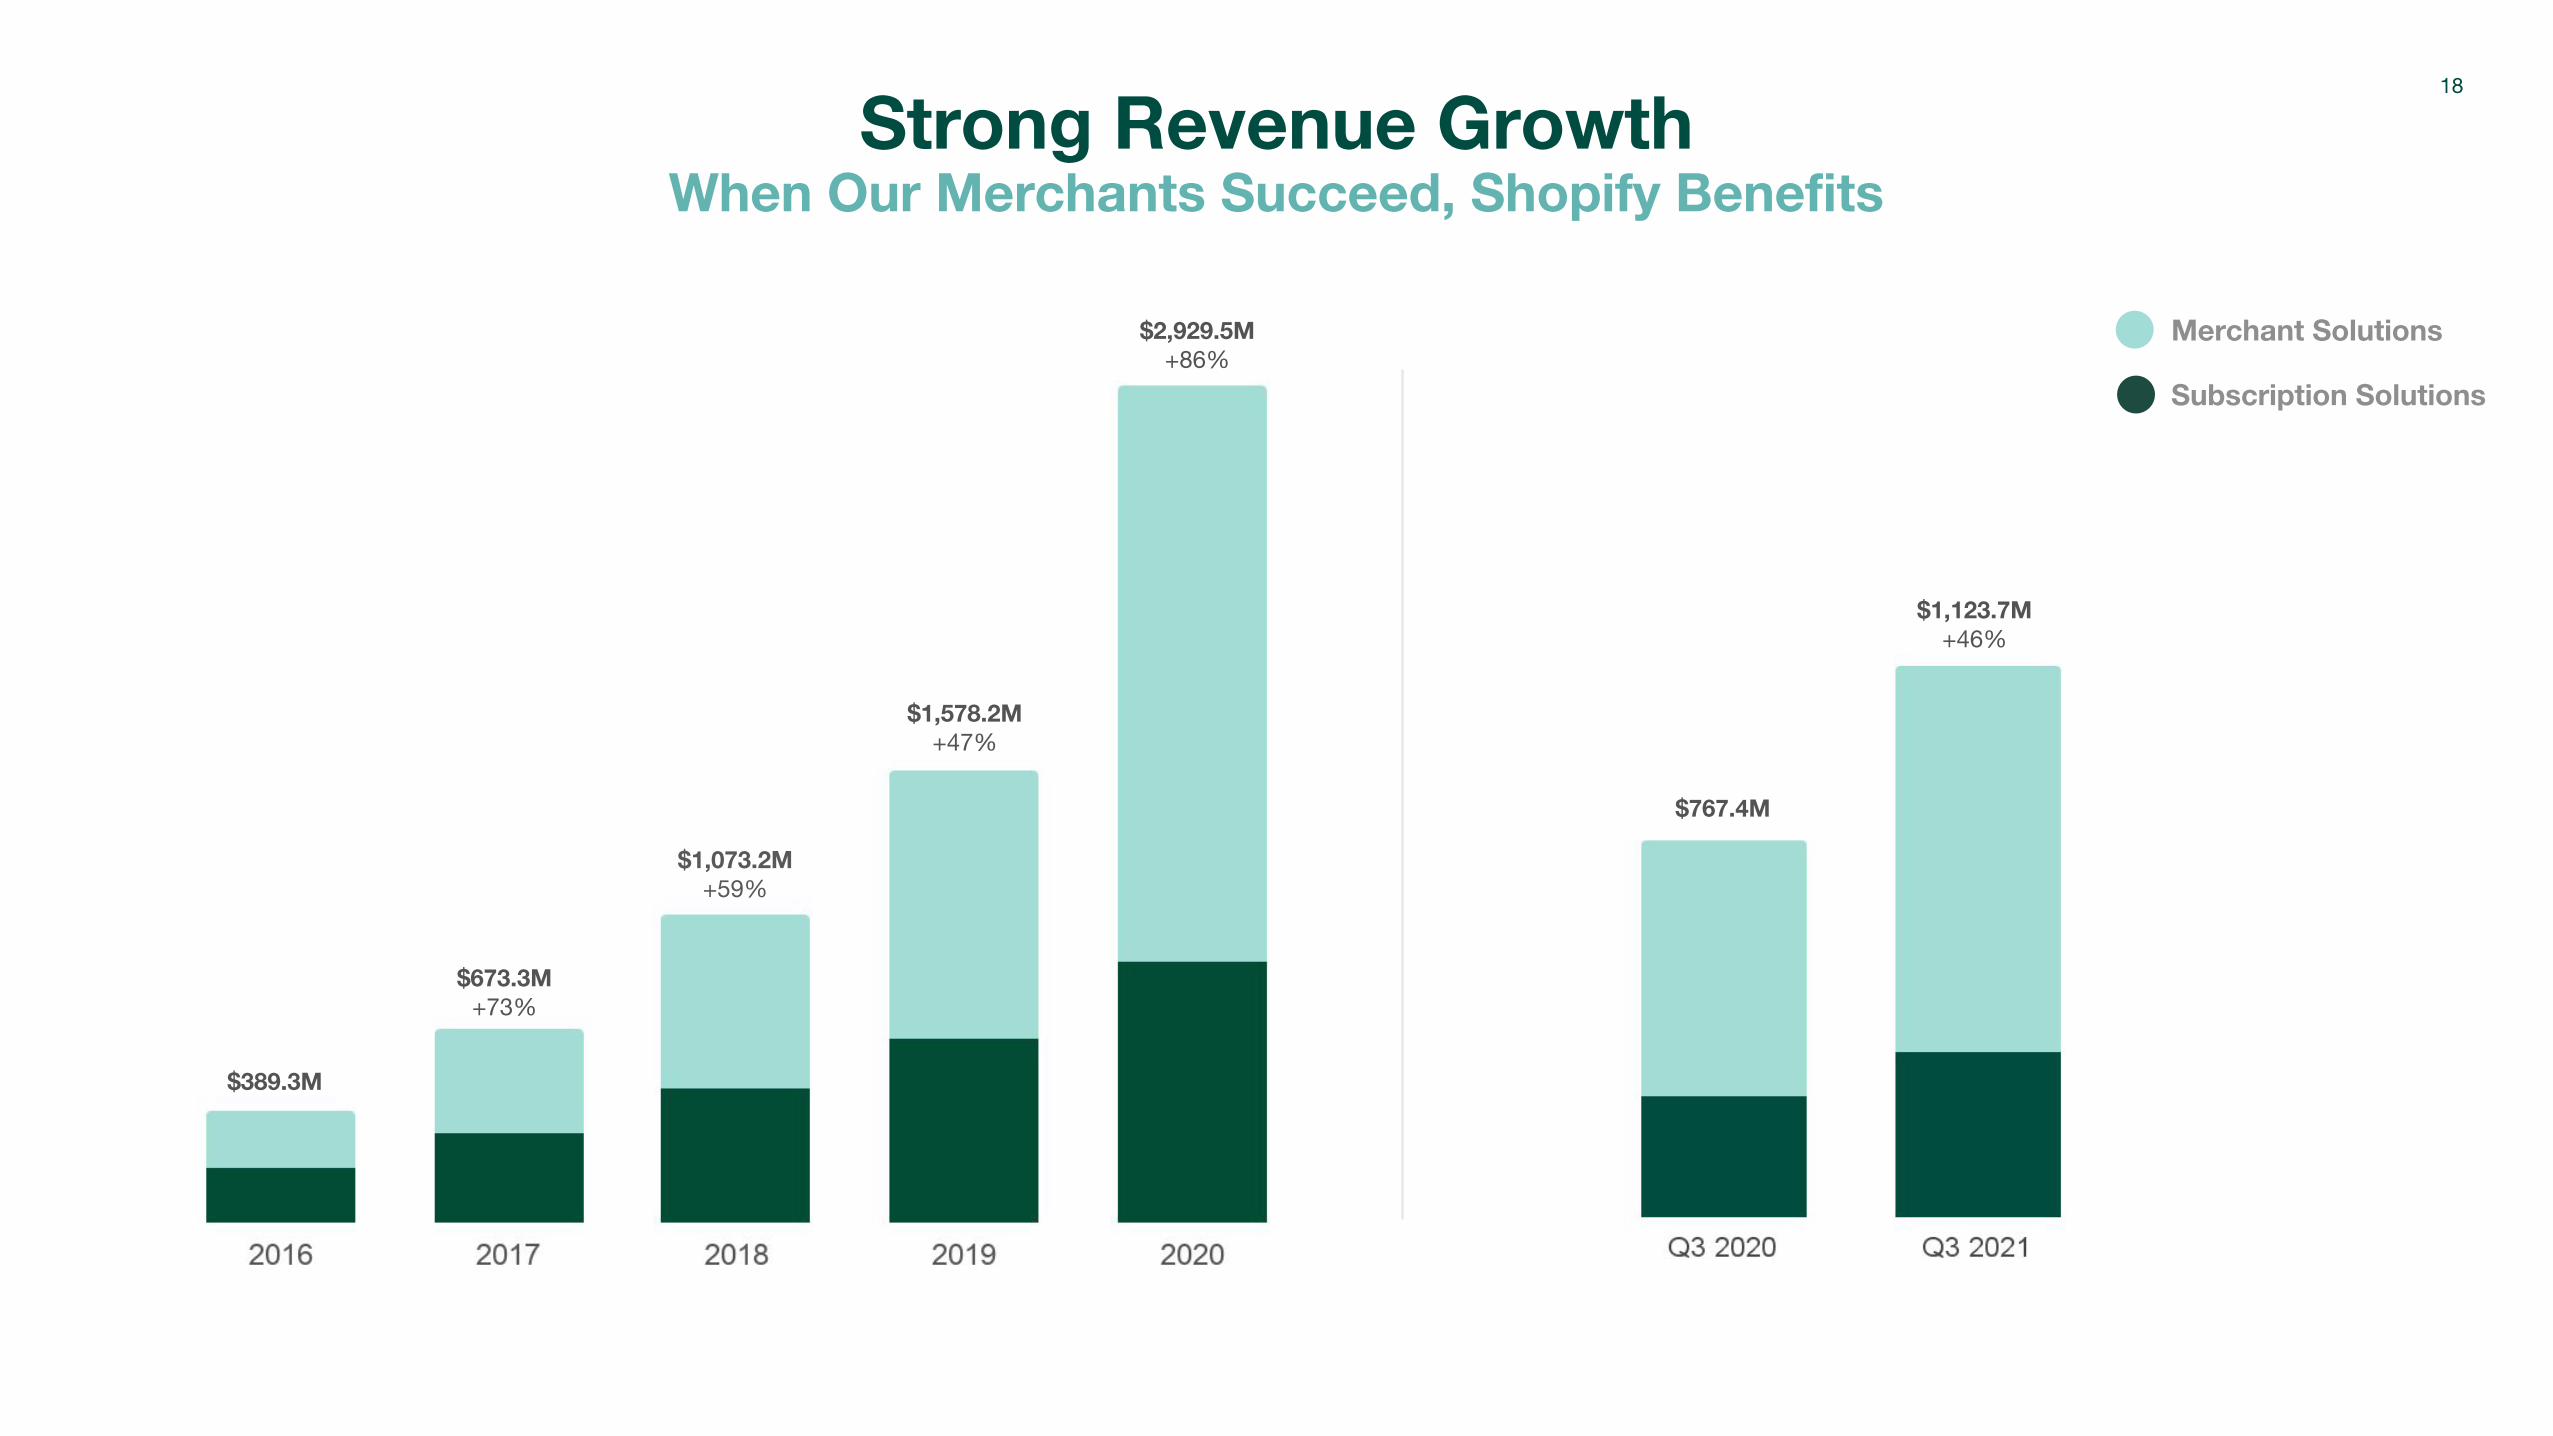
Strong Revenue GrowthWhen Our Merchants Succeed, Shopify Benefits
Subscription Solutions
Merchant Solutions
$767.4M
$1,123.7M+46%
$389.3M
$673.3M+73%
$1,073.2M+59%
$1,578.2M+47%
$2,929.5M+86%
18
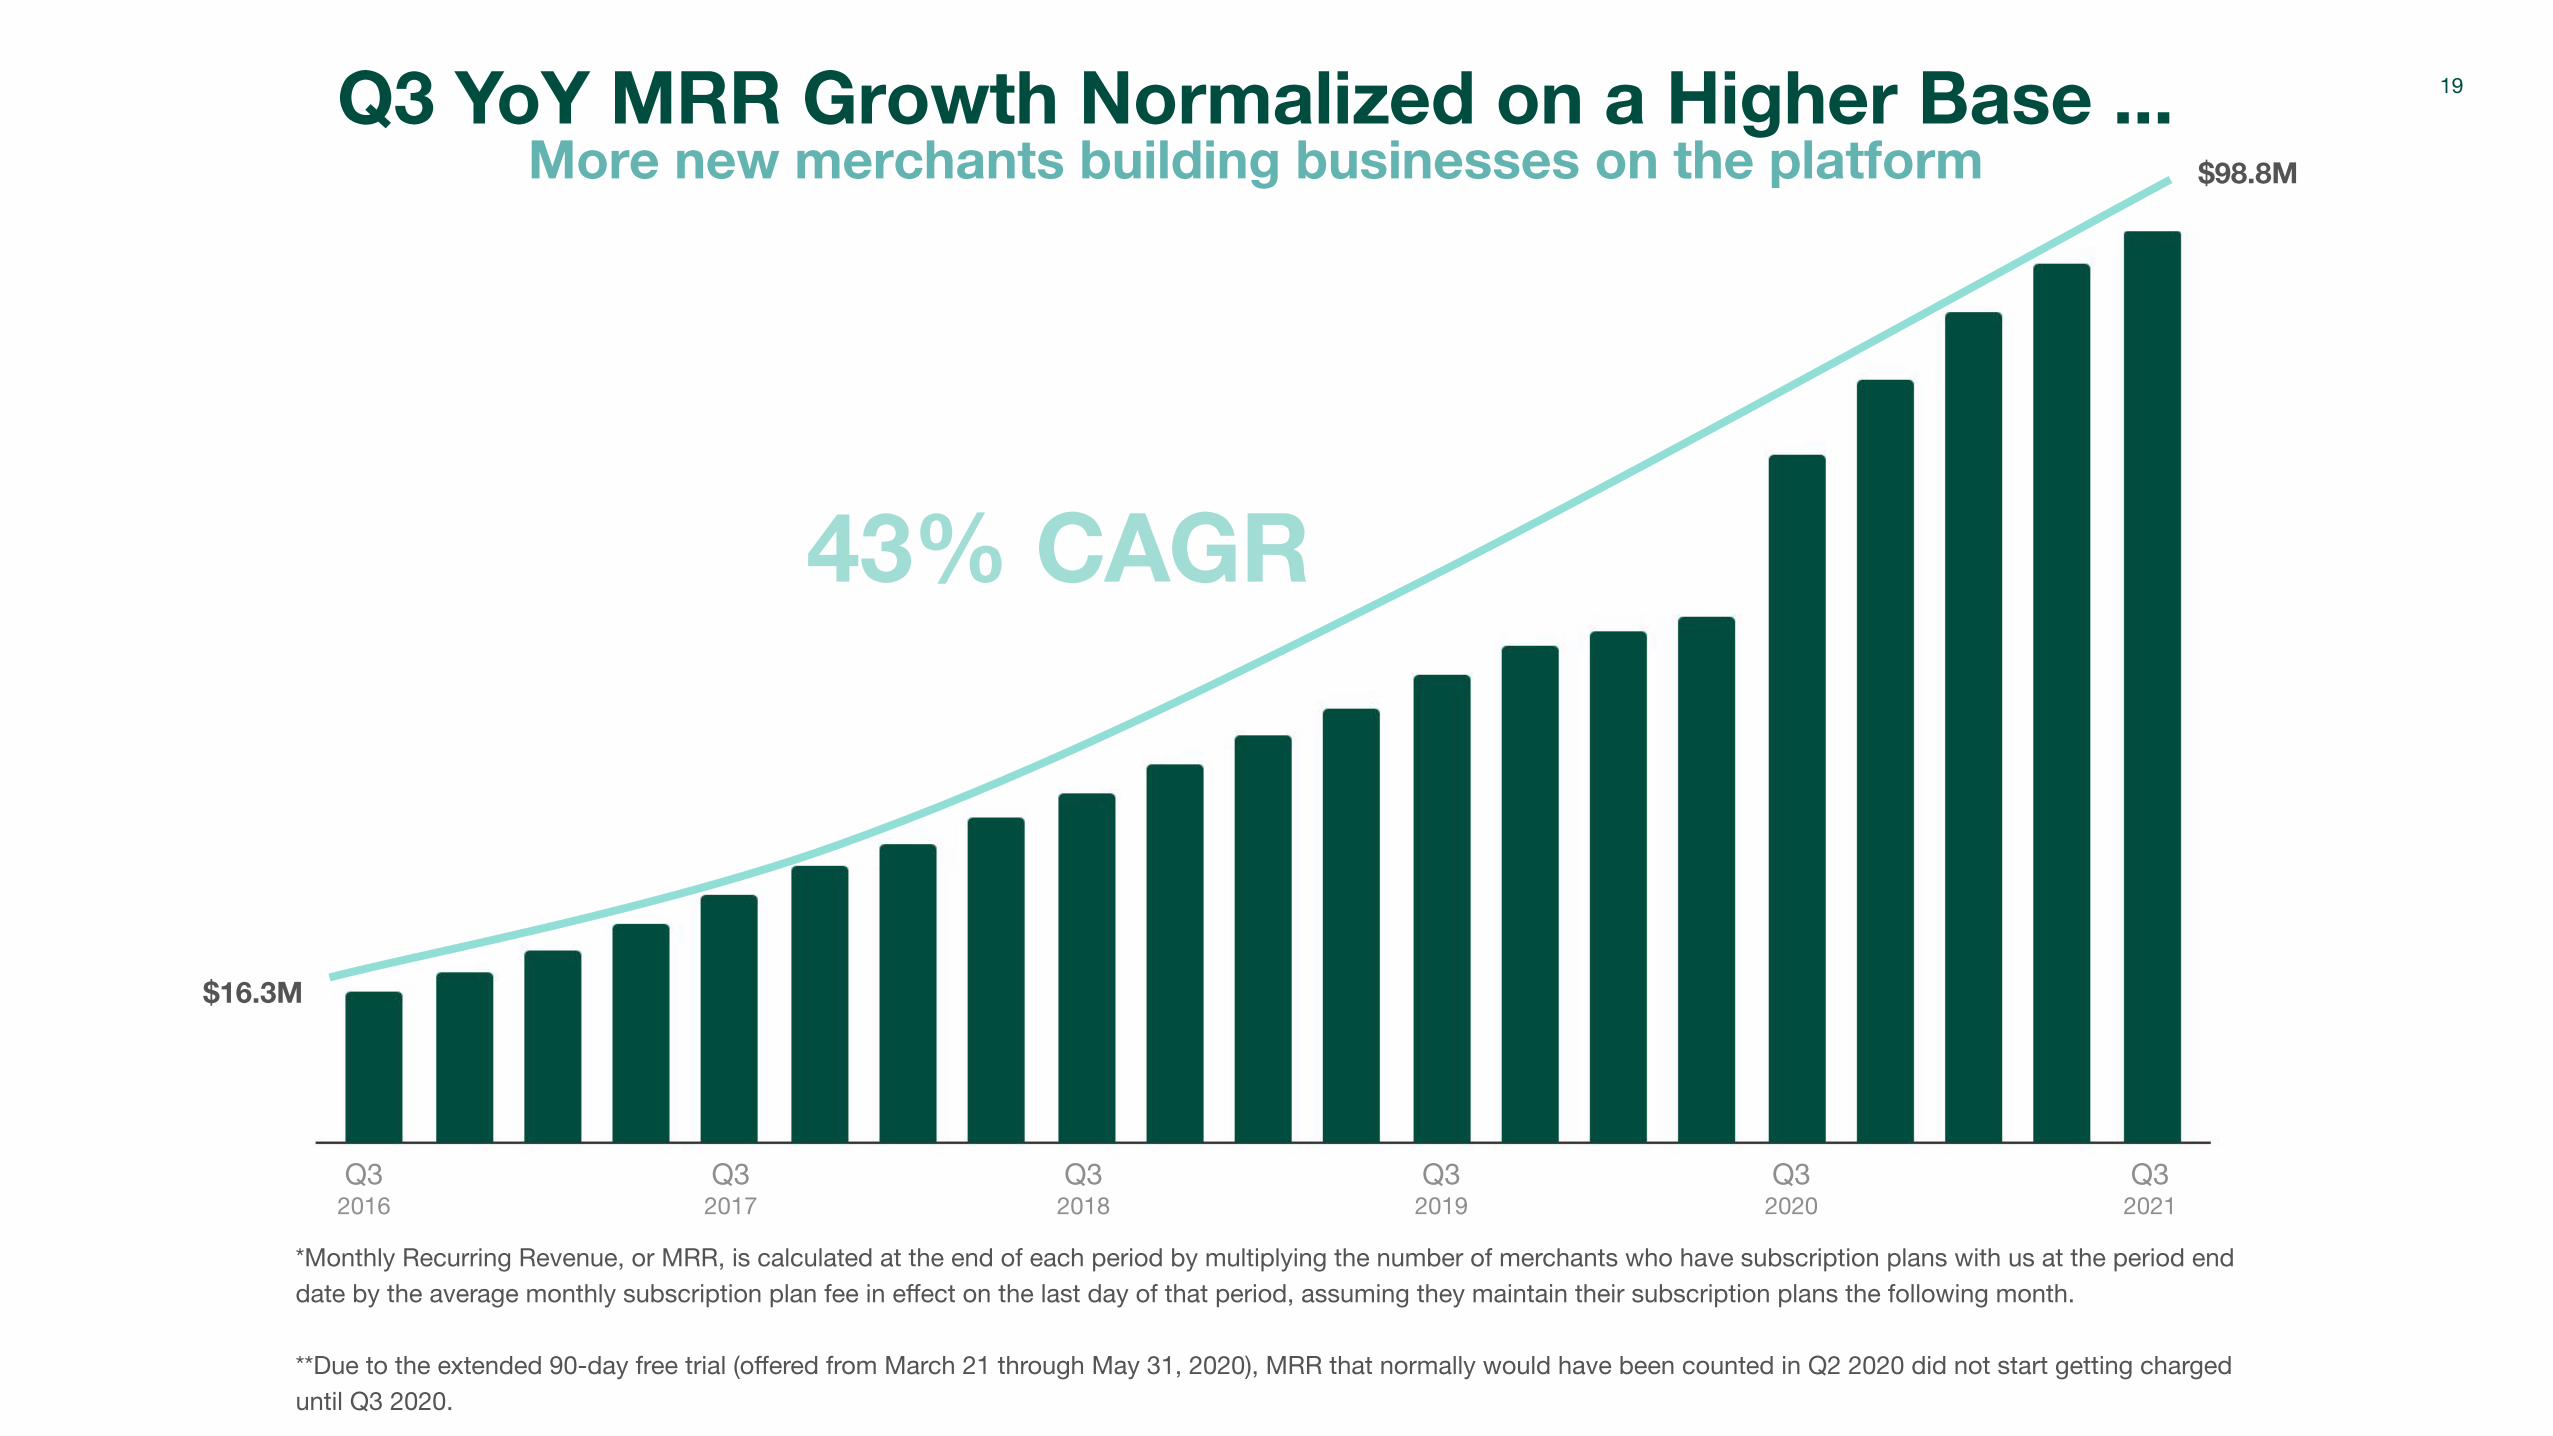
Q3 YoY MRR Growth Normalized on a Higher Base ...
More new merchants building businesses on the platform
*Monthly Recurring Revenue, or MRR, is calculated at the end of each period by multiplying the number of merchants who have subscription plans with us at the period end date by the average monthly subscription plan fee in effect on the last day of that period, assuming they maintain their subscription plans the following month.
**Due to the extended 90-day free trial (offered from March 21 through May 31, 2020), MRR that normally would have been counted in Q2 2020 did not start getting charged until Q3 2020.
Q32016
Q32017
Q32018
43% CAGR
Q32019
Q32020
$98.8M
Q32021
19
$16.3M
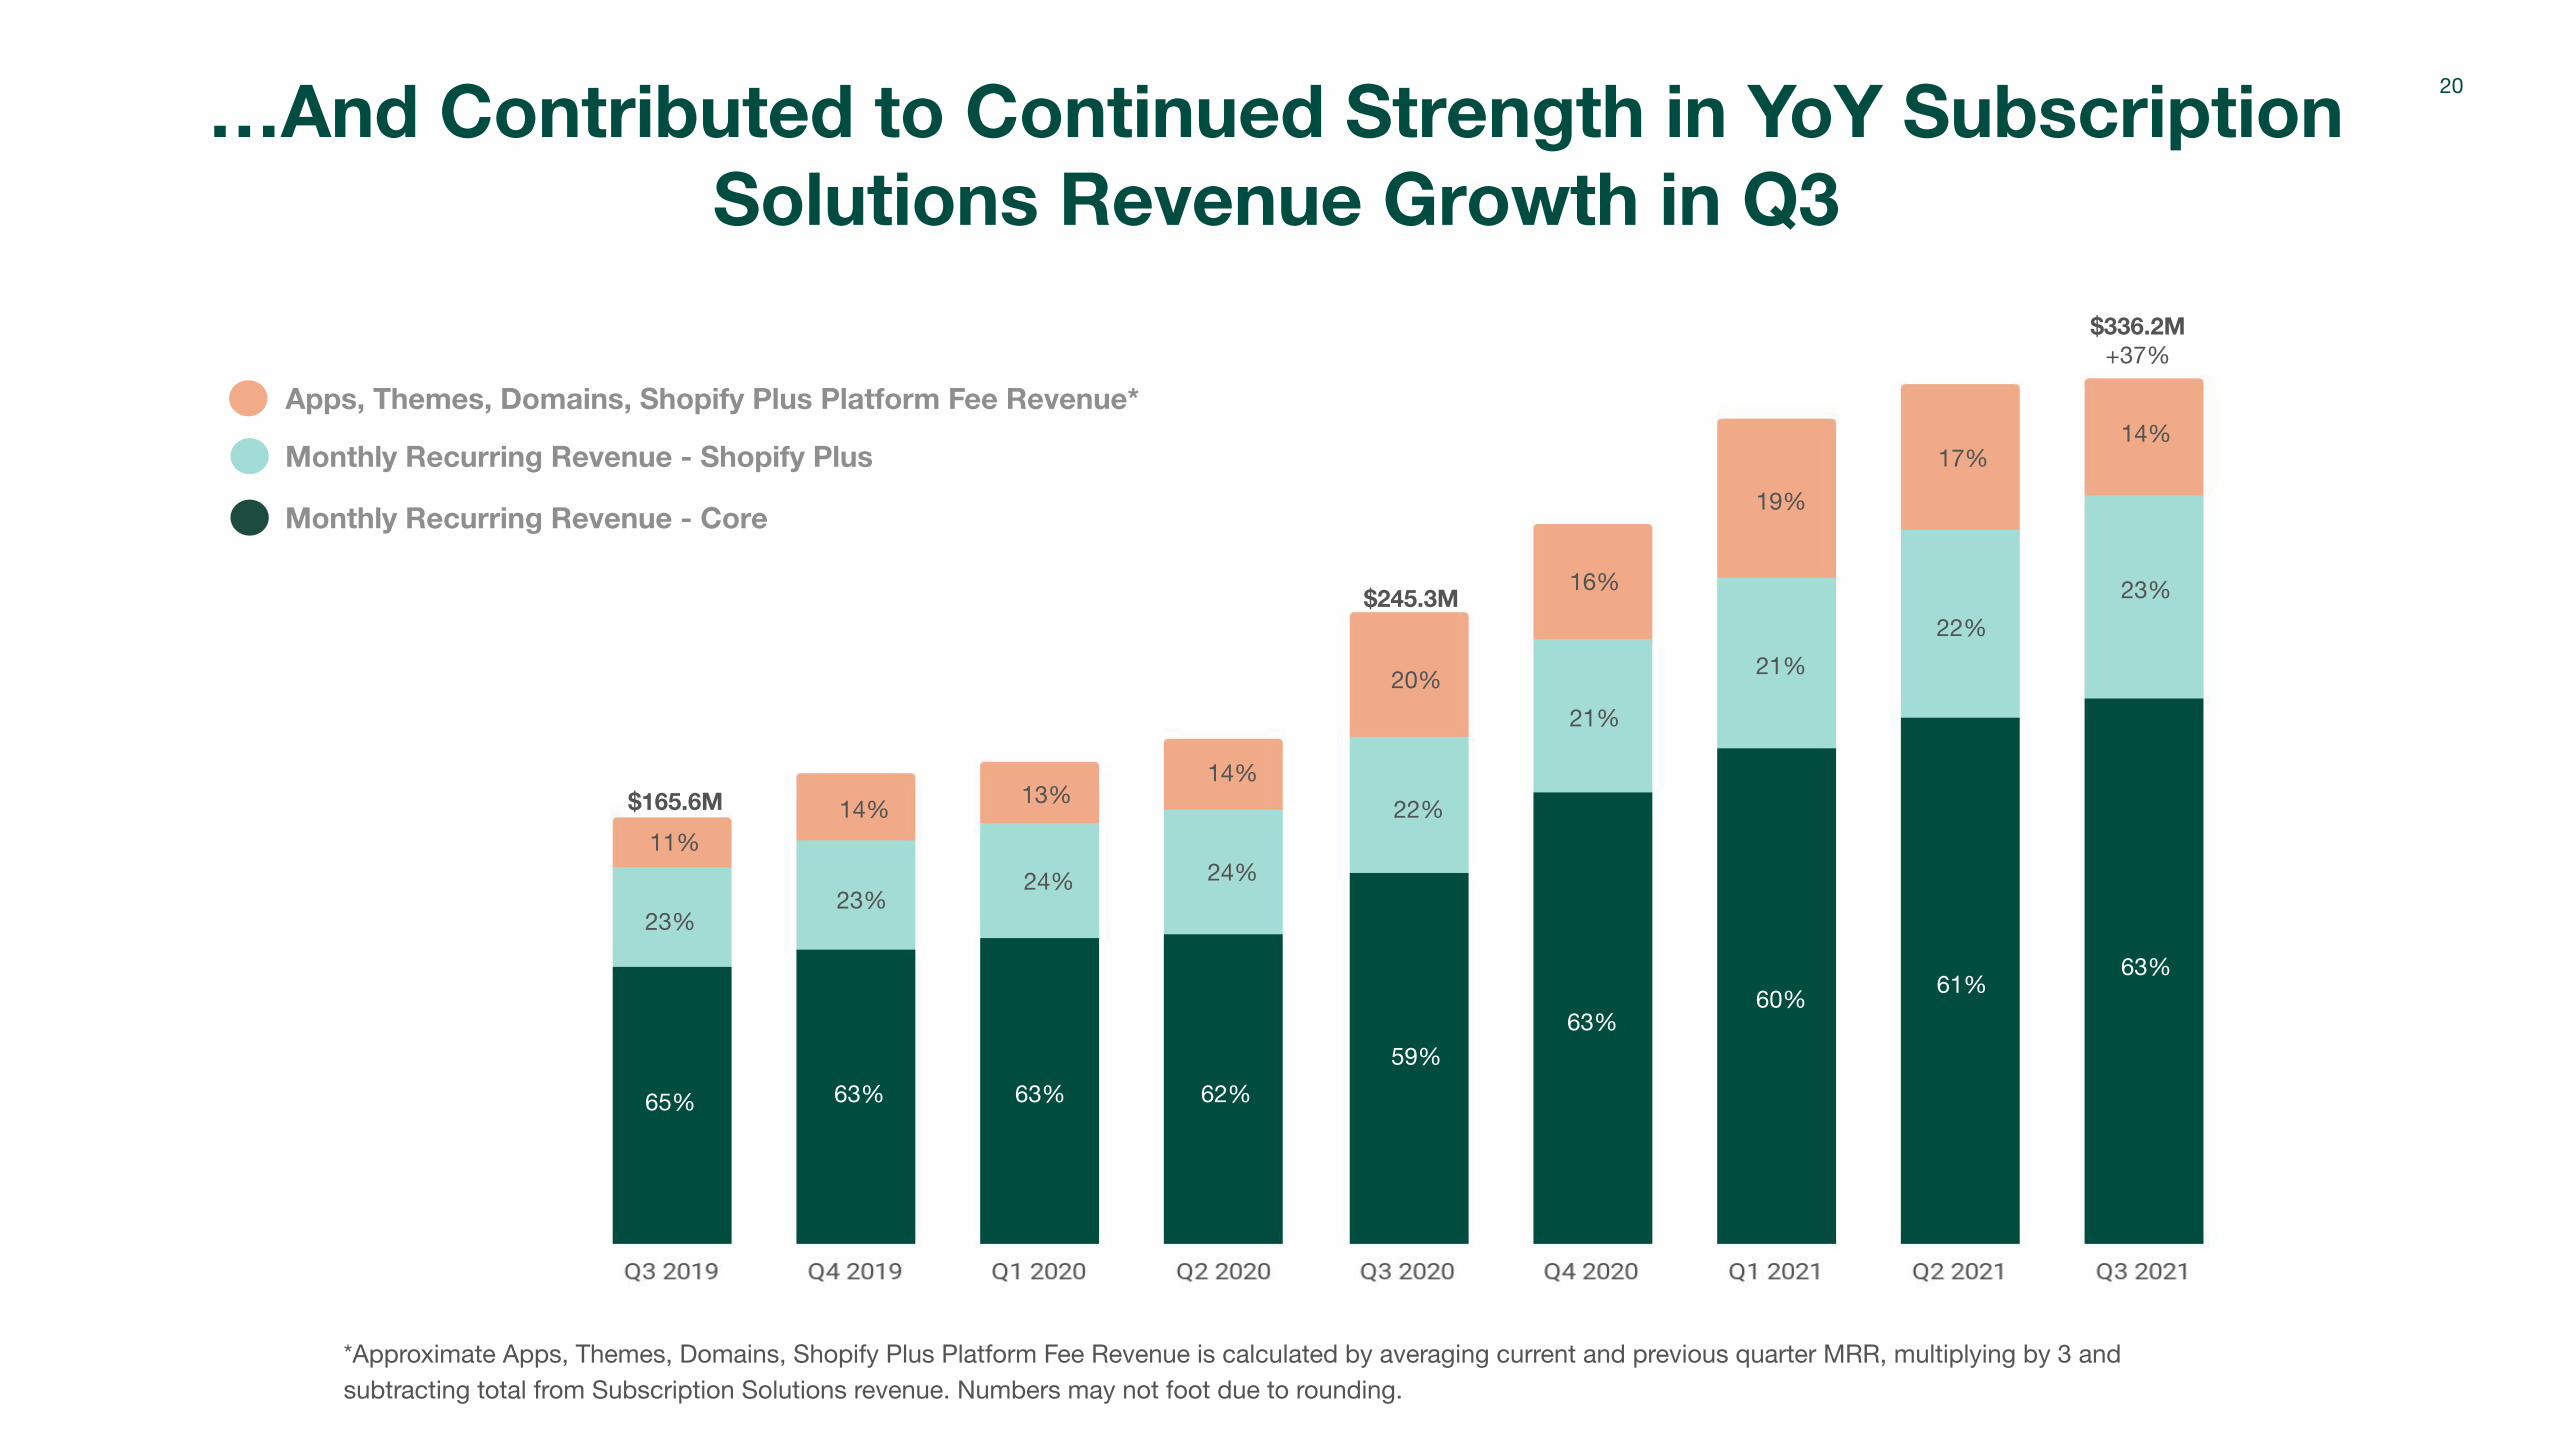
24%
14%
24%
13%$165.6M
$336.2M+37%
63% 62%65%
23%
11%
16%
21%
63%
19%
21%
60%
63%
23%
14%
17%
22%
61%
59%
20%
22%
…And Contributed to Continued Strength in YoY Subscription Solutions Revenue Growth in Q3
*Approximate Apps, Themes, Domains, Shopify Plus Platform Fee Revenue is calculated by averaging current and previous quarter MRR, multiplying by 3 and subtracting total from Subscription Solutions revenue. Numbers may not foot due to rounding.
Monthly Recurring Revenue - Core
Apps, Themes, Domains, Shopify Plus Platform Fee Revenue*
Monthly Recurring Revenue - Shopify Plus
20
63%
23%
14%
$245.3M

Strong Consistent GMV GrowthMerchants Are Joining, Scaling and Succeeding on Shopify
$26.3B+71%
$15.4B
$41.1B+56%
$61.1B+49%
*Gross Merchandise Volume, or GMV, represents the total dollar value of orders facilitated on the Shopify platform including certain apps and channels for which a revenue-sharing arrangement is in place in the period, net of refunds, and inclusive of shipping and handling, duty and value-added taxes.
$30.9B
$41.8B+35%
21
$119.6B+96%
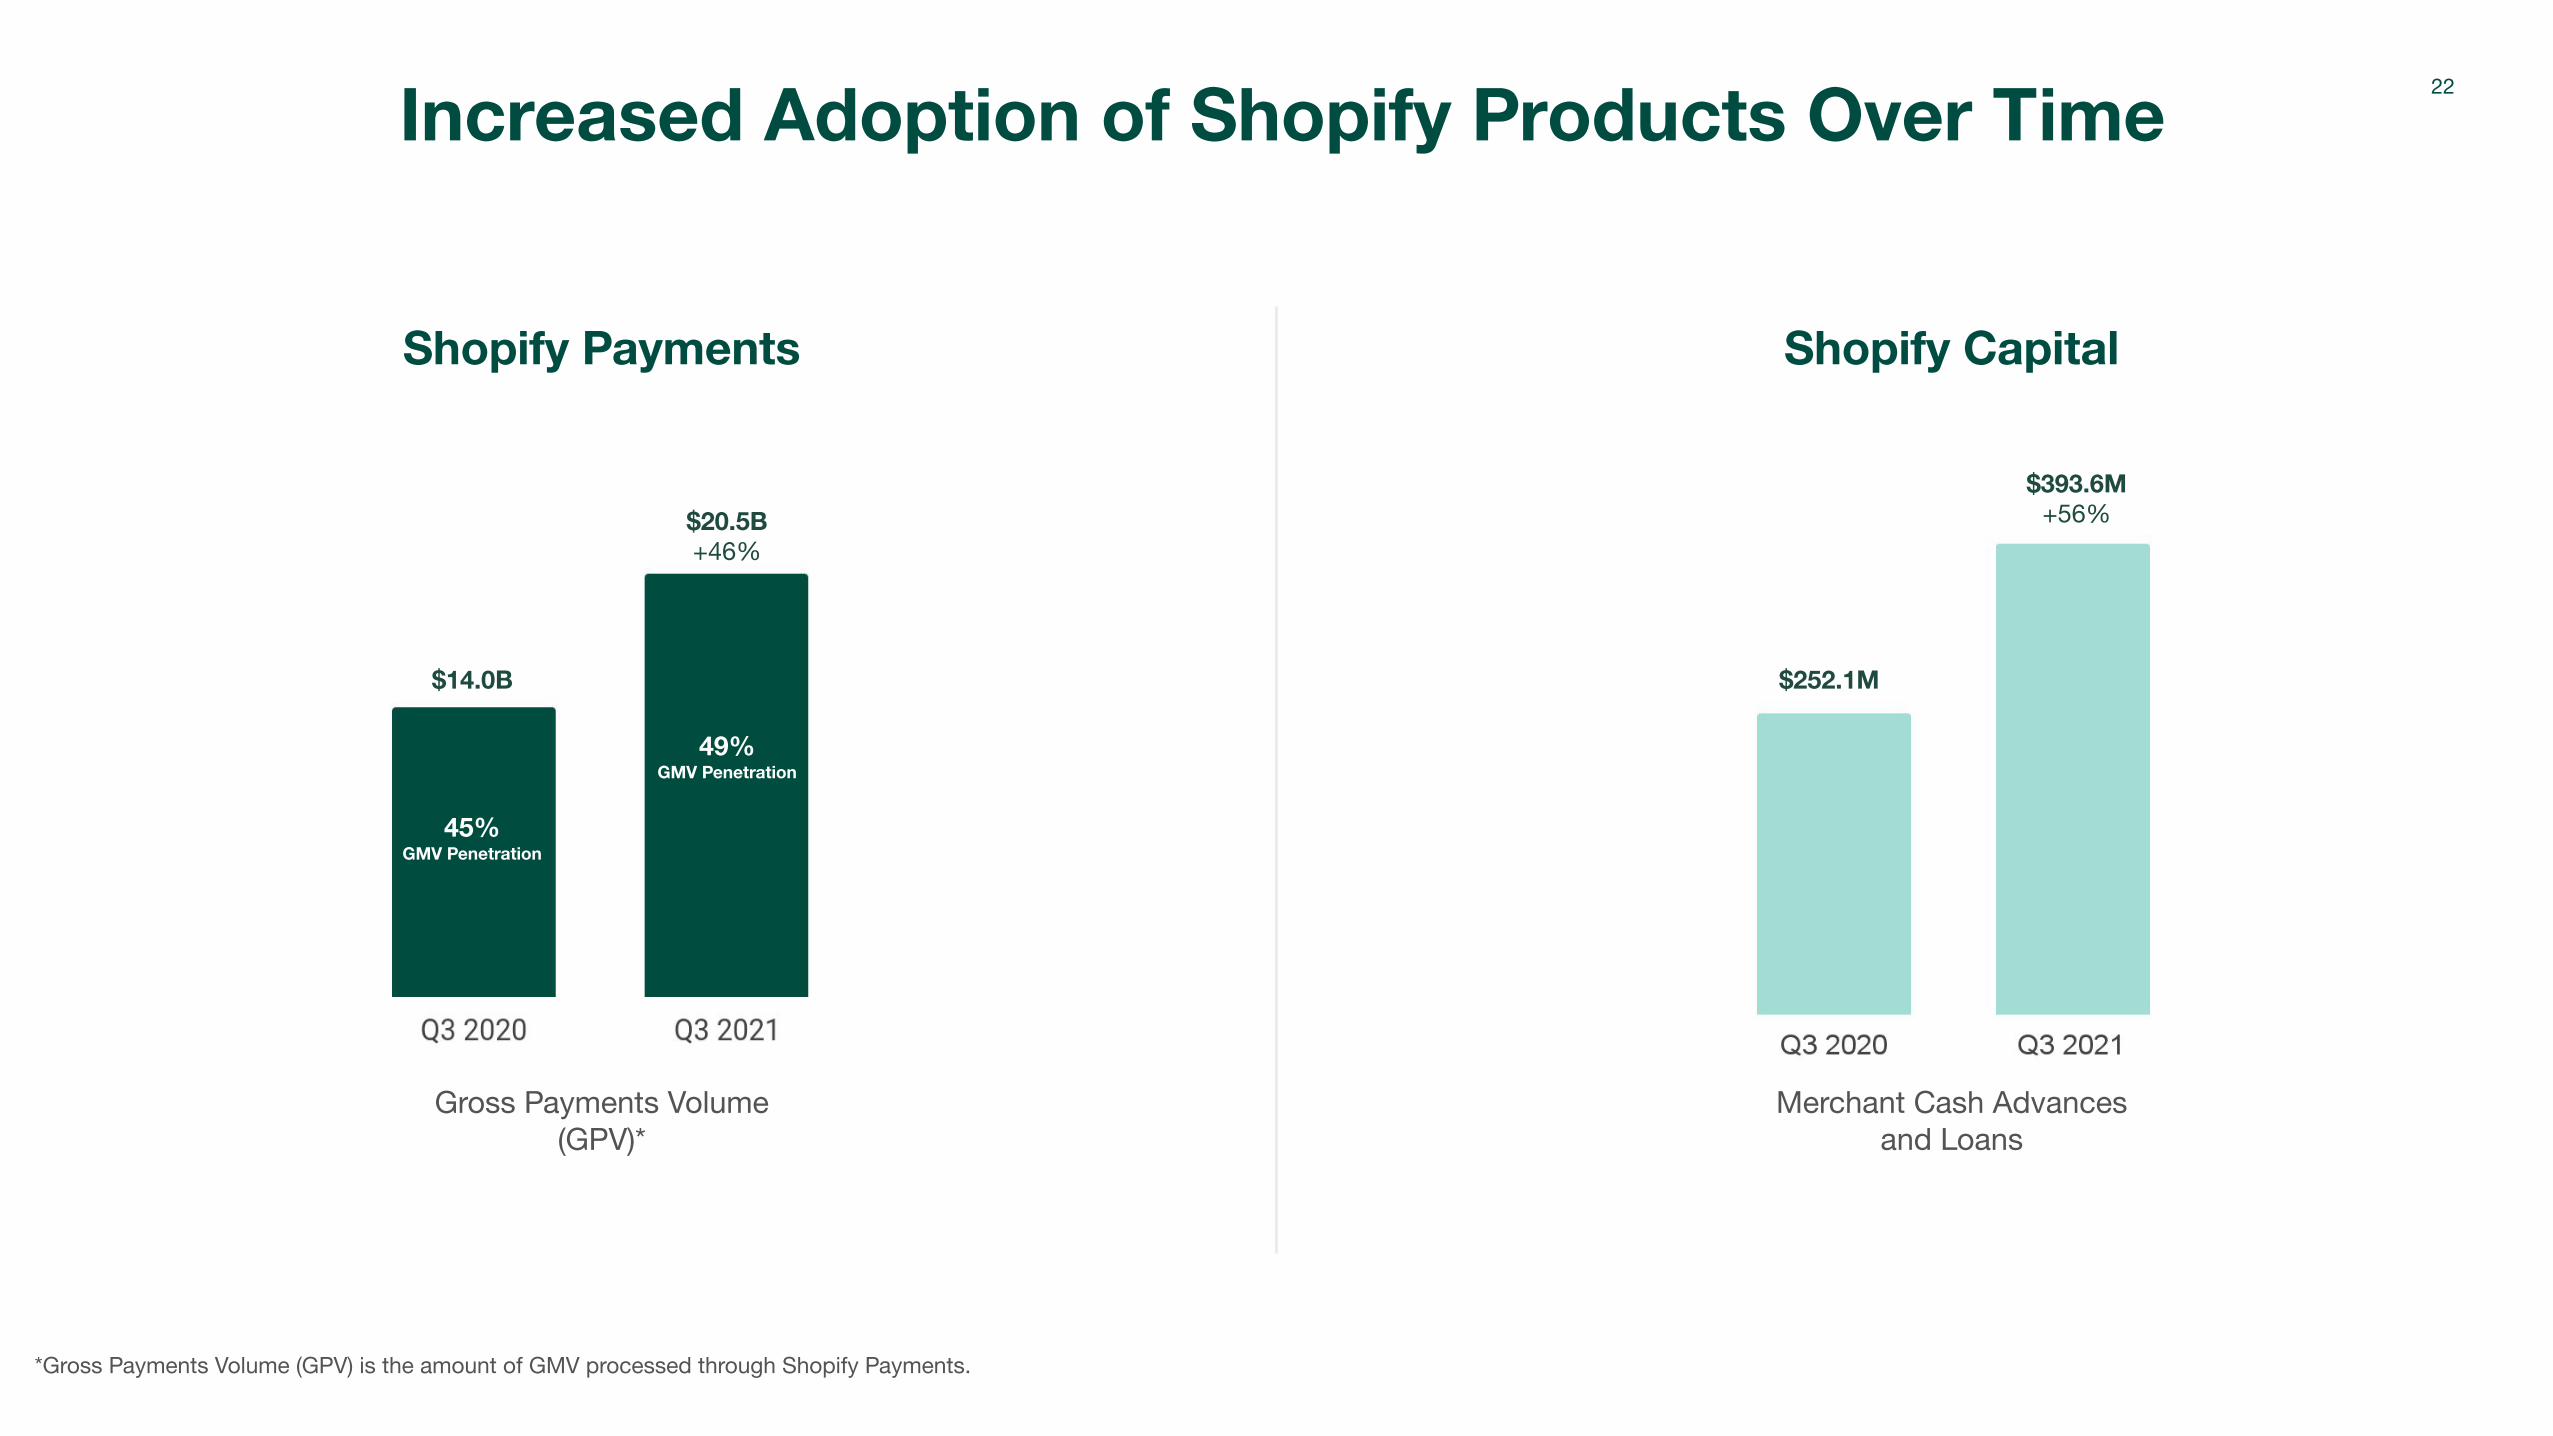
Increased Adoption of Shopify Products Over Time
Shopify Payments
$20.5B+46%
Gross Payments Volume (GPV)*
Shopify Capital
Merchant Cash Advances and Loans
*Gross Payments Volume (GPV) is the amount of GMV processed through Shopify Payments.
45% GMV Penetration
49% GMV Penetration
$393.6M+56%
$252.1M$14.0B
22
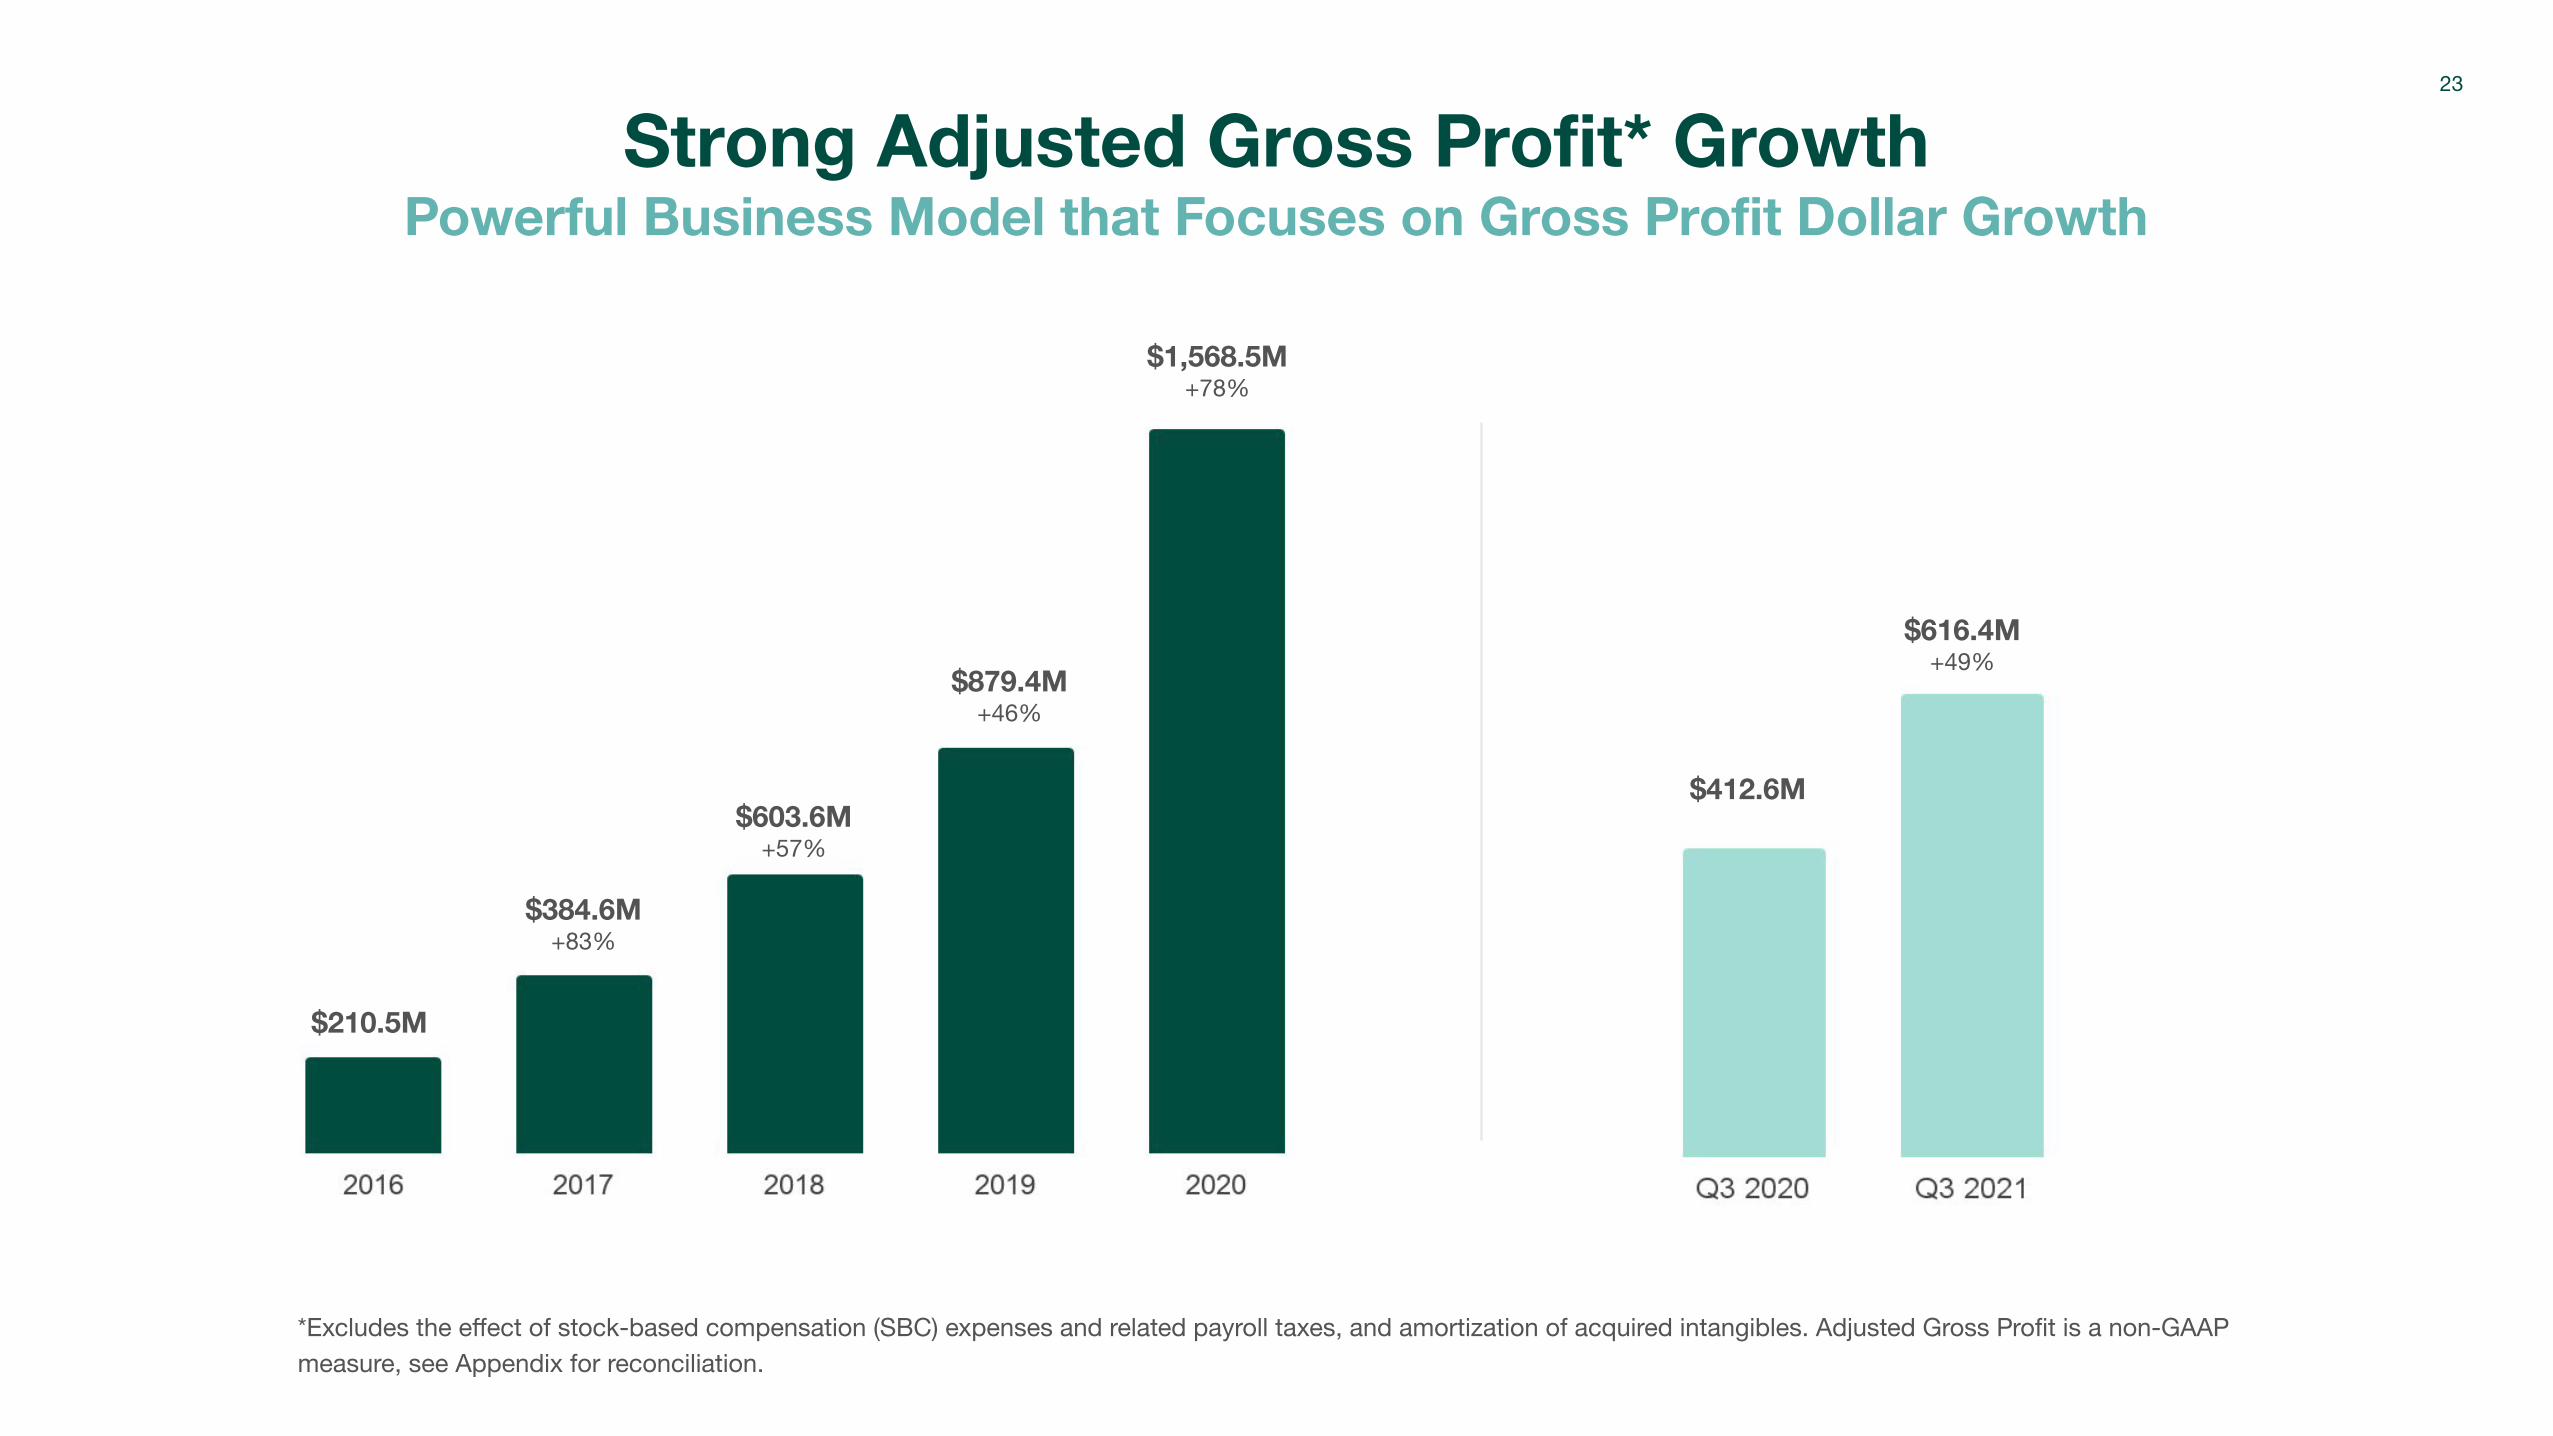
*Excludes the effect of stock-based compensation (SBC) expenses and related payroll taxes, and amortization of acquired intangibles. Adjusted Gross Profit is a non-GAAP measure, see Appendix for reconciliation.
$412.6M
$616.4M+49%
$384.6M+83%
$210.5M
$603.6M+57%
$879.4M+46%
23
Strong Adjusted Gross Profit* Growth Powerful Business Model that Focuses on Gross Profit Dollar Growth
$1,568.5M+78%
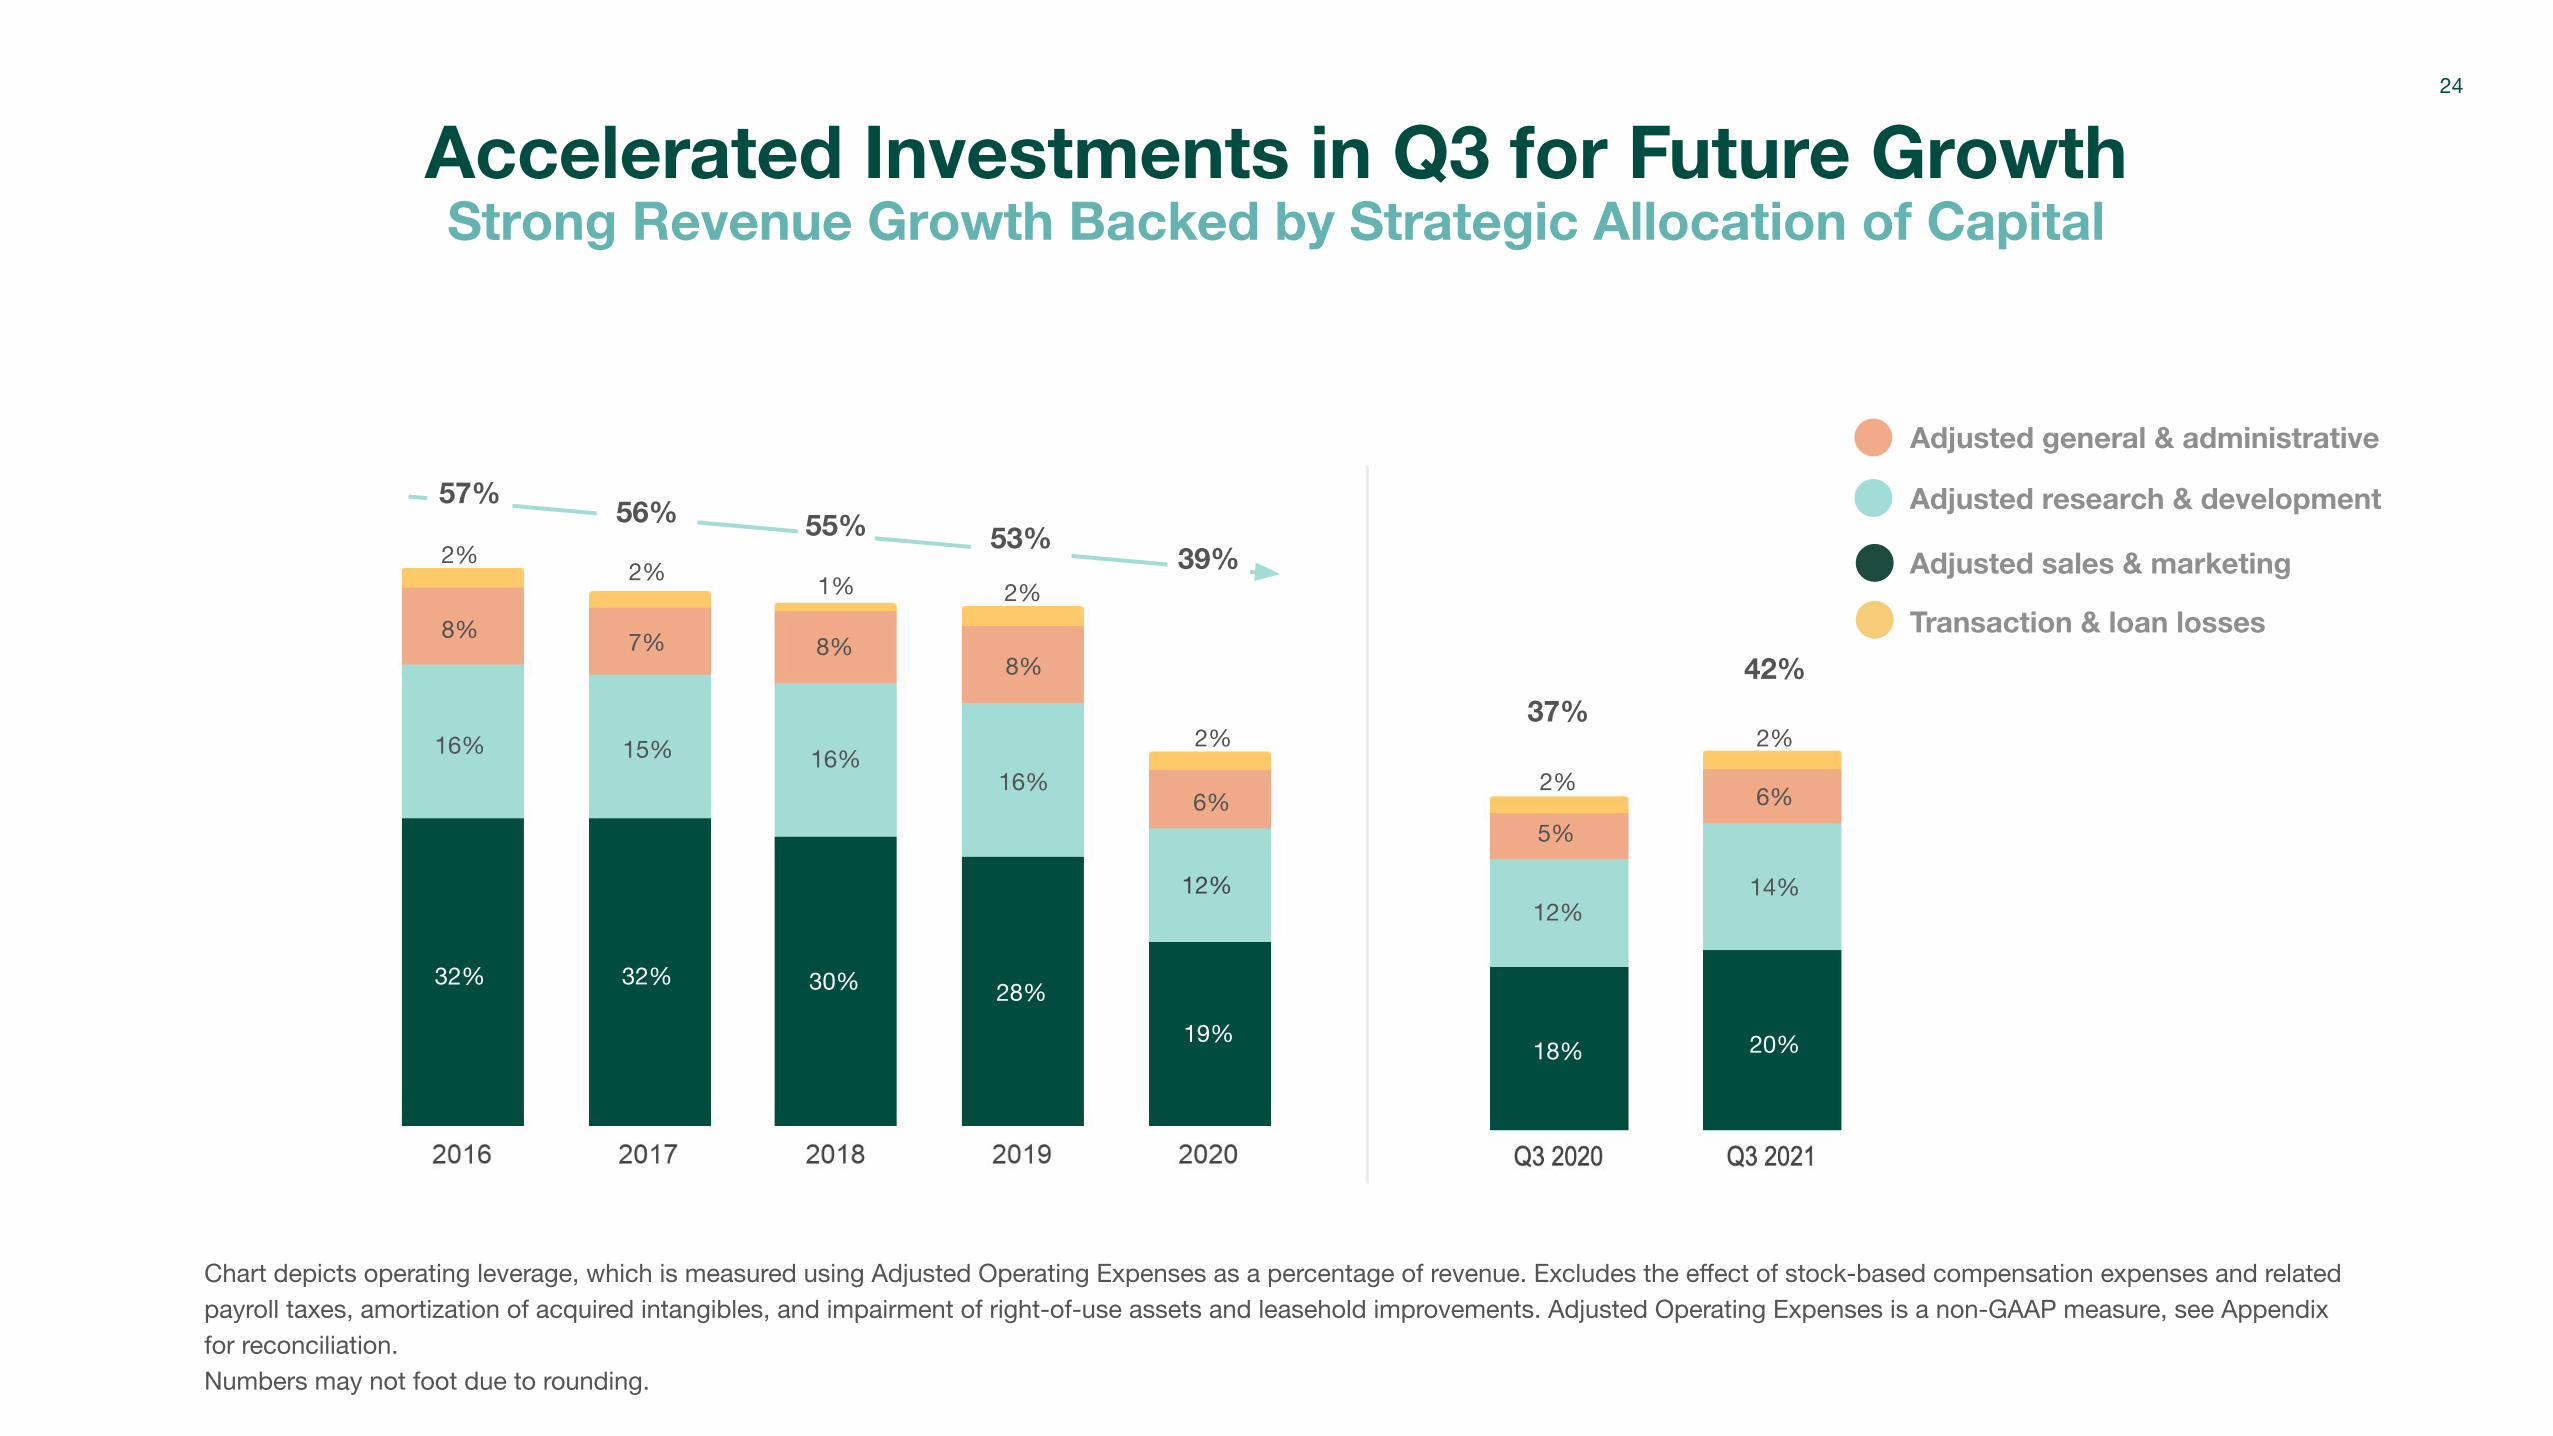
Accelerated Investments in Q3 for Future GrowthStrong Revenue Growth Backed by Strategic Allocation of Capital
Chart depicts operating leverage, which is measured using Adjusted Operating Expenses as a percentage of revenue. Excludes the effect of stock-based compensation expenses and related payroll taxes, amortization of acquired intangibles, and impairment of right-of-use assets and leasehold improvements. Adjusted Operating Expenses is a non-GAAP measure, see Appendix for reconciliation. Numbers may not foot due to rounding.
32%
16%
8%
30%
16%
8%
32%
15%
7%
28%
16%
8%
19%
12%
6%
2%2% 1% 2%
2%
53%39%
55%56%57%
37%42%
2%6%
14%
18% 20%
2%
5%
12%
24
Adjusted sales & marketing
Adjusted general & administrative
Adjusted research & development
Transaction & loan losses
25
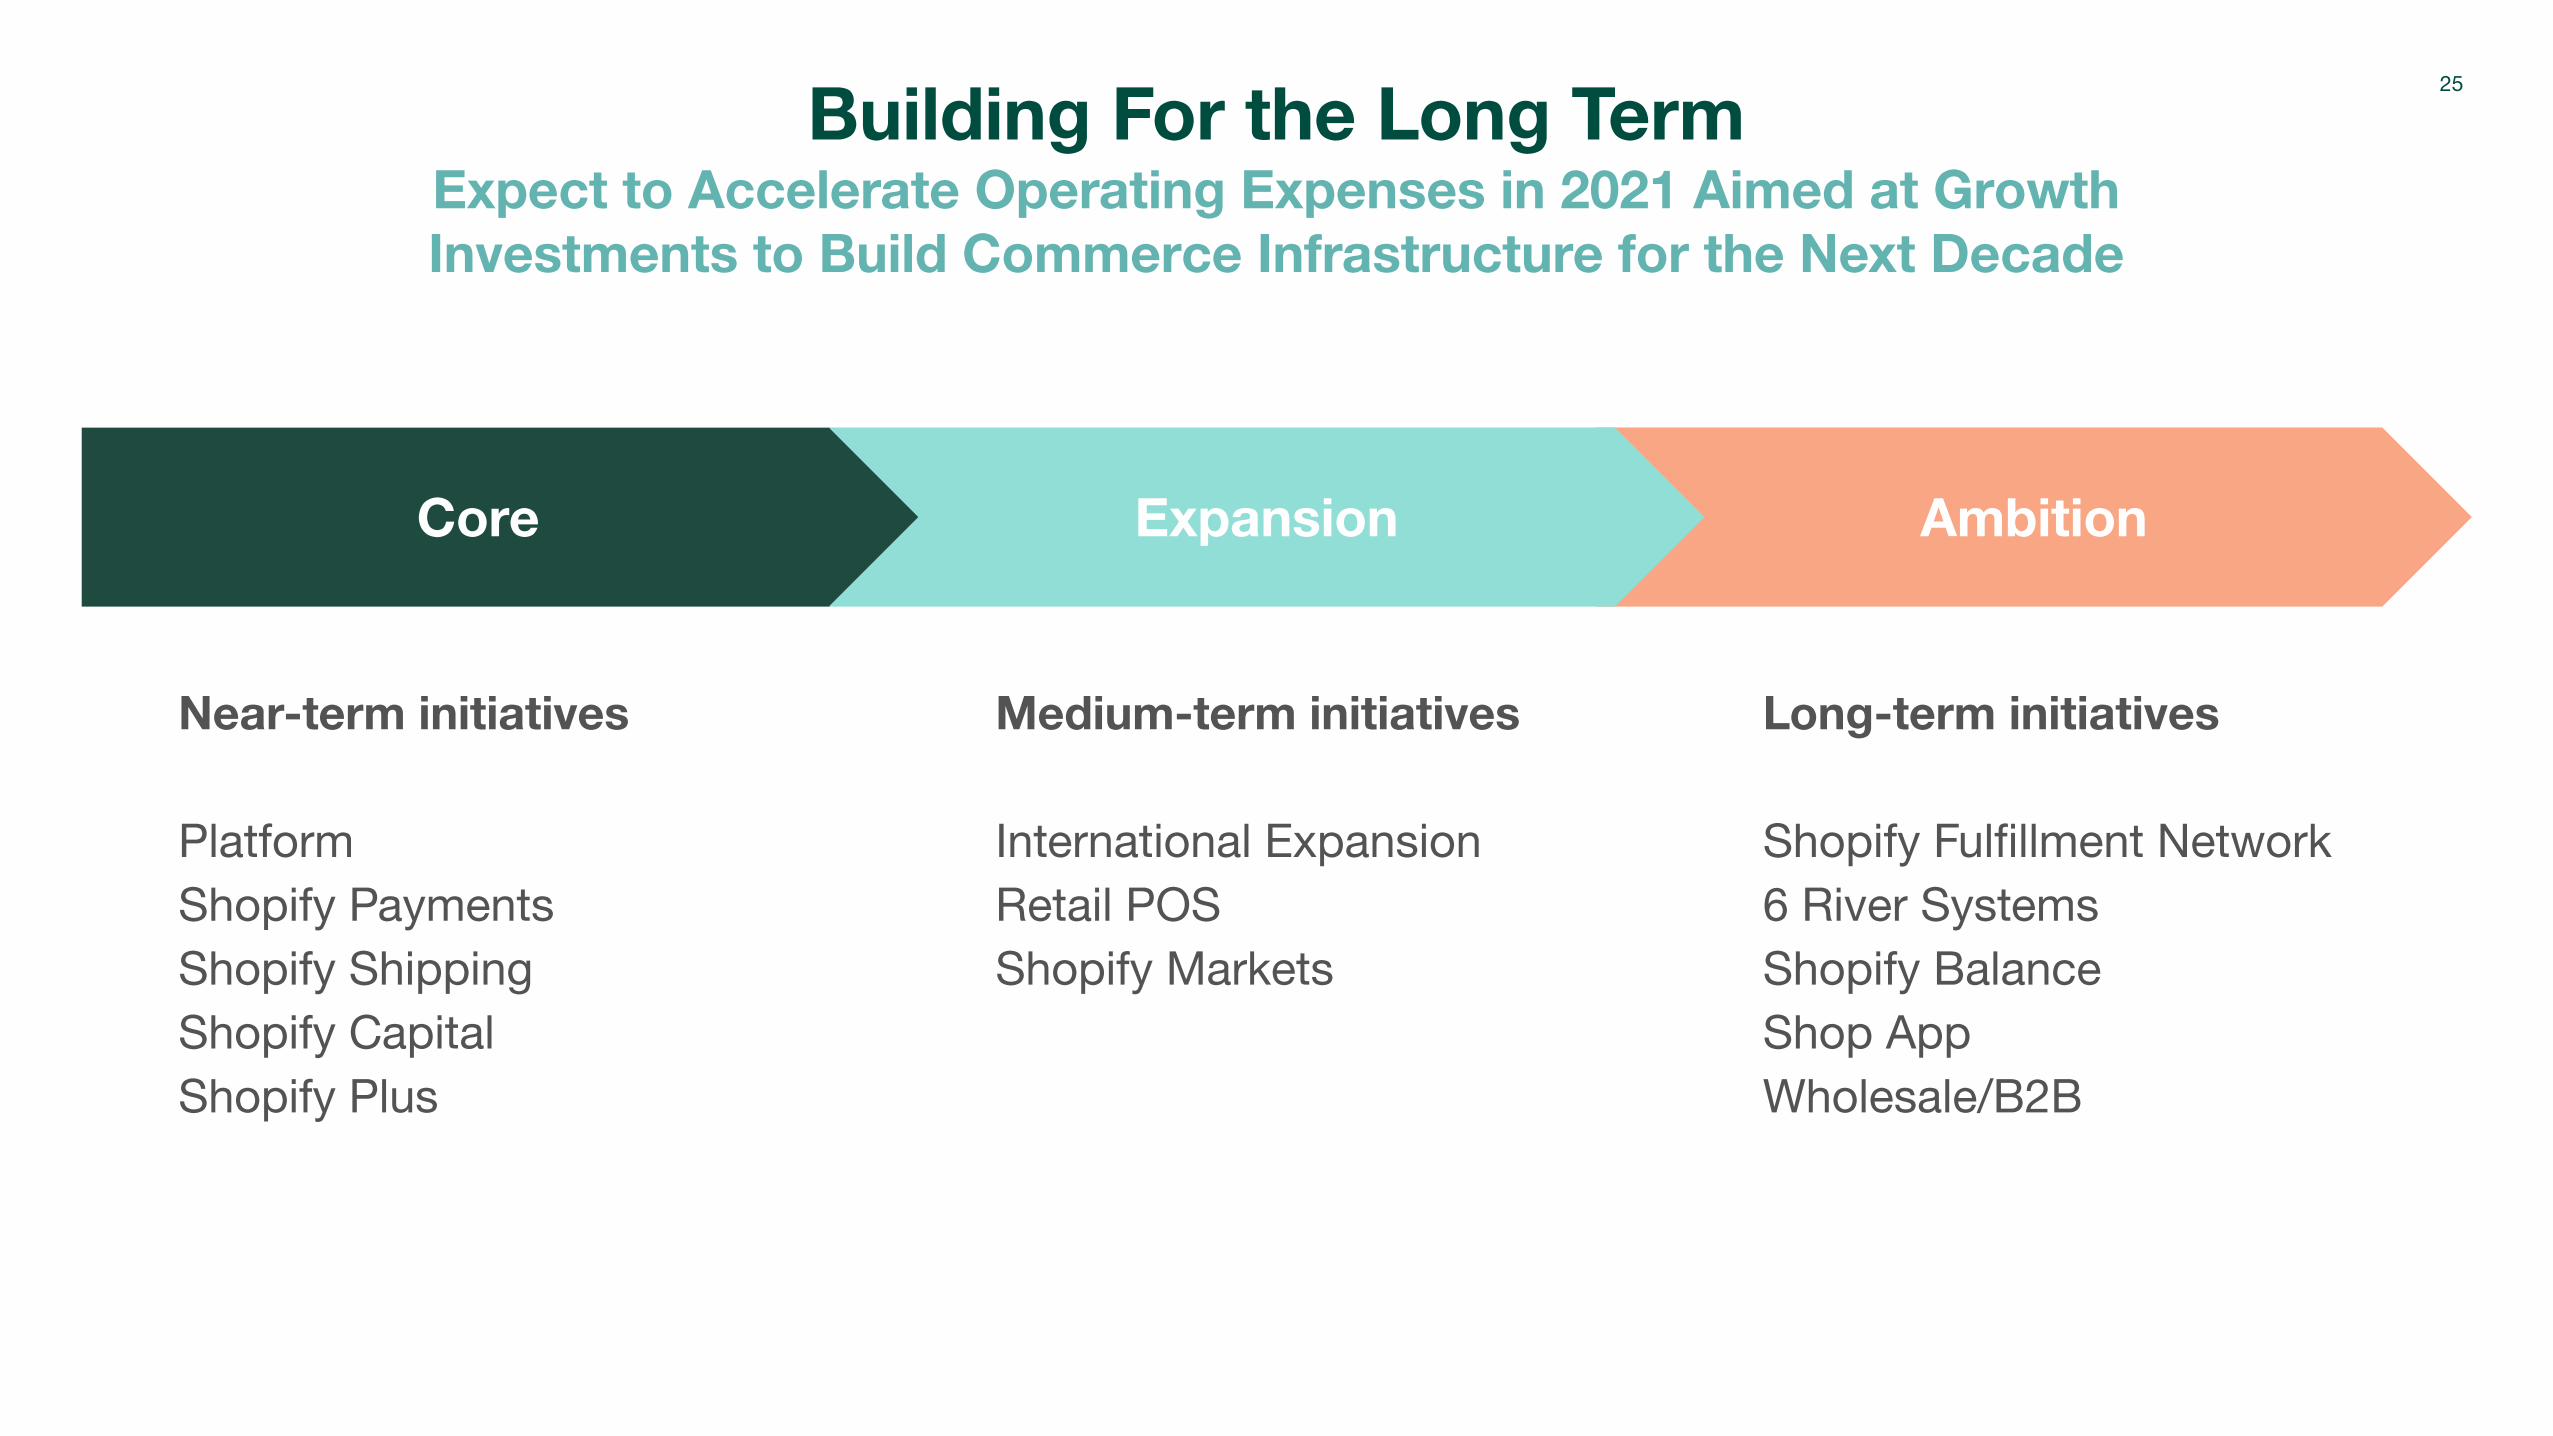
Building For the Long TermExpect to Accelerate Operating Expenses in 2021 Aimed at Growth Investments to Build Commerce Infrastructure for the Next Decade
Ambition
Long-term initiatives
Shopify Fulfillment Network6 River SystemsShopify BalanceShop AppWholesale/B2B
Core
Near-term initiatives
PlatformShopify PaymentsShopify ShippingShopify CapitalShopify Plus
Expansion
Medium-term initiatives
International ExpansionRetail POSShopify Markets

Annual Cohorts Provide Strong Foundation for GrowthRevenue by Cohort
*Annual revenue from merchant cohorts that joined the Shopify platform in the period shown. **Note: the first year a merchant joins the platform may not be 12 full months and therefore is not fully comparable to the subsequent 12 month periods.
• Revenue growth within an annual cohort, driven by GMV growth and expanded wallet share, has offset revenue loss from merchants leaving the platform
• Total combined revenue of all previous cohorts has also grown consistently
Pre-2018
2018
2019
2020
26
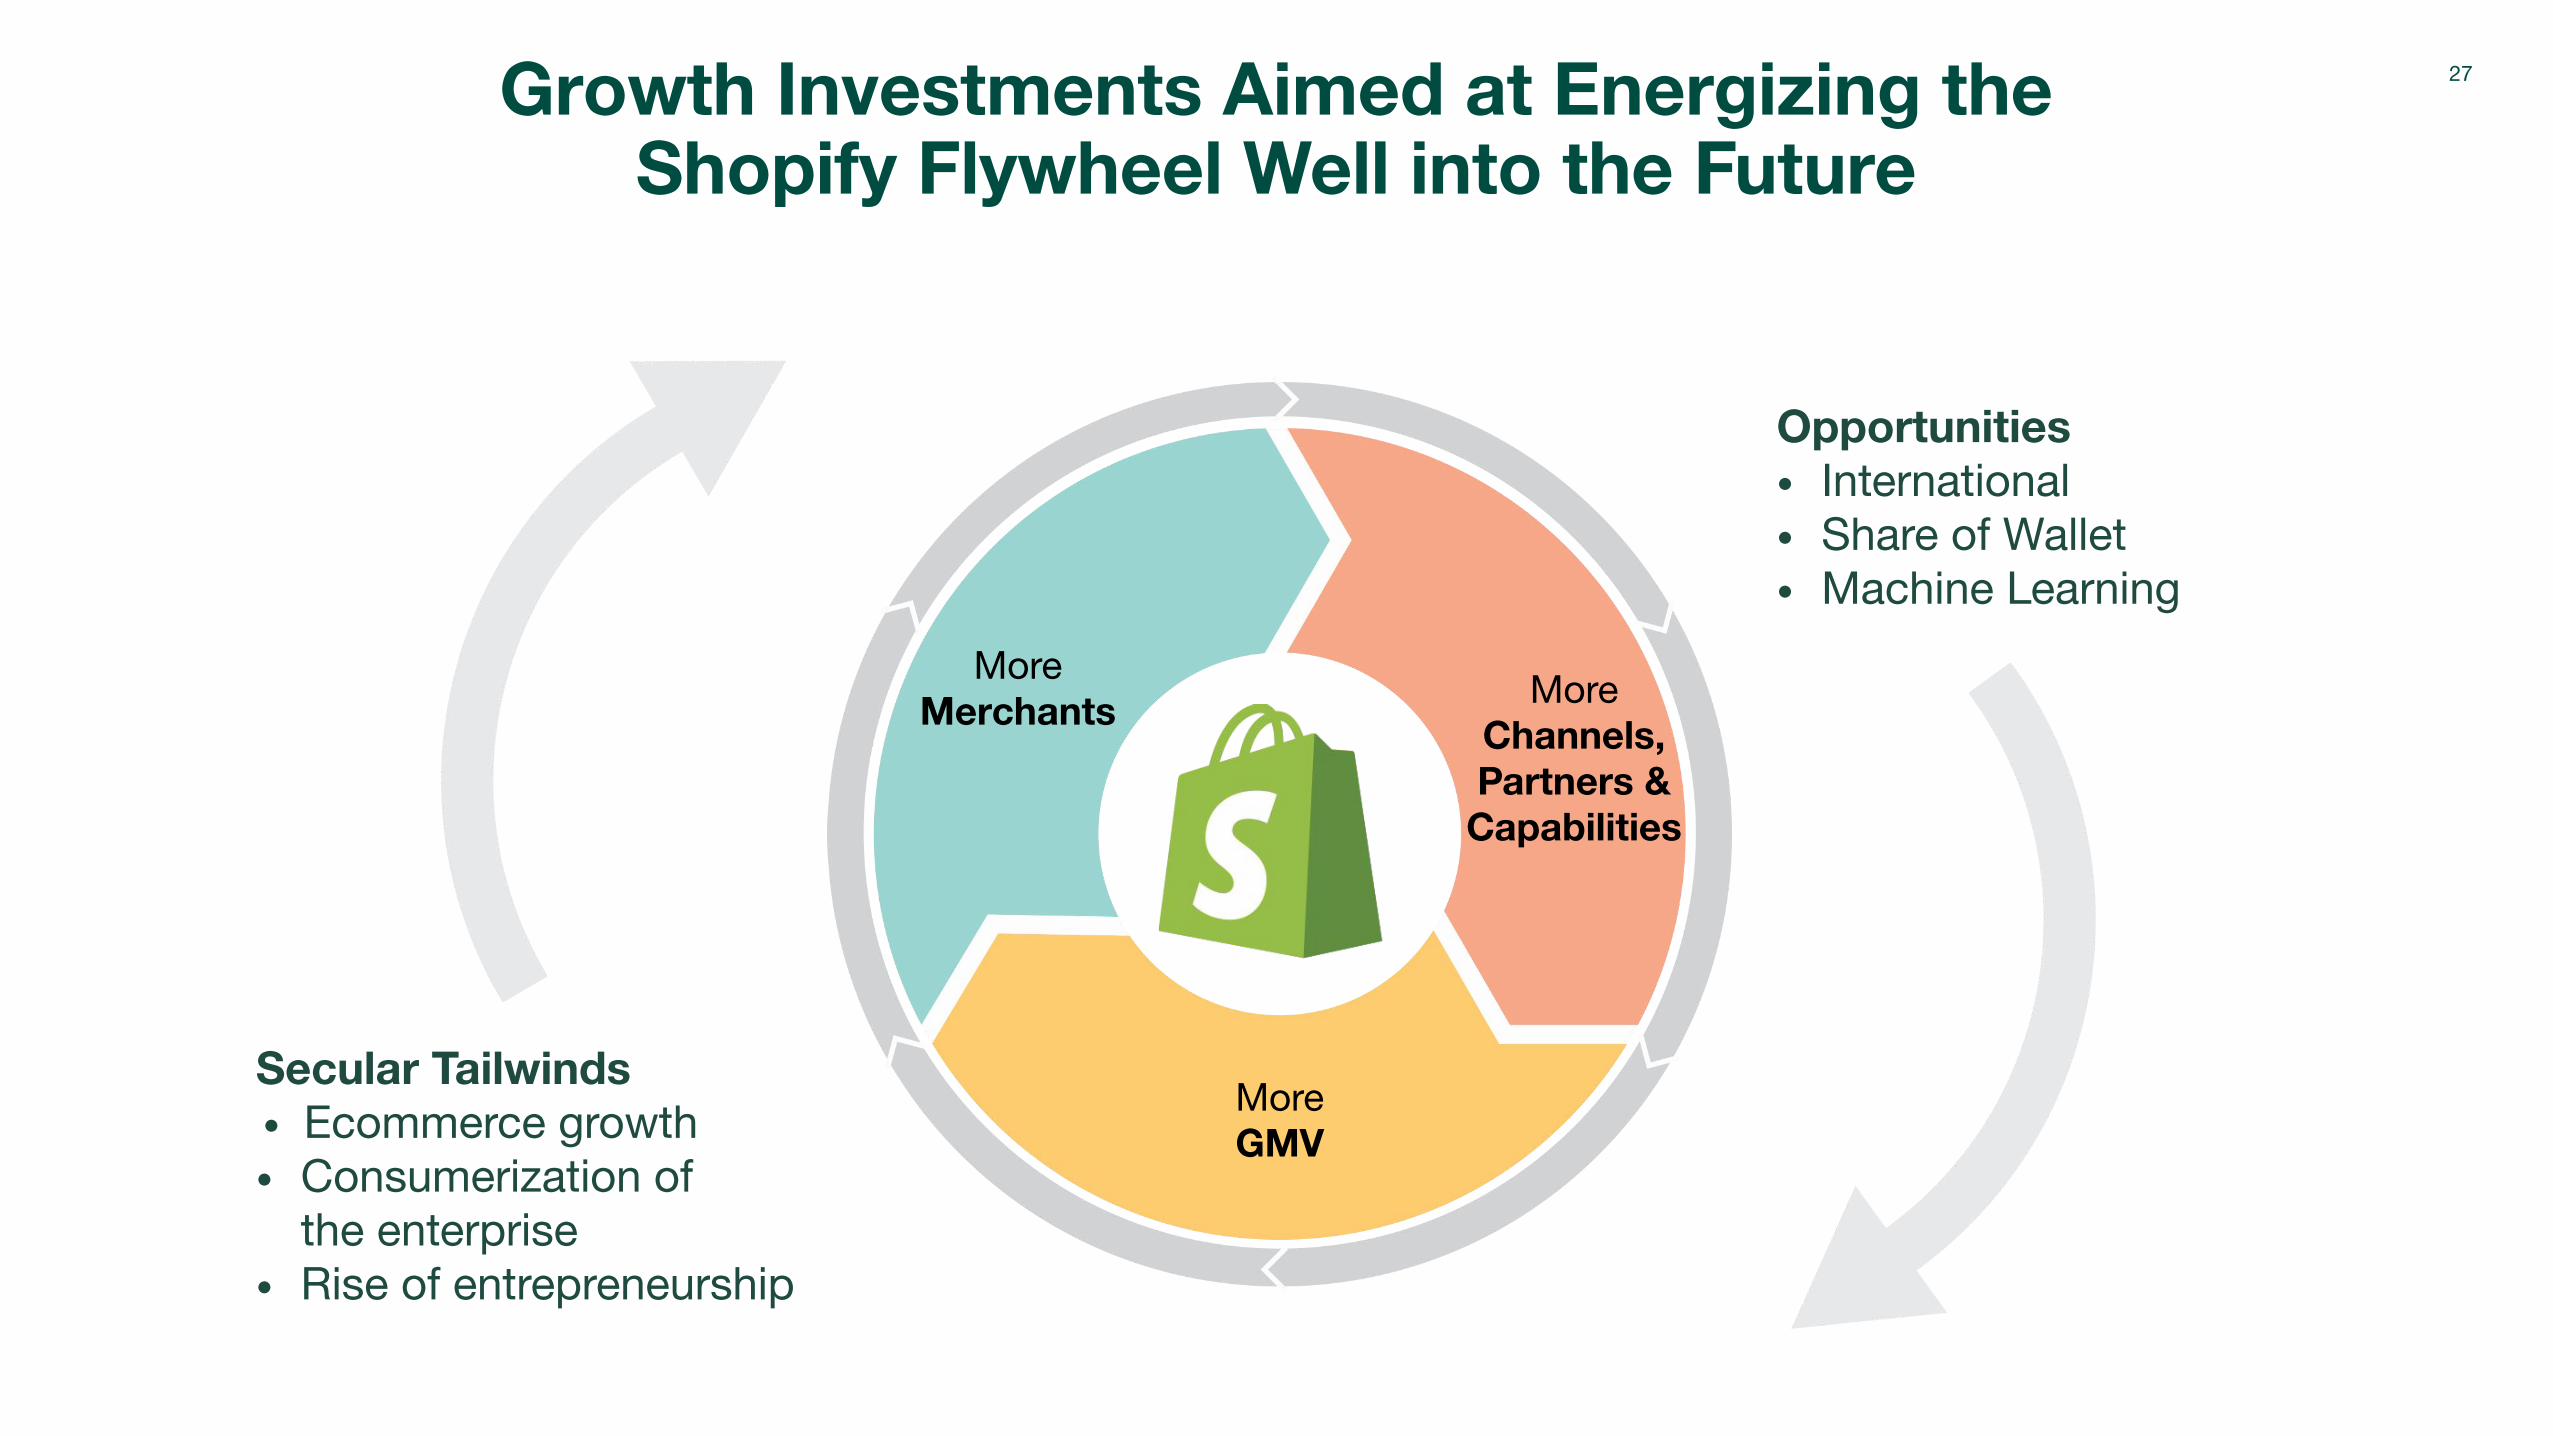
Growth Investments Aimed at Energizing the Shopify Flywheel Well into the Future
Secular Tailwinds• Ecommerce growth• Consumerization of
the enterprise• Rise of entrepreneurship
Opportunities• International• Share of Wallet• Machine Learning
More Merchants More
Channels, Partners &
Capabilities
More GMV
27
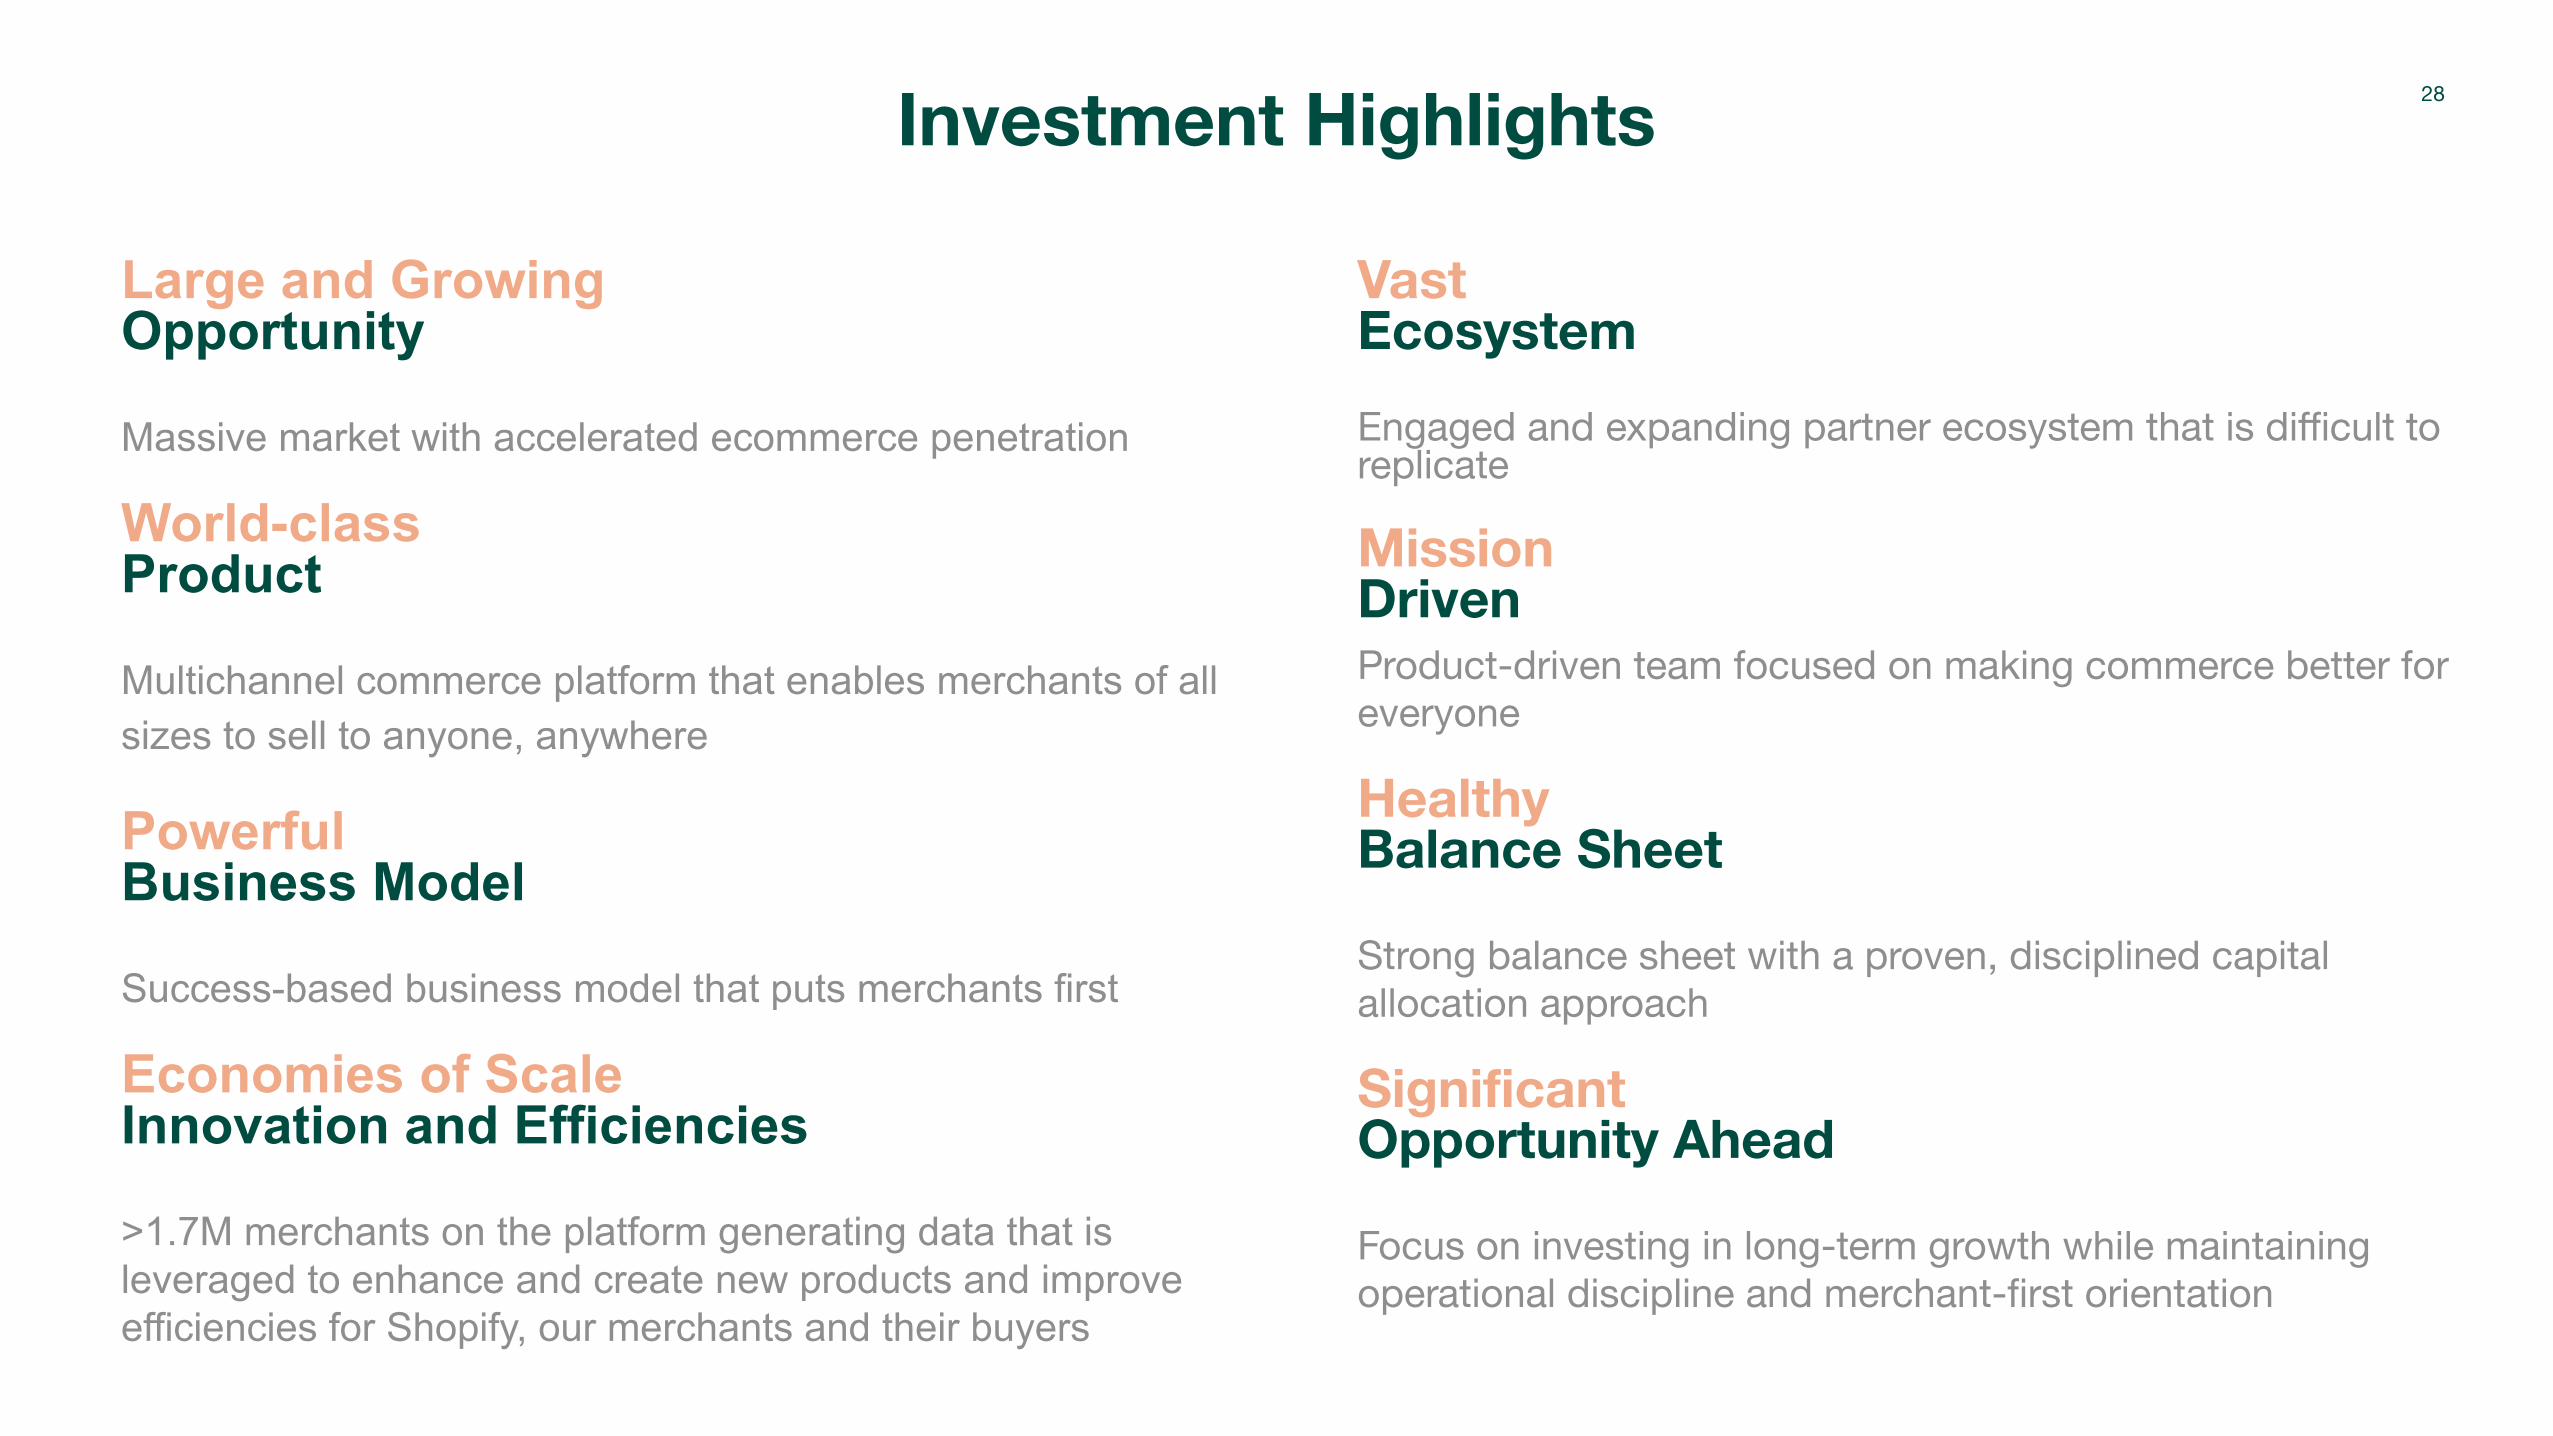
Investment Highlights
Large and GrowingOpportunity
Massive market with accelerated ecommerce penetration
World-classProduct
Multichannel commerce platform that enables merchants of all sizes to sell to anyone, anywhere
Powerful Business Model
Success-based business model that puts merchants first
Economies of Scale Innovation and Efficiencies
>1.7M merchants on the platform generating data that is leveraged to enhance and create new products and improve efficiencies for Shopify, our merchants and their buyers
VastEcosystem
Engaged and expanding partner ecosystem that is difficult to replicate
Mission DrivenProduct-driven team focused on making commerce better for everyone
Healthy Balance Sheet
Strong balance sheet with a proven, disciplined capital allocation approach
Significant Opportunity Ahead
Focus on investing in long-term growth while maintaining operational discipline and merchant-first orientation
28

Make commerce better for everyone.

Appendix
Non-GAAP Financial Measures
To supplement our consolidated financial statements, which are prepared and presented in accordance with United States generally accepted accounting principles
("GAAP"), Shopify uses certain non-GAAP financial measures to provide additional information in order to assist investors in understanding our financial and operating
performance.
Adjusted gross profit and non-GAAP operating expenses are non-GAAP financial measures that exclude the effect of stock-based compensation expenses and
related payroll taxes, amortization of acquired intangibles and, in the case of non-GAAP operating expenses, a real estate-related impairment charge.
Management uses non-GAAP financial measures internally for financial and operational decision-making and as a means to evaluate period-to-period comparisons.
Shopify believes that these non-GAAP measures provide useful information about operating results, enhance the overall understanding of past financial performance
and future prospects, and allow for greater transparency with respect to key metrics used by management in its financial and operational decision making. Non-GAAP
financial measures are not recognized measures for financial statement presentation under U.S. GAAP and do not have standardized meanings, and may not be
comparable to similar measures presented by other public companies. Such non-GAAP financial measures should be considered as a supplement to, and not as a
substitute for, or superior to, the corresponding measures calculated in accordance with GAAP. See the financial tables below for a reconciliation of the non-GAAP
measures.
October 2021
31
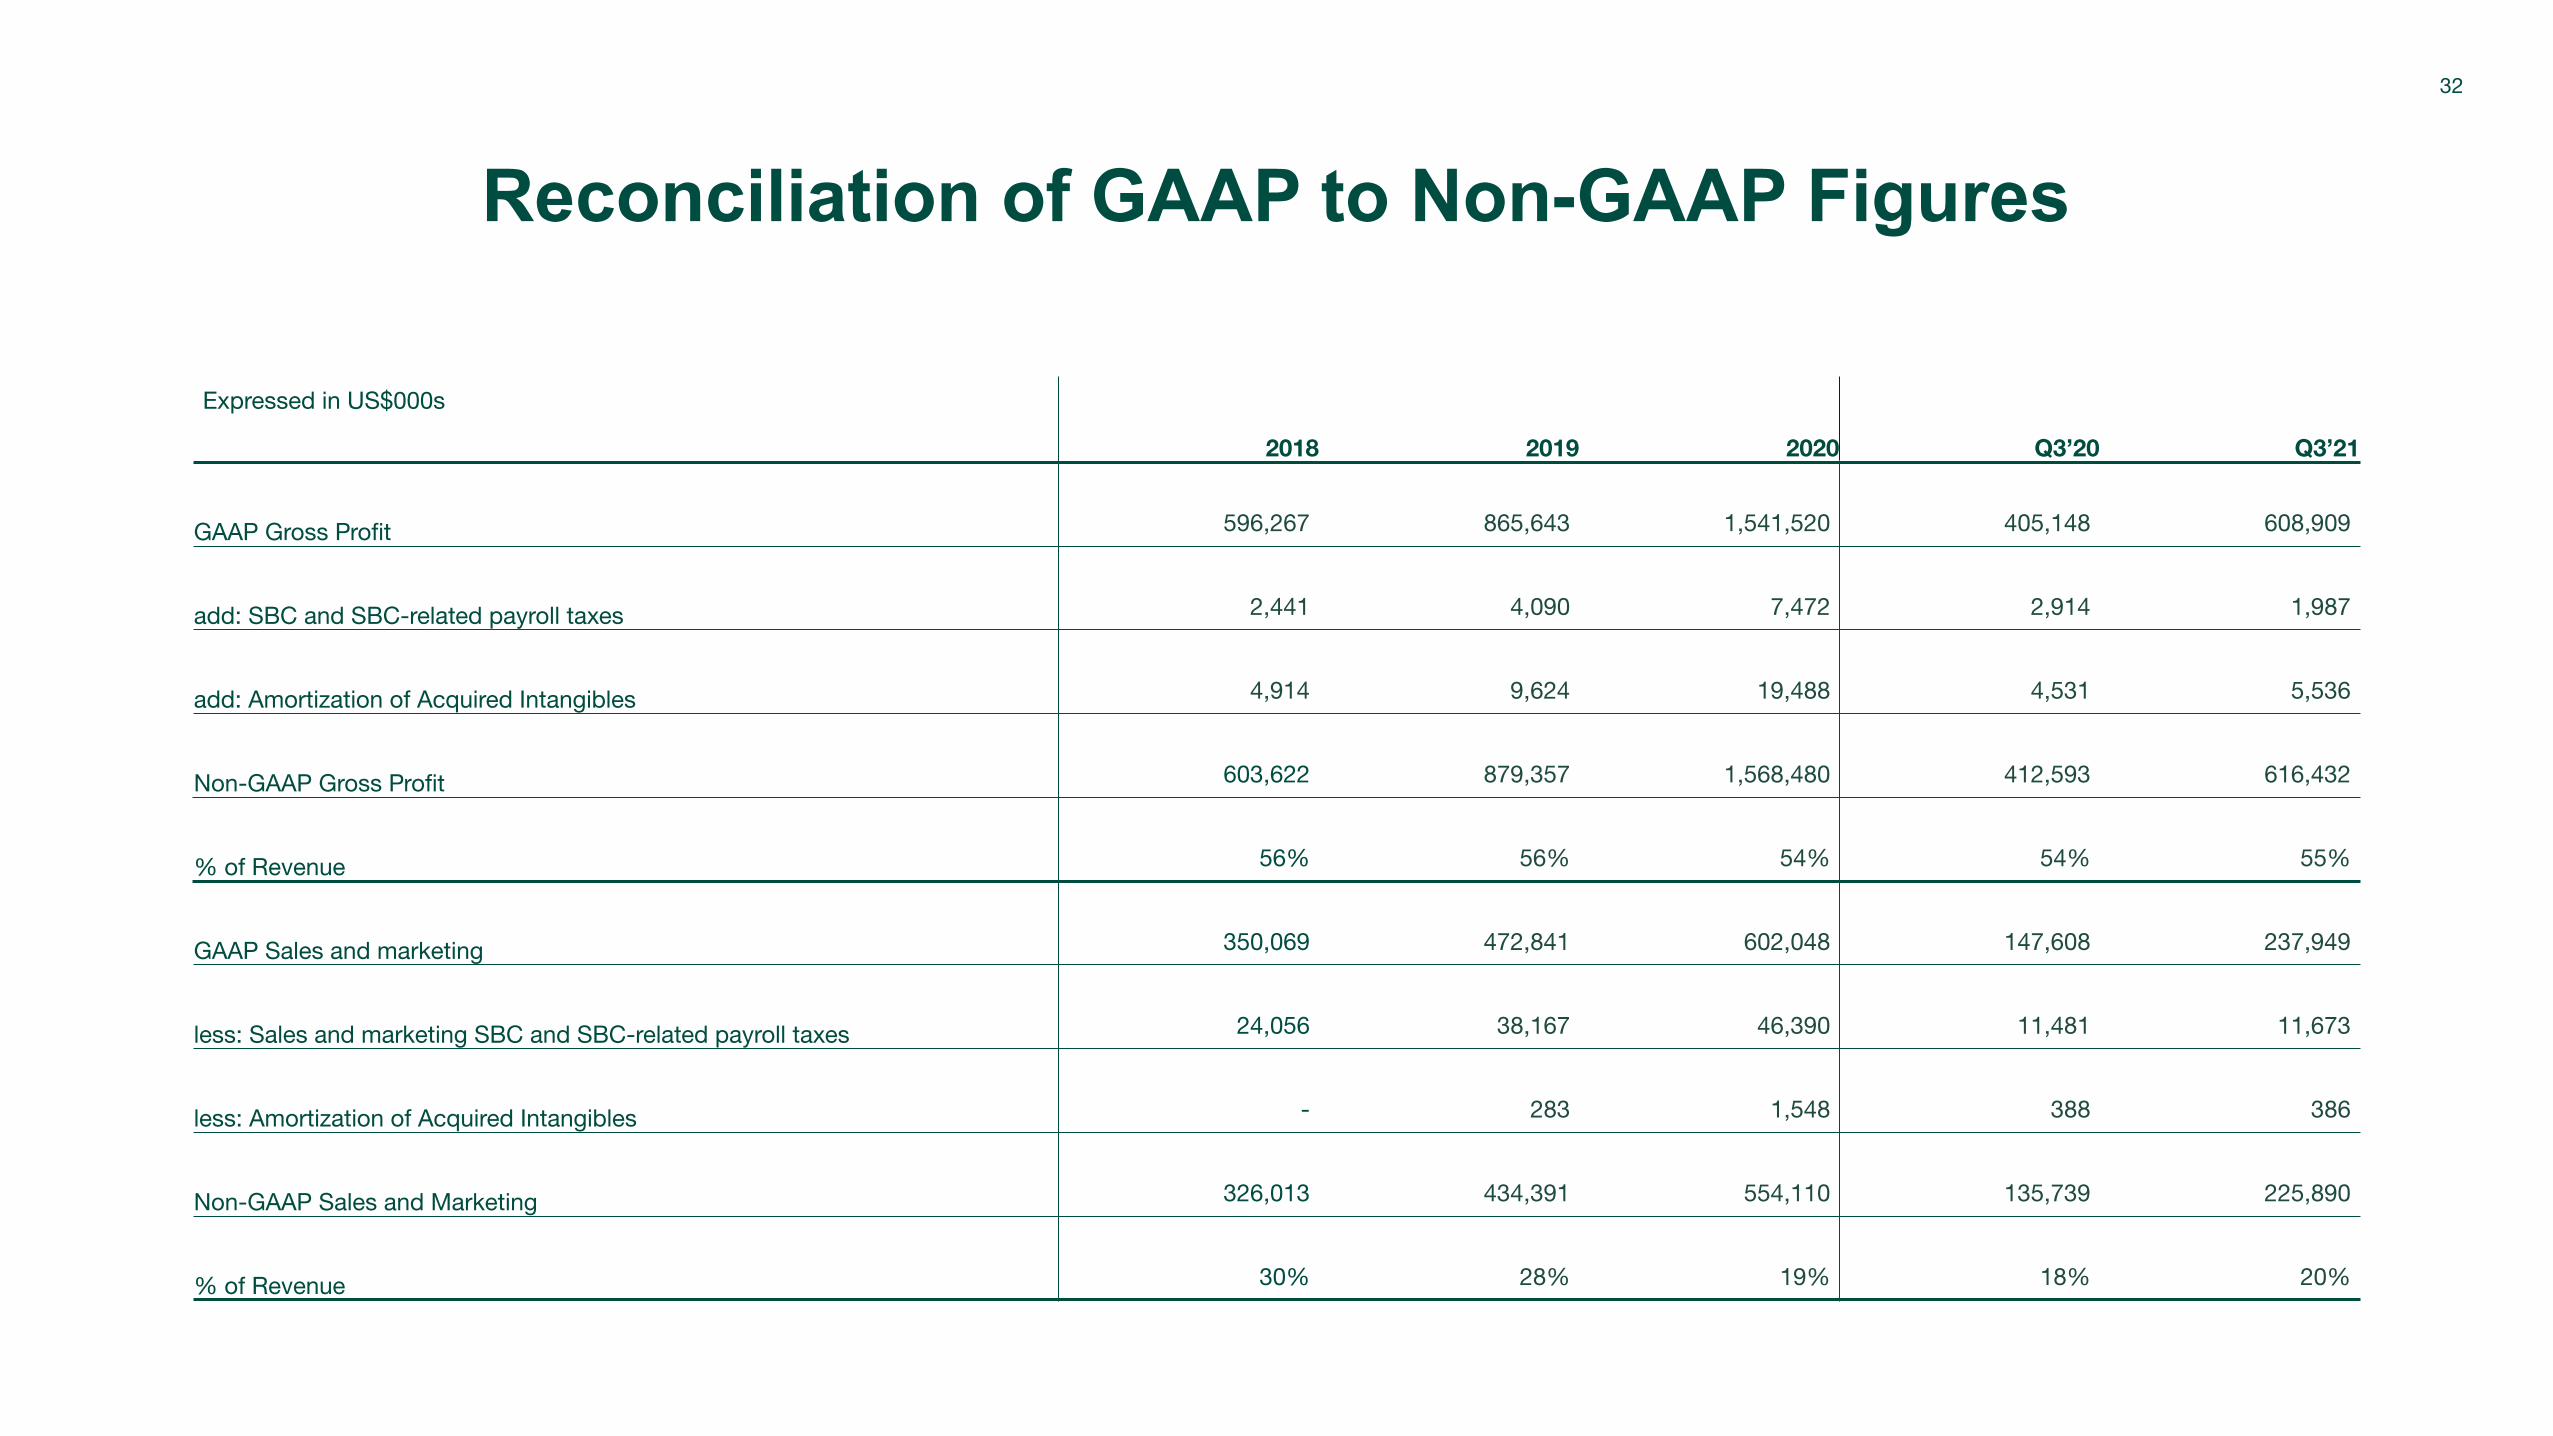
Reconciliation of GAAP to Non-GAAP Figures
Expressed in US$000s
2018 2019 2020 Q3’20 Q3’21
GAAP Gross Profit 596,267 865,643 1,541,520 405,148 608,909
add: SBC and SBC-related payroll taxes 2,441 4,090 7,472 2,914 1,987
add: Amortization of Acquired Intangibles 4,914 9,624 19,488 4,531 5,536
Non-GAAP Gross Profit 603,622 879,357 1,568,480 412,593 616,432
% of Revenue 56% 56% 54% 54% 55%
GAAP Sales and marketing 350,069 472,841 602,048 147,608 237,949
less: Sales and marketing SBC and SBC-related payroll taxes 24,056 38,167 46,390 11,481 11,673
less: Amortization of Acquired Intangibles - 283 1,548 388 386
Non-GAAP Sales and Marketing 326,013 434,391 554,110 135,739 225,890
% of Revenue 30% 28% 19% 18% 20%
32
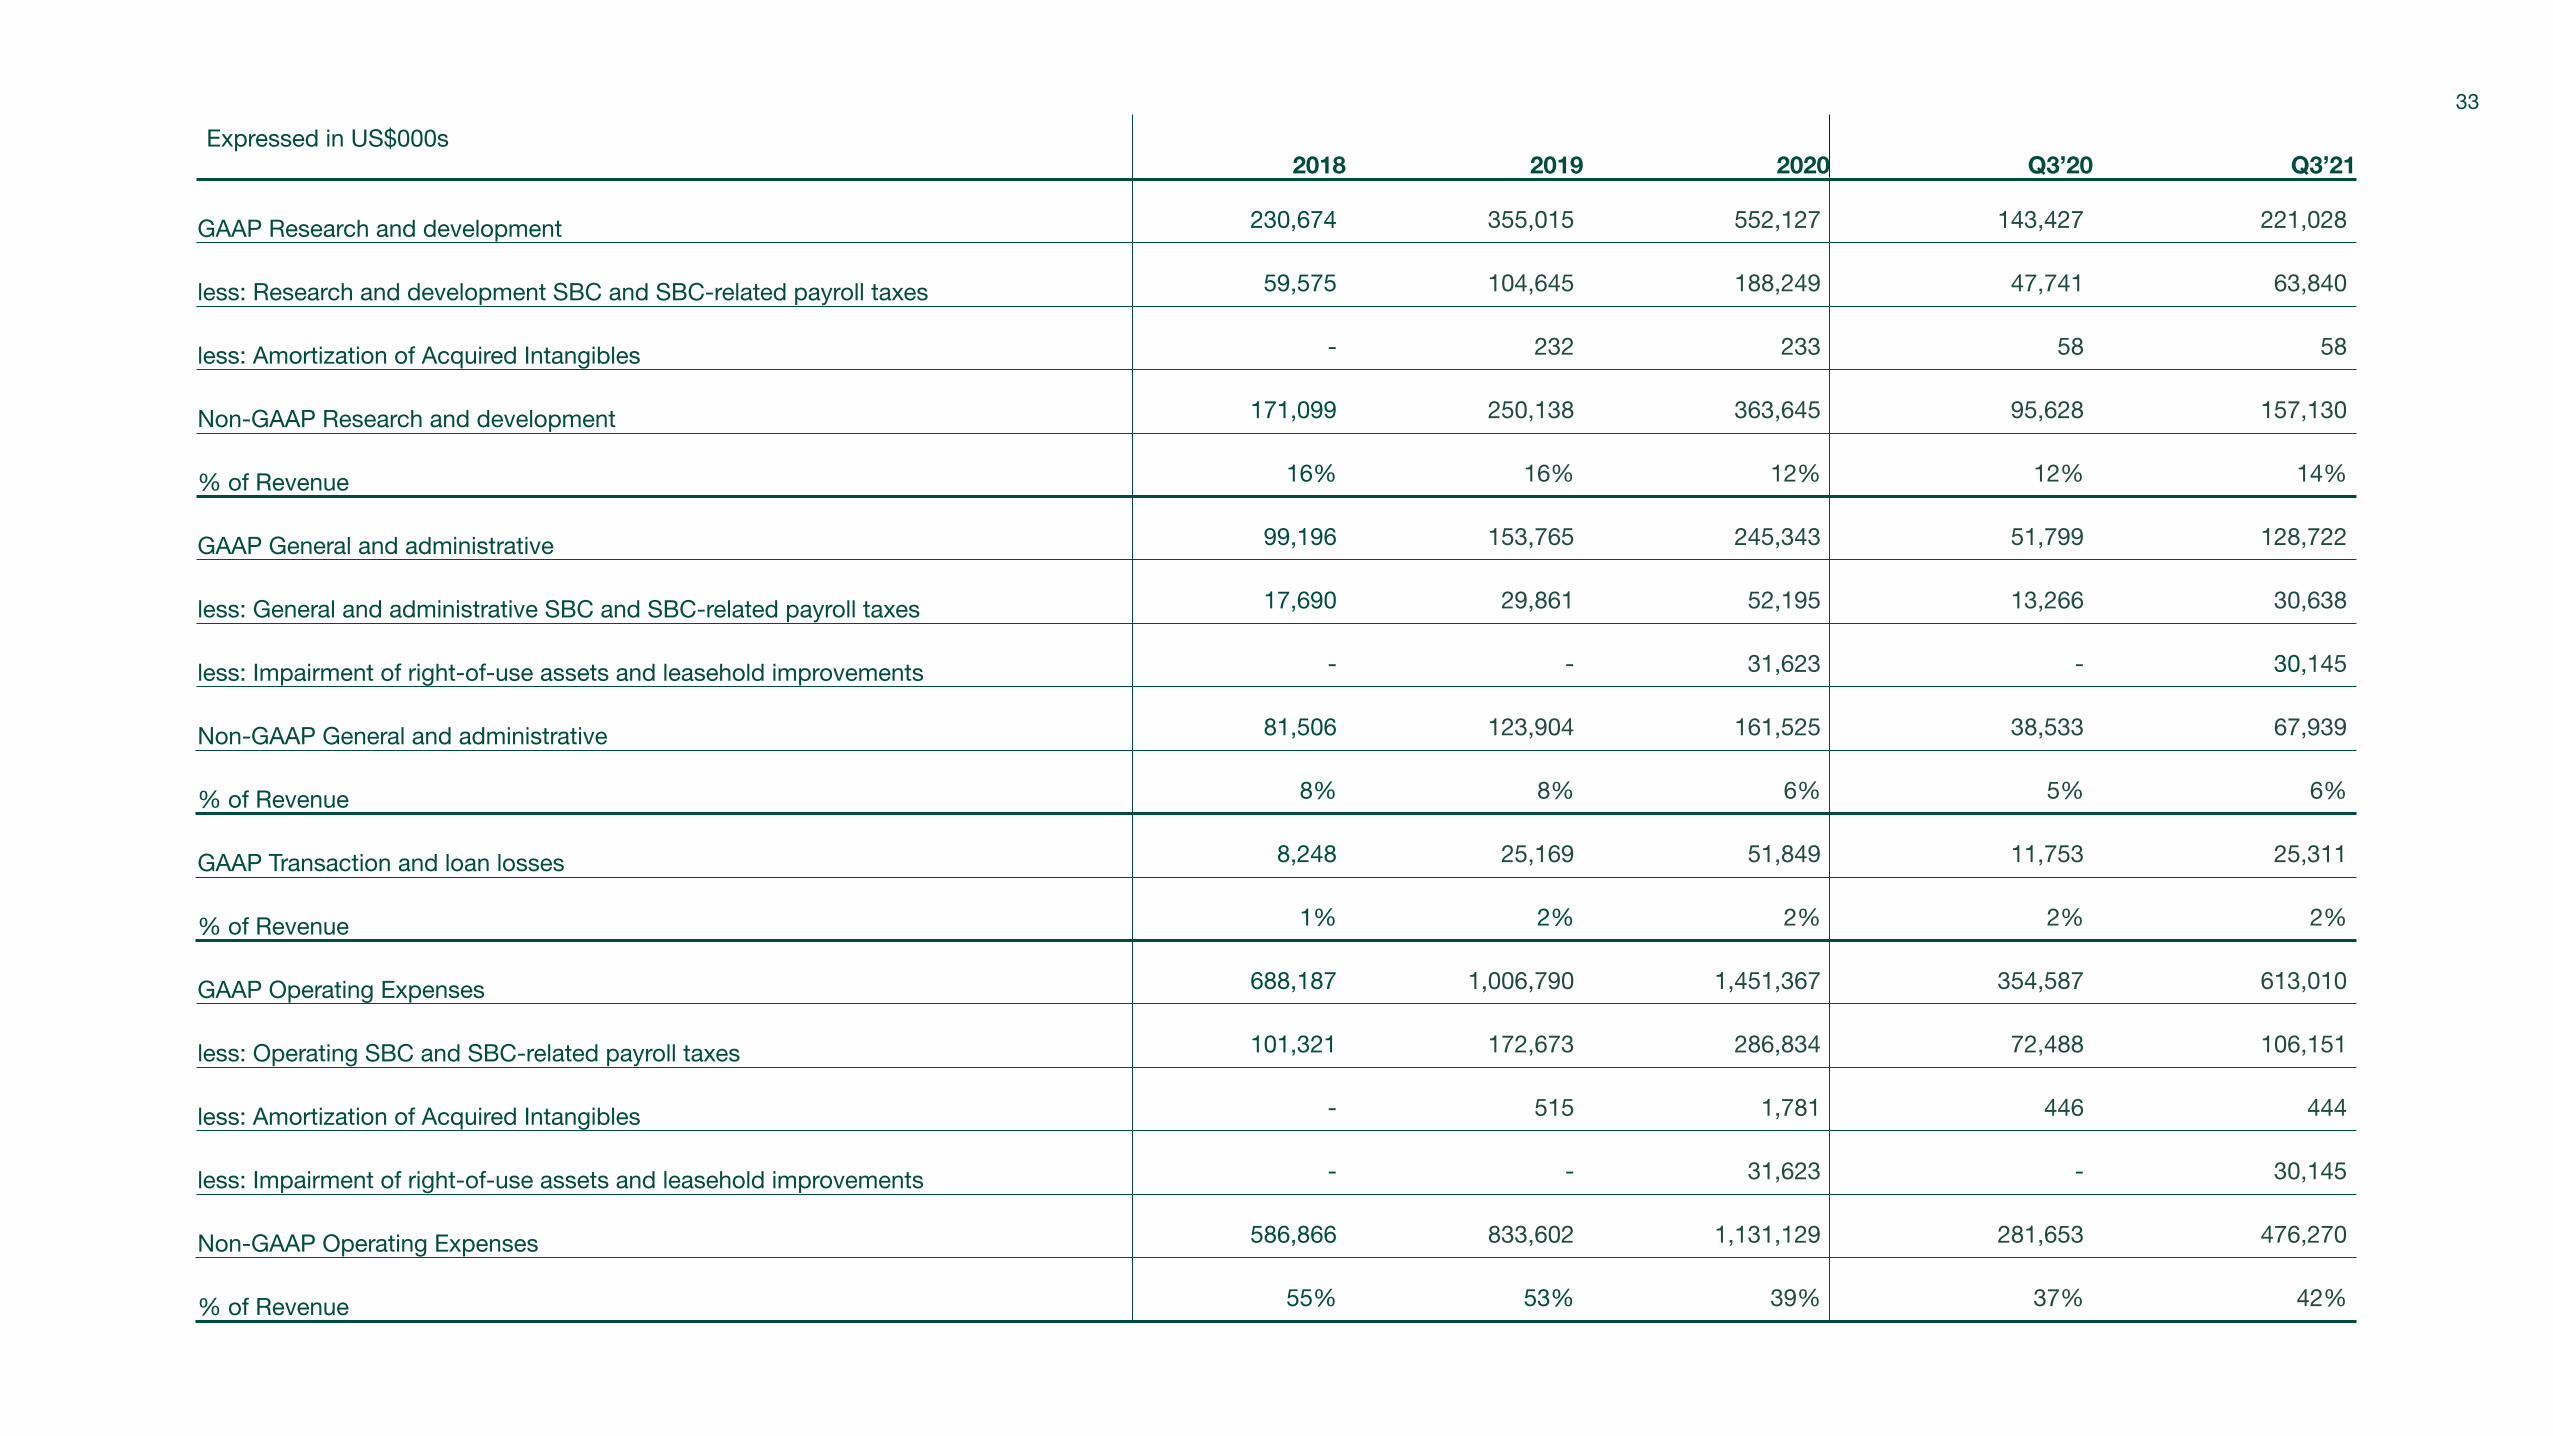
Expressed in US$000s2018 2019 2020 Q3’20 Q3’21
GAAP Research and development 230,674 355,015 552,127 143,427 221,028
less: Research and development SBC and SBC-related payroll taxes 59,575 104,645 188,249 47,741 63,840
less: Amortization of Acquired Intangibles - 232 233 58 58
Non-GAAP Research and development 171,099 250,138 363,645 95,628 157,130
% of Revenue 16% 16% 12% 12% 14%
GAAP General and administrative 99,196 153,765 245,343 51,799 128,722
less: General and administrative SBC and SBC-related payroll taxes 17,690 29,861 52,195 13,266 30,638
less: Impairment of right-of-use assets and leasehold improvements - - 31,623 - 30,145
Non-GAAP General and administrative 81,506 123,904 161,525 38,533 67,939
% of Revenue 8% 8% 6% 5% 6%
GAAP Transaction and loan losses 8,248 25,169 51,849 11,753 25,311
% of Revenue 1% 2% 2% 2% 2%
GAAP Operating Expenses 688,187 1,006,790 1,451,367 354,587 613,010
less: Operating SBC and SBC-related payroll taxes 101,321 172,673 286,834 72,488 106,151
less: Amortization of Acquired Intangibles - 515 1,781 446 444
less: Impairment of right-of-use assets and leasehold improvements - - 31,623 - 30,145
Non-GAAP Operating Expenses 586,866 833,602 1,131,129 281,653 476,270
% of Revenue 55% 53% 39% 37% 42%
33