Embed Size (px)
Citation preview

October 21, 2021
Q3 2021 – Supplemental Information

Forward-Looking Statements
This presentation contains forward-looking statements within the meaning of the Private Securities Litigation Reform Act of 1995 that reflect the current views of BankUnited, Inc. (“BankUnited,” “BKU” or the “Company”) with respect to, among other things, future events and financial performance. The Company generally identifies forward-looking statements by terminology such as “outlook,” “believes,” “expects,” “potential,” “continues,” “may,” “will,” “could,” “should,” “seeks,” “approximately,” “predicts,” “intends,” “plans,” “estimates,” “anticipates,” "forecasts" or the negative version of those words or other comparable words. Any forward-looking statements contained in this presentation are based on the historical performance of the Company and its subsidiaries or on the Company’s current plans, estimates and expectations. The inclusion of this forward-looking information should not be regarded as a representation by the Company that the future plans, estimates or expectations contemplated by the Company will be achieved. Such forward-looking statements are subject to various risks and uncertainties and assumptions, including (without limitations) those relating to the Company’s operations, financial results, financial condition, business prospects, growth strategy and liquidity, including as impacted by the COVID-19 pandemic. If one or more of these or other risks or uncertainties materialize, or if the Company’s underlying assumptions prove to be incorrect, the Company’s actual results may vary materially from those indicated in these statements. These factors should not be construed as exhaustive. The Company does not undertake any obligation to publicly update or review any forward-looking statement, whether as a result of new information, future developments or otherwise. A number of important factors could cause actual results to differ materially from those indicated by the forward-looking statements. Information on these factors can be found in the Company’s Annual Report on Form 10-K for the year ended December 31, 2020 and any subsequent Quarterly Report on Form 10-Q or Current Report on Form 8-K, which are available at the SEC’s website (www.sec.gov).
2

Financial Highlights

Strong Quarterly Results; Improving Credit Metrics
4
Operating results
Continued
improvement in
deposit mix
Asset Quality
Robust capital
levels
• EPS for the quarter of $0.94
• Annualized ROE for the nine months ended September 30 of 12.4% and ROA of 1.09%
• Net interest income declined by $3 million linked quarter, increased by $8 million compared to
Q3 2020
• NIM of 2.33% compared to 2.37% for the prior quarter, impacted by pressure on asset yields,
reduced PPP fee recognition
• Recovery of credit losses of $(11.8) million
• Strong residential loan growth
• Non-interest DDA grew by $324 million for the quarter, improving to 33% of total deposits• Average non-interest DDA up $2.7 billion compared to Q3 2020
• Average total cost of deposits declined to 0.20% for the quarter• “Spot” APY on total deposits was 0.19% at September 30, 2021
• Total criticized and classified loans declined by $240 million
• Loans on short-term deferral and CARES Act Modifications down $212 million in total from June
30
• NPAs declined; NPA ratio improved to 0.80% from 0.83%
• The Company's Board authorized the repurchase of up to an additional $150 million in shares of common stock. During Q3 2020, we repurchased $129 million of common stock.
• CET1 ratios of 13.4% at the holding company and 14.9% at the bank at September 30, 2021
• Book value per share grew to $34.39 and tangible book value grew to $33.53 at September 30, 2021.

Highlights from Third Quarter Earnings
5
Key Highlights
Primarily lower gains on investment securities
35% YoY non-interest DDA growth.
Spot APY on total deposits declined to 0.19% at September 30, 2021
Impacted by pressure on asset yields; lower PPP fee recognition
(1) PPNR is a non-GAAP financial measure. See section entitled “Non-GAAP Financial Measures” on page 30(2) Includes guaranteed portion of non-accrual SBA loans.(3) Annualized
($ in millions, except per share data) Q3 21 Q2 21 Q3 20 Q2 21 Q3 20
Net Interest Income $195 $198 $187 ($3) $8
Provision for (Recovery of) Credit Losses ($12) ($28) $29 $16 ($41)
Total Non-interest Income $25 $33 $36 ($7) ($11)
Total Non-interest Expense $118 $118 $109 ($0) $9
Net Income $87 $104 $67 ($17) $20
EPS $0.94 $1.11 $0.70 ($0.17) $0.24
Pre-Provision, Net Revenue (PPNR) (1) $103 $113 $115 ($10) ($13)
Period-end Loans $22,808 $22,885 $23,779 ($77) ($971)
Period-end Non-interest DDA $9,158 $8,834 $6,790 $324 $2,369
Period-end Deposits $28,116 $28,609 $26,597 ($493) $1,519
CET1 13.4% 13.5% 12.2% (0.10%) 1.2%
Total Capital 15.3% 15.4% 14.3% (0.10%) 1.0%
Yield on Loans 3.45% 3.59% 3.61% (0.14%) (0.16%)
Cost of Deposits 0.20% 0.25% 0.57% (0.05%) (0.37%)
Net Interest Margin 2.33% 2.37% 2.32% (0.04%) 0.01%
Non-performing Assets to Total Assets (2) 0.80% 0.83% 0.58% (0.03%) 0.22%
Allowance for Credit Losses to Total
Loans0.70% 0.77% 1.15% (0.07%) (0.45%)
Net Charge-offs to Average Loans(3) 0.19% 0.24% 0.25% (0.05%) (0.06%)
Change From

Continuing to Transform our Deposit mix($ in millions)
6
$6,335 $6,820 $7,347$4,807
$2,978 $3,229
$10,715 $11,262 $10,622$12,660
$13,579 $12,460
$1,758$1,771 $2,131 $3,020 $3,218 $3,269
$3,071$3,621 $4,295
$7,009 $8,834 $9,158$21,879$23,474 $24,395
$27,496 $28,609 $28,116
12/31/17 12/31/18 12/31/19 12/31/20 6/30/21 9/30/21
Non-interest Demand
Interest Demand
Money Market / Savings
Time
Non-interest bearing demand deposits have grown at a compound annual growth rate of 54% since
December 31, 2019
Quarterly Cost of
Deposits0.94% 1.52% 1.48% 0.43% 0.25% 0.20%
Non-interest bearing as
% of Total Deposits14.0% 15.4% 17.6% 25.5% 30.9% 32.6%
We have consistently priced down our deposit portfolio since the Fed began lowering interest rates in late 2019
Spot Average Annual
Percentage Yield (“APY”)
At December
31, 2019
At March 31,
2020
At June 30,
2020
At September
30, 2020
At December
31, 2020
At March 31,
2021
At June 30,
2021
At September
30, 2021
Total non-maturity deposits 1.11% 0.83% 0.44% 0.37% 0.29% 0.24% 0.20% 0.18%
Total interest-bearing
deposits1.71% 1.35% 0.82% 0.65% 0.48% 0.36% 0.30% 0.27%
Total deposits 1.42% 1.12% 0.65% 0.49% 0.36% 0.27% 0.22% 0.19%

Prudently Underwritten and Well-DiversifiedLoan PortfolioAt September 30, 2021 ($ in millions)
7
Loan Portfolio Over Time CRE C&I
Lending SubsResidential Loan
Product Type
$4,949$5,661
$6,348$7,076
$7,827
$7,501$7,493
$6,896$6,200
$5,883
$6,478$6,718 $6,448 $6,167
$6,179
$782$492
$333
$432
$768
$1,259$1,018 $877$2,617
$2,515
$2,133
$1,932 $1,709
$21,977
$23,155$23,866
$22,885 $22,808
12/31/18 12/31/19 12/31/20 6/30/21 9/30/21
Residential CRE C&I PPP Mortgage Warehouse Lending Lending Subs
Non-owner Occupied
77%
Multi-family20%
Construction and Land
3%
Commercial and Industrial
64%
Owner Occupied
31%
SBA PPP5%
Pinnacle55%
Bridge -Franchise
23%
Bridge -Equipment
22%30 Yr Fixed
24%
15 & 20 Year Fixed
12%10/1 ARM14%
5/1 & 7/1 ARM26%
Formerly Covered
3%
Govt Insured
21%
PPP
UPB
Deferred
Origination Fees
Amortized
Cost
First Draw Program 49$ -$ 49$
Second Draw Program 292 (8) 284
341$ (8)$ 333$

Allowance for Credit Losses

CECL Methodology
9
Underlying Principles Economic Forecast Key Variables
• The ACL under CECL represents
management’s best estimate at the
balance sheet date of expected credit
losses over the life of the loan
portfolio.
• Required to consider historical
information, current conditions and a
reasonable and supportable
economic forecast.
• For most portfolio segments,
BankUnited uses econometric models
to project PD, LGD and expected
losses at the loan level and
aggregates those expected losses by
segment.
• Qualitative adjustments may be
applied to the quantitative results.
• Accounting standard requires an
estimate of expected prepayments
which may significantly impact the
lifetime loss estimate.
• Our ACL estimate was informed by
Moody’s economic scenarios
published in September 2021.
• Unemployment at 4.5% for
Q4 2021, steadily declining to
3.4% through end of 2022.
• Annualized growth in GDP at
7.5% for Q4 2021, normalizing
to an average of 2.5% through
2022.
• VIX trending at stabilized
levels through the forecast
horizon.
• S&P 500 averaging 4,000
through the R&S period.
• 2 year reasonable and supportable
forecast period.
• The models ingest numerous national,
regional and MSA level economic
variables and data points. Economic
data and variables to which portfolio
segments are most sensitive:
• Commercial
o Market volatility index
o S&P 500 index
o Unemployment rate
o A variety of interest rates
and spreads
• CRE
o Unemployment
o CRE property forecast
o 10-year treasury
o Baa corporate yield
o Real GDP growth
• Residential
o HPI
o Unemployment rate
o Real GDP growth
o Freddie Mac 30-year rate

Drivers of Change in the ACL
10
ACL
6/30/21
ACL
9/30/21
Net
Portfolio
MigrationPortfolio and
Assumption
ChangesEconomic
ForecastNet Charge-
Offs
Change in
Qualitative
Overlay
($ in millions)
% of Total
Loans0.77% 0.70%
• Risk rating
migration
• Changes
in specific
reserves
• New loans
• Exits/runoff
• Portfolio
seasoning
• Current
market
adjustment
• Changes to
forward
path of
economic
forecast
• Primarily
reduction in
qualitative
overlay for
borrowers
impacted
by COVID-
19

Allocation of the ACL
11
($ in millions)
(1) Non-performing loans and assets include the guaranteed portion of non-accrual SBA loans totaling $49.1 million, $47.7 million, and $51.3 million or 0.22%, 0.21%, and 0.22%, of total loans and 0.14%, 0.13%, and 0.15% of total assets, at September 30, 2021, June 30, 2021, and December 31, 2020.
(2) ACL to total loans, excluding government insured residential loans, PPP loans and MWL, which carry nominal or no reserves, was 0.81%, 0.90% and 1.26% at September 30, 2021, June 30, 2021, and December 31, 2020, respectively. See section entitled “Non-GAAP Financial Measures” on page 31.
(3) The increase in non-performing loans to total loans and non-performing assets to total assets at June 30, 2021 was primarily attributable to one $69 million commercial and industrial relationship.
(4) Annualized for the periods ended June 30, 2021 and September 30, 2021.
Balance % of Loans Balance % of Loans Balance % of Loans
Residential and other consumer 18.7$ 0.29% 11.9$ 0.17% 9.5$ 0.12%
Commercial:
Commercial real estate 104.6 1.52% 44.1 0.71% 30.6 0.52%
Commercial and industrial 91.0 1.07% 98.6 1.28% 101.6 1.37%
Pinnacle 0.3 0.03% 0.2 0.02% 0.2 0.02%
Franchise finance 36.3 6.61% 15.6 3.37% 13.6 3.43%
Equipment finance 6.4 1.34% 5.2 1.23% 4.1 1.09%
Total commercial 238.6 1.36% 163.7 1.04% 150.1 1.00%
Allowance for credit losses(2)257.3$ 1.08% 175.6$ 0.77% 159.6$ 0.70%
December 31, 2020 September 30, 2021June 30, 2021
Asset Quality Ratios December 31, 2020 June 30, 2021 September 30, 2021
Non-performing loans to total loans (1)(3)1.02% 1.28% 1.21%
Non-performing assets to total assets (1)(3)0.71% 0.83% 0.80%
Allowance for credit losses to non-performing loans (1)105.26% 60.02% 57.69%
Net charge-offs to average loans (4)0.26% 0.24% 0.19%

Loan Portfolio and Credit

Loan Portfolio – Geographic DistributionAt September 30, 2021
Commercial (1) Residential
CRE
(1) Includes PPP, MWL, BFG and Pinnacle
FL39%
NY Tri-State Area21%
Other40%
13
CA33%
FL8%
NY21%
Other38%
FL56%
NY Tri-State Area34%
Other10%
14
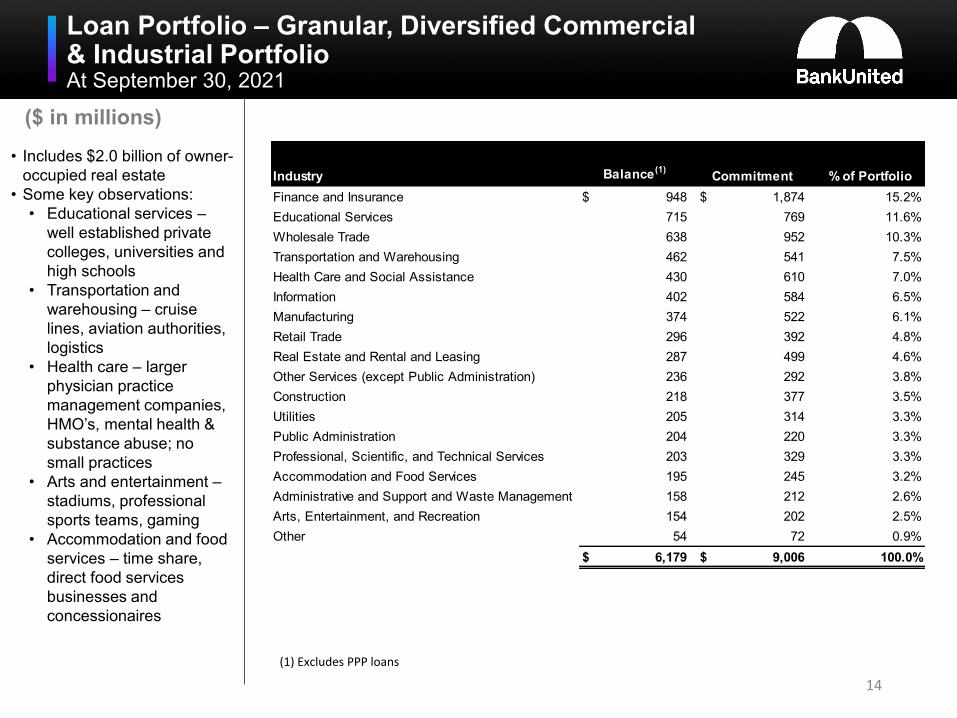
Loan Portfolio – Granular, Diversified Commercial& Industrial PortfolioAt September 30, 2021
($ in millions)
• Includes $2.0 billion of owner-
occupied real estate
• Some key observations:
• Educational services –
well established private
colleges, universities and
high schools
• Transportation and
warehousing – cruise
lines, aviation authorities,
logistics
• Health care – larger
physician practice
management companies,
HMO’s, mental health &
substance abuse; no
small practices
• Arts and entertainment –
stadiums, professional
sports teams, gaming
• Accommodation and food
services – time share,
direct food services
businesses and
concessionaires
(1) Excludes PPP loans
Industry Balance(1)Commitment % of Portfolio
Finance and Insurance 948$ 1,874$ 15.2%
Educational Services 715 769 11.6%
Wholesale Trade 638 952 10.3%
Transportation and Warehousing 462 541 7.5%
Health Care and Social Assistance 430 610 7.0%
Information 402 584 6.5%
Manufacturing 374 522 6.1%
Retail Trade 296 392 4.8%
Real Estate and Rental and Leasing 287 499 4.6%
Other Services (except Public Administration) 236 292 3.8%
Construction 218 377 3.5%
Utilities 205 314 3.3%
Public Administration 204 220 3.3%
Professional, Scientific, and Technical Services 203 329 3.3%
Accommodation and Food Services 195 245 3.2%
Administrative and Support and Waste Management 158 212 2.6%
Arts, Entertainment, and Recreation 154 202 2.5%
Other 54 72 0.9%
6,179$ 9,006$ 100.0%

Loan Portfolio – Commercial Real Estate by Property TypeAt September 30, 2021
Property Type Balance FL NY Tri State Other
Wtd. Avg.
DSCR
Wtd. Avg.
LTV
Non-
Performing
Office 1,860$ 61% 25% 14% 2.55 63.2% 5$
Multifamily 1,244 40% 55% 5% 1.75 60.8% 11
Retail 1,175 53% 38% 9% 1.52 70.2% 19
Warehouse/Industrial 901 62% 21% 17% 2.49 58.0% -
Hotel 572 75% 16% 9% 1.39 53.6% 22
Other 131 55% 29% 16% 2.09 56.0% 7
5,883$ 56% 34% 10% 2.04 62.2% 64$
• Commercial real estate loans are secured by income-producing, non-owner occupied properties,
typically with well capitalized middle market sponsors
• Construction and land loans, included in the table above by property type, represent less than 1%
of the total loan portfolio.
• All non-performing hotel loans are in the SBA portfolio.
• NY commercial Real Estate portfolio contains $132 million of mixed-used properties; $62 million
included in the table above in multi-family, $51 million in retail and $19 million in office.
($ in millions)
15

16
Loan Portfolio – Deferrals and ModificationsAt September 30, 2021
($ in millions)• Loans subject to
COVID related deferral
or modification under
the CARES Act totaled
$285 million or 1% of
the total loan portfolio at
September 30, 2021.
$17 million of these
loans, all residential,
were under short-term
deferral at September
30.
• Commercial CARES
Act modifications are
most often 9 to 12-
month interest only
periods.
• $415 million in
commercial loans have
rolled off of CARES Act
modification. 100% of
them have resumed
regular payments.
Balance % of loans Balance % of loans
Residential -excluding
government insured 41$ (1) 1% 467$ 95% 26$ 5%
CRE by Property Type:
Retail 16$ 1% 3$ 100% -$ -
Hotel 82 14% 262 100% - -
Office - - 45 - - -
Multifamily 7 1% 16 100% - -
Industrial - - - - - -
Other - - - - - -
Total CRE 105$ 2% 326$ 100% -$ -
C&I - Industry:
Accomm. and Food Services 31$ 16% -$ - -$ -
Retail Trade 32 11% 2 100% - -
Finance and Insurance 16 2% 2 100% - -
Other 32 3% 60 100% - -
Total C&I 111$ 2% 64$ 100% -$ -
BFG - Franchise 28$ 7% 25$ 100% -$ -
Total Commercial 244$ 2% 415$ 100% -$ -
Total 285$ 1% 882$ 97% 26$ 3%
Paid Off or Paying as Agreed Not Resumed Regular Payments
Loans That Have Rolled Off of Short-Term Deferral or CARES
Act Modification
Under Short
Term Deferral or
CARES Act
Modification as
of September 30,
2021
% of
Portfolio
(1) Includes $23 million in residential loans modified under the CARES act that are continuing to make payments.

Loan Portfolio – RetailAt September 30, 2021
($ in millions)
Retail - Commercial Real Estate
• No significant mall or “big
box” exposure
• $33 million and $18 million of
Retail-Unanchored and
Retail-Anchored,
respectively, are mixed-used
properties
Retail – Commercial & Industrial
17
Property Type Balance
Short-Term
Deferral or CARES
Modification
Non-Performing
Loans Special Mention Classified
Retail - Anchored 604$ 6$ 10$ 19$ 41$
Retail - Unanchored 523 10 9 - 171
Construction to Perm 4 - - - 4
Gas Station 22 - - - -
Restaurant 22 - - - 10
1,175$ 16$ 19$ 19$ 226$
Industry
Not Secured
by Real Estate
Owner
Occupied
Real Estate
Total
Balance
Short-Term
Deferral or CARES
Modification
Non-
Performing
Loans
Special
Mention Classified
Gasoline Stations 1$ 79$ 80$ -$ 1$ -$ 1$
Health and Personal Care Stores 14 6 20 12 - - 12
Furniture Stores 15 25 40 1 1 - 1
Vending Machine Operators 20 - 20 19 - - 20
Specialty Food Stores 1 11 12 - 2 - 2
Grocery Stores 2 17 19 - - - 1
Automobile Dealers 6 4 10 - - - -
Clothing Stores 1 10 11 - - - 3
Florists 11 - 11 - - - -
Other 27 46 73 - 3 - 8
98$ 198$ 296$ 32$ 7$ -$ 48$

Loan Portfolio – BFG Franchise FinanceAt September 30, 2021
($ in millions) Portfolio Breakdown by Concept
Portfolio Breakdown by Geography
CA22%
FL8%
TX9%GA
7%UT7%
Other47%
18
Balance
% of BFG
Franchise
Short-Term
Deferral or CARES
Modification
Non-Performing
Loans Special Mention Classified
Restaurant Concepts:
Burger King 55$ 13% -$ -$ -$ 21$
Popeyes 5 1% - - - -
Dunkin Donuts 19 5% - - - 15
Jimmy John's 14 4% - - - 3
Domino's 7 2% - - - -
Other 135 34% 25 27 - 51
235$ 59% 25$ 27$ -$ 90$
Non-Restaurant Concepts
Planet Fitness 87$ 22% -$ -$ -$ 49$
Orange Theory Fitness 52 13% 3 5 - 52
Other 23 6% - - - 4
162$ 41% 3$ 5$ -$ 105$

Loan Portfolio – HotelAt September 30, 2021
($ in millions)
• 75% of our exposure is in
Florida, followed by 16% in
New York
• Includes $53.8 million in
SBA loans
• All hotel properties in FL and
NY remain open
• Decline of $144 million of
hotel CARES Act
modifications during Q3
Exposure by Flag
Marriott$17030%
Independent$13223%
Others$10018%
Hilton$8515%
IHG$488%
Sheraton$376%
Total Portfolio: $572 million
19

Credit Quality – ResidentialAt September 30, 2021
High quality residential portfolio
consists of primarily prime jumbo
mortgages with de-minimis charge-
offs since inception as well as fully
government insured assets
FICO Distribution(1)
Breakdown by LTV(1) Breakdown by Vintage(1)
(1) Excludes government insured residential loans. FICOs are refreshed routinely. LTVs are typically based on valuation at origination.
<720 or NA10%
720-75918%
>75972%
60% or less35%
61% - 70%26%
71% - 80%38%
More than 80%1%
Prior26%
20177%
20184%
20197%
202019%
202137%
20

Asset Quality Metrics
Non-performing Loans to Total Loans (2) Non-performing Assets to Total Assets
Net Charge-offs to Average Loans(1)
(1) YTD net charge-offs, annualized at March 31, 2021, June 30, 2021 and September 30, 2021.
(2) The increase in non-performing loans to total loans and non-performing assets to total assets at June 30, 2021 was primarily attributable to one $69
million commercial and industrial relationship.
0.88%
1.02% 1.00%
1.28%1.21%
0.68%0.80% 0.79%
1.07%0.99%
0.00%
0.25%
0.50%
0.75%
1.00%
1.25%
12/31/19 12/31/20 3/31/21 6/30/21 9/30/21
Incl. guaranteed portion of non-accrual SBA loans
Excl. guaranteed portion of non-accrual SBA loans
0.63%0.71% 0.67%
0.83% 0.80%
0.49%0.56% 0.53%
0.70% 0.66%
0.00%
0.25%
0.50%
0.75%
1.00%
1.25%
12/31/19 12/31/20 3/31/21 6/30/21 9/30/21
Incl. guaranteed portion of non-accrual SBA loans
Excl. guaranteed portion of non-accrual SBA loans
21
0.05%
0.26%
0.17%
0.24%
0.19%
0.00%
0.20%
0.40%
0.60%
12/31/19 12/31/20 3/31/21 6/30/21 9/30/2021

Non-Performing Loans by Portfolio Segment
($ in millions)
(1) Includes the guaranteed portion of non-accrual SBA loans totaling $49.1 million, $47.7 million, $48.2 million, $51.3 million, and
$45.7 million at September 30, 2021, June 30, 2021, March 31, 2021, December 31, 2020, and December 31, 2019, respectively.
$19 $29 $26 $46
$33 $18
$36 $38
$27
$24 $6
$24 $13
$7
$11
$65
$43 $58
$119
$113 $21
$14
$45 $36
$33
$32
$62
$67 $63
$61
$64
$205
$244 $234
$293
$277
12/31/19 12/31/20 3/31/21 6/30/21 9/30/21
Residential and Other Consumer CRE Multifamily C&I Equipment Franchise SBA(1)
22

Criticized and Classified Loans($ in millions)
Commercial Real Estate Commercial & Industrial (1)
Franchise Finance Equipment Finance SBA(2)
(1) Substandard non-accruing and doubtful includes $16.4 million of loans rated doubtful at September 30, 2021.
(2) Includes the guaranteed portion of non-accrual SBA loans totaling $49.1 million, $47.7 million, $48.2 million, $51.3 million, $45.7 million, at September
30, 2021, June 30, 2021, March 31, 2021, December 31, 2020, and December 31, 2019, respectively.
$0$100$200$300$400$500$600$700$800$900
$1,000$1,100$1,200
12/31/19 12/31/20 3/31/21 6/30/21 9/30/21$0
$100$200$300$400$500$600$700$800$900
$1,000$1,100$1,200
12/31/19 12/31/20 3/31/21 6/30/21 9/30/21
$0
$100
$200
$300
$400
$500
$600
$700
$800
$900
$1,000
$1,100
$1,200
12/31/19 12/31/20 3/31/21 6/30/21 9/30/21$0
$100
$200
$300
$400
$500
$600
$700
$800
$900
$1,000
$1,100
$1,200
12/31/19 12/31/20 3/31/21 6/30/21 9/30/21$0
$100
$200
$300
$400
$500
$600
$700
$800
$900
$1,000
$1,100
$1,200
12/31/19 12/31/20 3/31/21 6/30/21 9/30/21
23

Criticized and Classified – CRE by Property Type($ in millions)
Office Multifamily Retail
Warehouse/Industrial Hotel Other
$0$50
$100$150$200$250$300$350$400$450$500
$0$50
$100$150$200$250$300$350$400$450$500
$0$50
$100$150$200$250$300$350$400$450$500
$0$50
$100$150$200$250$300$350$400$450$500
$0$50
$100$150$200$250$300$350$400$450$500
$0$50
$100$150$200$250$300$350$400$450$500
24

Criticized and Classified – BFG Franchise Finance($ in millions)
Restaurant Concepts Fitness Concepts
Other
$0
$20
$40
$60
$80
$100
$120
$140
$160
12/31/19 12/31/20 3/31/21 6/30/21 9/30/21
$0
$20
$40
$60
$80
$100
$120
$140
$160
12/31/19 12/31/20 3/31/21 6/30/21 9/30/21
$0
$20
$40
$60
$80
$100
$120
$140
$160
12/31/19 12/31/20 3/31/21 6/30/21 9/30/2125

Asset Quality – Delinquencies($ in millions)
Commercial(1) CRE
Residential (2)
(1) Includes lending subsidiaries
(2) Excludes government insured residential loans.
$0
$20
$40
$60
$80
$100
$120
$140
12/31/19 12/31/20 3/31/21 6/30/21 9/30/21
$0
$20
$40
$60
$80
$100
$120
$140
12/31/19 12/31/20 3/31/21 6/30/21 9/30/21
$0
$20
$40
$60
$80
$100
$120
$140
12/31/19 12/31/20 3/31/21 6/30/21 9/30/21 26

Investment Portfolio

28
Investment Securities AFS($ in thousands)
The AFS debt securities portfolio of $10.2 billion was in a net unrealized gain position
of $44.8 million at September 30, 2021
Portfolio Composition Ratings Distribution
Gov33%
AAA59%
AA6%
A2%
US Government and agency
33%
Private label RMBS and CMOs
21%
Private label CMBS
25%
Residential real estate
lease-
backed securities
6%
CLO10%
State Municipal
Obligations
2%
Other3%
Portfolio
Net Unrealized
Gain(Loss) Fair Value
Net Unrealized
Gain(Loss) Fair Value
Net Unrealized
Gain(Loss) Fair Value
US Government and agency 7,593$ 2,463,476$ 24,682$ 3,025,775$ 6,921$ 3,336,363$
Private label RMBS and CMOs 10,840 1,012,177 15,713 998,603 2,653 2,172,078
Private label CMBS 5,456 1,724,684 12,083 2,526,354 8,616 2,591,320
Residential real estate lease-backed securities 2,566 470,025 14,819 650,888 7,505 621,301
CLOs (7,539) 1,197,366 (8,450) 1,140,274 (1,773) 973,535
State and Municipal Obligations 15,774 273,302 21,966 235,709 17,486 225,404
Other 3,656 557,635 4,822 484,806 3,363 278,072
38,346$ 7,698,665$ 85,635$ 9,062,409$ 44,771$ 10,198,073$
December 31, 2019 December 31, 2020 September 30, 2021

Non-GAAP Financial Measures

30
Non-GAAP Financial Measures
PPNR is a non-GAAP financial measure. Management believes this measure is relevant to
understanding the performance of the Company attributable to elements other than the provision
for credit losses and the ability of the Company to generate earnings sufficient to cover estimated
credit losses, particularly in view of the volatility of the provision for credit losses resulting from the
COVID-19 pandemic. This measure also provides a meaningful basis for comparison to other
financial institutions since it is commonly employed and is a measure frequently cited by investors
and analysts. The following table reconciles the non-GAAP financial measure of PPNR to the
comparable GAAP financial measurement of income (loss) before income taxes for the periods
indicated (in thousands):
Septemeber 30, 2021 December 31, 2020 September 30, 2020
Income before income taxes (GAAP) 114,400$ 106,965$ 85,912$
Plus: provision for (recovery of) credit losses (11,842) (1,643) 29,232
PPNR (non-GAAP) 102,558$ 105,322$ 115,144$
Three Months Ended

31
Non-GAAP Financial Measures (continued)
ACL to total loans, excluding government insured residential loans, PPP and MWL is a non-GAAP
financial measure. Management believes this measure is relevant to understanding the adequacy
of the ACL coverage, excluding the impact of loans which carry nominal or no reserves. Disclosure
of this non-GAAP financial measure also provides a meaningful basis for comparison to other
financial institutions and is a measure cited by analysts. The following table reconciles the non-
GAAP financial measurement of ACL to total loans, excluding government insured residential
loans, PPP loans and MWL to the comparable GAAP financial measurement of ACL to total loans
at the dates indicated (dollars in thousands):
September 30, 2021 June 30, 2021 December 31, 2020
Total loans (GAAP) 22,807,969$ 22,885,074$ 23,866,042$
Less: Government insured residential loans 1,913,497 1,863,723 1,419,074
Less: PPP loans 332,548 491,960 781,811
Less: MWL 877,006 1,018,267 1,259,408
Total loans, excluding government insured residential loans, PPP loans and
MWL (non-GAAP) 19,684,918$ 19,511,124$ 20,405,749$
ACL 159,615$ 175,642$ 257,323$
ACL to total loans (GAAP) 0.70% 0.77% 1.08%
ACL to total loans, excluding government insured residential loans, PPP loans
and MWL (non-GAAP) 0.81% 0.90% 1.26%