Embed Size (px)
Citation preview

Q4 Financial Presentation 2016
DOF ASA

Highlights
- Q4 Presentation 2016DOF ASA
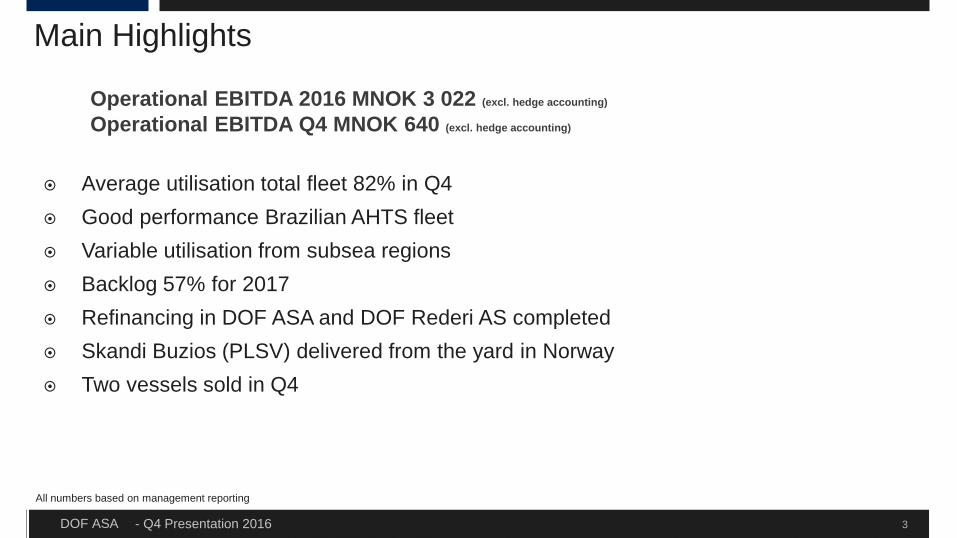
Main Highlights
Average utilisation total fleet 82% in Q4 Good performance Brazilian AHTS fleet Variable utilisation from subsea regions Backlog 57% for 2017 Refinancing in DOF ASA and DOF Rederi AS completed Skandi Buzios (PLSV) delivered from the yard in Norway Two vessels sold in Q4
3
All numbers based on management reporting
Operational EBITDA 2016 MNOK 3 022 (excl. hedge accounting)
Operational EBITDA Q4 MNOK 640 (excl. hedge accounting)
- Q4 Presentation 2016DOF ASA
Highlights
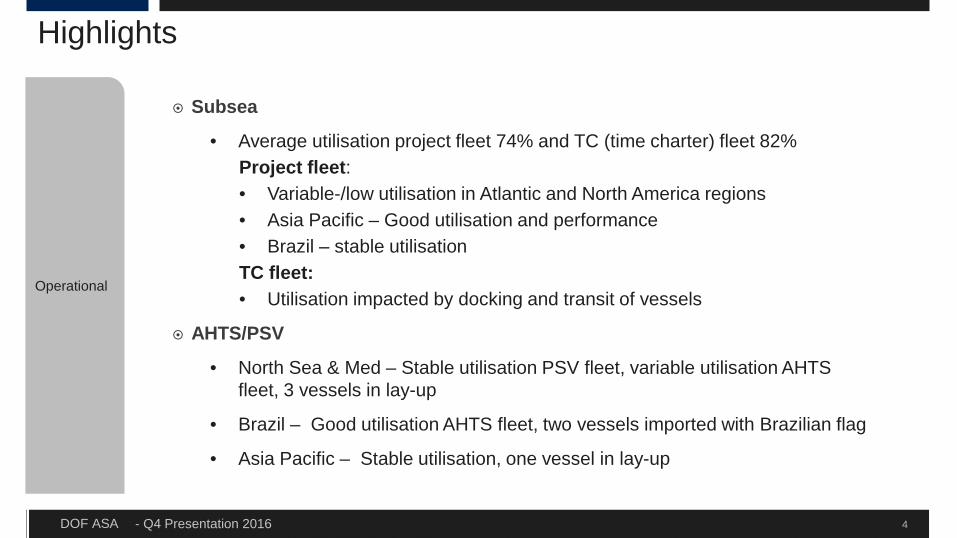
Subsea
• Average utilisation project fleet 74% and TC (time charter) fleet 82%Project fleet:• Variable-/low utilisation in Atlantic and North America regions• Asia Pacific – Good utilisation and performance• Brazil – stable utilisationTC fleet:• Utilisation impacted by docking and transit of vessels
AHTS/PSV
• North Sea & Med – Stable utilisation PSV fleet, variable utilisation AHTS fleet, 3 vessels in lay-up
• Brazil – Good utilisation AHTS fleet, two vessels imported with Brazilian flag
• Asia Pacific – Stable utilisation, one vessel in lay-up
Operational
4
- Q4 Presentation 2016DOF ASA
Highlights
5
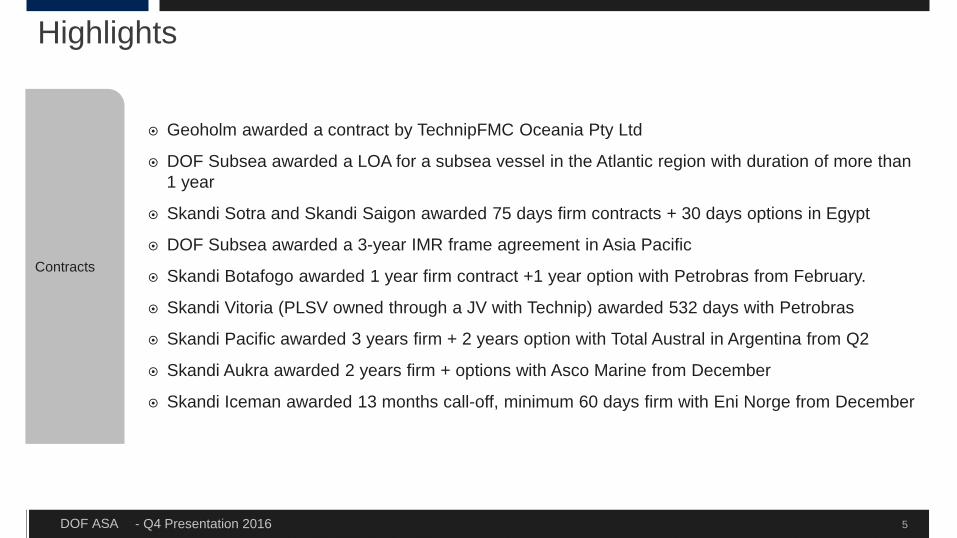
Geoholm awarded a contract by TechnipFMC Oceania Pty Ltd
DOF Subsea awarded a LOA for a subsea vessel in the Atlantic region with duration of more than 1 year
Skandi Sotra and Skandi Saigon awarded 75 days firm contracts + 30 days options in Egypt
DOF Subsea awarded a 3-year IMR frame agreement in Asia Pacific
Skandi Botafogo awarded 1 year firm contract +1 year option with Petrobras from February.
Skandi Vitoria (PLSV owned through a JV with Technip) awarded 532 days with Petrobras
Skandi Pacific awarded 3 years firm + 2 years option with Total Austral in Argentina from Q2
Skandi Aukra awarded 2 years firm + options with Asco Marine from December
Skandi Iceman awarded 13 months call-off, minimum 60 days firm with Eni Norge from December
Contracts
- Q4 Presentation 2016DOF ASA
Highlights
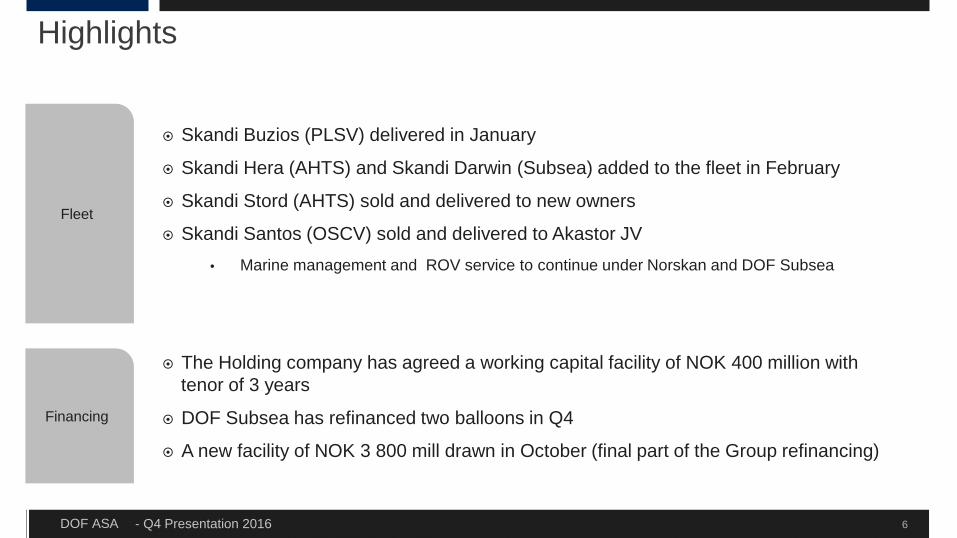
Fleet
6
Financing
Skandi Buzios (PLSV) delivered in January
Skandi Hera (AHTS) and Skandi Darwin (Subsea) added to the fleet in February
Skandi Stord (AHTS) sold and delivered to new owners
Skandi Santos (OSCV) sold and delivered to Akastor JV • Marine management and ROV service to continue under Norskan and DOF Subsea
The Holding company has agreed a working capital facility of NOK 400 million with tenor of 3 years
DOF Subsea has refinanced two balloons in Q4
A new facility of NOK 3 800 mill drawn in October (final part of the Group refinancing)

Overview Group
- Q4 Presentation 2016DOF ASA
DOF ASA in brief
Vessels
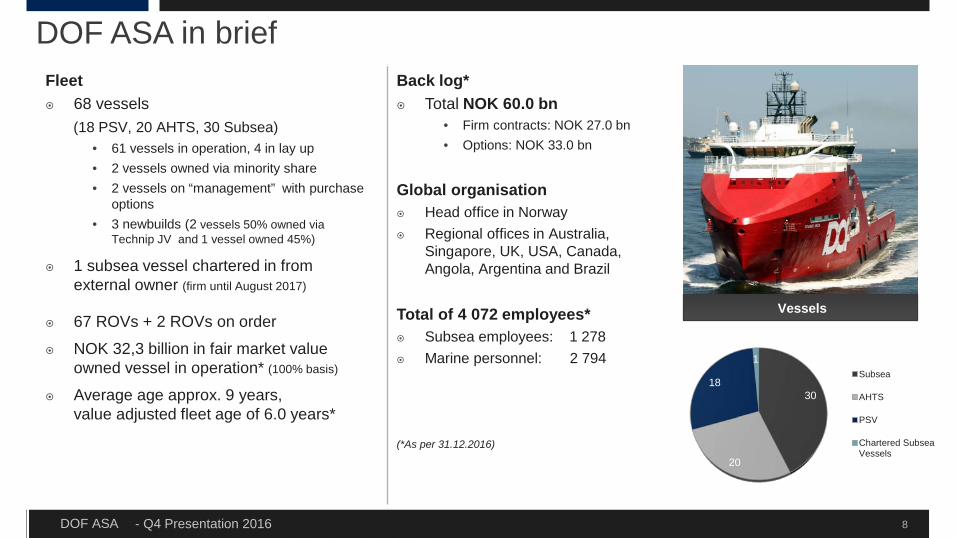
Fleet 68 vessels
(18 PSV, 20 AHTS, 30 Subsea)• 61 vessels in operation, 4 in lay up• 2 vessels owned via minority share• 2 vessels on “management” with purchase
options• 3 newbuilds (2 vessels 50% owned via
Technip JV and 1 vessel owned 45%)
1 subsea vessel chartered in from external owner (firm until August 2017)
67 ROVs + 2 ROVs on order
NOK 32,3 billion in fair market value owned vessel in operation* (100% basis)
Average age approx. 9 years, value adjusted fleet age of 6.0 years*
Back log* Total NOK 60.0 bn
• Firm contracts: NOK 27.0 bn• Options: NOK 33.0 bn
Global organisation Head office in Norway Regional offices in Australia,
Singapore, UK, USA, Canada, Angola, Argentina and Brazil
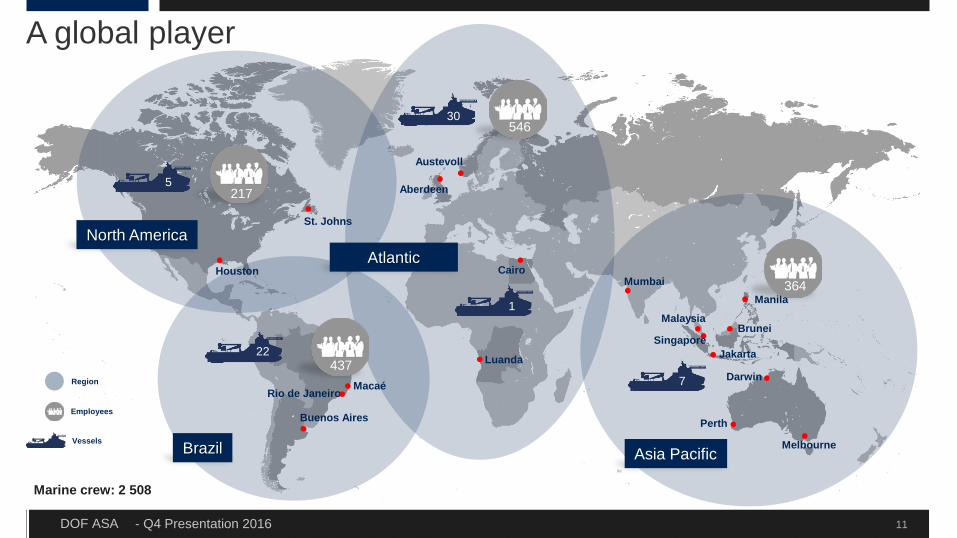
Total of 4 072 employees* Subsea employees: 1 278 Marine personnel: 2 794
(*As per 31.12.2016)
8
30
20
18
1Subsea
AHTS
PSV
Chartered SubseaVessels
- Q4 Presentation 2016DOF ASA
Fleet overview and contract coverage
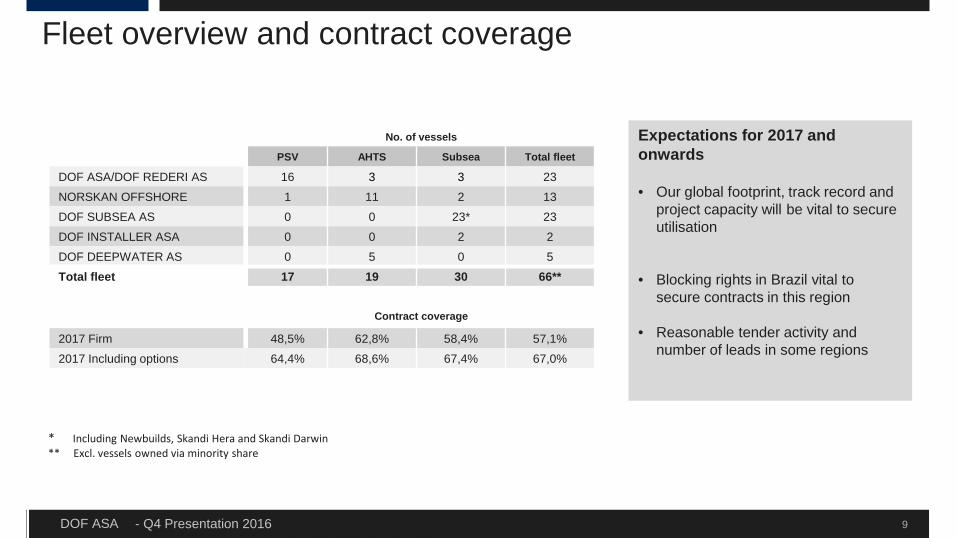
* Including Newbuilds, Skandi Hera and Skandi Darwin** Excl. vessels owned via minority share
9
No. of vessels
PSV AHTS Subsea Total fleet
DOF ASA/DOF REDERI AS 16 3 3 23
NORSKAN OFFSHORE 1 11 2 13
DOF SUBSEA AS 0 0 23* 23
DOF INSTALLER ASA 0 0 2 2
DOF DEEPWATER AS 0 5 0 5
Total fleet 17 19 30 66**
Contract coverage
2017 Firm 48,5% 62,8% 58,4% 57,1%
2017 Including options 64,4% 68,6% 67,4% 67,0%
Expectations for 2017 and onwards
• Our global footprint, track record and project capacity will be vital to secure utilisation
• Blocking rights in Brazil vital to secure contracts in this region
• Reasonable tender activity and number of leads in some regions
- Q4 Presentation 2016DOF ASA
DOF backlog overview 2017 -2020
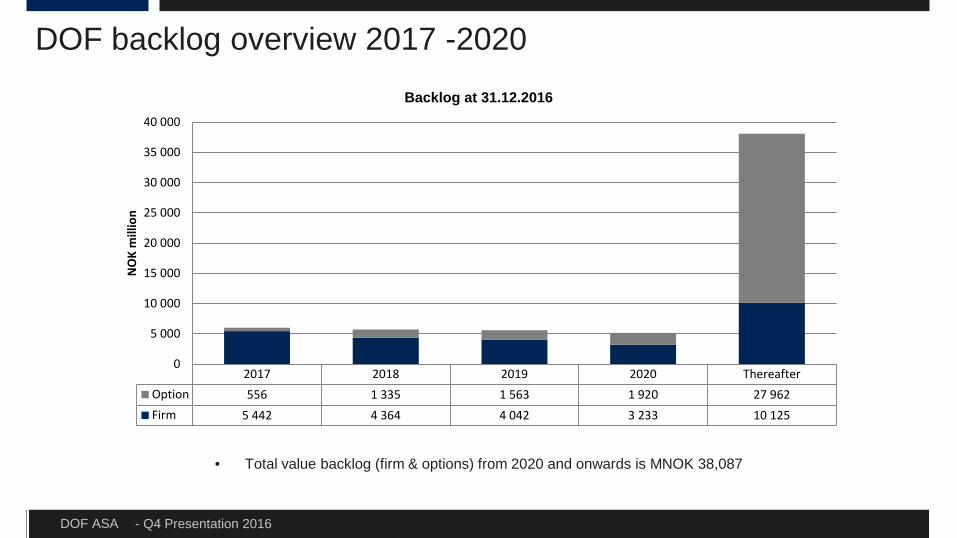
• Total value backlog (firm & options) from 2020 and onwards is MNOK 38,087
26,813
2017 2018 2019 2020 ThereafterOption 556 1 335 1 563 1 920 27 962Firm 5 442 4 364 4 042 3 233 10 125
0
5 000
10 000
15 000
20 000
25 000
30 000
35 000
40 000N
OK
mill
ion
Backlog at 31.12.2016
- Q4 Presentation 2016DOF ASA 11
Region
Perth
Rio de Janeiro
Buenos Aires
Singapore
Houston
St. Johns
Aberdeen
Cairo
Brunei
Macaé
Jakarta
Manila
Luanda
Austevoll
Malaysia
30
5
22
7
1
Melbourne
Darwin
546
437
364
North America
Asia PacificBrazil
Atlantic
217
Marine crew: 2 508
Mumbai
A global player
Employees
Vessels
- Q4 Presentation 2016DOF ASA
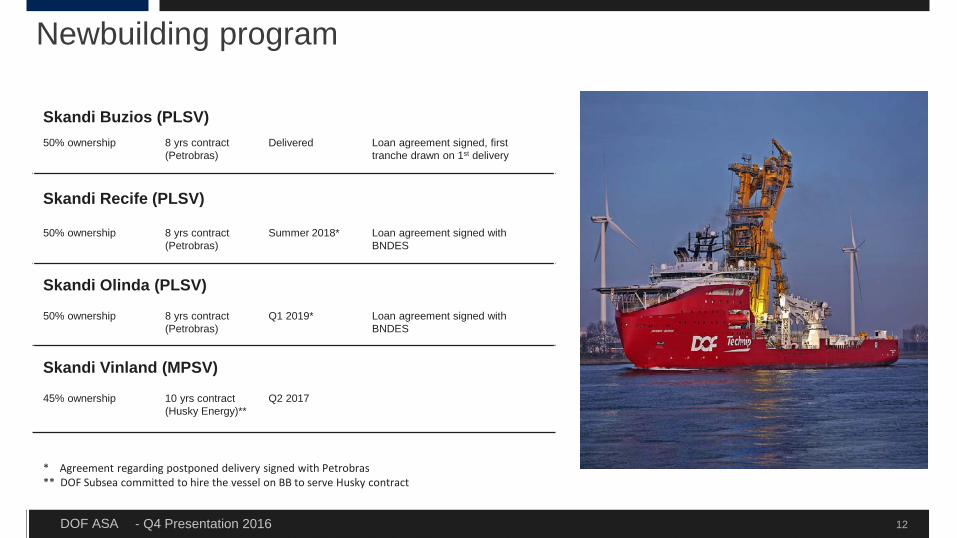
Skandi Buzios (PLSV)50% ownership 8 yrs contract
(Petrobras) Delivered Loan agreement signed, first
tranche drawn on 1st delivery
Skandi Recife (PLSV)
50% ownership 8 yrs contract (Petrobras)
Summer 2018* Loan agreement signed with BNDES
Skandi Olinda (PLSV)
50% ownership 8 yrs contract (Petrobras)
Q1 2019* Loan agreement signed with BNDES
Skandi Vinland (MPSV)
45% ownership 10 yrs contract (Husky Energy)**
Q2 2017
Newbuilding program
12
* Agreement regarding postponed delivery signed with Petrobras** DOF Subsea committed to hire the vessel on BB to serve Husky contract
- Q4 Presentation 2016DOF ASA
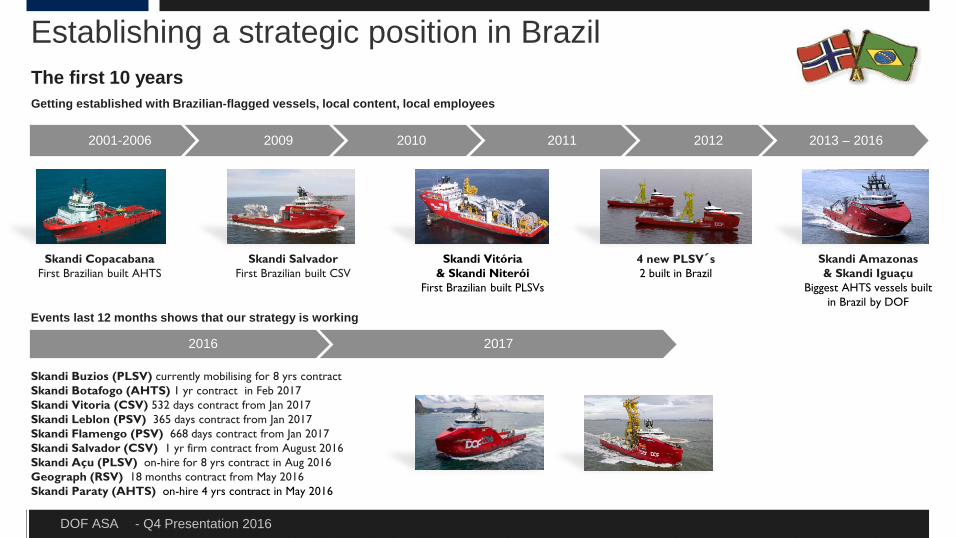
2001-2006 2009 2010 2011 2012 2013 – 2016
Establishing a strategic position in Brazil
Skandi Copacabana First Brazilian built AHTS
Skandi Vitória & Skandi Niterói
First Brazilian built PLSVs
4 new PLSV´s 2 built in Brazil
Skandi Salvador First Brazilian built CSV
Events last 12 months shows that our strategy is working
Skandi Buzios (PLSV) currently mobilising for 8 yrs contract Skandi Botafogo (AHTS) 1 yr contract in Feb 2017Skandi Vitoria (CSV) 532 days contract from Jan 2017Skandi Leblon (PSV) 365 days contract from Jan 2017Skandi Flamengo (PSV) 668 days contract from Jan 2017Skandi Salvador (CSV) 1 yr firm contract from August 2016Skandi Açu (PLSV) on-hire for 8 yrs contract in Aug 2016Geograph (RSV) 18 months contract from May 2016Skandi Paraty (AHTS) on-hire 4 yrs contract in May 2016
Skandi Amazonas & Skandi Iguaçu
Biggest AHTS vessels built in Brazil by DOF
The first 10 yearsGetting established with Brazilian-flagged vessels, local content, local employees
2016 2017
- Q4 Presentation 2016DOF ASA 14
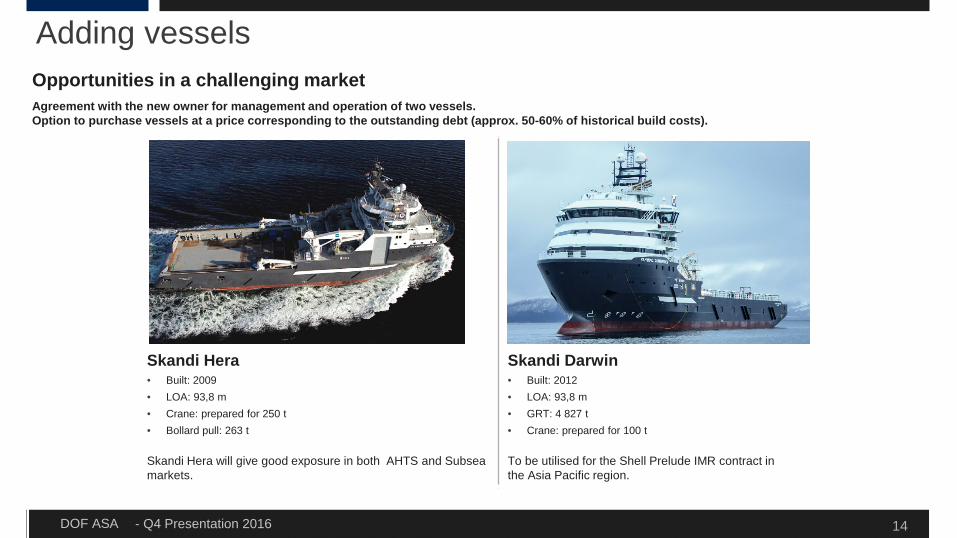
Adding vessels
Skandi Hera • Built: 2009• LOA: 93,8 m• Crane: prepared for 250 t• Bollard pull: 263 t
Skandi Hera will give good exposure in both AHTS and Subsea markets.
Skandi Darwin • Built: 2012• LOA: 93,8 m• GRT: 4 827 t • Crane: prepared for 100 t
To be utilised for the Shell Prelude IMR contract in the Asia Pacific region.
Opportunities in a challenging marketAgreement with the new owner for management and operation of two vessels.Option to purchase vessels at a price corresponding to the outstanding debt (approx. 50-60% of historical build costs).
FinancialsManagement Reporting
- Q4 Presentation 2016DOF ASA
Result Q4 2016Comments result Q4
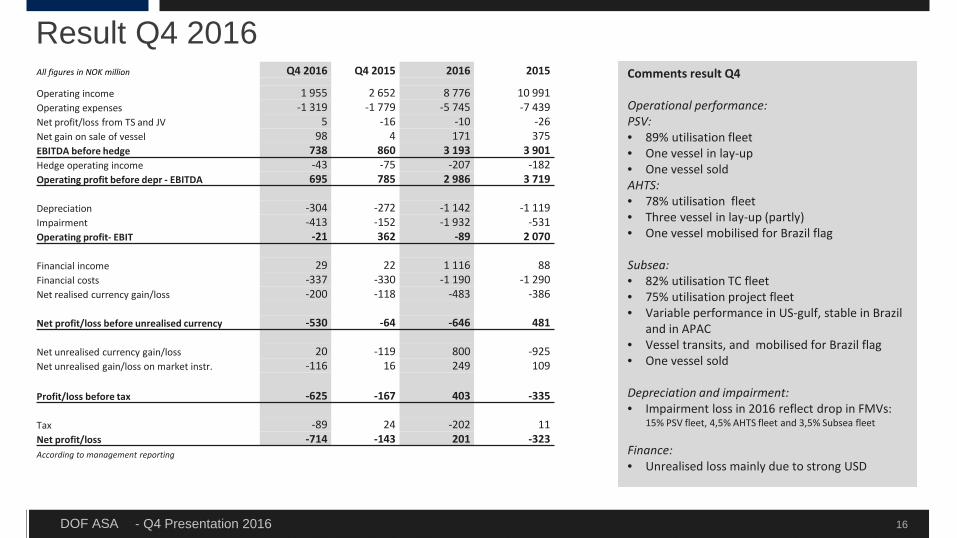
Operational performance:PSV:• 89% utilisation fleet• One vessel in lay-up• One vessel soldAHTS:• 78% utilisation fleet• Three vessel in lay-up (partly)• One vessel mobilised for Brazil flag
Subsea:• 82% utilisation TC fleet• 75% utilisation project fleet • Variable performance in US-gulf, stable in Brazil
and in APAC• Vessel transits, and mobilised for Brazil flag• One vessel sold
Depreciation and impairment:• Impairment loss in 2016 reflect drop in FMVs:
15% PSV fleet, 4,5% AHTS fleet and 3,5% Subsea fleet
Finance:• Unrealised loss mainly due to strong USD
16
All figures in NOK million Q4 2016 Q4 2015 2016 2015
Operating income 1 955 2 652 8 776 10 991 Operating expenses -1 319 -1 779 -5 745 -7 439 Net profit/loss from TS and JV 5 -16 -10 -26 Net gain on sale of vessel 98 4 171 375 EBITDA before hedge 738 860 3 193 3 901 Hedge operating income -43 -75 -207 -182 Operating profit before depr - EBITDA 695 785 2 986 3 719
Depreciation -304 -272 -1 142 -1 119 Impairment -413 -152 -1 932 -531 Operating profit- EBIT -21 362 -89 2 070
Financial income 29 22 1 116 88 Financial costs -337 -330 -1 190 -1 290 Net realised currency gain/loss -200 -118 -483 -386
Net profit/loss before unrealised currency -530 -64 -646 481
Net unrealised currency gain/loss 20 -119 800 -925 Net unrealised gain/loss on market instr. -116 16 249 109
Profit/loss before tax -625 -167 403 -335
Tax -89 24 -202 11 Net profit/loss -714 -143 201 -323 According to management reporting
- Q4 Presentation 2016DOF ASA 17
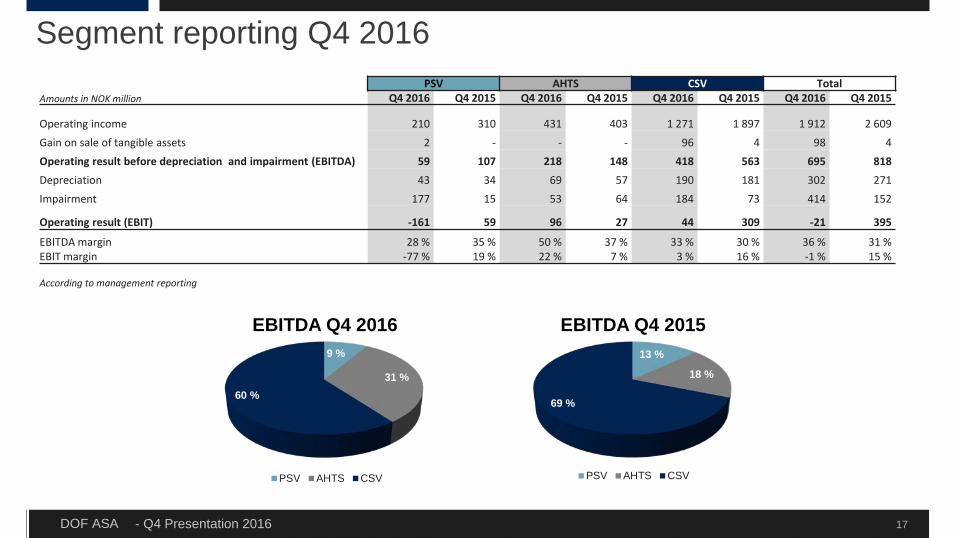
Segment reporting Q4 2016PSV AHTS CSV Total
Amounts in NOK million Q4 2016 Q4 2015 Q4 2016 Q4 2015 Q4 2016 Q4 2015 Q4 2016 Q4 2015
Operating income 210 310 431 403 1 271 1 897 1 912 2 609 Gain on sale of tangible assets 2 - - - 96 4 98 4 Operating result before depreciation and impairment (EBITDA) 59 107 218 148 418 563 695 818 Depreciation 43 34 69 57 190 181 302 271 Impairment 177 15 53 64 184 73 414 152
Operating result (EBIT) -161 59 96 27 44 309 -21 395
EBITDA margin 28 % 35 % 50 % 37 % 33 % 30 % 36 % 31 %EBIT margin -77 % 19 % 22 % 7 % 3 % 16 % -1 % 15 %
According to management reporting
9 %
31 %60 %
PSV AHTS CSV
EBITDA Q4 201613 %
18 %
69 %
PSV AHTS CSV
EBITDA Q4 2015
- Q4 Presentation 2016DOF ASA
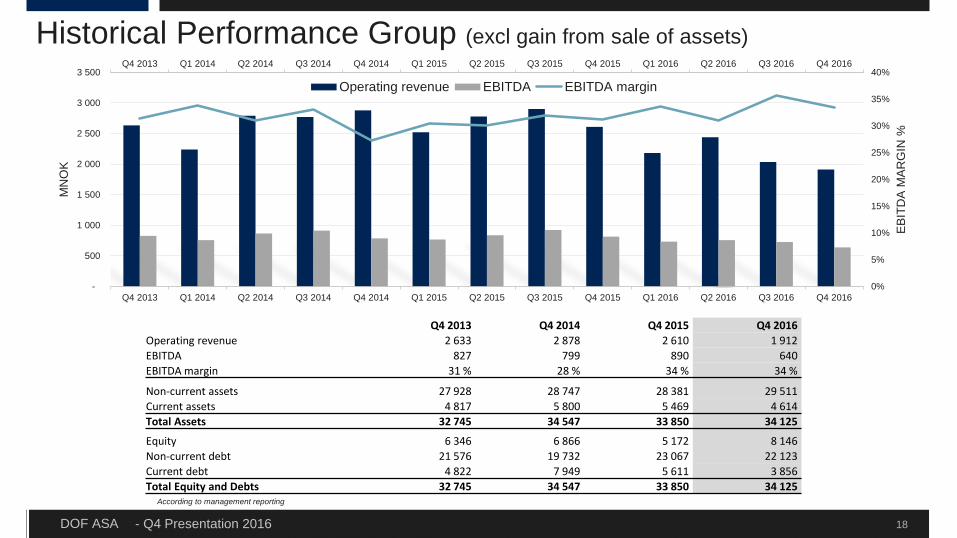
Historical Performance Group (excl gain from sale of assets)
18
According to management reporting
Q4 2013 Q4 2014 Q4 2015 Q4 2016Operating revenue 2 633 2 878 2 610 1 912 EBITDA 827 799 890 640 EBITDA margin 31 % 28 % 34 % 34 %
Non-current assets 27 928 28 747 28 381 29 511 Current assets 4 817 5 800 5 469 4 614 Total Assets 32 745 34 547 33 850 34 125
Equity 6 346 6 866 5 172 8 146 Non-current debt 21 576 19 732 23 067 22 123 Current debt 4 822 7 949 5 611 3 856 Total Equity and Debts 32 745 34 547 33 850 34 125
Q4 2013 Q1 2014 Q2 2014 Q3 2014 Q4 2014 Q1 2015 Q2 2015 Q3 2015 Q4 2015 Q1 2016 Q2 2016 Q3 2016 Q4 2016
0%
5%
10%
15%
20%
25%
30%
35%
40%
-
500
1 000
1 500
2 000
2 500
3 000
3 500
Q4 2013 Q1 2014 Q2 2014 Q3 2014 Q4 2014 Q1 2015 Q2 2015 Q3 2015 Q4 2015 Q1 2016 Q2 2016 Q3 2016 Q4 2016
EB
ITD
A M
AR
GIN
%
MN
OK
Operating revenue EBITDA EBITDA margin
- Q4 Presentation 2016DOF ASA
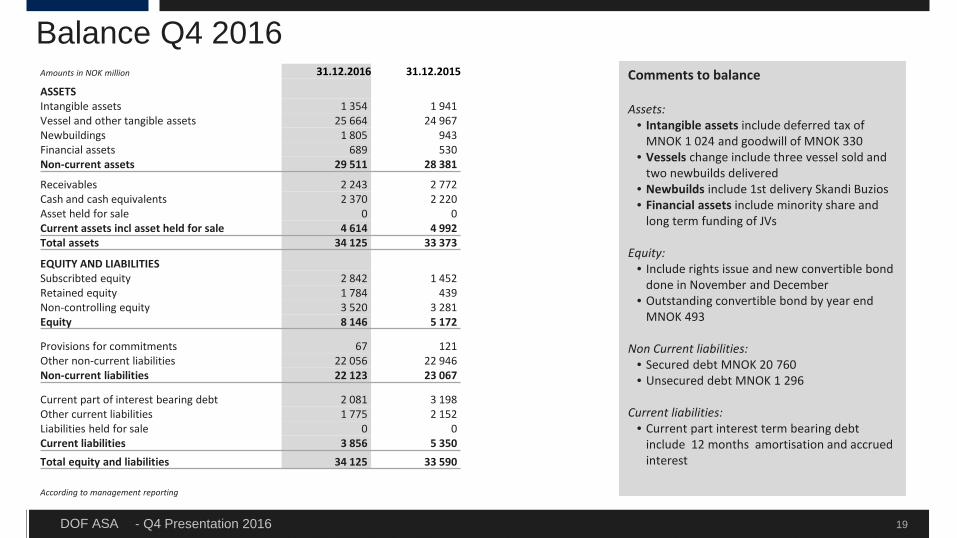
Balance Q4 2016Comments to balance
Assets:• Intangible assets include deferred tax of
MNOK 1 024 and goodwill of MNOK 330• Vessels change include three vessel sold and
two newbuilds delivered• Newbuilds include 1st delivery Skandi Buzios• Financial assets include minority share and
long term funding of JVs
Equity:• Include rights issue and new convertible bond
done in November and December• Outstanding convertible bond by year end
MNOK 493
Non Current liabilities:• Secured debt MNOK 20 760• Unsecured debt MNOK 1 296
Current liabilities:• Current part interest term bearing debt
include 12 months amortisation and accrued interest
19
Amounts in NOK million 31.12.2016 31.12.2015
ASSETSIntangible assets 1 354 1 941Vessel and other tangible assets 25 664 24 967Newbuildings 1 805 943Financial assets 689 530Non-current assets 29 511 28 381
Receivables 2 243 2 772Cash and cash equivalents 2 370 2 220Asset held for sale 0 0Current assets incl asset held for sale 4 614 4 992Total assets 34 125 33 373
EQUITY AND LIABILITIESSubscribted equity 2 842 1 452Retained equity 1 784 439Non-controlling equity 3 520 3 281Equity 8 146 5 172
Provisions for commitments 67 121Other non-current liabilities 22 056 22 946Non-current liabilities 22 123 23 067
Current part of interest bearing debt 2 081 3 198Other current liabilities 1 775 2 152Liabilities held for sale 0 0Current liabilities 3 856 5 350Total equity and liabilities 34 125 33 590
According to management reporting
- Q4 Presentation 2016DOF ASA
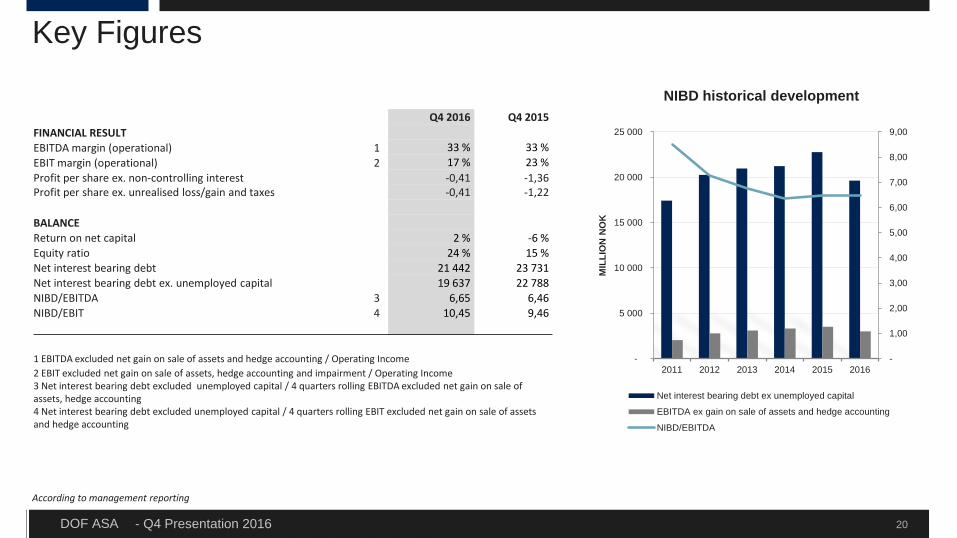
Key Figures
20
NIBD historical developmentQ4 2016 Q4 2015
FINANCIAL RESULTEBITDA margin (operational) 1 33 % 33 %EBIT margin (operational) 2 17 % 23 %Profit per share ex. non-controlling interest -0,41 -1,36 Profit per share ex. unrealised loss/gain and taxes -0,41 -1,22
BALANCEReturn on net capital 2 % -6 %Equity ratio 24 % 15 %Net interest bearing debt 21 442 23 731 Net interest bearing debt ex. unemployed capital 19 637 22 788 NIBD/EBITDA 3 6,65 6,46 NIBD/EBIT 4 10,45 9,46
1 EBITDA excluded net gain on sale of assets and hedge accounting / Operating Income2 EBIT excluded net gain on sale of assets, hedge accounting and impairment / Operating Income3 Net interest bearing debt excluded unemployed capital / 4 quarters rolling EBITDA excluded net gain on sale of assets, hedge accounting4 Net interest bearing debt excluded unemployed capital / 4 quarters rolling EBIT excluded net gain on sale of assets and hedge accounting
According to management reporting
-
1,00
2,00
3,00
4,00
5,00
6,00
7,00
8,00
9,00
-
5 000
10 000
15 000
20 000
25 000
2011 2012 2013 2014 2015 2016
MIL
LIO
N N
OK
Net interest bearing debt ex unemployed capital
EBITDA ex gain on sale of assets and hedge accounting
NIBD/EBITDA
- Q4 Presentation 2016DOF ASA
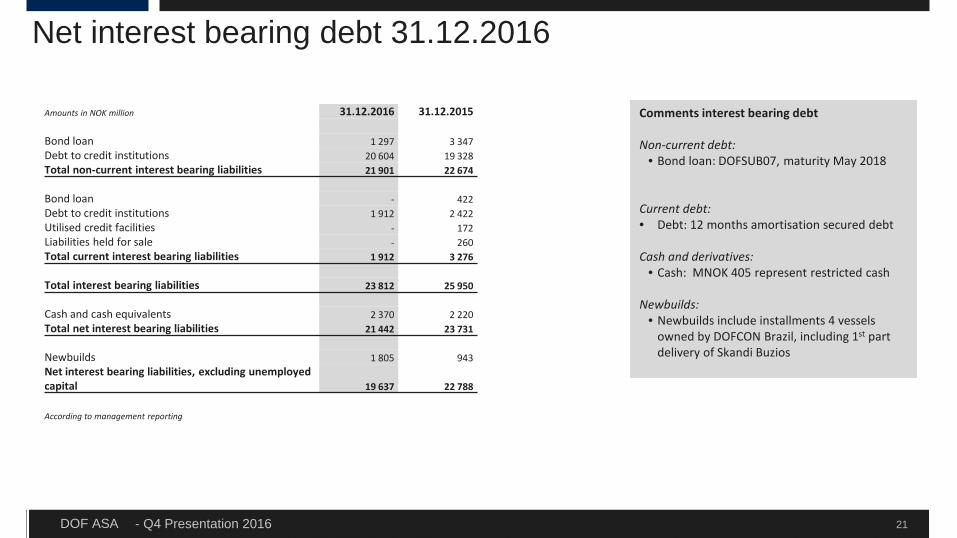
Net interest bearing debt 31.12.2016
21
Comments interest bearing debt
Non-current debt:• Bond loan: DOFSUB07, maturity May 2018
Current debt:• Debt: 12 months amortisation secured debt
Cash and derivatives:• Cash: MNOK 405 represent restricted cash
Newbuilds:• Newbuilds include installments 4 vessels
owned by DOFCON Brazil, including 1st part delivery of Skandi Buzios
Amounts in NOK million 31.12.2016 31.12.2015
Bond loan 1 297 3 347 Debt to credit institutions 20 604 19 328 Total non-current interest bearing liabilities 21 901 22 674
Bond loan - 422 Debt to credit institutions 1 912 2 422 Utilised credit facilities - 172 Liabilities held for sale - 260 Total current interest bearing liabilities 1 912 3 276
Total interest bearing liabilities 23 812 25 950
Cash and cash equivalents 2 370 2 220 Total net interest bearing liabilities 21 442 23 731
Newbuilds 1 805 943 Net interest bearing liabilities, excluding unemployed capital 19 637 22 788
According to management reporting
- Q4 Presentation 2016DOF ASA
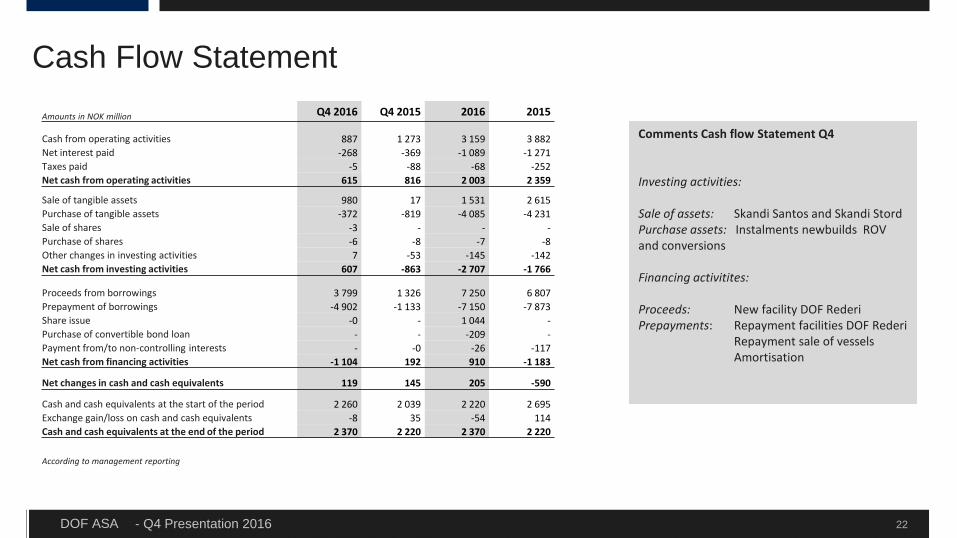
Cash Flow Statement
22
Comments Cash flow Statement Q4
Investing activities:
Sale of assets: Skandi Santos and Skandi StordPurchase assets: Instalments newbuilds ROV and conversions
Financing activitites:
Proceeds: New facility DOF RederiPrepayments: Repayment facilities DOF Rederi
Repayment sale of vesselsAmortisation
Amounts in NOK million Q4 2016 Q4 2015 2016 2015
Cash from operating activities 887 1 273 3 159 3 882Net interest paid -268 -369 -1 089 -1 271 Taxes paid -5 -88 -68 -252 Net cash from operating activities 615 816 2 003 2 359
Sale of tangible assets 980 17 1 531 2 615 Purchase of tangible assets -372 -819 -4 085 -4 231 Sale of shares -3 - - -Purchase of shares -6 -8 -7 -8 Other changes in investing activities 7 -53 -145 -142 Net cash from investing activities 607 -863 -2 707 -1 766
Proceeds from borrowings 3 799 1 326 7 250 6 807 Prepayment of borrowings -4 902 -1 133 -7 150 -7 873 Share issue -0 - 1 044 -Purchase of convertible bond loan - - -209 -Payment from/to non-controlling interests - -0 -26 -117 Net cash from financing activities -1 104 192 910 -1 183
Net changes in cash and cash equivalents 119 145 205 -590
Cash and cash equivalents at the start of the period 2 260 2 039 2 220 2 695 Exchange gain/loss on cash and cash equivalents -8 35 -54 114 Cash and cash equivalents at the end of the period 2 370 2 220 2 370 2 220
According to management reporting
- Q4 Presentation 2016DOF ASA
DO
F ex
Sub
sea
DO
F S
ubse
a
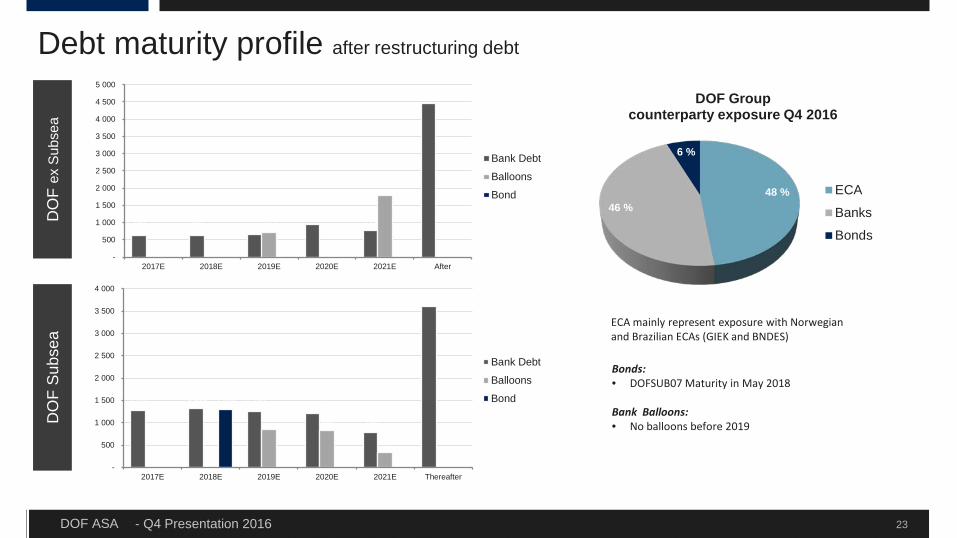
Bonds:• DOFSUB07 Maturity in May 2018
Bank Balloons:• No balloons before 2019
23
ECA mainly represent exposure with Norwegian and Brazilian ECAs (GIEK and BNDES)
Debt maturity profile after restructuring debt
631 631 665 940
771
4 447
- -
725
-
1 802
-- - - - - - -
500
1 000
1 500
2 000
2 500
3 000
3 500
4 000
4 500
5 000
2017E 2018E 2019E 2020E 2021E After
Bank Debt
Balloons
Bond
1 282 1 318 1 249 1 195
786
3 600
- -
847 829
328
--
1 300
- - - - -
500
1 000
1 500
2 000
2 500
3 000
3 500
4 000
2017E 2018E 2019E 2020E 2021E Thereafter
Bank Debt
Balloons
Bond
48 %46 %
6 %
DOF Groupcounterparty exposure Q4 2016
ECA
Banks
Bonds
DOF Subsea
- Q4 Presentation 2016DOF ASA 25
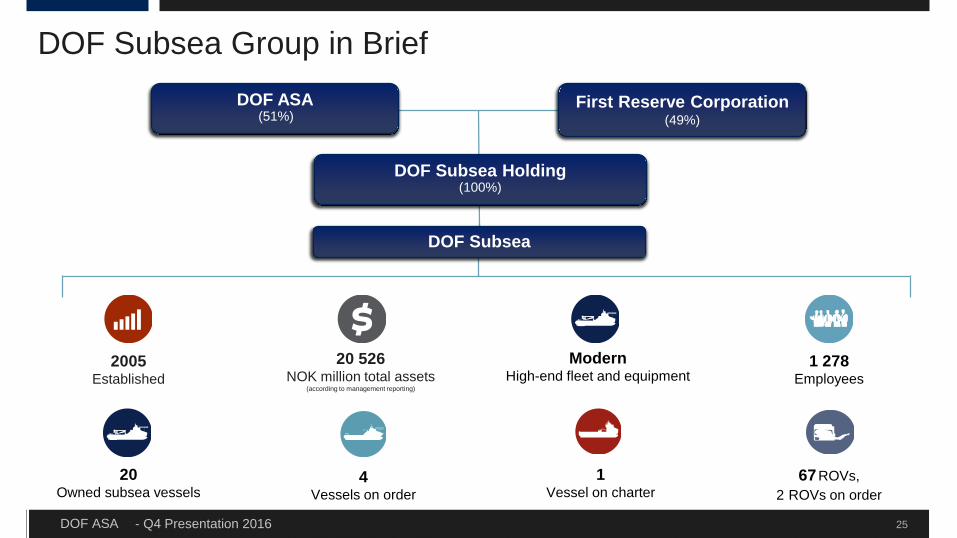
DOF Subsea Group in Brief
2005Established
20 526NOK million total assets
(according to management reporting)
ModernHigh-end fleet and equipment
20Owned subsea vessels
4Vessels on order
1Vessel on charter
67ROVs,2 ROVs on order
First Reserve Corporation (49%)
1 278Employees
DOF Subsea
DOF Subsea Holding(100%)
DOF ASA(51%)
- Q4 Presentation 2016DOF ASA
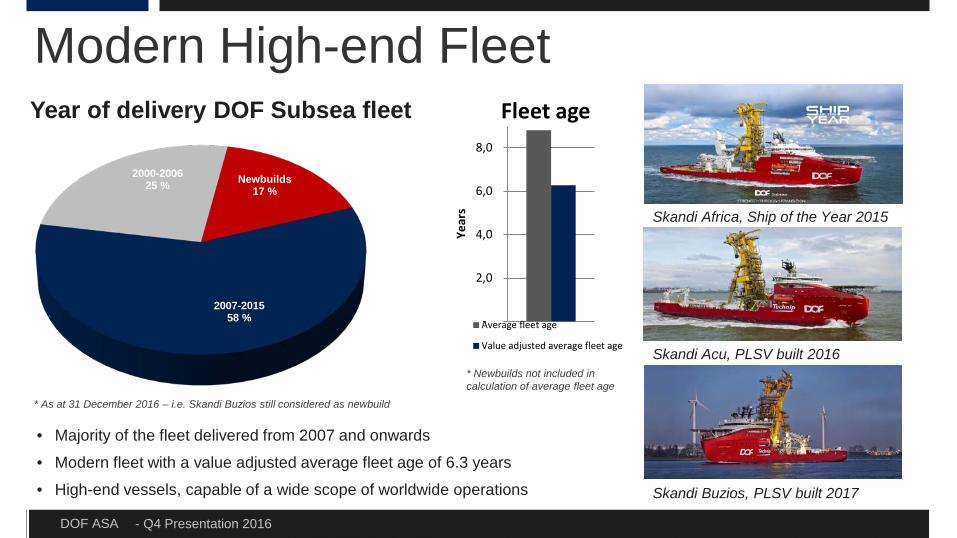
Modern High-end Fleet
26
• Majority of the fleet delivered from 2007 and onwards
• Modern fleet with a value adjusted average fleet age of 6.3 years
• High-end vessels, capable of a wide scope of worldwide operations
Newbuilds17 %
2007-201558 %
2000-200625 %
Year of delivery DOF Subsea fleet
* As at 31 December 2016 – i.e. Skandi Buzios still considered as newbuild
-
2,0
4,0
6,0
8,0
Year
s
Fleet age
Average fleet age
Value adjusted average fleet age
Skandi Africa, Ship of the Year 2015
Skandi Acu, PLSV built 2016
Skandi Buzios, PLSV built 2017
* Newbuilds not included in calculation of average fleet age
- Q4 Presentation 2016DOF ASA 27According to management reporting
0%
5%
10%
15%
20%
25%
30%
35%
40%
-
500
1 000
1 500
2 000
2 500
Q4 2012 Q1 2013 Q2 2013 Q3 2013 Q4 2013 Q1 2014 Q2 2014 Q3 2014 Q4 2014 Q1 2015 Q2 2015 Q3 2015 Q4 2015 Q1 2016 Q2 2016 Q3 2016 Q4 2016
EBIT
DA M
ARGI
N %
MN
OK
Operating revenue EBITDA EBITDA margin
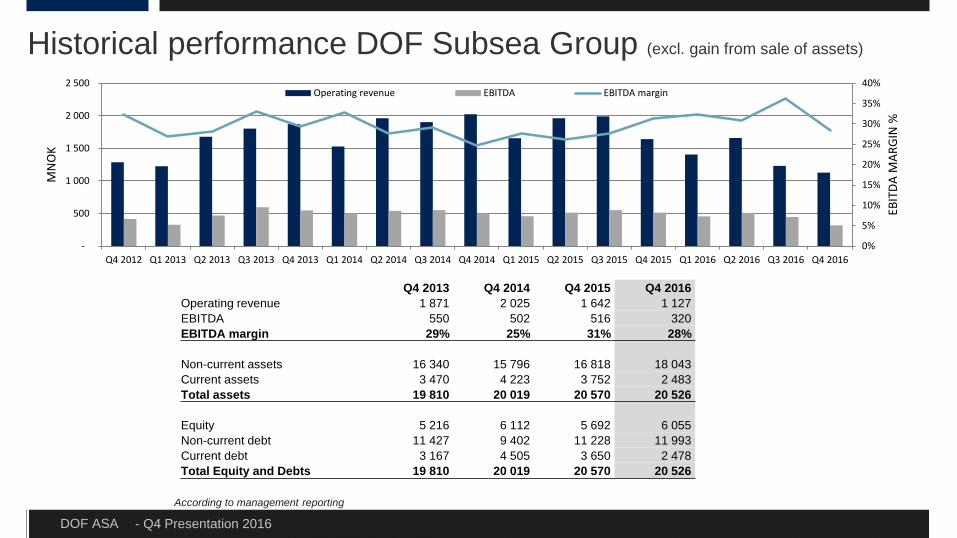
Q4 2013 Q4 2014 Q4 2015 Q4 2016Operating revenue 1 871 2 025 1 642 1 127 EBITDA 550 502 516 320 EBITDA margin 29% 25% 31% 28%
Non-current assets 16 340 15 796 16 818 18 043 Current assets 3 470 4 223 3 752 2 483 Total assets 19 810 20 019 20 570 20 526
Equity 5 216 6 112 5 692 6 055 Non-current debt 11 427 9 402 11 228 11 993 Current debt 3 167 4 505 3 650 2 478 Total Equity and Debts 19 810 20 019 20 570 20 526
Historical performance DOF Subsea Group (excl. gain from sale of assets)
- Q4 Presentation 2016DOF ASA
General: Weak global markets within supply and subsea, however still differences in regional opportunities. The tender activity has picked up slightly and we see signs of increased activity in some regions and within some segments
2017 will be very challenging
Subsea: APAC market Low spending from operators have led to low activity Competition scene have changed with fewer players and increased competition from larger
players now interested in IRM
Australia still dominated by the big LNG projects – Prelude, Gorgon & Ichthys. Most of these projects will be completed in 2017 followed by more IRM work. However, Operators trying to reduce cost by reducing IRM
Brazil marketWe expect a similar market as we saw in 2016, with few new tenders, pressure on rates, “blocking activity” with international tonnage being replaced
Important with Brazilian flag
Market and outlook
28
- Q4 Presentation 2016DOF ASA 29
Subsea: North America market We expect a similar market to 2016 with pressure on rates and utilisation. Ongoing
“Jones Act” discussions can strengthen the US flagged vessels position
DOFSUB: Challenging, but building a good track record
Atlantic market Both Norway and UK are oversupplied resulting in low utilisation and weak
earnings. West Africa is challenging, but some interesting term opportunities
Market and outlook
- Q4 Presentation 2016DOF ASA
Market and outlook
30
Supply: Brazil We expect a similar market as we saw in 2016, with few new tenders, pressure on
rates, "blocking activity" with international tonnage being replaced Important with Brazilian flag
Atlantic: Both Norway and UK are oversupplied resulting in low utilisation and weak earnings.
West Africa challenging and few opportunities
Asia Pacific: Low spending from operators have led to low activity New drilling activity almost non-existent
- Q4 Presentation 2016DOF ASA
Operational EBITDA in 2016 in line with our guidance
(guidance MNOK 2 900 – MNOK 3 300, actual MNOK 3 022)
Backlog of 57%, expected to grow, but high uncertainty regarding utilisation and earnings
Main focus is to have the majority of the fleet on contracts
High uncertainty to guide for 2017, best estimate today is an operational EBITDA of MNOK 2 400 – MNOK 2 800 (MNOK 2 600- MNOK 3 000 excl. hedge)
Outlook
31
Thank youPresented by Mons Aase - CEOHilde Drønen - CFO
- Q4 Presentation 2016DOF ASA
DISCLAIMER
This presentation by DOF ASA designed to provide a high level overview of aspects of the operations of the DOF ASA Group.The material set out in the presentation is current as at 17 February 2017.This presentation contains forward-looking statements relating to operations of the DOF ASA Group that are based onmanagement’s own current expectations, estimates and projections about matters relevant to DOF ASA‘s future financialperformance. Words such as “likely”, “aims”, “looking forward”, “potential”, “anticipates”, “expects”, “predicts”, “plans”, “targets”,“believes” and “estimates” and similar expressions are intended to identify forward-looking statements.References in the presentation to assumptions, estimates and outcomes and forward-looking statements about assumptions,estimates and outcomes, which are based on internal business data and external sources, are uncertain given the nature of theindustry, business risks, and other factors. Also, they may be affected by internal and external factors that may have a materialeffect on future business performance and results.No assurance or guarantee is, or should be taken to be, given in relation to the future business performance or results of theDOF ASA Group or the likelihood that the assumptions, estimates or outcomes will be achieved.While management has taken every effort to ensure the accuracy of the material in the presentation, the presentation is providedfor information only. DOF ASA , its officers and management exclude and disclaim any liability in respect of anything done inreliance on the presentation.All forward-looking statements made in this presentation are based on information presently available to management and DOFASA assumes no obligation to update any forward looking- statements. Nothing in this presentation constitutes investmentadvice and this presentation shall not constitute an offer to sell or the solicitation of any offer to buy any securities or otherwiseengage in any investment activity.You should make your own enquiries and take your own advice (including financial and legal advice) before making aninvestment in the company's shares or in making a decision to hold or sell your shares.
33


![DOF ASA Annualreport 2010 Single[1]](https://img.pdfslide.net/doc/110x75/5452406db1af9f76248b4f21/dof-asa-annualreport-2010-single1.jpg)