Embed Size (px)
Citation preview
28 February, 2019
Q4 & FY 2018 RESULTS
Q4 & FY 2018 Results
1
INDEX 2018 targets delivered. 2020 strategic objectives on track 2
Key metrics for the period 6
Full year 2018 6
Fourth quarter 2018 8
Net income performance by business segment 9
Upstream 9
Downstream 12
Corporate and others 13
Net income analysis: Special items 14
Special items 14
Cash flow analysis: Adjusted cash flow statement 15
Net debt analysis: Net debt evolution 16
Relevant events 17
Appendix I – Financial metrics and operating indicators by segment 21
Operating indicators 28
Appendix II – Consolidated Financial Statements 31
Appendix III – Reconciliation of non-IFRS metrics to IFRS disclosures 35
Appendix IV – Basis of presentation 39
Basis of preparation of the financial information 40
Q4 & FY 2018 Results
2
2018 & 4Q18 Key Performance Indicators
(Unaudited figures)
2018 Highlights: Targets delivered
Results (€ Million) Q4 2017 Q3 2018 Q4 2018% Change
Q4 18/Q4 17
Jan - Dec
2017
Jan - Dec
2018
% Change
2018/2017
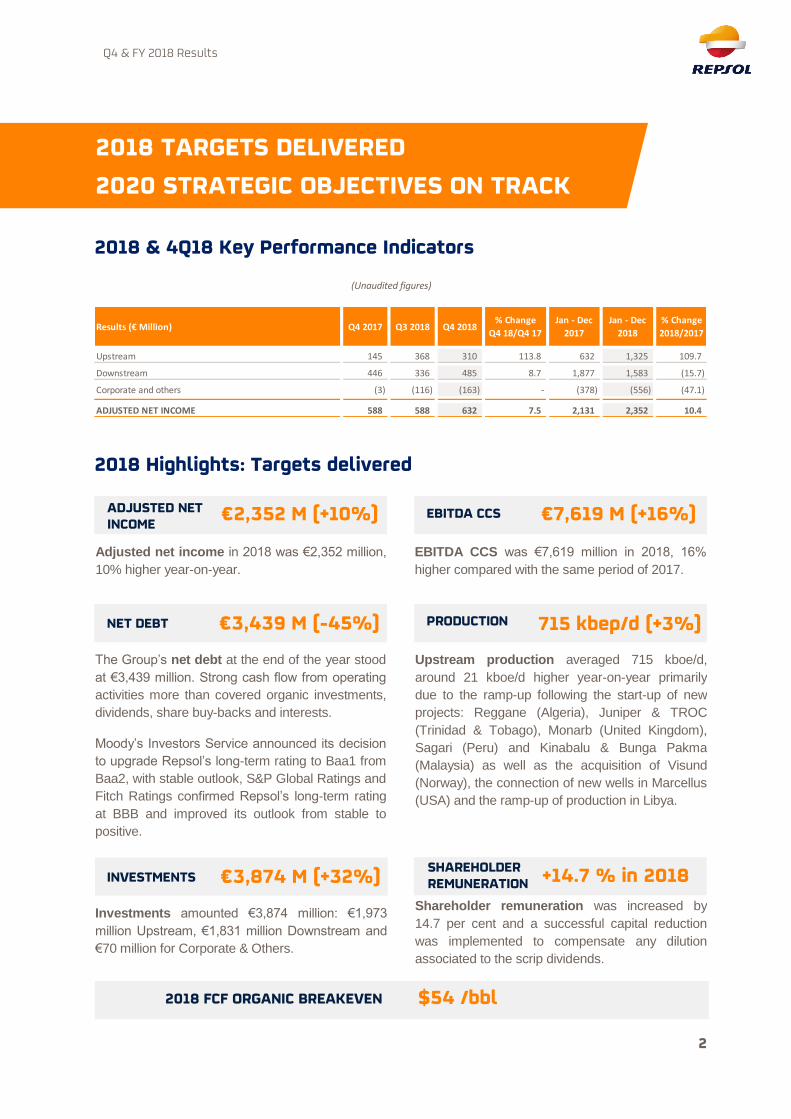
Upstream 145 368 310 113.8 632 1,325 109.7
Downstream 446 336 485 8.7 1,877 1,583 (15.7)
Corporate and others (3) (116) (163) - (378) (556) (47.1)
ADJUSTED NET INCOME 588 588 632 7.5 2,131 2,352 10.4
2018 TARGETS DELIVERED
2020 STRATEGIC OBJECTIVES ON TRACK
Adjusted net income in 2018 was €2,352 million,
10% higher year-on-year.
EBITDA CCS was €7,619 million in 2018, 16%
higher compared with the same period of 2017.
Investments amounted €3,874 million: €1,973
million Upstream, €1,831 million Downstream and
€70 million for Corporate & Others.
Shareholder remuneration was increased by
14.7 per cent and a successful capital reduction
was implemented to compensate any dilution
associated to the scrip dividends.
INVESTMENTS
€3,874 M (+32%)
SHAREHOLDER REMUNERATION
+14.7 % in 2018
ADJUSTED NET INCOME
€2,352 M (+10%) EBITDA CCS €7,619 M (+16%)
The Group’s net debt at the end of the year stood
at €3,439 million. Strong cash flow from operating
activities more than covered organic investments,
dividends, share buy-backs and interests.
Moody’s Investors Service announced its decision
to upgrade Repsol’s long-term rating to Baa1 from
Baa2, with stable outlook, S&P Global Ratings and
Fitch Ratings confirmed Repsol’s long-term rating
at BBB and improved its outlook from stable to
positive.
Upstream production averaged 715 kboe/d,
around 21 kboe/d higher year-on-year primarily
due to the ramp-up following the start-up of new
projects: Reggane (Algeria), Juniper & TROC
(Trinidad & Tobago), Monarb (United Kingdom),
Sagari (Peru) and Kinabalu & Bunga Pakma
(Malaysia) as well as the acquisition of Visund
(Norway), the connection of new wells in Marcellus
(USA) and the ramp-up of production in Libya.
NET DEBT €3,439 M (-45%) PRODUCTION 715 kbep/d (+3%)
2018 FCF ORGANIC BREAKEVEN
$54 /bbl
Q4 & FY 2018 Results
3
4Q18 Highlights
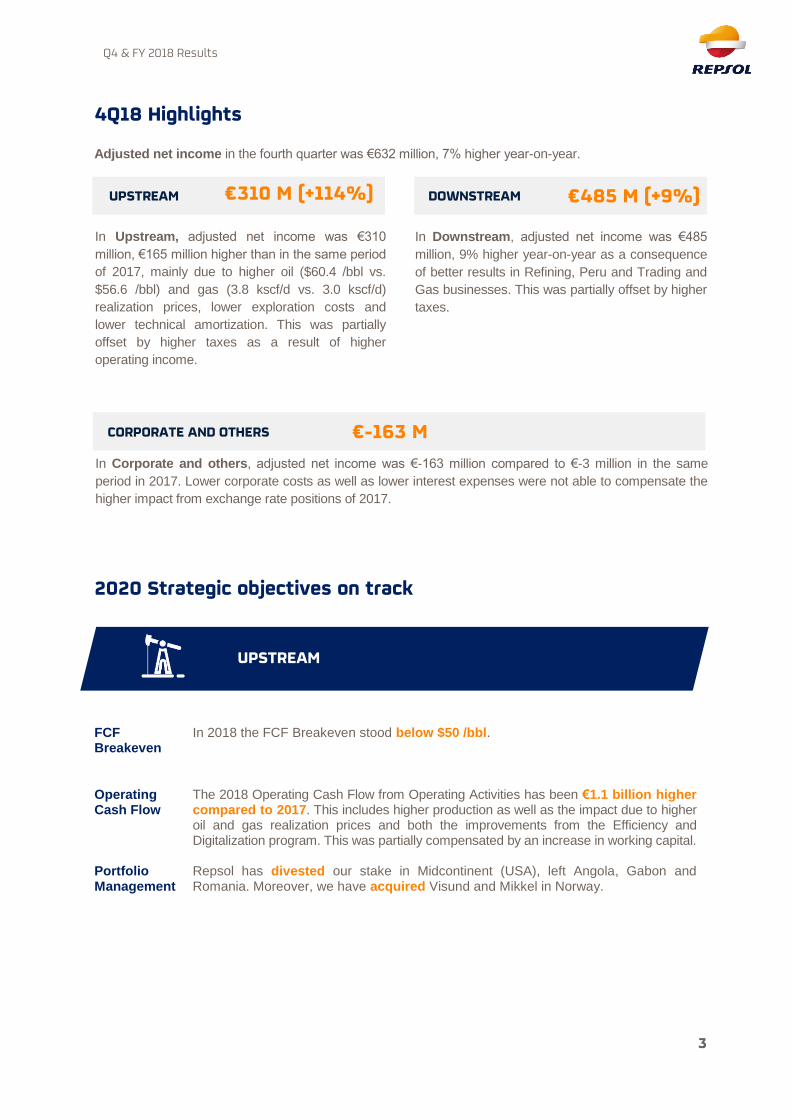
Adjusted net income in the fourth quarter was €632 million, 7% higher year-on-year.
2020 Strategic objectives on track
FCF Breakeven
In 2018 the FCF Breakeven stood below $50 /bbl.
Operating Cash Flow
The 2018 Operating Cash Flow from Operating Activities has been €1.1 billion higher compared to 2017. This includes higher production as well as the impact due to higher oil and gas realization prices and both the improvements from the Efficiency and Digitalization program. This was partially compensated by an increase in working capital.
Portfolio Management
Repsol has divested our stake in Midcontinent (USA), left Angola, Gabon and Romania. Moreover, we have acquired Visund and Mikkel in Norway.
UPSTREAM
In Upstream, adjusted net income was €310
million, €165 million higher than in the same period
of 2017, mainly due to higher oil ($60.4 /bbl vs.
$56.6 /bbl) and gas (3.8 kscf/d vs. 3.0 kscf/d)
realization prices, lower exploration costs and
lower technical amortization. This was partially
offset by higher taxes as a result of higher
operating income.
In Downstream, adjusted net income was €485
million, 9% higher year-on-year as a consequence
of better results in Refining, Peru and Trading and
Gas businesses. This was partially offset by higher
taxes.
UPSTREAM €310 M (+114%) DOWNSTREAM €485 M (+9%)
In Corporate and others, adjusted net income was €-163 million compared to €-3 million in the same
period in 2017. Lower corporate costs as well as lower interest expenses were not able to compensate the
higher impact from exchange rate positions of 2017.
CORPORATE AND OTHERS €-163 M
Q4 & FY 2018 Results
4
Development of new projects
o Start of Buckskin’s development. Production startup is expected during 2H19.
o Phase 1 Development of Akacias (block CPO-9) in Colombia was approved.
o The Norwegian authorities approved the development plan of YME.
o Sanction of two new gas developments offshore Trinidad: Cassia Compression
and Matapal.
o Angelin in Trinidad and Tobago started up its gas production in the 1Q19.
Refining
Repsol is perfectly positioned to benefit from the upcoming IMO regulation, and we
continue working towards optimizing our refining operations to maximize the value to
be captured by 2020.
Lubricants
Repsol teamed up with Bardahl to produce and distribute lubricants in Mexico as well
as in other American countries, bolstering the internationalization strategy of the
company’s lubricants unit. We are currently producing lubricants in Mexico under
Repsol brand
Marketing
o During the year, the first service stations in Mexico were inaugurated with the
objective of reaching a market share of 8-10% over the next five years.
Nowadays, Repsol has more than 180 service stations operating, out of the 240
contracts already signed.
o Likewise Repsol acquired Puma Energy’ service stations in Peru, increasing
the sales volumes by 10%.
o Waylet, our free mobile payment app that was launched in 2017, reached in 2018
one million users and about 7 million registered payments in our service stations.
Agreements have been signed with 2,400 stores, and 3,350 service stations.
o Repsol and Kia launched Wible, a new car sharing service in Madrid with 500
cars.
Low Carbon Business
Repsol is quickly delivering on our business growth target while advancing
through the energy transition:
o Viesgo’s assets transaction was completed in early November.
o We acquired Valdesolar Hive S.L., obtaining permits to develop a 264 MW solar
project in Spain.
o Repsol takes part in the Windfloat Atlantic Project, an offshore windfarm with
three cutting-edge wind turbines and a 25 MW capacity.
o All this will allow Repsol to reach more than 70 per cent of the 4.5 GW of
unregulated low-emissions generation capacity target in 2025.
DOWNSTREAM
Q4 & FY 2018 Results
5
2020 Sustainable savings
Capex savings
The already implemented initiatives from the Efficiencies and Digitalization program
will generate around €350 million of positive impact within the Operating Cash
Flow from Operating Activities of 2020:
In Upstream, the improvements are originated mainly due to the implementation of
initiatives that reduce the maintenance, logistic and decommissioning costs, as well
as gas commercialization initiatives. It is to be highlighted the management of the
assets in the United Kingdom due to the fact that the operating and management
implemented initiatives are accountable for ~10% of the efficiencies in 2018.
In Downstream, the generated savings are originated mainly due to the
implementation of cross-cutting management initiatives throughout the businesses,
as well as process digitalization initiatives and crude loads optimization.
Corporation has been able to be more efficient, being its cost a 6% lower than
forecasted.
Furthermore, this program has contributed to manage effectively the investments,
generating efficiencies of around $250 million compared to the 2018 budget.
These Capex savings correspond to improvements in the drilling program, better
project execution, contract management and the implementation of new
technologies.
EFFICIENCIES AND DIGITALIZATION
Q4 & FY 2018 Results
6
(Unaudited figures)1
(*) 1,000 Mcf/d = 28.32 Mm3/d = 0.178 Mboe/d.
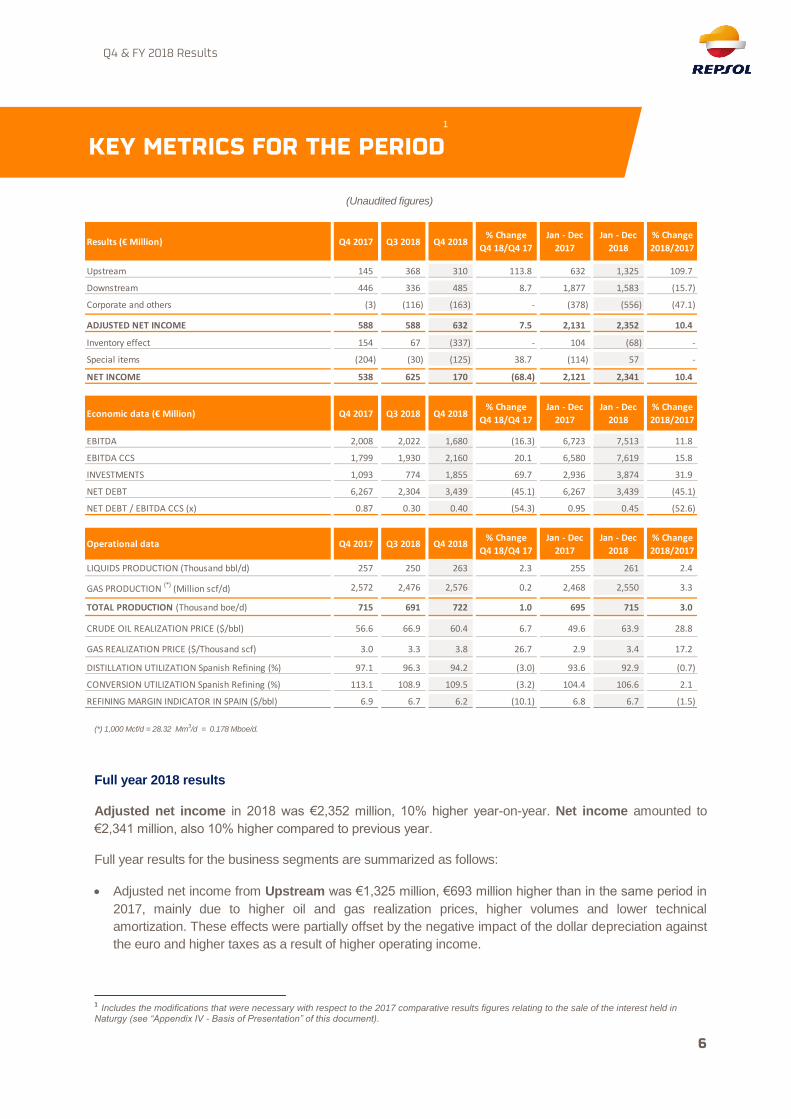
Full year 2018 results
Adjusted net income in 2018 was €2,352 million, 10% higher year-on-year. Net income amounted to
€2,341 million, also 10% higher compared to previous year.
Full year results for the business segments are summarized as follows:
Adjusted net income from Upstream was €1,325 million, €693 million higher than in the same period in
2017, mainly due to higher oil and gas realization prices, higher volumes and lower technical
amortization. These effects were partially offset by the negative impact of the dollar depreciation against
the euro and higher taxes as a result of higher operating income.
1 Includes the modifications that were necessary with respect to the 2017 comparative results figures relating to the sale of the interest held in Naturgy (see “Appendix IV - Basis of Presentation” of this document).
Results (€ Million) Q4 2017 Q3 2018 Q4 2018% Change
Q4 18/Q4 17
Jan - Dec
2017
Jan - Dec
2018
% Change
2018/2017
Upstream 145 368 310 113.8 632 1,325 109.7
Downstream 446 336 485 8.7 1,877 1,583 (15.7)
Corporate and others (3) (116) (163) - (378) (556) (47.1)
ADJUSTED NET INCOME 588 588 632 7.5 2,131 2,352 10.4
Inventory effect 154 67 (337) - 104 (68) -
Special items (204) (30) (125) 38.7 (114) 57 -
NET INCOME 538 625 170 (68.4) 2,121 2,341 10.4
Economic data (€ Million) Q4 2017 Q3 2018 Q4 2018% Change
Q4 18/Q4 17
Jan - Dec
2017
Jan - Dec
2018
% Change
2018/2017
EBITDA 2,008 2,022 1,680 (16.3) 6,723 7,513 11.8
EBITDA CCS 1,799 1,930 2,160 20.1 6,580 7,619 15.8
INVESTMENTS 1,093 774 1,855 69.7 2,936 3,874 31.9
NET DEBT 6,267 2,304 3,439 (45.1) 6,267 3,439 (45.1)
NET DEBT / EBITDA CCS (x) 0.87 0.30 0.40 (54.3) 0.95 0.45 (52.6)
Operational data Q4 2017 Q3 2018 Q4 2018% Change
Q4 18/Q4 17
Jan - Dec
2017
Jan - Dec
2018
% Change
2018/2017
LIQUIDS PRODUCTION (Thousand bbl/d) 257 250 263 2.3 255 261 2.4
GAS PRODUCTION (*)
(Million scf/d) 2,572 2,476 2,576 0.2 2,468 2,550 3.3
TOTAL PRODUCTION (Thousand boe/d) 715 691 722 1.0 695 715 3.0
CRUDE OIL REALIZATION PRICE ($/bbl) 56.6 66.9 60.4 6.7 49.6 63.9 28.8
GAS REALIZATION PRICE ($/Thousand scf) 3.0 3.3 3.8 26.7 2.9 3.4 17.2
DISTILLATION UTILIZATION Spanish Refining (%) 97.1 96.3 94.2 (3.0) 93.6 92.9 (0.7)
CONVERSION UTILIZATION Spanish Refining (%) 113.1 108.9 109.5 (3.2) 104.4 106.6 2.1
REFINING MARGIN INDICATOR IN SPAIN ($/bbl) 6.9 6.7 6.2 (10.1) 6.8 6.7 (1.5)
KEY METRICS FOR THE PERIOD 1
Q4 & FY 2018 Results
7
Upstream production averaged 715 kboe/d, around 21 kboe/d higher year-on-year primarily due to the
ramp-up following the start-up of new projects: Reggane (Algeria), Juniper & TROC (Trinidad &
Tobago), Monarb (United Kingdom), Sagari (Peru) and Kinabalu & Bunga Pakma (Malaysia) as well as
the acquisition of Visund (Norway), the connection of new wells in Marcellus (USA) and the ramp-up of
production in Libya. This was partially offset by the sale of assets, principally SK (Russia) and
MidContinent (USA), as well as the natural decline of fields and a lower gas demand in Venezuela.
Organic Reserve Replacement Ratio in the year 2018 stood at 87%. Likewise, the total Reserve
Replacement Ratio in 2018 stood at 94%.
In Downstream, adjusted net income was €1,583 million, 16% lower year-on-year mainly because of
lower margins and lower volumes in the Chemicals business as well as lower contribution from both the
Spanish and Peruvian refining businesses. This was partially offset by higher results from the
commercial businesses (Marketing and LPG) and the good performance of the Trading and Gas
businesses.
In Corporate and others, adjusted net income was € -556 million compared to €-378 million in the
same period of 2017. In Corporate and Adjustments the adjusted operating income was in line year-on-
year. In the Financial Results, lower interest expenses were not able to compensate higher discounting
of provisions expenses, lower capitalized interests and higher results from the exchange rate position
taken in 2017.
EBITDA CCS was €7,619 million in 2018, 16% higher compared with the same period of 2017.
Strong cash flow from operating activities more than covered organic investments, dividends, share
buy-backs and interests during 2018. The strong performance of the businesses along with the divestment
in Naturgy allowed for a net debt reduction of €2,828 million year-on-year reaching a final figure of €3,439
million net debt at the end of 2018.
At the end of 2018 the net debt to capital employed ratio stood at 10%.
The already implemented initiatives from the Efficiencies and Digitalization program will generate around
€350 million of positive impact within the Operating Cash Flow from Operating Activities of 2020:
In Upstream, the improvements are originated mainly due to the implementation of initiatives that
reduce the maintenance, logistic and decommissioning costs, as well as gas commercialization
initiatives. It is to be highlighted the management of the assets in the United Kingdom due to the fact that
the operating and management implemented initiatives are accountable for ~10% of the efficiencies in
2018.
In Downstream, the generated savings are originated mainly due to the implementation of cross-cutting
management initiatives throughout the businesses, as well as process digitalization initiatives and crude
loads optimization.
Corporation has been able to be more efficient, being its cost a 6% lower than forecasted.
Furthermore, this program has contributed to manage effectively the investments, generating efficiencies of
around $250 million compared to the 2018 budget. These Capex savings correspond to improvements in
the drilling program, better project execution, contract management and the implementation of new
technologies.
Q4 & FY 2018 Results
8
Fourth quarter 2018 results
Adjusted net income in the fourth quarter was €632 million, 7% higher year-on-year. Net income
amounted to €170 million, €368 million lower year-on-year.
Quarterly results for the business segments are summarized as follows:
In Upstream, adjusted net income was €310 million, €165 million higher than in the same period of
2017, mainly due to higher oil and gas realization prices, lower exploration costs and lower technical
amortization. This was partially offset by higher taxes as a result of higher operating income.
Upstream production reached an average of 722 kboe/d in the fourth quarter of 2018, 7 kboe/d higher
year-on-year, primarily due to the ramp-up following the start-up of new projects: Reggane (Algeria),
Sagari (Peru) and Kinabalu & Bunga Pakma (Malaysia) as well as the acquisition of Visund (Norway)
and the connection of new wells in Marcellus (USA). This was partially offset by the sale of assets,
principally SK (Russia) and MidContinent (USA), as well as the natural decline of fields, the stoppage of
production in Libya since the 9th of December, 2018 and lower gas demand in Venezuela.
In Downstream, adjusted net income was €485 million, 9% higher year-on-year as a consequence of
better results in the Refining, Peru and the Trading and Gas businesses. This was partially offset by
higher taxes.
In Corporate and others, adjusted net income was €-163 million compared to €-3 million in the same
period in 2017. Lower corporate costs as well as lower interest financial expenses were not able to
compensate the higher impact from exchange rate positions of 2017.
EBITDA CCS in the fourth quarter of 2018 was €2,160 million, 20% higher compared to that of the fourth
quarter of 2017.
The Group’s net debt at the end of the quarter stood at €3,439 million, €1,135 million higher than at the end
of the third quarter of 2018, mainly due to the closing of the acquisition of the low-emission assets of Viesgo
for €732 million as well as the ending of the share buy-back program that started on September 3. Strong
cash flow from operating activities more than covered organic investments, share buy-backs and interests.
Q4 & FY 2018 Results
9
Upstream
(Unaudited figures)
(*) Only direct costs attributable to exploration projects. (**) 1,000 Mcf/d = 28.32 Mm3/d = 0.178 Mboe/d
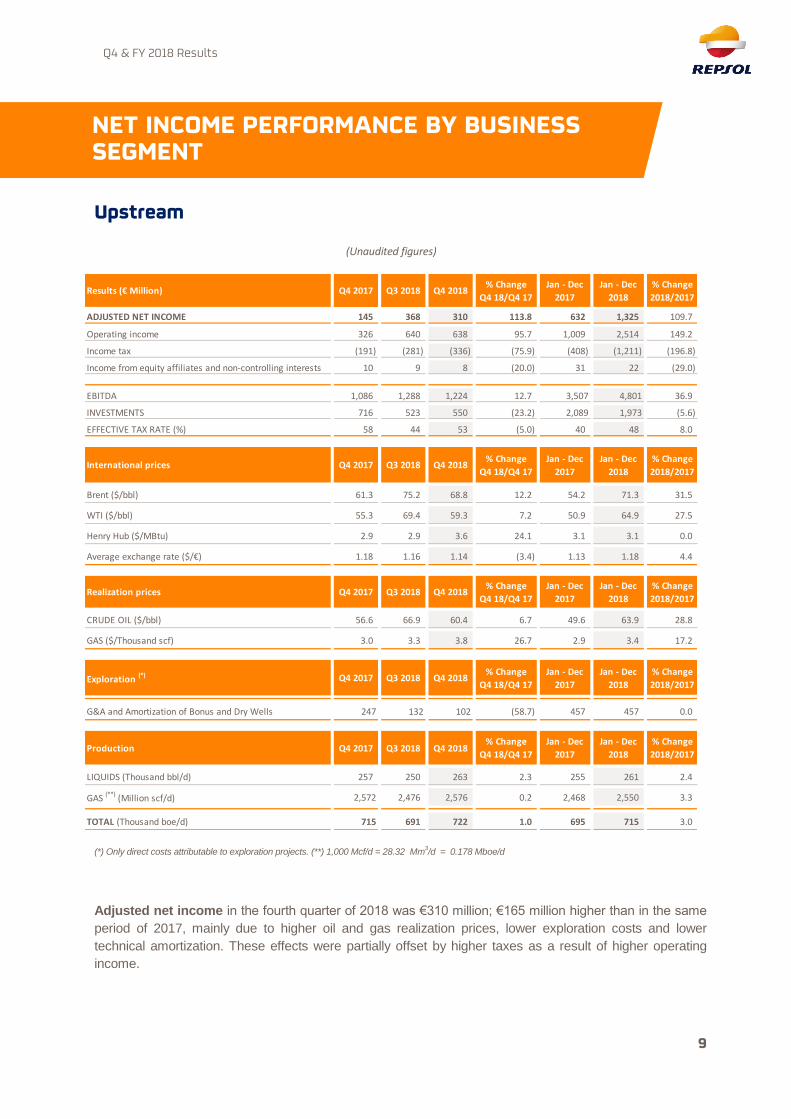
Adjusted net income in the fourth quarter of 2018 was €310 million; €165 million higher than in the same
period of 2017, mainly due to higher oil and gas realization prices, lower exploration costs and lower
technical amortization. These effects were partially offset by higher taxes as a result of higher operating
income.
Results (€ Million) Q4 2017 Q3 2018 Q4 2018% Change
Q4 18/Q4 17
Jan - Dec
2017
Jan - Dec
2018
% Change
2018/2017
ADJUSTED NET INCOME 145 368 310 113.8 632 1,325 109.7
Operating income 326 640 638 95.7 1,009 2,514 149.2
Income tax (191) (281) (336) (75.9) (408) (1,211) (196.8)
Income from equity affiliates and non-controlling interests 10 9 8 (20.0) 31 22 (29.0)
EBITDA 1,086 1,288 1,224 12.7 3,507 4,801 36.9
INVESTMENTS 716 523 550 (23.2) 2,089 1,973 (5.6)
EFFECTIVE TAX RATE (%) 58 44 53 (5.0) 40 48 8.0
International prices Q4 2017 Q3 2018 Q4 2018% Change
Q4 18/Q4 17
Jan - Dec
2017
Jan - Dec
2018
% Change
2018/2017
Brent ($/bbl) 61.3 75.2 68.8 12.2 54.2 71.3 31.5
WTI ($/bbl) 55.3 69.4 59.3 7.2 50.9 64.9 27.5
Henry Hub ($/MBtu) 2.9 2.9 3.6 24.1 3.1 3.1 0.0
Average exchange rate ($/€) 1.18 1.16 1.14 (3.4) 1.13 1.18 4.4
Realization prices Q4 2017 Q3 2018 Q4 2018% Change
Q4 18/Q4 17
Jan - Dec
2017
Jan - Dec
2018
% Change
2018/2017
CRUDE OIL ($/bbl) 56.6 66.9 60.4 6.7 49.6 63.9 28.8
GAS ($/Thousand scf) 3.0 3.3 3.8 26.7 2.9 3.4 17.2
Exploration (*) Q4 2017 Q3 2018 Q4 2018% Change
Q4 18/Q4 17
Jan - Dec
2017
Jan - Dec
2018
% Change
2018/2017
G&A and Amortization of Bonus and Dry Wells 247 132 102 (58.7) 457 457 0.0
Production Q4 2017 Q3 2018 Q4 2018% Change
Q4 18/Q4 17
Jan - Dec
2017
Jan - Dec
2018
% Change
2018/2017
LIQUIDS (Thousand bbl/d) 257 250 263 2.3 255 261 2.4
GAS (**)
(Million scf/d) 2,572 2,476 2,576 0.2 2,468 2,550 3.3
TOTAL (Thousand boe/d) 715 691 722 1.0 695 715 3.0
NET INCOME PERFORMANCE BY BUSINESS SEGMENT
Q4 & FY 2018 Results
10
The principal factors that explain the variations in the year-on-year performance in the Upstream division
are as follows:
Higher crude oil and gas realization prices had a positive impact on the operating income of €218
million.
The volume effect impacted positively the operating income by €12 million.
Higher royalties contributed negatively to the operating income by €-51 million.
Lower exploration expenses contributed positively to the operating income by €142 million.
Depreciation and amortization charges were €30 million lower mainly due to the application of the
new calculation formula for the depreciation of productive assets in 2018.
Income tax expense impacted the adjusted net income negatively by €-145 million, as a result of higher
operating income.
Income from equity affiliates and non-controlling interests, exchange rate and others explain the
remaining differences.
Upstream production reached an average of 722 kboe/d in the fourth quarter of 2018, 7 kboe/d higher
year-on-year, primarily due to the ramp-up following the start-up of new projects: Reggane (Algeria), Sagari
(Peru) and Kinabalu & Bunga Pakma (Malaysia) as well as the acquisition of Visund (Norway) and the
connection of new wells in Marcellus (USA). This was partially offset by the sale of assets, principally SK
(Russia) and MidContinent (USA), as well as the natural decline of fields, the stoppage of production in
Libya since the 9th of December, 2018 and a lower gas demand in Venezuela.
Full year 2018 results
Adjusted net income for 2018 from Upstream was €1,325 million, €693 million higher than in the same
period in 2017, mainly due to higher oil and gas realization prices, higher volumes and lower technical
amortization. These effects were partially offset by the negative impact of the dollar depreciation against the
euro and higher taxes as a result of higher operating income.
Upstream production averaged 715 kboe/d, 21 kboe/d higher year-on-year primarily due to the ramp-up
following the start-up of new projects: Reggane (Algeria), Juniper & TROC (Trinidad & Tobago), Monarb
(United Kingdom), Sagari (Peru) and Kinabalu & Bunga Pakma (Malaysia) as well as the acquisition of
Visund (Norway), the connection of new wells in Marcellus (USA) and the ramp-up of production in Libya.
This was partially offset by the sale of assets, principally SK (Russia) and MidContinent (USA), as well as
the natural decline of fields and a lower gas demand in Venezuela.
During 2018, 21 exploration wells and 1 appraisal well were concluded. 5 were declared positive (4
exploration and 1 appraisal), 1 is currently under evaluation, while the remaining 16 wells were deemed
unsuccessful.
Of these, last week Repsol obtained positive news from the company-operated Kaliberau Dalam well in
Sakakemang block, in Indonesia. The preliminary estimation is of at least 2 trillion cubic feet of recoverable
resources, the largest discovery in Indonesia in 18 years. The consortium will continue the exploratory work
with an additional appraisal well planned in the coming months, being Indonesia the focus of Repsol’s
exploration investments in South East Asia.
Q4 & FY 2018 Results
11
In addition, new exploratory licenses were acquired in 2018 in Mexico, Brazil, Norway, Greece, Indonesia,
Bulgaria and the United States, specifically in the state of Alaska, where Repsol has made significant
hydrocarbon discoveries. This reinforces the strategy to enhance a strong exploratory portfolio post 2020
focused on Repsol’s strengths.
Investments
Investments in Upstream in the fourth quarter of 2018 amounted to €550 million; €166 million lower than in
the fourth quarter of 2017.
Development investment accounted for 69% of the total investment and was concentrated mainly in
the United States (29%), Norway (20%), Canada (17%), Trinidad and Tobago (10%), Brazil (4%),
Colombia (4%) and Indonesia (4%).
Exploration investment represented 25% of the total and was allocated primarily in Trinidad and
Tobago (16%), Indonesia (15%), Bulgaria (9%), the U.S. (9%), Colombia (7%), Bolivia (5%), Greece
(5%) and Norway (5%).
Investments in Upstream in 2018 amounted €1,973 million, €116 million lower than in 2017.
Development investment accounted for 70% of the total investment and was concentrated mainly in
the United States (29%), Canada (16%), Norway (13%), Trinidad and Tobago (10%), Peru (5%), Algeria
(4%), Indonesia (4%), Vietnam (4%) and Malaysia (4%).
Exploration investment represented 21% of the total and was allocated primarily in Mexico (18%),
Indonesia (10%), Trinidad and Tobago (10%), Bolivia (7%), the United States (6%), Brazil (5%),
Romania (5%) and Norway (5%).
Additionally, the remaining investments correspond mainly to acquisition of new asset in Norway (Visund).

Q4 & FY 2018 Results
12
(Unaudited figures)
Adjusted net income in the fourth quarter of 2018 amounted to €485 million, €39 million higher compared to
the fourth quarter of 2017.
The principal factors that explain the variations in the year-on-year performance in the Downstream business
are as follows:
In Refining, operating income was €13 million higher mainly due to higher margins in Peru. In Spain,
wider middle distillates spreads were not able to compensate weaker gasolines spreads, higher energy
costs and narrower light-to-heavy crude oil spreads within the margin indicator.
In Chemicals, the results were in line year-on-year mainly due a good margins performance.
In the commercial businesses, Marketing, Lubricants and LPG, operating income was in line year-on-
year mainly due to a higher contribution from the regulated part of the LPG business, offset by building-
up our position in Mexico.
In Trading and Gas, operating income was €92 million higher than in the fourth quarter of 2017, mainly
due to higher margins in the commercialization and trading of gas in North America.
Results (€ Million) Q4 2017 Q3 2018 Q4 2018% Change
Q4 18/Q4 17
Jan - Dec
2017
Jan - Dec
2018
% Change
2018/2017
ADJUSTED NET INCOME 446 336 485 8.7 1,877 1,583 (15.7)
Operating income 547 442 716 30.9 2,467 2,143 (13.1)
Income tax (99) (106) (191) (92.9) (572) (526) 8.0
Income from equity affiliates and non-controlling interests (2) 0 (40) - (18) (34) (88.9)
AVERAGE WEIGHTED COST ADJUSTED NET INCOME 600 403 148 (75.3) 1,981 1,515 (23.5)
Inventory effect 154 67 (337) - 104 (68) -
EBITDA 964 741 469 (51.3) 3,386 2,859 (15.6)
EBITDA CCS 755 649 949 25.7 3,243 2,965 (8.6)
INVESTMENTS 360 235 1,271 253.1 805 1,831 127.5
EFFECTIVE TAX RATE (%) 18 23 27 9.0 23 25 2.0
Operational data Q4 2017 Q3 2018 Q4 2018% Change
Q4 18/Q4 17
Jan - Dec
2017
Jan - Dec
2018
% Change
2018/2017
REFINING MARGIN INDICATOR IN SPAIN ($/bbl) 6.9 6.7 6.2 (10.1) 6.8 6.7 (1.5)
DISTILLATION UTILIZATION Spanish Refining (%) 97.1 96.3 94.2 (3.0) 93.6 92.9 (0.7)
CONVERSION UTILIZATION Spanish Refining (%) 113.1 108.9 109.5 (3.2) 104.4 106.6 2.1
OIL PRODUCT SALES (Thousand tons) 13,323 13,303 13,246 (0.6) 51,836 51,766 (0.1)
PETROCHEMICAL PRODUCT SALES (Thousand tons) 708 622 674 (4.8) 2,855 2,610 (8.6)
LPG SALES (Thousand tons) 378 241 350 (7.4) 1,375 1,330 (3.3)
NORTH AMERICA NATURAL GAS SALES (TBtu) 120.5 131.0 131.3 9.0 496.2 520.2 4.8
International prices ($/Mbtu) Q4 2017 Q3 2018 Q4 2018% Change
Q4 18/Q4 17
Jan - Dec
2017
Jan - Dec
2018
% Change
2018/2017
Henry Hub 2.9 2.9 3.6 24.1 3.1 3.1 0.0
Algonquin 5.3 3.0 5.0 (5.7) 3.7 4.8 29.7
Downstream
Q4 & FY 2018 Results
13
The appreciation of the dollar against the euro had a positive impact on the operating income of €15
million.
Results in other activities, equity affiliates and non-controlling interests and taxes cover the
remaining difference.
Full year 2018 results
Adjusted net income for 2018 was €1,583 million, 16% lower year-on-year mainly due to lower margins
and volumes in the Chemicals business as well as lower contribution from the refining businesses in Spain
and Peru. These effects were partially offset by better results in the commercial businesses (Marketing and
LPG) as well as the good performance from the Trading and Gas businesses.
Investment
Investment in Downstream in the fourth quarter and the full year of 2018 amounted to €1,271 and €1,831
million respectively.
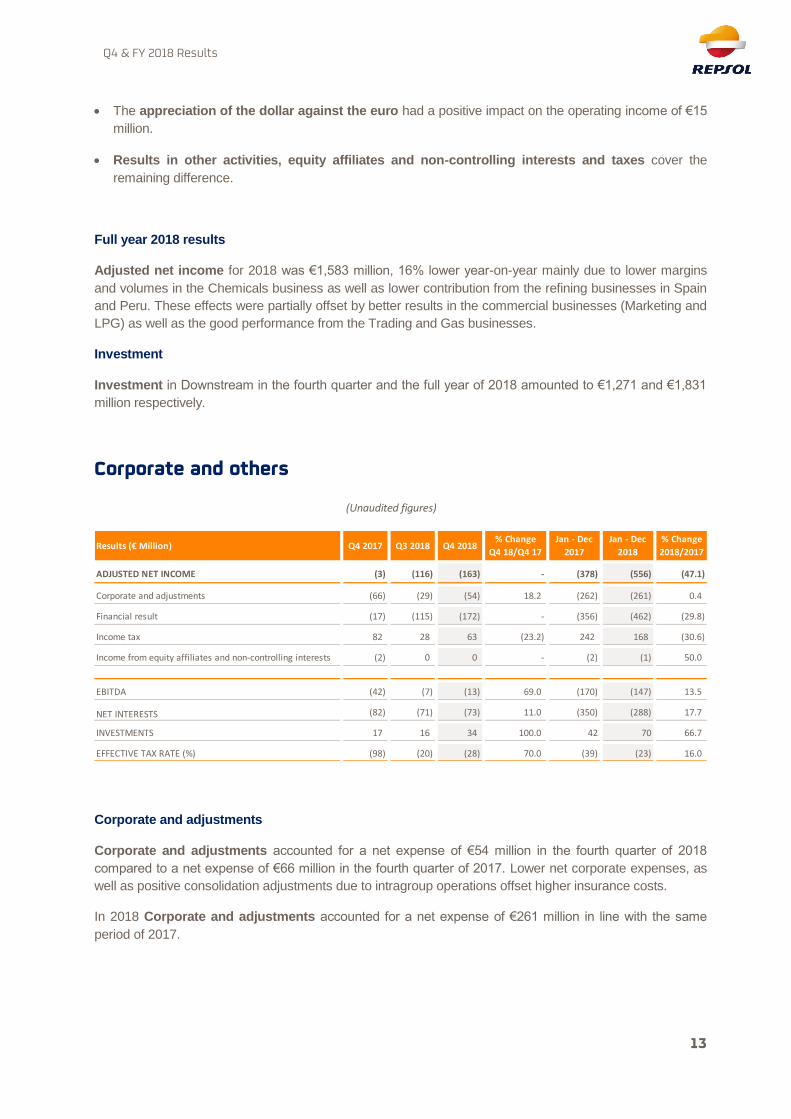
Corporate and others
(Unaudited figures)
Corporate and adjustments
Corporate and adjustments accounted for a net expense of €54 million in the fourth quarter of 2018
compared to a net expense of €66 million in the fourth quarter of 2017. Lower net corporate expenses, as
well as positive consolidation adjustments due to intragroup operations offset higher insurance costs.
In 2018 Corporate and adjustments accounted for a net expense of €261 million in line with the same
period of 2017.
Results (€ Million) Q4 2017 Q3 2018 Q4 2018% Change
Q4 18/Q4 17
Jan - Dec
2017
Jan - Dec
2018
% Change
2018/2017
ADJUSTED NET INCOME (3) (116) (163) - (378) (556) (47.1)
Corporate and adjustments (66) (29) (54) 18.2 (262) (261) 0.4
Financial result (17) (115) (172) - (356) (462) (29.8)
Income tax 82 28 63 (23.2) 242 168 (30.6)
Income from equity affiliates and non-controlling interests (2) 0 0 - (2) (1) 50.0
EBITDA (42) (7) (13) 69.0 (170) (147) 13.5
NET INTERESTS (82) (71) (73) 11.0 (350) (288) 17.7
INVESTMENTS 17 16 34 100.0 42 70 66.7
EFFECTIVE TAX RATE (%) (98) (20) (28) 70.0 (39) (23) 16.0
Q4 & FY 2018 Results
14
Financial results
The financial result in the fourth quarter of 2018 amounted to €-172 million compared with €-17 million in
the fourth quarter of 2017. Lower interest expense and higher results from management of interest rate
positions were not able to offset the higher impact from exchange rate positions of 2017, higher expense in
discounting of provisions and lower capitalized interests.
The financial result in the full year 2018 was €-462 million compared with €-356 million in the same period
of last year. Lower interest expense and higher results from management of interest rate and own share
positions were not able to offset the higher expense in discounting of provisions, lower capitalized interests
and the higher impact from exchange rate positions gains of 2017.
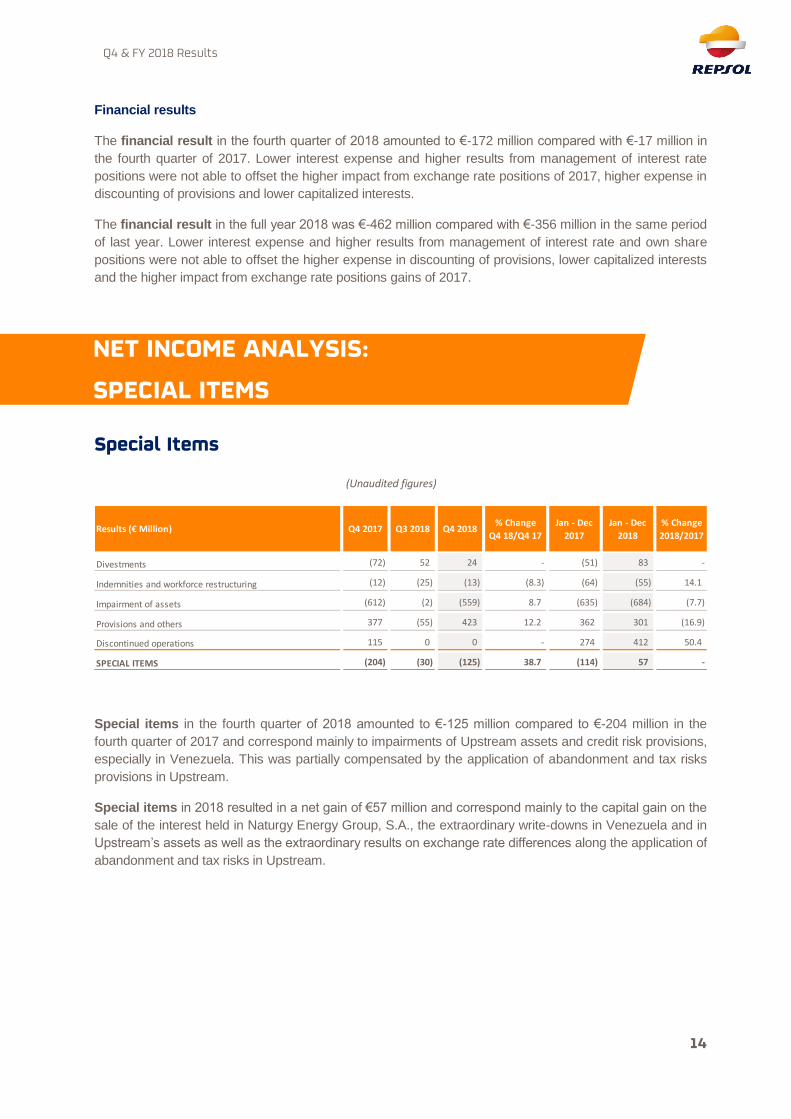
Special Items
(Unaudited figures)
Special items in the fourth quarter of 2018 amounted to €-125 million compared to €-204 million in the
fourth quarter of 2017 and correspond mainly to impairments of Upstream assets and credit risk provisions,
especially in Venezuela. This was partially compensated by the application of abandonment and tax risks
provisions in Upstream.
Special items in 2018 resulted in a net gain of €57 million and correspond mainly to the capital gain on the
sale of the interest held in Naturgy Energy Group, S.A., the extraordinary write-downs in Venezuela and in
Upstream’s assets as well as the extraordinary results on exchange rate differences along the application of
abandonment and tax risks in Upstream.
Results (€ Million) Q4 2017 Q3 2018 Q4 2018% Change
Q4 18/Q4 17
Jan - Dec
2017
Jan - Dec
2018
% Change
2018/2017
Divestments (72) 52 24 - (51) 83 -
Indemnities and workforce restructuring (12) (25) (13) (8.3) (64) (55) 14.1
Impairment of assets (612) (2) (559) 8.7 (635) (684) (7.7)
Provisions and others 377 (55) 423 12.2 362 301 (16.9)
Discontinued operations 115 0 0 - 274 412 50.4
SPECIAL ITEMS (204) (30) (125) 38.7 (114) 57 -
NET INCOME ANALYSIS:
SPECIAL ITEMS
Q4 & FY 2018 Results
15
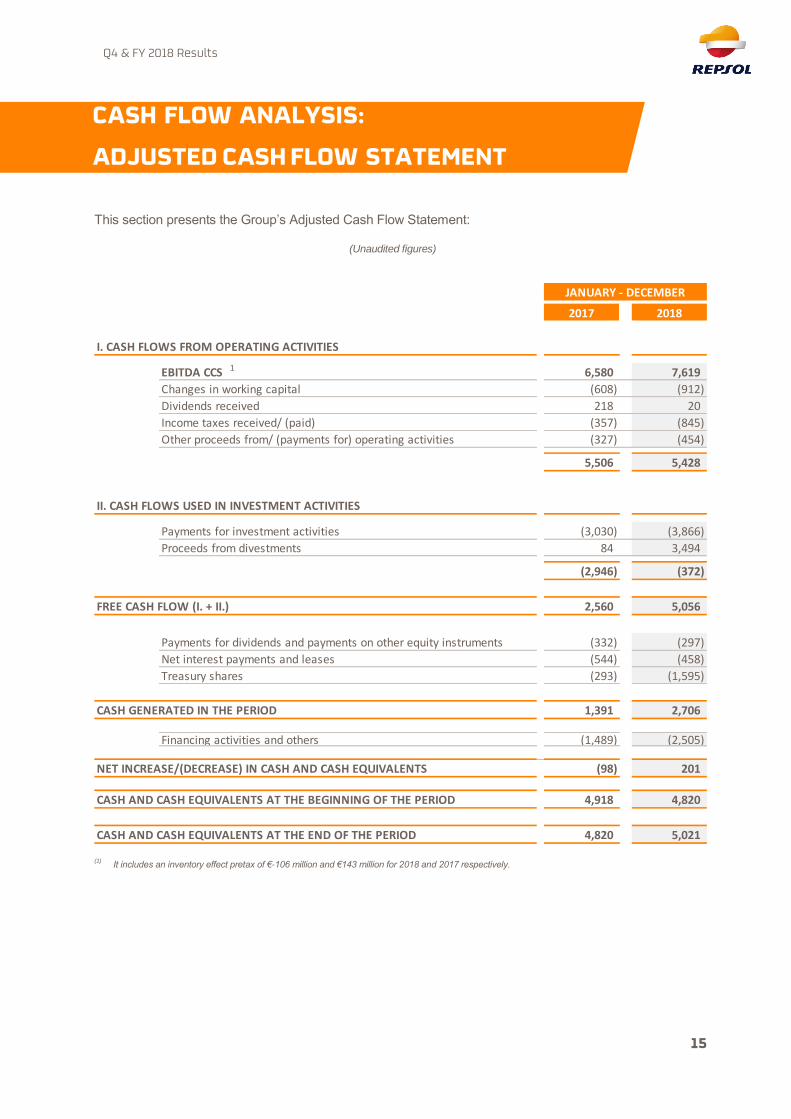
This section presents the Group’s Adjusted Cash Flow Statement:
(Unaudited figures)
(1) It includes an inventory effect pretax of €-106 million and €143 million for 2018 and 2017 respectively.
2017 2018
I. CASH FLOWS FROM OPERATING ACTIVITIES
EBITDA CCS 6,580 7,619
Changes in working capital (608) (912)
Dividends received 218 20
Income taxes received/ (paid) (357) (845)
Other proceeds from/ (payments for) operating activities (327) (454)
5,506 5,428
II. CASH FLOWS USED IN INVESTMENT ACTIVITIES
Payments for investment activities (3,030) (3,866)
Proceeds from divestments 84 3,494
(2,946) (372)
FREE CASH FLOW (I. + II.) 2,560 5,056
Payments for dividends and payments on other equity instruments (332) (297)
Net interest payments and leases (544) (458)
Treasury shares (293) (1,595)
CASH GENERATED IN THE PERIOD 1,391 2,706
Financing activities and others (1,489) (2,505)
NET INCREASE/(DECREASE) IN CASH AND CASH EQUIVALENTS (98) 201
CASH AND CASH EQUIVALENTS AT THE BEGINNING OF THE PERIOD 4,918 4,820
CASH AND CASH EQUIVALENTS AT THE END OF THE PERIOD 4,820 5,021
JANUARY - DECEMBER
1
CASH FLOW ANALYSIS:
ADJUSTED CASH FLOW STATEMENT
Q4 & FY 2018 Results
16
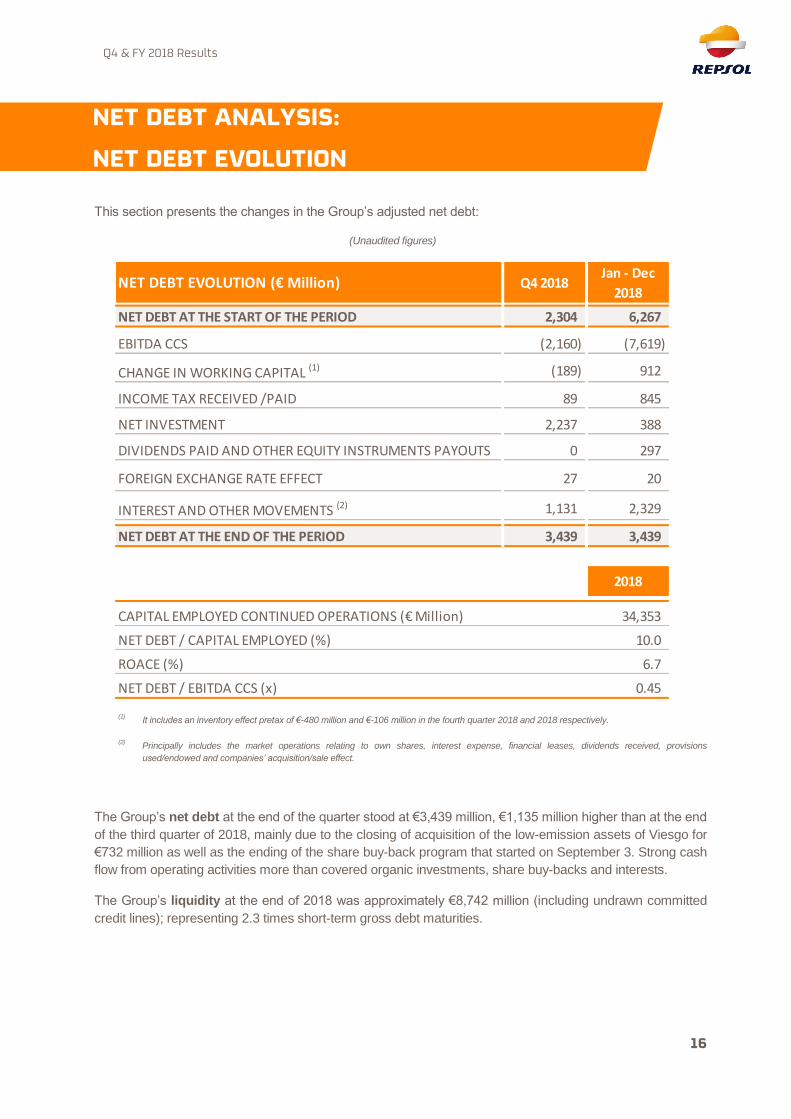
This section presents the changes in the Group’s adjusted net debt:
(Unaudited figures)
(1) It includes an inventory effect pretax of €-480 million and €-106 million in the fourth quarter 2018 and 2018 respectively.
(2) Principally includes the market operations relating to own shares, interest expense, financial leases, dividends received, provisions
used/endowed and companies’ acquisition/sale effect.
The Group’s net debt at the end of the quarter stood at €3,439 million, €1,135 million higher than at the end
of the third quarter of 2018, mainly due to the closing of acquisition of the low-emission assets of Viesgo for
€732 million as well as the ending of the share buy-back program that started on September 3. Strong cash
flow from operating activities more than covered organic investments, share buy-backs and interests.
The Group’s liquidity at the end of 2018 was approximately €8,742 million (including undrawn committed
credit lines); representing 2.3 times short-term gross debt maturities.
NET DEBT EVOLUTION (€ Million) Q4 2018Jan - Dec
2018
NET DEBT AT THE START OF THE PERIOD 2,304 6,267
EBITDA CCS (2,160) (7,619)
CHANGE IN WORKING CAPITAL (1) (189) 912
INCOME TAX RECEIVED /PAID 89 845
NET INVESTMENT 2,237 388
DIVIDENDS PAID AND OTHER EQUITY INSTRUMENTS PAYOUTS 0 297
FOREIGN EXCHANGE RATE EFFECT 27 20
INTEREST AND OTHER MOVEMENTS (2) 1,131 2,329
NET DEBT AT THE END OF THE PERIOD 3,439 3,439
2018
CAPITAL EMPLOYED CONTINUED OPERATIONS (€ Million) 34,353
NET DEBT / CAPITAL EMPLOYED (%) 10.0
ROACE (%) 6.7
NET DEBT / EBITDA CCS (x) 0.45
NET DEBT ANALYSIS:
NET DEBT EVOLUTION
Q4 & FY 2018 Results
17
The main company‐related events since the third quarter 2018 results release were as follows:
NOV. 2018
In November 2018 Repsol acquired 12 exploration blocks in the 2018 oil mining auctions
(Lease Sale) in Alaska. The blocks are situated in the East (9 blocks) and in the South
(3) of the Pikka Unit.
NOV. 2018
In November 2018, Greek government representatives, the public hydrocarbon
managing entity, Repsol and Hellenic Petroleum (ELPE) subscribed a concession
contract for the offshore exploration block Ionian (located in the Ionian Sea). The
contract must be ratified by the Greek parliament in the following months. Repsol and
ELPE will hold a 50% W.I. in the consortium that will explore the area and where Repsol
will assume the role of operator.
DEC. 2018
In December 2018, the Spanish Council of Ministers approved a 10-year extension, until
December 2028, of the Casablanca platform’s concession after Repsol solicited and met
all the technical and administrative requirements. Casablanca’s platform is located 43
km off the coast of Tarragona.
DEC. 2018
In December 2018 the BpTT consortium, formed by BP (70% W.I. and operator) and
Repsol (30% W.I.) approved two new developments for current productive gas fields
located in the territorial waters of Trinidad and Tobago: gas compression project of
Cassia and the Matapal project.
JAN. 2019
In January 2019 the Ministry of Petroleum and Energy of Norway, announced, that
Repsol Norge was awarded a participation in three new exploration licenses, as well as
the extension of a pre-existing license. The new licenses are located in the North Sea:
three within the Egersund great basin and one in the Barents Sea and will reinforce
Repsol’s position in these important areas of interest.
JAN. 2019
In January 2019, the latest exploration activities carried out by Repsol in Alaska were
made public. This confirmed the presence of hydrocarbons within the South part of the
Pikka Unit, where the first appraisal well (Pikka-B) has been completed.
FEB. 2019
In February 2019, Repsol announced an agreement to acquire from Total a 7.65% of the
Mikkel field in Norway. This field currently produces a total of 50 kboe/d.
FEB. 2019
On February 19, Repsol announced the largest gas discovery in Indonesia for 18 years
and one of the ten biggest worldwide in the last twelve months. The Kaliberau Dalam-2X
(KBD-2X) well is located within the onshore block of Sakakemang (south of Sumatra’s
island). Repsol is the operator with a 45% W.I. and this discovery provides a preliminary
estimation of at least 2 trillion cubic feet (TCF) of recoverable resources.
UPSTREAM
RELEVANT EVENTS
Q4 & FY 2018 Results
18
NOV. 2018
On November 2, Repsol completed the purchase of Viesgo's assets and retail
customers. Repsol completed the purchase after obtaining all the necessary regulatory
authorizations for the acquisition of 2,350 megawatts (MW) of low-emissions generation
capacity and a portfolio of more than 750,000 customers.
To market its new energy supply, the company launched Repsol Electricidad y Gas, a
subsidiary that will be chaired by María Victoria Zingoni and headed by CEO Francisco
Vázquez. The company is becoming a relevant player in the Spanish electricity
generation market, with a total installed capacity of 2,950 MW and plans to add an
additional 289 MW in Valdecaballeros (Extremadura, Spain) and Viana do Castelo
(Portugal).
NOV. 2018
On November 14, 2018, His Majesty the King of Spain, Felipe VI, the Constitutional
President of the Republic of Peru, Martín Vizcarra and the President of Repsol S.A.,
Antonio Brufau, inaugurated the new low-sulphur gasoline production units in the
refinery of La Pampilla. The startup of these low-sulphur gasoline units culminate the
$741 million investment process to produce low-sulphur gasoline and diesel in accord
with the commitments acquired by the sector to the government.
OCT. 2018
On October 29, 2018, Fitch Ratings confirmed Repsol’s long-term rating at BBB and
improved its outlook from stable to positive.
OCT. 2018
On October 30, 2018, The Board of Directors resolved, at the proposal of the
Nomination Committee, to appoint by cooptation Mr. Henri Philippe Reichstul as
External Director of the Company and as member of its Delegate Committee.
The Board also agreed, at the proposal of the Nomination Committee, to propose to the
next Annual Shareholders’ Meeting, among the agreements relative to the Board of
Directors composition, the reelection of the Chairman of the Board of Directors, Mr.
Antonio Brufau and of the Chief Executive Officer, Mr. Josu Jon Imaz, both for the
statutory term of four years.
Finally, the Board will also propose, at the proposal of the Nomination Committee, to the
next Annual Shareholders’ Meeting the reduction to 15 the number of members of the
Board of Directors.
OCT. 2018
On October 31, 2018, Repsol announced the expected timetable for the completion of
its paid-up capital increase, approved in the framework of the “Repsol Flexible Dividend”
program by the Shareholders´ Meeting held on May 11, 2018, with respect to point five
of the Agenda, to be implemented in December 2018 and January 2019.
DOWNSTREAM
CORPORATION
Q4 & FY 2018 Results
19
NOV. 2018
On November 8, 2018 the Buy-back program was completed after reaching the
maximum number of shares to be acquired under the Buy-back programme, that is,
62,705,079 shares.
NOV. 2018
On November 14, 2018, Repsol informed that the CEO, pursuant to the delegation
granted in his favor by the Board of Directors, has resolved to carry out the
implementation of the share capital reduction by means of cancellation of own shares,
approved by the Annual Shareholders´ Meeting held on May 11, 2018 under item six of
the agenda.
The share capital of Repsol was reduced in the amount of 68,777,683 euros, through
the cancellation of 68,777,683 own shares with a face value of one euro each. The
share capital resulting from the reduction was set at 1,527,396,053 euros, corresponding
to 1,527,396,053 shares with a face value of one euro each.
NOV. 2018
On November 28, 2018, The Board of Directors of Repsol, S.A. approved the payment
of a remuneration equivalent to 0.425 euros gross per share to its shareholders within
the framework of the Repsol Flexible Dividend Program (in replacement of the traditional
interim dividend of 2018), subject to the applicable rounding in accordance with the
formulas approved by the Annual Shareholders’ Meeting held on May 11, 2018, under
item five on its Agenda. For this purpose, and pursuant to the delegation granted by the
Shareholders’ Meeting, the Board of Directors has today fixed the market value of the
capital increase (“Amount of the Alternative Option”) at 649,143,323 euros.
DEC. 2018
On December 10, 2018, Moody’s Investors Service announced its decision to upgrade
Repsol’s long-term rating to Baa1 from Baa2, with stable outlook.
DEC. 2018
On December 12, 2018, S&P Global Ratings confirmed Repsol’s long-term rating at
BBB and improved its outlook from stable to positive.
DEC. 2018
On December 18, 2018, Repsol published the Informative Document in connection with
the paid-up capital increase approved by the 2018 Annual Shareholders’ Meeting under
item five on the Agenda, as part of the shareholder remuneration program “Repsol
Flexible Dividend” (scrip dividend).
JAN. 2019 On January 11, 2019, Repsol announced the end, on January 9, 2019, of the trading
period of the free-of-charge allocation rights corresponding to the paid up capital
increase implementing the “Repsol Flexible Dividend” shareholders’ remuneration
program.
Holders of 72.14% of free-of-charge allocation rights (a total of 1,101,853,515 rights)
opted to receive new shares of Repsol. Therefore, the final number of shares of one (1)
euro par value issued in the capital increase is 31,481,529, where the nominal amount
of the increase is 31,481,529 euros, representing an increase of approximately 2.06% of
Repsol´s share capital before the capital increase.
JAN. 2019 On January 14, 2019, Repsol, S.A. launched the Share Acquisition Plan 2019 (the
Q4 & FY 2018 Results
20
“Plan”). The Plan applies to Repsol Group’s employees in Spain that meet the
requirements of its general conditions and who voluntary decide to opt for the same.
JAN. 2019 On January 21, 2019, Repsol published its “Trading Statement,” which is a document
that provides provisional information for the fourth quarter and full year results of 2018,
including data on the economic environment as well as company performance during
the period.
JAN. 2019 On January 28, 2019, Repsol informed that the delisting of Repsol shares in Argentina
became effective, pursuant to the Argentine National Securities Commission Resolution
of December 28, 2018.
Madrid, 28 February, 2019
A conference call has been scheduled for research analysts and institutional investors for today, February 28, 2019 at
12:30 (CET) to report on the Repsol Group’s fourth quarter and full year 2018 results. Shareholders and other interested
parties can follow the call live through Repsol’s corporate website (www.repsol.com). A full recording of the event will
also be available to shareholders and investors and any other interested party at www.repsol.com for a period of no less
than one month from the date of the live broadcast. Moreover Repsol will publish today both 2018 Consolidated
Financial Statements and Integrated Management Report that will be available on Repsol’s corporate website as well as
on the CNMV (Comisión Nacional del Mercado de Valores).
Q4 & FY 2018 Results
21
APPENDIX I – FINANCIAL METRICS AND OPERATING
INDICATORS BY SEGMENT
Q4 & FY 2018
Q4 & FY 2018 Results
22
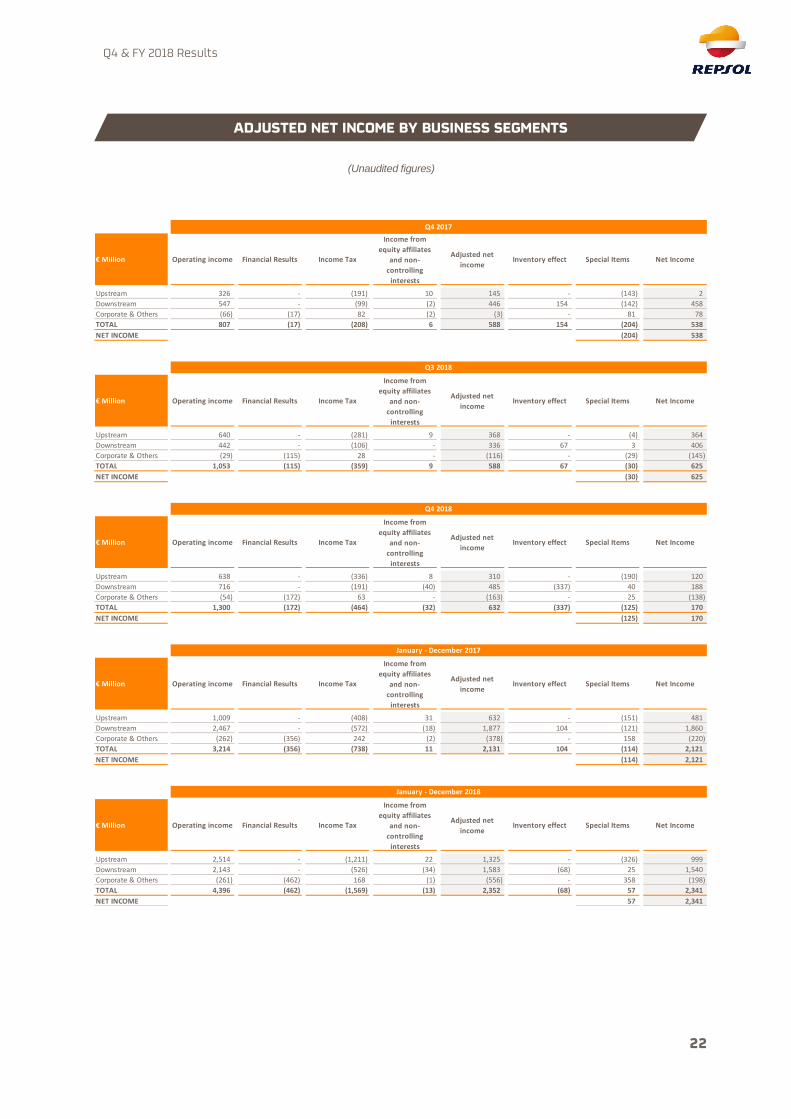
(Unaudited figures)
€ Million Operating income Financial Results Income Tax
Income from
equity affiliates
and non-
controlling
interests
Adjusted net
income Inventory effect Special Items Net Income
Upstream 326 - (191) 10 145 - (143) 2
Downstream 547 - (99) (2) 446 154 (142) 458
Corporate & Others (66) (17) 82 (2) (3) - 81 78
TOTAL 807 (17) (208) 6 588 154 (204) 538
NET INCOME (204) 538
€ Million Operating income Financial Results Income Tax
Income from
equity affiliates
and non-
controlling
interests
Adjusted net
incomeInventory effect Special Items Net Income
Upstream 640 - (281) 9 368 - (4) 364
Downstream 442 - (106) - 336 67 3 406
Corporate & Others (29) (115) 28 - (116) - (29) (145)
TOTAL 1,053 (115) (359) 9 588 67 (30) 625
NET INCOME (30) 625
€ Million Operating income Financial Results Income Tax
Income from
equity affiliates
and non-
controlling
interests
Adjusted net
incomeInventory effect Special Items Net Income
Upstream 638 - (336) 8 310 - (190) 120
Downstream 716 - (191) (40) 485 (337) 40 188
Corporate & Others (54) (172) 63 - (163) - 25 (138)
TOTAL 1,300 (172) (464) (32) 632 (337) (125) 170
NET INCOME (125) 170
€ Million Operating income Financial Results Income Tax
Income from
equity affiliates
and non-
controlling
interests
Adjusted net
incomeInventory effect Special Items Net Income
Upstream 1,009 - (408) 31 632 - (151) 481
Downstream 2,467 - (572) (18) 1,877 104 (121) 1,860
Corporate & Others (262) (356) 242 (2) (378) - 158 (220)
TOTAL 3,214 (356) (738) 11 2,131 104 (114) 2,121
NET INCOME (114) 2,121
€ Million Operating income Financial Results Income Tax
Income from
equity affiliates
and non-
controlling
interests
Adjusted net
incomeInventory effect Special Items Net Income
Upstream 2,514 - (1,211) 22 1,325 - (326) 999
Downstream 2,143 - (526) (34) 1,583 (68) 25 1,540
Corporate & Others (261) (462) 168 (1) (556) - 358 (198)
TOTAL 4,396 (462) (1,569) (13) 2,352 (68) 57 2,341
NET INCOME 57 2,341
Q4 2017
Q3 2018
Q4 2018
January - December 2017
January - December 2018
ADJUSTED NET INCOME BY BUSINESS SEGMENTS
Q4 & FY 2018 Results
23
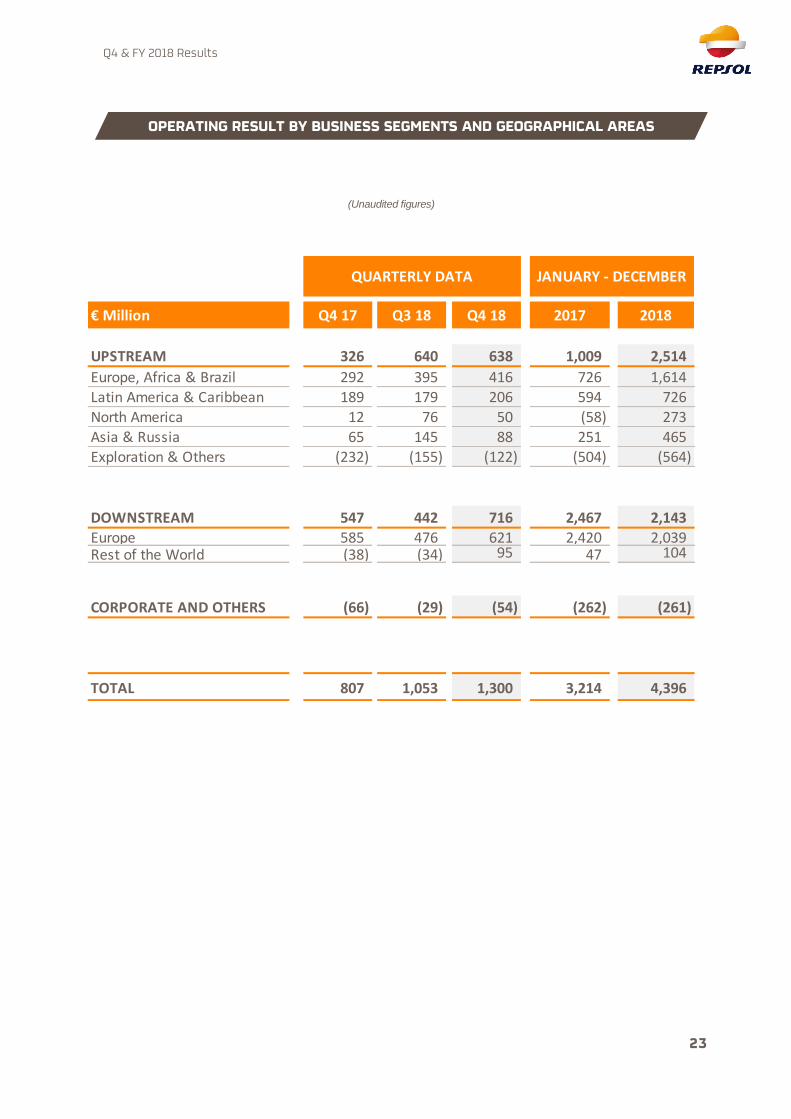
(Unaudited figures)
Q4 17 Q3 18 Q4 18 2017 2018
UPSTREAM 326 640 638 1,009 2,514
Europe, Africa & Brazil 292 395 416 726 1,614Latin America & Caribbean 189 179 206 594 726North America 12 76 50 (58) 273
Asia & Russia 65 145 88 251 465Exploration & Others (232) (155) (122) (504) (564)
DOWNSTREAM 547 442 716 2,467 2,143Europe 585 476 621 2,420 2,039Rest of the World (38) (34) 95 47 104
CORPORATE AND OTHERS (66) (29) (54) (262) (261)
TOTAL 807 1,053 1,300 3,214 4,396
€ Million
QUARTERLY DATA JANUARY - DECEMBER
OPERATING RESULT BY BUSINESS SEGMENTS AND GEOGRAPHICAL AREAS

Q4 & FY 2018 Results
24
(Unaudited figures)
Q4 17 Q3 18 Q4 18 2017 2018
UPSTREAM 145 368 310 632 1,325
Europe, Africa & Brazil 135 231 179 355 768
Latin America & Caribbean 120 113 128 386 501
North America 7 57 40 (43) 212
Asia & Russia 49 84 48 161 264
Exploration & Others (166) (117) (85) (227) (420)
DOWNSTREAM 446 336 485 1,877 1,583
Europe 471 359 418 1,852 1,500
Rest of the World (25) (23) 67 25 83
CORPORATE AND OTHERS (3) (116) (163) (378) (556)
TOTAL 588 588 632 2,131 2,352
€ Million
QUARTERLY DATA JANUARY - DECEMBER
ADJUSTED NET INCOME BY BUSINESS SEGMENTS AND GEOGRAPHICAL AREAS
Q4 & FY 2018 Results
25
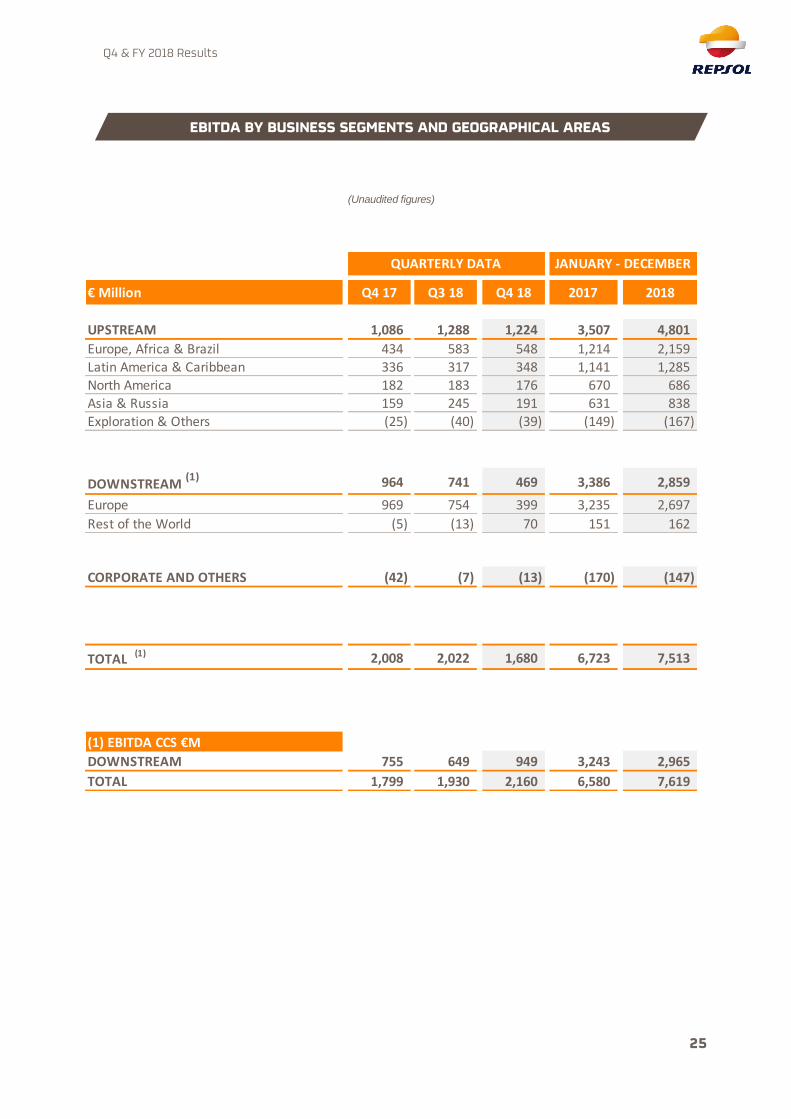
(Unaudited figures)
Q4 17 Q3 18 Q4 18 2017 2018
UPSTREAM 1,086 1,288 1,224 3,507 4,801
Europe, Africa & Brazil 434 583 548 1,214 2,159Latin America & Caribbean 336 317 348 1,141 1,285North America 182 183 176 670 686Asia & Russia 159 245 191 631 838Exploration & Others (25) (40) (39) (149) (167)
DOWNSTREAM (1) 964 741 469 3,386 2,859
Europe 969 754 399 3,235 2,697
Rest of the World (5) (13) 70 151 162
CORPORATE AND OTHERS (42) (7) (13) (170) (147)
TOTAL (1) 2,008 2,022 1,680 6,723 7,513
DOWNSTREAM 755 649 949 3,243 2,965
TOTAL 1,799 1,930 2,160 6,580 7,619
(1) EBITDA CCS €M
€ Million
QUARTERLY DATA JANUARY - DECEMBER
EBITDA BY BUSINESS SEGMENTS AND GEOGRAPHICAL AREAS
Q4 & FY 2018 Results
26
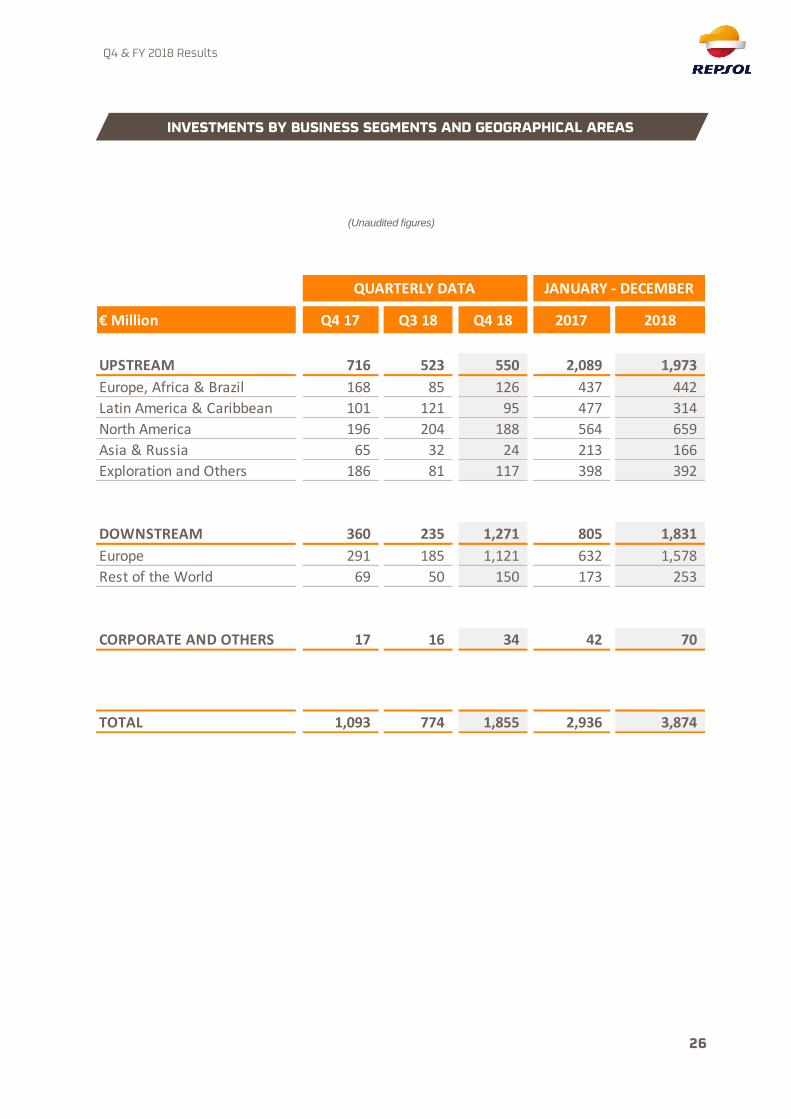
(Unaudited figures)
Q4 17 Q3 18 Q4 18 2017 2018
UPSTREAM 716 523 550 2,089 1,973
Europe, Africa & Brazil 168 85 126 437 442
Latin America & Caribbean 101 121 95 477 314
North America 196 204 188 564 659
Asia & Russia 65 32 24 213 166
Exploration and Others 186 81 117 398 392
DOWNSTREAM 360 235 1,271 805 1,831
Europe 291 185 1,121 632 1,578
Rest of the World 69 50 150 173 253
CORPORATE AND OTHERS 17 16 34 42 70
TOTAL 1,093 774 1,855 2,936 3,874
€ Million
QUARTERLY DATA JANUARY - DECEMBER
INVESTMENTS BY BUSINESS SEGMENTS AND GEOGRAPHICAL AREAS
Q4 & FY 2018 Results
27
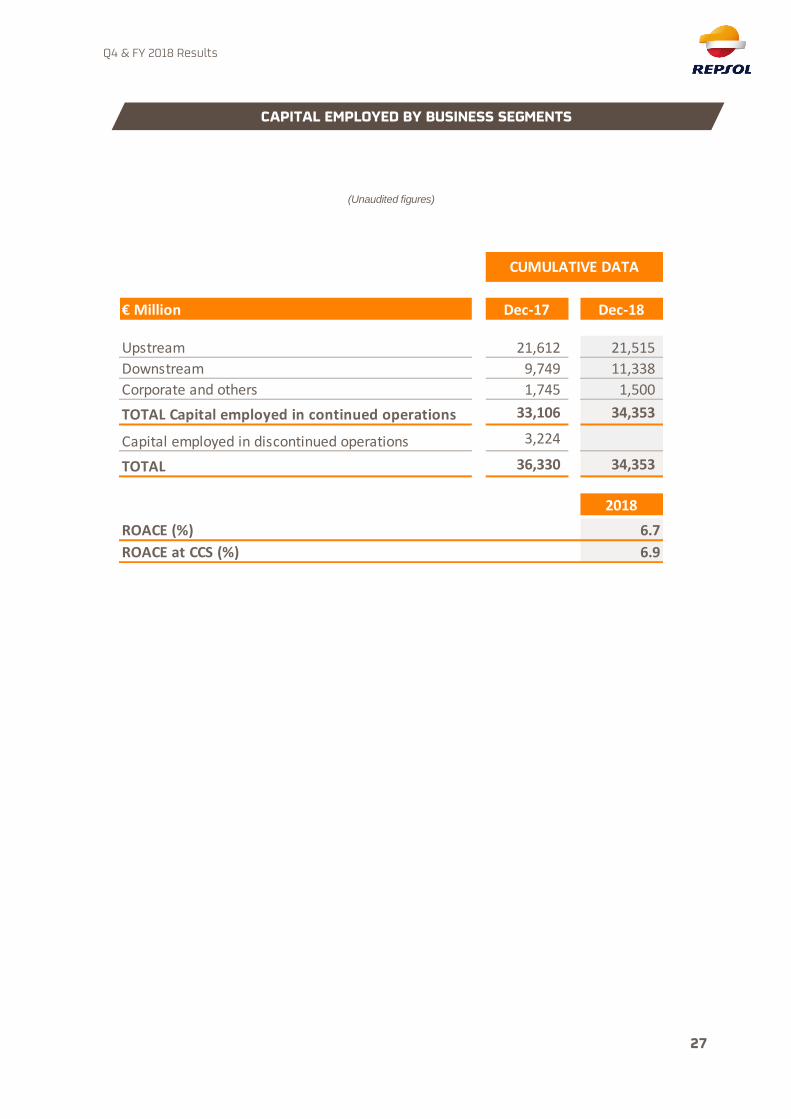
(Unaudited figures)
Dec-17 Dec-18
Upstream 21,612 21,515
Downstream 9,749 11,338
Corporate and others 1,745 1,500
TOTAL Capital employed in continued operations 33,106 34,353
Capital employed in discontinued operations 3,224
TOTAL 36,330 34,353
2018
ROACE (%) 6.7
ROACE at CCS (%) 6.9
CUMULATIVE DATA
€ Million
CAPITAL EMPLOYED BY BUSINESS SEGMENTS
Q4 & FY 2018 Results
28
OPERATING INDICATORS
Q4 & FY 2018
Q4 & FY 2018 Results
29
Unit Q1 2017 Q2 2017 Q3 2017 Q4 2017Jan - Dec
2017Q1 2018 Q2 2018 Q3 2018 Q4 2018
Jan - Dec
2018
% Variation
2018/2017
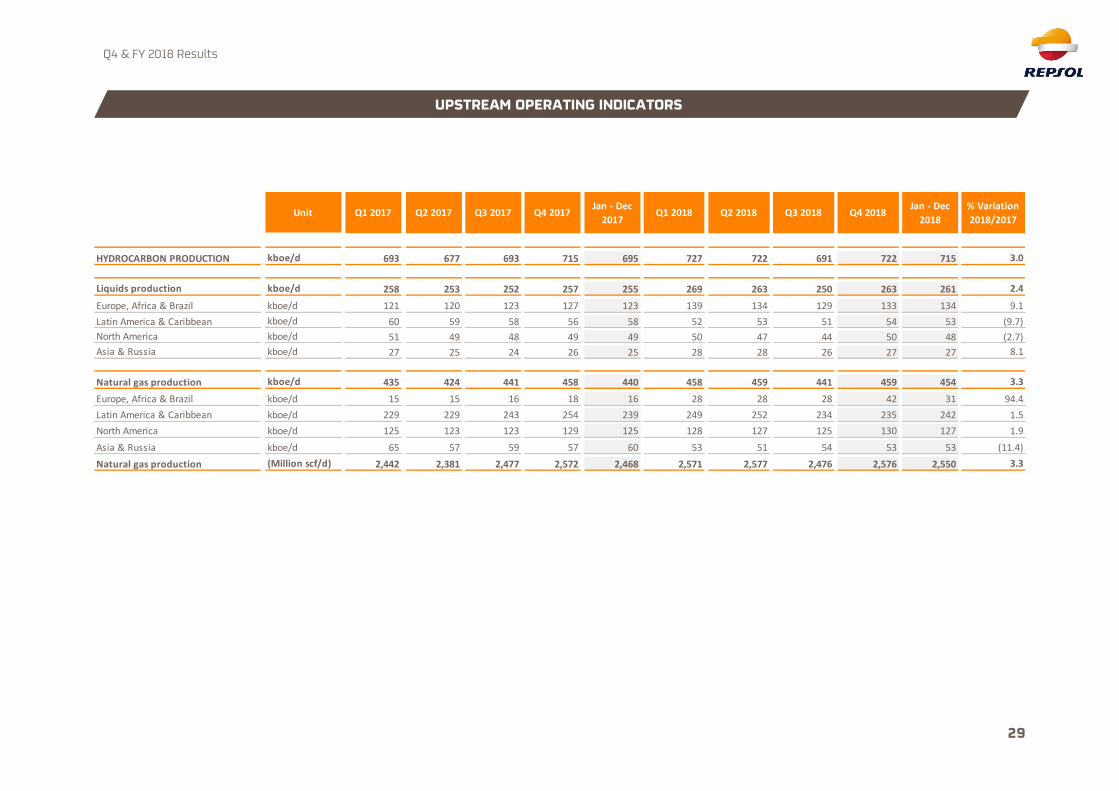
HYDROCARBON PRODUCTION kboe/d 693 677 693 715 695 727 722 691 722 715 3.0
Liquids production kboe/d 258 253 252 257 255 269 263 250 263 261 2.4
Europe, Africa & Brazil kboe/d 121 120 123 127 123 139 134 129 133 134 9.1
Latin America & Caribbean kboe/d 60 59 58 56 58 52 53 51 54 53 (9.7)
North America kboe/d 51 49 48 49 49 50 47 44 50 48 (2.7)
Asia & Russia kboe/d 27 25 24 26 25 28 28 26 27 27 8.1
Natural gas production kboe/d 435 424 441 458 440 458 459 441 459 454 3.3
Europe, Africa & Brazil kboe/d 15 15 16 18 16 28 28 28 42 31 94.4
Latin America & Caribbean kboe/d 229 229 243 254 239 249 252 234 235 242 1.5
North America kboe/d 125 123 123 129 125 128 127 125 130 127 1.9
Asia & Russia kboe/d 65 57 59 57 60 53 51 54 53 53 (11.4)
Natural gas production (Million scf/d) 2,442 2,381 2,477 2,572 2,468 2,571 2,577 2,476 2,576 2,550 3.3
UPSTREAM OPERATING INDICATORS
Q4 & FY 2018 Results
30
Unit Q1 2017 Q2 2017 Q3 2017 Q4 2017Jan - Dec
2017Q1 2018 Q2 2018 Q3 2018 Q4 2018
Jan - Dec
2018
%
Variation
2018/2017
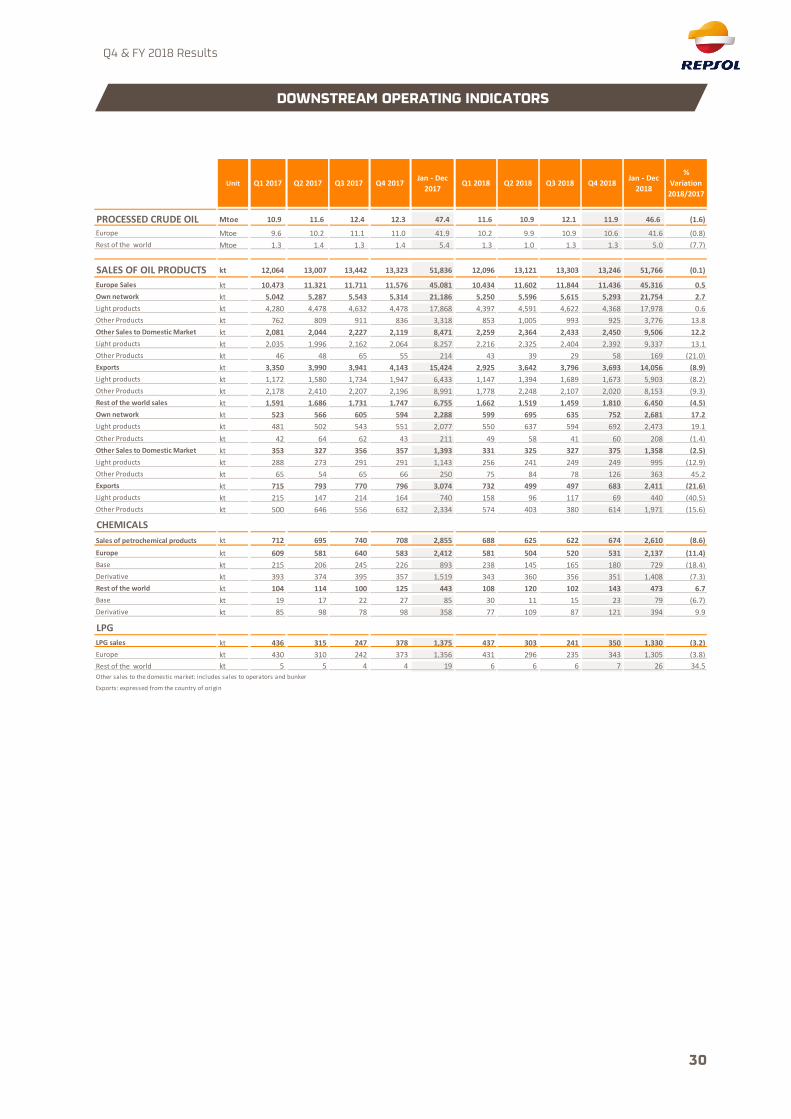
PROCESSED CRUDE OIL Mtoe 10.9 11.6 12.4 12.3 47.4 11.6 10.9 12.1 11.9 46.6 (1.6)
Europe Mtoe 9.6 10.2 11.1 11.0 41.9 10.2 9.9 10.9 10.6 41.6 (0.8)
Rest of the world Mtoe 1.3 1.4 1.3 1.4 5.4 1.3 1.0 1.3 1.3 5.0 (7.7)
SALES OF OIL PRODUCTS kt 12,064 13,007 13,442 13,323 51,836 12,096 13,121 13,303 13,246 51,766 (0.1)
Europe Sales kt 10,473 11,321 11,711 11,576 45,081 10,434 11,602 11,844 11,436 45,316 0.5
Own network kt 5,042 5,287 5,543 5,314 21,186 5,250 5,596 5,615 5,293 21,754 2.7
Light products kt 4,280 4,478 4,632 4,478 17,868 4,397 4,591 4,622 4,368 17,978 0.6
Other Products kt 762 809 911 836 3,318 853 1,005 993 925 3,776 13.8
Other Sales to Domestic Market kt 2,081 2,044 2,227 2,119 8,471 2,259 2,364 2,433 2,450 9,506 12.2
Light products kt 2,035 1,996 2,162 2,064 8,257 2,216 2,325 2,404 2,392 9,337 13.1
Other Products kt 46 48 65 55 214 43 39 29 58 169 (21.0)
Exports kt 3,350 3,990 3,941 4,143 15,424 2,925 3,642 3,796 3,693 14,056 (8.9)
Light products kt 1,172 1,580 1,734 1,947 6,433 1,147 1,394 1,689 1,673 5,903 (8.2)
Other Products kt 2,178 2,410 2,207 2,196 8,991 1,778 2,248 2,107 2,020 8,153 (9.3)
Rest of the world sales kt 1,591 1,686 1,731 1,747 6,755 1,662 1,519 1,459 1,810 6,450 (4.5)
Own network kt 523 566 605 594 2,288 599 695 635 752 2,681 17.2
Light products kt 481 502 543 551 2,077 550 637 594 692 2,473 19.1
Other Products kt 42 64 62 43 211 49 58 41 60 208 (1.4)
Other Sales to Domestic Market kt 353 327 356 357 1,393 331 325 327 375 1,358 (2.5)
Light products kt 288 273 291 291 1,143 256 241 249 249 995 (12.9)
Other Products kt 65 54 65 66 250 75 84 78 126 363 45.2
Exports kt 715 793 770 796 3,074 732 499 497 683 2,411 (21.6)
Light products kt 215 147 214 164 740 158 96 117 69 440 (40.5)
Other Products kt 500 646 556 632 2,334 574 403 380 614 1,971 (15.6)
CHEMICALS
Sales of petrochemical products kt 712 695 740 708 2,855 688 625 622 674 2,610 (8.6)
Europe kt 609 581 640 583 2,412 581 504 520 531 2,137 (11.4)
Base kt 215 206 245 226 893 238 145 165 180 729 (18.4)
Derivative kt 393 374 395 357 1,519 343 360 356 351 1,408 (7.3)
Rest of the world kt 104 114 100 125 443 108 120 102 143 473 6.7
Base kt 19 17 22 27 85 30 11 15 23 79 (6.7)
Derivative kt 85 98 78 98 358 77 109 87 121 394 9.9
LPG
LPG sales kt 436 315 247 378 1,375 437 303 241 350 1,330 (3.2)
Europe kt 430 310 242 373 1,356 431 296 235 343 1,305 (3.8)
Rest of the world kt 5 5 4 4 19 6 6 6 7 26 34.5
Other sales to the domestic market: includes sales to operators and bunker
Exports: expressed from the country of origin
DOWNSTREAM OPERATING INDICATORS

Q4 & FY 2018 Results
31
APPENDIX II – CONSOLIDATED FINANCIAL STATEMENTS
Q4 & FY 2018
Q4 & FY 2018 Results
32
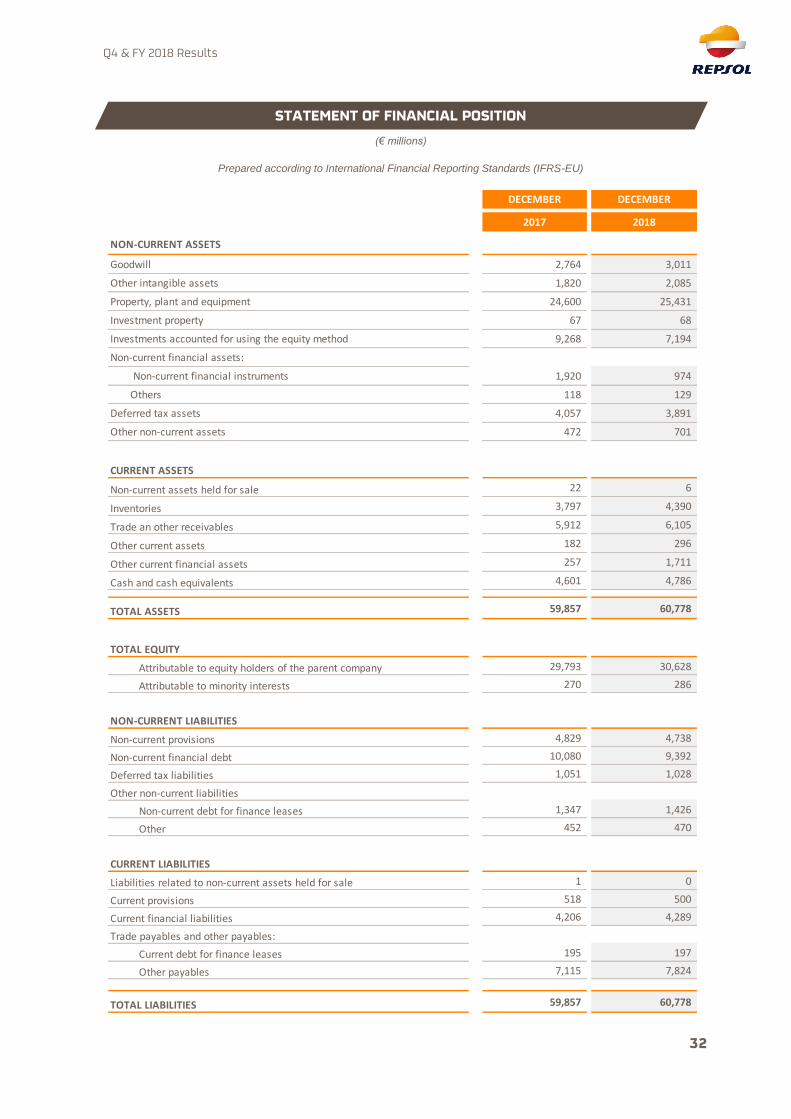
(€ millions)
Prepared according to International Financial Reporting Standards (IFRS-EU)
DECEMBER DECEMBER
2017 2018
NON-CURRENT ASSETS
Goodwill 2,764 3,011
Other intangible assets 1,820 2,085
Property, plant and equipment 24,600 25,431
Investment property 67 68
Investments accounted for using the equity method 9,268 7,194
Non-current financial assets:
Non-current financial instruments 1,920 974
Others 118 129
Deferred tax assets 4,057 3,891
Other non-current assets 472 701
CURRENT ASSETS
Non-current assets held for sale 22 6
Inventories 3,797 4,390
Trade an other receivables 5,912 6,105
Other current assets 182 296
Other current financial assets 257 1,711
Cash and cash equivalents 4,601 4,786
TOTAL ASSETS 59,857 60,778
TOTAL EQUITY
Attributable to equity holders of the parent company 29,793 30,628
Attributable to minority interests 270 286
NON-CURRENT LIABILITIES
Non-current provisions 4,829 4,738
Non-current financial debt 10,080 9,392
Deferred tax liabilities 1,051 1,028
Other non-current liabilities
Non-current debt for finance leases 1,347 1,426
Other 452 470
CURRENT LIABILITIES
Liabilities related to non-current assets held for sale 1 0
Current provisions 518 500
Current financial liabilities 4,206 4,289
Trade payables and other payables:
Current debt for finance leases 195 197
Other payables 7,115 7,824
TOTAL LIABILITIES 59,857 60,778
STATEMENT OF FINANCIAL POSITION
Q4 & FY 2018 Results
33
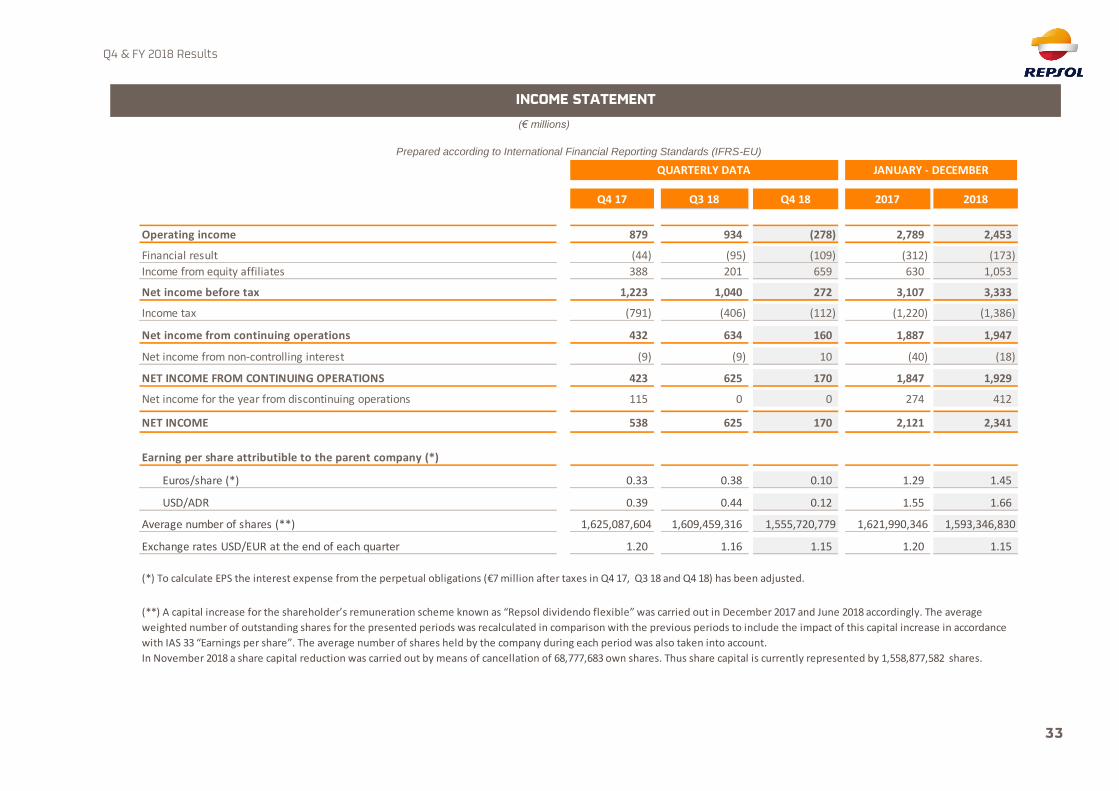
(€ millions)
Prepared according to International Financial Reporting Standards (IFRS-EU)
Q4 17 Q3 18 Q4 18 2017 2018
Operating income 879 934 (278) 2,789 2,453
Financial result (44) (95) (109) (312) (173)
Income from equity affiliates 388 201 659 630 1,053
Net income before tax 1,223 1,040 272 3,107 3,333
Income tax (791) (406) (112) (1,220) (1,386)
Net income from continuing operations 432 634 160 1,887 1,947
Net income from non-controlling interest (9) (9) 10 (40) (18)
NET INCOME FROM CONTINUING OPERATIONS 423 625 170 1,847 1,929
Net income for the year from discontinuing operations 115 0 0 274 412
NET INCOME 538 625 170 2,121 2,341
Earning per share attributible to the parent company (*)
Euros/share (*) 0.33 0.38 0.10 1.29 1.45
USD/ADR 0.39 0.44 0.12 1.55 1.66
Average number of shares (**) 1,625,087,604 1,609,459,316 1,555,720,779 1,621,990,346 1,593,346,830
Exchange rates USD/EUR at the end of each quarter 1.20 1.16 1.15 1.20 1.15
(**) A capital increase for the shareholder’s remuneration scheme known as “Repsol dividendo flexible” was carried out in December 2017 and June 2018 accordingly. The average
weighted number of outstanding shares for the presented periods was recalculated in comparison with the previous periods to include the impact of this capital increase in accordance
with IAS 33 “Earnings per share”. The average number of shares held by the company during each period was also taken into account.
In November 2018 a share capital reduction was carried out by means of cancellation of 68,777,683 own shares. Thus share capital is currently represented by 1,558,877,582 shares.
(*) To calculate EPS the interest expense from the perpetual obligations (€7 million after taxes in Q4 17, Q3 18 and Q4 18) has been adjusted.
QUARTERLY DATA JANUARY - DECEMBER
INCOME STATEMENT

Q4 & FY 2018 Results
34
(€ millions)
Prepared according to International Financial Reporting Standards (IFRS-EU)
2017 2018
I. CASH FLOWS FROM OPERATING ACTIVITIES
Net income before taxes 3,107 3,333
Adjustments to net income
Depreciation and amortisation of non current assets 2,399 2,140
Other adjustments to results (net) (253) 220
EBITDA 5,253 5,693
Changes in working capital (110) (389)
Dividends received 1 511 472
Income taxes received/ (paid) (320) (762)
Other proceeds from/ ( payments for) operating activities (221) (435)
OTHER CASH FLOWS FROM/ (USED IN) OPERATING ACTIVITIES (30) (725)
5,113 4,579
II. CASH FLOWS USED IN INVESTMENT ACTIVITIES
Payments for investment activities
Companies of the Group, equity affiliates and business units (327) (807)
Fixed assets, intangible assets and real estate investments (2,300) (2,661)
Other financial assets (467) (2,033)
Payments for investment activities (3,094) (5,501)
Proceeds from divestments 2 254 4,074
Other cashflow 51 68
(2,789) (1,359)
III. CASH FLOWS FROM/ (USED IN) FINANCING ACTIVITIES
Issuance of own capital instruments 0 0
Proceeds from/(payments for) equity instruments (293) (1,595)
Proceeds from issue of financial liabilities 10,285 18,127
Payments for financial liabilities (11,448) (18,923)
Payments for dividends and payments on other equity instruments (332) (297)
Interest payments (537) (454)
Other proceeds from/(payments for) financing activities (36) 110
(2,361) (3,032)
Effect of changes in exchange rates from continued operations (49) (3)
NET INCREASE/(DECREASE) IN CASH AND CASH EQUIVALENTS FROM CONTINUED OPERATIONS (86) 185
CASH AND CASH EQUIVALENTS AT THE BEGINNING OF THE PERIOD 4,687 4,601
CASH AND CASH EQUIVALENTS AT THE END OF THE PERIOD 4,601 4,786
JANUARY - DECEMBER
(2) Includes in 2018 cash flow from discontinued operations due to the divestment of the interest held in Naturgy (€3,816 million).
(1) Includes in 2017 cash flow from discontinued operations from the dividends obtained due to the interest held in Naturgy (€201 million).
CASH FLOW STATEMENT
Q4 & FY 2018 Results
35
APPENDIX III – RECONCILIATION OF
NON-IFRS METRICS TO IFRS DISCLOSURES
Q4 & FY 2018
Q4 & FY 2018 Results
36
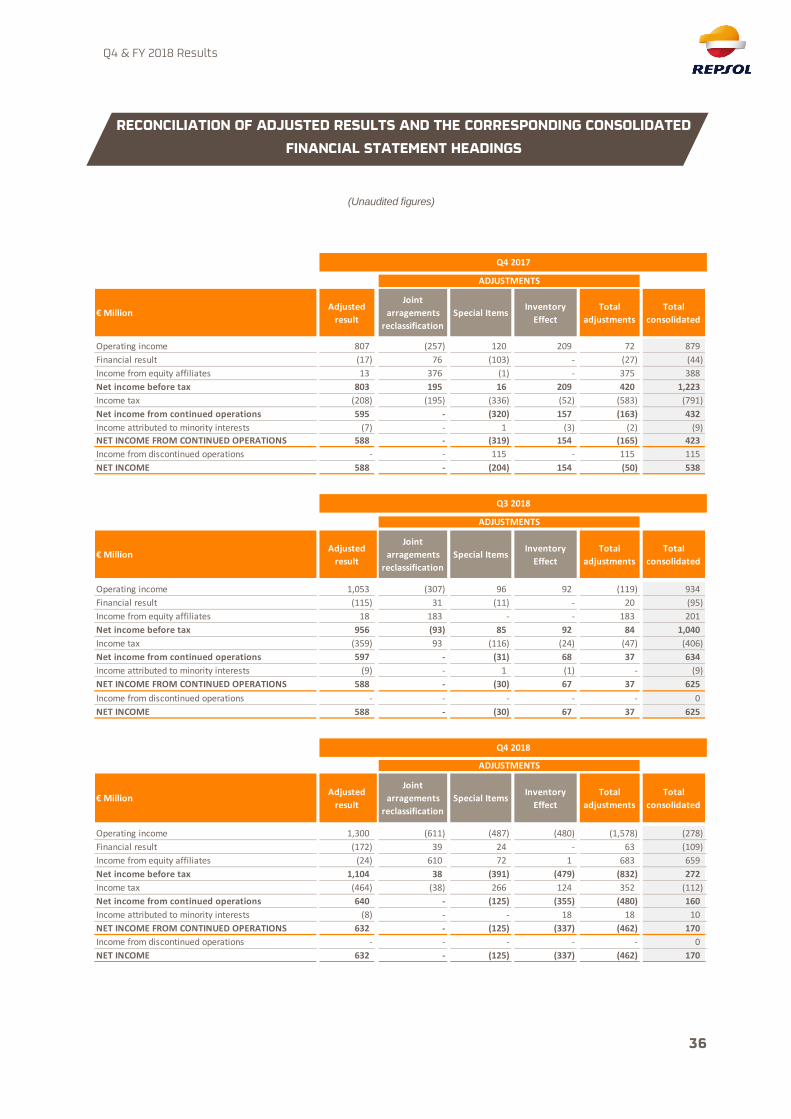
(Unaudited figures)
Adjusted
result
Joint
arragements
reclassification
Special ItemsInventory
Effect
Total
adjustments
Total
consolidated
Operating income 807 (257) 120 209 72 879
Financial result (17) 76 (103) - (27) (44)
Income from equity affiliates 13 376 (1) - 375 388
Net income before tax 803 195 16 209 420 1,223
Income tax (208) (195) (336) (52) (583) (791)
Net income from continued operations 595 - (320) 157 (163) 432
Income attributed to minority interests (7) - 1 (3) (2) (9)
NET INCOME FROM CONTINUED OPERATIONS 588 - (319) 154 (165) 423
Income from discontinued operations - - 115 - 115 115
NET INCOME 588 - (204) 154 (50) 538
Adjusted
result
Joint
arragements
reclassification
Special ItemsInventory
Effect
Total
adjustments
Total
consolidated
Operating income 1,053 (307) 96 92 (119) 934
Financial result (115) 31 (11) - 20 (95)
Income from equity affiliates 18 183 - - 183 201
Net income before tax 956 (93) 85 92 84 1,040
Income tax (359) 93 (116) (24) (47) (406)
Net income from continued operations 597 - (31) 68 37 634
Income attributed to minority interests (9) - 1 (1) - (9)
NET INCOME FROM CONTINUED OPERATIONS 588 - (30) 67 37 625
Income from discontinued operations - - - - - 0
NET INCOME 588 - (30) 67 37 625
Adjusted
result
Joint
arragements
reclassification
Special ItemsInventory
Effect
Total
adjustments
Total
consolidated
Operating income 1,300 (611) (487) (480) (1,578) (278)
Financial result (172) 39 24 - 63 (109)
Income from equity affiliates (24) 610 72 1 683 659
Net income before tax 1,104 38 (391) (479) (832) 272
Income tax (464) (38) 266 124 352 (112)
Net income from continued operations 640 - (125) (355) (480) 160
Income attributed to minority interests (8) - - 18 18 10
NET INCOME FROM CONTINUED OPERATIONS 632 - (125) (337) (462) 170
Income from discontinued operations - - - - - 0
NET INCOME 632 - (125) (337) (462) 170
ADJUSTMENTS
€ Million
ADJUSTMENTS
€ Million
ADJUSTMENTS
€ Million
Q3 2018
Q4 2018
Q4 2017
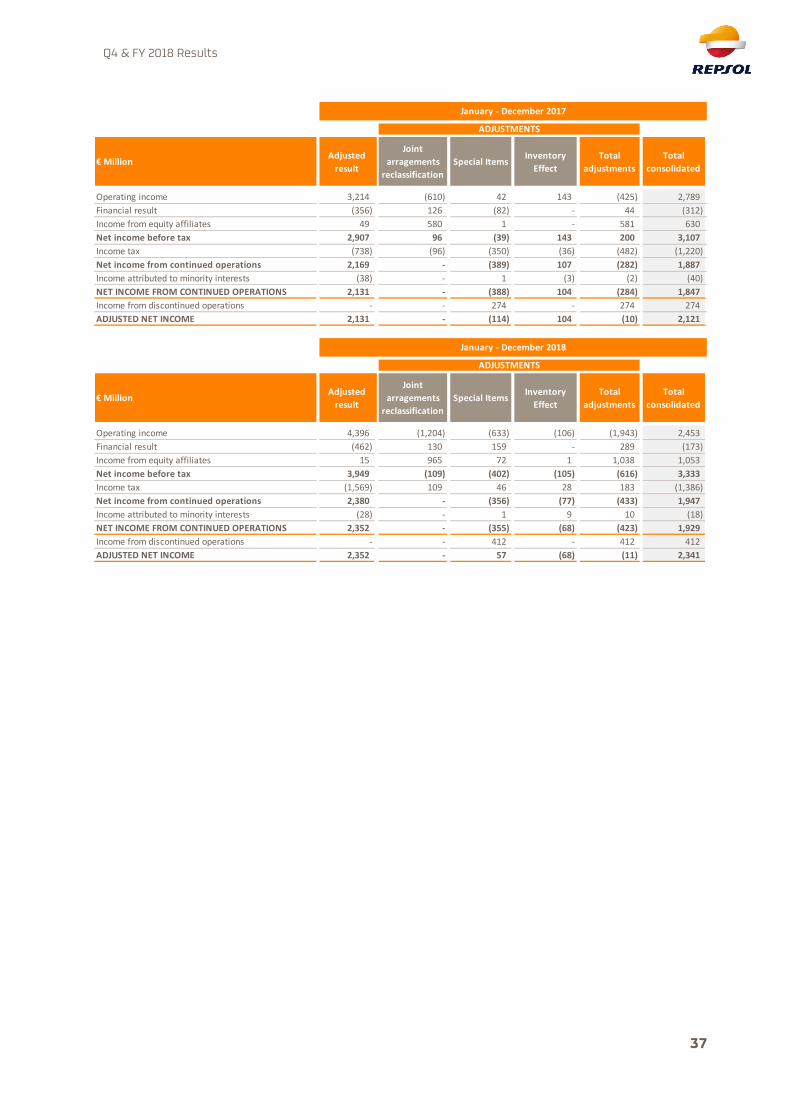
RECONCILIATION OF ADJUSTED RESULTS AND THE CORRESPONDING CONSOLIDATED
FINANCIAL STATEMENT HEADINGS
Q4 & FY 2018 Results
37
Adjusted
result
Joint
arragements
reclassification
Special ItemsInventory
Effect
Total
adjustments
Total
consolidated
Operating income 3,214 (610) 42 143 (425) 2,789
Financial result (356) 126 (82) - 44 (312)
Income from equity affiliates 49 580 1 - 581 630
Net income before tax 2,907 96 (39) 143 200 3,107
Income tax (738) (96) (350) (36) (482) (1,220)
Net income from continued operations 2,169 - (389) 107 (282) 1,887
Income attributed to minority interests (38) - 1 (3) (2) (40)
NET INCOME FROM CONTINUED OPERATIONS 2,131 - (388) 104 (284) 1,847
Income from discontinued operations - - 274 - 274 274
ADJUSTED NET INCOME 2,131 - (114) 104 (10) 2,121
Adjusted
result
Joint
arragements
reclassification
Special ItemsInventory
Effect
Total
adjustments
Total
consolidated
Operating income 4,396 (1,204) (633) (106) (1,943) 2,453
Financial result (462) 130 159 - 289 (173)
Income from equity affiliates 15 965 72 1 1,038 1,053
Net income before tax 3,949 (109) (402) (105) (616) 3,333
Income tax (1,569) 109 46 28 183 (1,386)
Net income from continued operations 2,380 - (356) (77) (433) 1,947
Income attributed to minority interests (28) - 1 9 10 (18)
NET INCOME FROM CONTINUED OPERATIONS 2,352 - (355) (68) (423) 1,929
Income from discontinued operations - - 412 - 412 412
ADJUSTED NET INCOME 2,352 - 57 (68) (11) 2,341
€ Million
January - December 2017
ADJUSTMENTS
€ Million
January - December 2018
ADJUSTMENTS
Q4 & FY 2018 Results
38
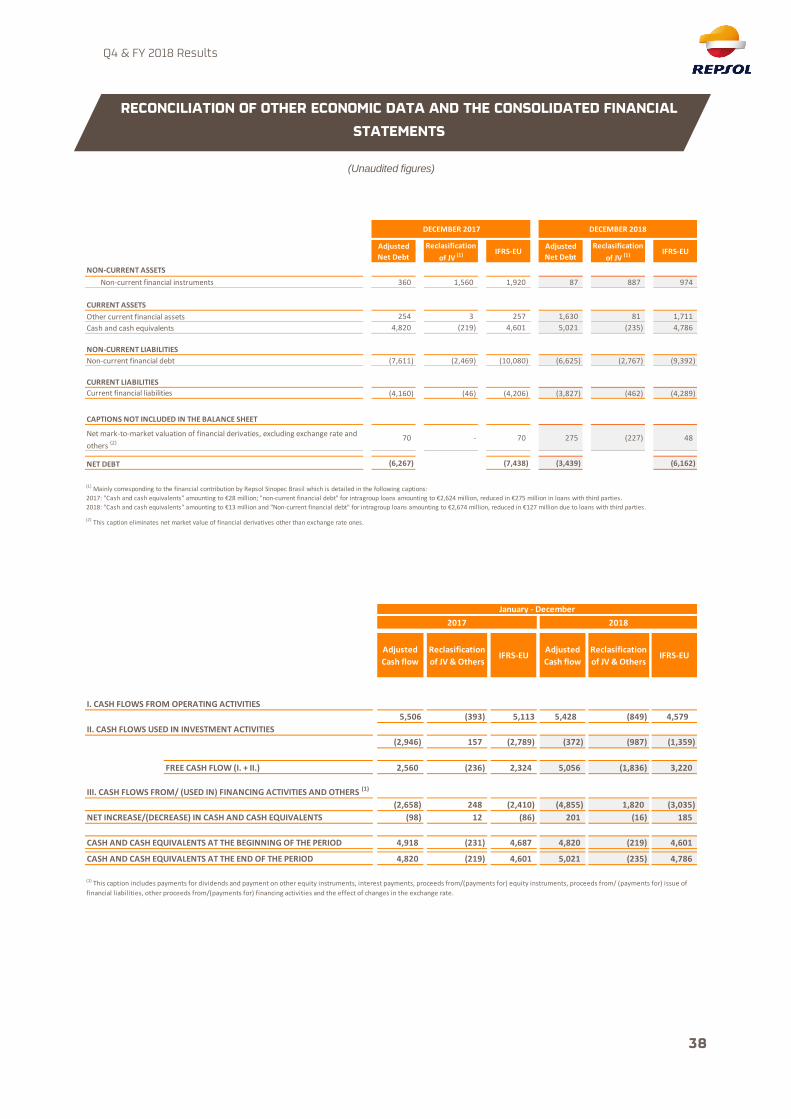
(Unaudited figures)
Adjusted
Net Debt
Reclasification
of JV (1) IFRS-EUAdjusted
Net Debt
Reclasification
of JV (1) IFRS-EU
NON-CURRENT ASSETS
Non-current financial instruments 360 1,560 1,920 87 887 974
CURRENT ASSETS
Other current financial assets 254 3 257 1,630 81 1,711
Cash and cash equivalents 4,820 (219) 4,601 5,021 (235) 4,786
NON-CURRENT LIABILITIES
Non-current financial debt (7,611) (2,469) (10,080) (6,625) (2,767) (9,392)
CURRENT LIABILITIES
Current financial liabilities (4,160) (46) (4,206) (3,827) (462) (4,289)
CAPTIONS NOT INCLUDED IN THE BALANCE SHEET
Net mark-to-market valuation of financial derivaties, excluding exchange rate and
others (2) 70 - 70 275 (227) 48
NET DEBT (6,267) (7,438) (3,439) (6,162)
(2) This caption eliminates net market value of financial derivatives other than exchange rate ones.
(1) Mainly corresponding to the financial contribution by Repsol Sinopec Brasil which is detailed in the following captions:
2017: "Cash and cash equivalents" amounting to €28 million; "non-current financial debt" for intragroup loans amounting to €2,624 million, reduced in €275 million in loans with third parties.
2018: "Cash and cash equivalents" amounting to €13 million and "Non-current financial debt" for intragroup loans amounting to €2,674 million, reduced in €127 million due to loans with third parties.
DECEMBER 2017 DECEMBER 2018
Adjusted
Cash flow
Reclasification
of JV & OthersIFRS-EU
Adjusted
Cash flow
Reclasification
of JV & OthersIFRS-EU
I. CASH FLOWS FROM OPERATING ACTIVITIES
5,506 (393) 5,113 5,428 (849) 4,579
II. CASH FLOWS USED IN INVESTMENT ACTIVITIES
(2,946) 157 (2,789) (372) (987) (1,359)
FREE CASH FLOW (I. + II.) 2,560 (236) 2,324 5,056 (1,836) 3,220
III. CASH FLOWS FROM/ (USED IN) FINANCING ACTIVITIES AND OTHERS (1)
(2,658) 248 (2,410) (4,855) 1,820 (3,035)
NET INCREASE/(DECREASE) IN CASH AND CASH EQUIVALENTS (98) 12 (86) 201 (16) 185
CASH AND CASH EQUIVALENTS AT THE BEGINNING OF THE PERIOD 4,918 (231) 4,687 4,820 (219) 4,601
CASH AND CASH EQUIVALENTS AT THE END OF THE PERIOD 4,820 (219) 4,601 5,021 (235) 4,786
(1) This caption includes payments for dividends and payment on other equity instruments, interest payments, proceeds from/(payments for) equity instruments, proceeds from/ (payments for) issue of
financial liabilities, other proceeds from/(payments for) financing activities and the effect of changes in the exchange rate.
2017 2018
January - December
RECONCILIATION OF OTHER ECONOMIC DATA AND THE CONSOLIDATED FINANCIAL
STATEMENTS
Q4 & FY 2018 Results
39
APPENDIX IV – BASIS
OF PRESENTATION
Q4 & FY 2018

Q4 & FY 2018 Results
40
BASES DE PRESENTACIÓN DE LA INFORMACIÓN
The definition of the Repsol Group´s operating segments is based on the different activities performed and
from where the Group earns revenue or incurs expenses, as well as on the organizational structure
approved by the Board of Directors for business management purposes. Using these segments as a
reference point, Repsol’s management team (the Corporate Executive) analyzes the main operating and
financial indicators in order to make decisions about segment resource allocation and to assess how
Repsol (“the Company”) is performing.
The Group's operating segments are:
Upstream, corresponding to exploration and production of crude oil and natural gas reserves and;
Downstream, corresponding, mainly, to the following activities: (i) refining and petrochemistry, (ii)
trading and transportation of crude oil and oil products, (iii) commercialization of oil products,
petrochemical and LPG, (iv) commercialization, transportation and regasification of natural gas and
liquefied natural gas (LNG) and (v) generation of electricity and commercialization of energy and
gas in Spain.
Finally, Corporate and others includes activities not attributable to the aforementioned businesses, and
specifically, corporate expenses, net finance costs and inter-segment consolidation adjustments.
The Group did not aggregate any operating segments for presentation purposes.
Repsol presents its operating segments’ results by including the ones corresponding to its joint ventures2
and other managed companies operated as such3, in accordance with the percentage interest held by the
Group, considering their business and financial metrics in the same manner and with the same level of
detail as for fully-consolidated companies. The Group considers that so doing adequately reflects the nature
of its businesses and the way in which their performance is analyzed for decision-making purposes.
In addition, the Group, considering its business reality and in order to make its disclosures more
comparable with those in the sector, utilizes as a measure of segment profit the so-called Adjusted Net
Income, which corresponds to net income from continuing operations at current cost of supply or CCS after
taxes and minority interests and not including certain items of income and expense (Special Items). Net
finance cost is allocated to the Corporate and others segment's Adjusted Net Income/Loss.
Although this measure of profit (CCS), widely used in the industry to report the earnings generated in
Downstream businesses which necessarily work with significant volumes of inventories that are subject to
constant price fluctuations, is not accepted in European accounting standards it does facilitate comparison
with the earnings of sector peers and enables analysis of the underlying business performance by stripping
out the impact of price fluctuations on reported inventory levels. Using the CCS method, the cost of
volumes sold during the reporting period is calculated using the costs of procurement and production
incurred during that same period. As a result, Adjusted Net Income does not include the so-called Inventory
Effect. This Inventory Effect is presented separately, net of tax and minority interests, and corresponds to
the difference between income at CCS and that arrived at using the Average Weighted Cost accounting
method (AWC, which is an inventory valuation method used by the Company to determine its results in
accordance with European accounting regulations).
2 In Repsol Group´s operating segments model, joint ventures are consolidated proportionally in accordance with the Group's percent holding. See Note 13
of the consolidated financial statements for 2018, where the Group’s main joint ventures are identified. 3 It corresponds to Petrocarabobo, S.A., an associated entity of the Group (Venezuela).
BASIS OF PREPARATION OF THE FINANCIAL
INFORMATION
Q4 & FY 2018 Results
41
Likewise, Adjusted Net Income does not include Special Items, i.e., certain significant items whose
separate presentation is considered convenient to facilitate the monitoring of the ordinary business
performance. It includes gains/losses on disposals, personnel restructuring costs, impairments and relevant
provisions for risks and other relevant income or expenses. These results are presented separately, net of
the tax effect and minority interests.
Following the agreement reached on February 22, 2018 for the sale of the 20.072% stake in Naturgy
Energy Group, S.A. —Naturgy— (formerly known as Gas Natural SDG, S.A.), its income prior to this date
has been recognized as discontinued operations under "Special items", previously recognized under
Corporate and others, restating the comparative figures in terms of those published in the Q4 2017 Results
Earnings Release.
The way in which the results of exchange rate fluctuations on tax positions in currencies other than the
functional currency are presented has changed during 2018, and these changes are reflected in the Special
items to facilitate the monitoring of business results and align us with best practices in the industry. The
comparative figures for the interim periods of 2017 have not been restated, given their immateriality (see
Appendix I “Alternative Performance Measures” of the Management Report 2018).
All of the information presented in this Q4 & FY 2018 Results Earnings Release has been prepared in
accordance with the abovementioned criteria, with the exception of the information provided in Appendix II
“Consolidated Financial Statements” which has been prepared according to the International Financial
Reporting Standards adopted by the European Union (IFRS-EU).
Appendix III provides a reconciliation of the segment reported metrics and those presented in the
Consolidated Financial Statements (IFRS-EU).
Information and disclosures related to APM4 used on the present Q4 & FY 2018 Results Earnings Release
are included in Appendix I “Alternative Performance Measures” of the Management Report 2018 and
Repsol’s website.
4 In October 2015, the European Securities Markets Authority (ESMA) published the Guidelines on Alternative Performance Measures (APM), of mandatory
application for the regulated information to be published from 3 July 2016.
Q4 & FY 2018 Results
42
DISCLAIMER
The information included in this document is published pursuant to the provision of article 226 of the
Spanish Securities Market Law.
This document contains statements that Repsol believes constitute forward-looking statements which
may include statements regarding the intent, belief, or current expectations of Repsol and its
management, including statements with respect to trends affecting Repsol’s financial condition,
financial ratios, results of operations, business, strategy, geographic concentration, production volume
and reserves, capital expenditures, costs savings, investments and dividend payout policies. These
forward-looking statements may also include assumptions regarding future economic and other
conditions, such as future crude oil and other prices, refining and marketing margins and exchange
rates and are generally identified by the words “expects”, “anticipates”, “forecasts”, “believes”,
estimates”, “notices” and similar expressions. These statements are not guarantees of future
performance, prices, margins, exchange rates or other events and are subject to material risks,
uncertainties, changes and other factors which may be beyond Repsol’s control or may be difficult to
predict. Within those risks are those factors described in the filings made by Repsol and its affiliates
with the “Comisión Nacional del Mercado de Valores” in Spain and with any other supervisory authority
of those markets where the securities issued by Repsol and/or its affiliates are listed.
Repsol does not undertake to publicly update or revise these forward-looking statements even if
experience or future changes make it clear that the projected performance, conditions or events
expressed or implied therein will not be realized.
This document mentions resources which do not constitute proved reserves and will be recognized as
such when they comply with the formal conditions required by the system
“SPE/WPC/AAPG/SPEE/SEG/SPWLA/EAGE Petroleum Resources Management System” (SPE-PRMS)
(SPE – Society of Petroleum Engineers).
This document does not constitute an offer or invitation to purchase or subscribe shares, pursuant to
the provisions of the Royal Legislative Decree 4/2015 of the 23rd of October approving the recast text
of the Spanish Securities Market Law and its implementing regulations. In addition, this document does
not constitute an offer to purchase, sell, or exchange, neither a request for an offer of purchase, sale or
exchange of securities in any other jurisdiction.
The information contained in the document has not been verified or revised by the External Auditors of
Repsol.
Contact details
Investor Relations
Tel: +34 917 53 62 52
Fax: +34 913 48 87 77
Contacto
REPSOL S.A.
C/ Méndez Álvaro, 44
28045 Madrid (España)
www.repsol.com
REPSOL S.A.
C/ Méndez Álvaro, 44