Embed Size (px)
Citation preview
1
Qantas Airways Limited1H13 Results
21 February 2013
2
Overview
• 1H13 result in line with guidance
• Delivering on strategic priorities
– Qantas‐Emirates partnership commencing from 31 March 20131
– Qantas transformation benefits $172m
– B787 fleet restructure
– Sale of non‐core asset StarTrack
• Reduced planned net capital expenditure; continued product investment
• Strengthening financial position – positive net free cash flow and debt reduction
POSITIONING THE GROUP FOR A STRONG, SUSTAINABLE FUTURE
1. Subject to regulatory approval.
3
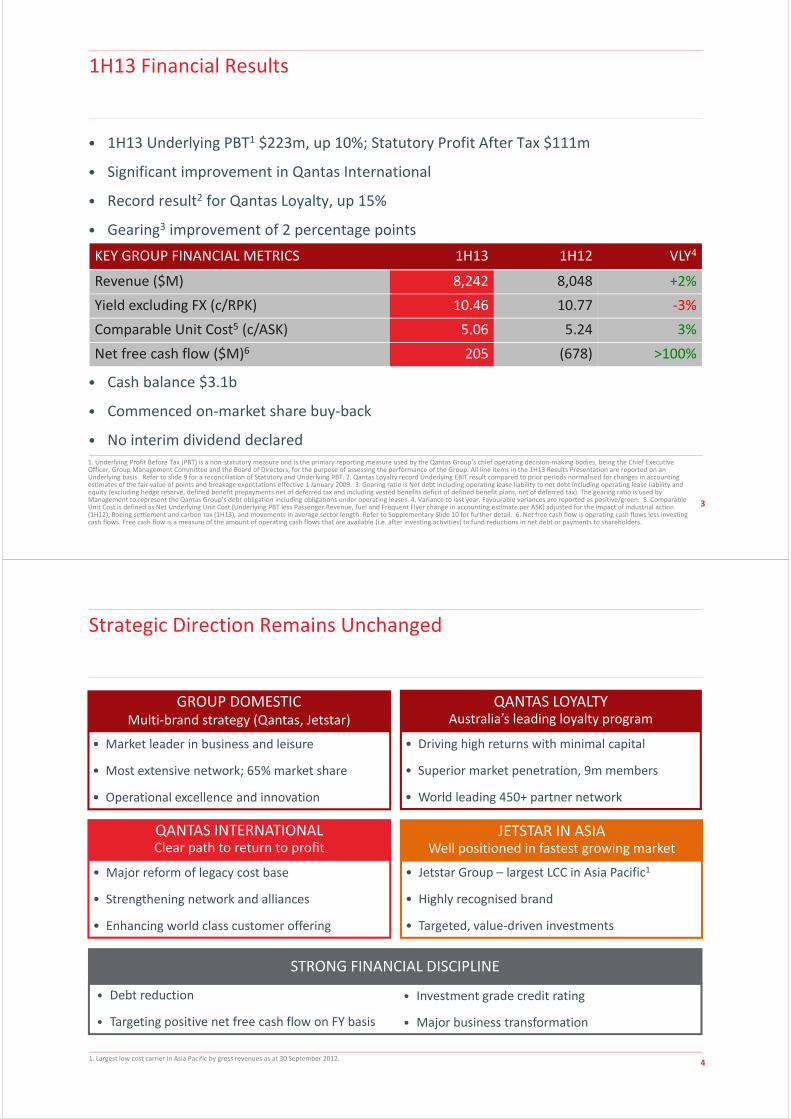
1H13 Financial Results
• 1H13 Underlying PBT1 $223m, up 10%; Statutory Profit After Tax $111m
• Significant improvement in Qantas International
• Record result2 for Qantas Loyalty, up 15%
• Gearing3 improvement of 2 percentage points
KEY GROUP FINANCIAL METRICS 1H13 1H12 VLY4
Revenue ($M) 8,242 8,048 +2%
Yield excluding FX (c/RPK) 10.46 10.77 ‐3%
Comparable Unit Cost5 (c/ASK) 5.06 5.24 3%
Net free cash flow ($M)6 205 (678) >100%
• Cash balance $3.1b
• Commenced on‐market share buy‐back
• No interim dividend declared1. Underlying Profit Before Tax (PBT) is a non‐statutory measure and is the primary reporting measure used by the Qantas Group’s chief operating decision‐making bodies, being the Chief Executive Officer, Group Management Committee and the Board of Directors, for the purpose of assessing the performance of the Group. All line items in the 1H13 Results Presentation are reported on an Underlying basis . Refer to slide 9 for a reconciliation of Statutory and Underlying PBT. 2. Qantas Loyalty record Underlying EBIT result compared to prior periods normalised for changes in accounting estimates of the fair value of points and breakage expectations effective 1 January 2009. 3. Gearing ratio is Net debt including operating lease liability to net debt including operating lease liability and equity (excluding hedge reserve, defined benefit prepayments net of deferred tax and including vested benefits deficit of defined benefit plans, net of deferred tax). The gearing ratio is used by Management to represent the Qantas Group’s debt obligation including obligations under operating leases. 4. Variance to last year. Favourable variances are reported as positive/green. 5. Comparable Unit Cost is defined as Net Underlying Unit Cost (Underlying PBT less Passenger Revenue, fuel and Frequent Flyer change in accounting estimate per ASK) adjusted for the impact of industrial action (1H12), Boeing settlement and carbon tax (1H13), and movements in average sector length. Refer to Supplementary Slide 10 for further detail. 6. Net free cash flow is operating cash flows less investing cash flows. Free cash flow is a measure of the amount of operating cash flows that are available (i.e. after investing activities) to fund reductions in net debt or payments to shareholders.
4
• Jetstar Group – largest LCC in Asia Pacific1
• Highly recognised brand
• Targeted, value‐driven investments
• Major reform of legacy cost base
• Strengthening network and alliances
• Enhancing world class customer offering
• Market leader in business and leisure
• Most extensive network; 65% market share
• Operational excellence and innovation
Strategic Direction Remains Unchanged
• Driving high returns with minimal capital
• Superior market penetration, 9m members
• World leading 450+ partner network
QANTAS LOYALTYAustralia’s leading loyalty program
QANTAS INTERNATIONALClear path to return to profit
JETSTAR IN ASIAWell positioned in fastest growing market
GROUP DOMESTICMulti‐brand strategy (Qantas, Jetstar)
1. Largest low cost carrier in Asia Pacific by gross revenues as at 30 September 2012.
STRONG FINANCIAL DISCIPLINE
• Debt reduction
• Targeting positive net free cash flow on FY basis
• Investment grade credit rating
• Major business transformation

5
Delivering on Strategic Priorities
July – Jetstar Japan launched
August – B787 fleet restructure; closed heavy maintenance base
September – Qantas‐Emirates partnership1 announced
October – Sale of StarTrack2, sale of Riverside and Cairns catering centres3
November – Unsecured bond redemption and share buy‐back announced
December – Maintained 65% domestic market share in 20124
January – ACCC interim authorisation for partnership5; joint selling commenced
February – Improved Qantas Asia network announced; Qantas Cash announced
EXECUTING ON STRATEGY TO DELIVER SUSTAINABLE RETURNS TO SHAREHOLDERS
1. Subject to regulatory approval. 2. Sale of 50% stake in StarTrack to Australia Post and acquisition of 100% of Australian air Express announced 2 October 2012 and completed 13 November 2012. 3. Sale of Riverside and Cairns catering centres completed on 31 October 2012. 4. Source: Bureau of Infrastructure, Transport and Regional Economics (BITRE) December 2012. 5. Conditional ACCC interim authorisation granted for Qantas‐Emirates partnership on 17 January 2013.
6
1H13 Result

7
Underlying Income Statement Summary
$M 1H131 1H121 VLY %
Net passenger revenue2 6,949 6,946 ‐ Yield decline offset by 2% capacity increase; growth in ancillary revenue
Net freight revenue 475 467 2 Consolidation of Australian air Express
Other revenue 818 635 29 Growth in charter and Frequent Flyer revenue; Boeing settlement $125m3
Revenue 8,242 8,048 2
Operating expenses (excluding fuel) 4,767 4,634 (3) 2% increase in capacity; carbon tax expense $55m
Fuel 2,181 2,181 ‐ Increase in capacity offset by fuel efficiency improvements
Depreciation and amortisation 719 679 (6) Fleet movements between 1H13 vs 1H12 including purchase of 25 aircraft (including 5 previously leased)
Non‐cancellable aircraft operating lease rentals
265 277 4 Wide‐body lease returns and 5 lease buyouts; favourable interest rates and FX
Underlying EBIT 310 277 12
Net finance costs (87) (75) (16) Reduction in average cash balance and loan draw downs
Underlying PBT1 223 202 10
1. All line items presented on an Underlying basis. Refer to slide 9 for a reconciliation of Underlying PBT to Statutory PBT. 2. Net passenger revenue has been adjusted in 1H13 to include associated ancillary passenger revenue, passenger service fees and lease revenue on code share. 1H12 net passenger revenue has been restated accordingly. These items remain excluded from the calculation of yield. 3. The Boeing settlement has been equally apportioned to Qantas Domestic, Qantas International and Jetstar.
81. Includes Qantas Brands Eliminations of $2m (1H13) and $9m (1H12) and Group Eliminations of $(1)m (1H13) and $1m (1H12). 2. Underlying EBIT is the primary reporting measure for all segments except Corporate/Unallocated. 3. Qantas Loyalty record Underlying EBIT result compared to prior periods normalised for changes in accounting estimates of the fair value of points and breakage expectations effective 1 January 2009.
Segment Underlying EBIT Contribution
$M 1H13 1H12 VLY %
Qantas Domestic 218 328 (34) Competitive pressures impacting yield; maintained corporate market revenue share
Qantas International (91) (262) 65 Turnaround strategy on track
Jetstar 128 147 (13) Solid core business result in challenging domestic conditions; start up investment in new airlines
Qantas Loyalty 137 119 15 Record EBIT3; 8% member growth and improved partner engagement
Qantas Freight 22 38 (42) Stable international performance offset by weaker domestic market
Corporate/Unallocated (105) (103) (2)
Eliminations1 1 10 (90)
Underlying EBIT2 310 277 12

9
Reconciliation to Statutory PBT
1. Underlying Profit Before Tax (PBT) is a non‐statutory measure and is the primary reporting measure used by the Qantas Group’s chief operating decision‐making bodies, being the Chief Executive Officer, Group Management Committee and the Board of Directors, for the purpose of assessing the performance of the Group. Underlying PBT is derived by adjusting Statutory PBT for the impact of AASB 139: Financial Instruments: Recognition and Measurement (AASB 139) which relate to other reporting periods and identifying certain other items which are not included in Underlying PBT (Refer slide 10).
$M 1H13 1H12
Underlying1 Ineffectiveness relating to
other reporting periods
Other items not included in
Underlying PBT
Statutory Underlying1 Ineffectiveness relating to
other reporting periods
Other items not included in
Underlying PBT
Statutory
Net passenger revenue 6,949 6,949 6,946 6,946
Net freight revenue 475 475 467 467
Other revenue 818 818 635 635
Revenue 8,242 8,242 8,048 8,048
Operating expenses (excl fuel) 4,767 5 106 4,878 4,634 67 137 4,838
Fuel 2,181 (46) 2,135 2,181 (64) 2,117
Depreciation and amortisation 719 719 679 679
Non–cancellable aircraft operating lease rentals
265 265 277 277
Expenses 7,932 (41) 106 7,997 7,771 3 137 7,911
EBIT 310 41 (106) 245 277 (3) (137) 137
Net finance costs (87) (7) (94) (75) (4) (79)
PBT 223 34 (106) 151 202 (7) (137) 58
10
Other Items Not Included in Underlying PBT
1. Items which are identified by Management and reported to the Qantas Group’s chief operating decision‐making bodies as not representing the underlying performance of the business are not included in Underlying PBT. The determination of these items is made after consideration of their nature and materiality and is applied consistently from period to period. Items not included in Underlying PBT primarily result from major transformational/restructuring initiatives, transactions involving investments and impairments of assets outside the ordinary course of business.
$M 1H13 1H12
Other items not included in Underlying PBT1:
• Net impairment of property, plant and equipment (62) (72) Early retirement of B744s and B763s following strategic network changes and exit of loss making routes
• Redundancies and restructuring (68) (46) Transformation initiatives including consolidation of engineering and catering centres
• Gain on disposal of jointly controlled entity 30 ‐ Gain on sale of StarTrack
• Impairment of investment ‐ (19) Impairment of investment in jointly controlled entity
• Other (6) ‐
Total Items not included in Underlying PBT (106) (137)

11
Cash Flow and Debt Position
Total Liabilities
DEBT POSITION AND GEARING
1H13 2H12 VLY%
Net Debt1 ($M) 3,363 3,558 5
Adjusted Equity2 ($M) 5,702 5,559 3
Gearing ratio3 47:53 49:51 2pts Focus on debt reduction
SUMMARISED CASH FLOW
$M 1H13 1H12 VLY %
Operating 780 823 (5) Reduction in international capacity and domestic yield
Investing (575) (1,501) 62 Lower capital expenditure; proceeds from sale of StarTrack
Free cash flow (Net Operating & Investing) 205 (678) >100 Positive net free cash flow
Financing (547) 525 <(100) Repayment of borrowings
Net change in cash held (342) (153) <(100) Cash reduction applied to balance sheet deleveraging
Effects of FX on cash 2 (1) >100
Cash at end of period 3,058 3,342 (8) Strong liquidity position
1. Net Debt includes interest bearing liabilities and the fair value of hedges related to debt less cash and aircraft security deposits. 2. Adjusted Equity includes equity adjusted to exclude hedge reserves, defined benefit prepayments (net of deferred tax) and to include any vested benefits deficit of defined benefit superannuation (net of deferred tax). 3. Gearing ratio is Net debt including operating lease liability to net debt including operating lease liability and Adjusted Equity. The gearing ratio is used by Management to represent the Qantas Group’s debt obligation including obligations under operating leases.
12
Capital Management and Treasury
• Strong liquidity position of $3.5b1
• Early redemption of US$450m unsecured notes due June 2013
– Next major unsecured debt maturity April 20152
• 24 new unencumbered aircraft (A320, B738) added in past 3 years
– 6 x A320/B738 added in 1H13
• Funding future deliveries with cash, structured leases, bank and ECA loans
• Investment grade credit rating
1. Includes cash and cash equivalents and $400m undrawn standby facility at 31 December 2012. 2. Qantas has an underwritten facility in place for the refinancing of the A$430 million unsecured bank loan due to mature in April 2014.
FOCUS ON GENERATING POSITIVE FREE CASH FLOWON A FULL YEAR BASIS GOING FORWARD

13
15.3 14.18.7
1H12 FY12 1H13
1.6 1.5
0.2 0.4
FY13F FY14F
New Capex Forecast Capex Reduction
Capital ExpenditureProactively managing capex whilst continuing product investment
• $600m reduction in planned net capex
– FY13 by $200m to $1.6b1
– FY14 by $400m to $1.5b
– Demonstrating flexibility
• Continued fleet and product investment
– 46 aircraft deliveries FY13 & FY142
– A330 reconfiguration
– Additional 5xB738 order3
• Average fleet age of 8.0 years4
1. $1.6b planned net capital expenditure represents $1.3b planned investing cash flows adjusted for $0.3b net disposal & acquisition proceeds relating to the sale of 50% stake in StarTrack to Australia Post and acquisition of 100% of Australian air Express announced 2 October 2012 and completed 13 November 2012. 2. Includes purchased and leased aircraft. 3. 5xB738 for delivery in 2014. 4. Average fleet age of the Group’s scheduled passenger fleet based on manufacturing date.
PLANNED NET CAPITAL EXPENDITURE ($B)
10YR CAPEX COMMITMENTS ($B)
14
1H13 Segment Results

15
Qantas Domestic
• Underlying EBIT $218m
– Yield pressure due to 10% market growth1
• Comparable unit cost2 improvement 1%
1. Source: BITRE July ‐ December 2012. 2. Comparable Unit Cost is defined as Net Underlying Unit Cost (Underlying EBIT less Passenger Revenue and fuel per ASK) adjusted for the impact of industrial action (1H12), Boeing settlement and carbon tax (1H13), and movements in average sector length.
• Enhancing product and service offering
– New B738s replacing B734s
– B767 refresh fast‐tracked
– QStreaming iPads introduced
– iPads and enhanced training for Customer Service Managers
• Launched Sydney‐Gold Coast services
• QantasLink and Network Aviation supporting regional growth
– Q400 and B717 fleet expansion announced
QSTREAMING iPADS
16
Qantas DomesticMarket leading domestic position
• Record levels of customer satisfaction
• Superior on time performance (won 9 out of past 12 months)1
• Maintained network and frequency advantage
• Clear choice for business
– Renewed 40 accounts2, lost four
– 39 new accounts2, including four won back as preferred airline
1. Source: BITRE January ‐ December 2012. 2. Represents large market accounts only. Total large market and SME accounts: renewed 73 accounts and signed 69 new accounts. 3. Highest score since reporting commenced in August 2008.
‘Best Domestic Airline’Australian Federation of Travel
Agents National Industry Awards 2012
‘Best Australian Lounges’Australian Business Traveller
Awards 2012
‘Best Regional Airline’Australian Traveller Awards
2012
‘Regional Airline of the Year’Air Transport World Awards
2012
SETTING THE STANDARD FOR PREMIUM TRAVEL
CY10 CY11 CY12
Average NPS Grounding
HIGHEST NET PROMOTER SCORE (NPS)3
17
(262) (91)
1H12 1H13
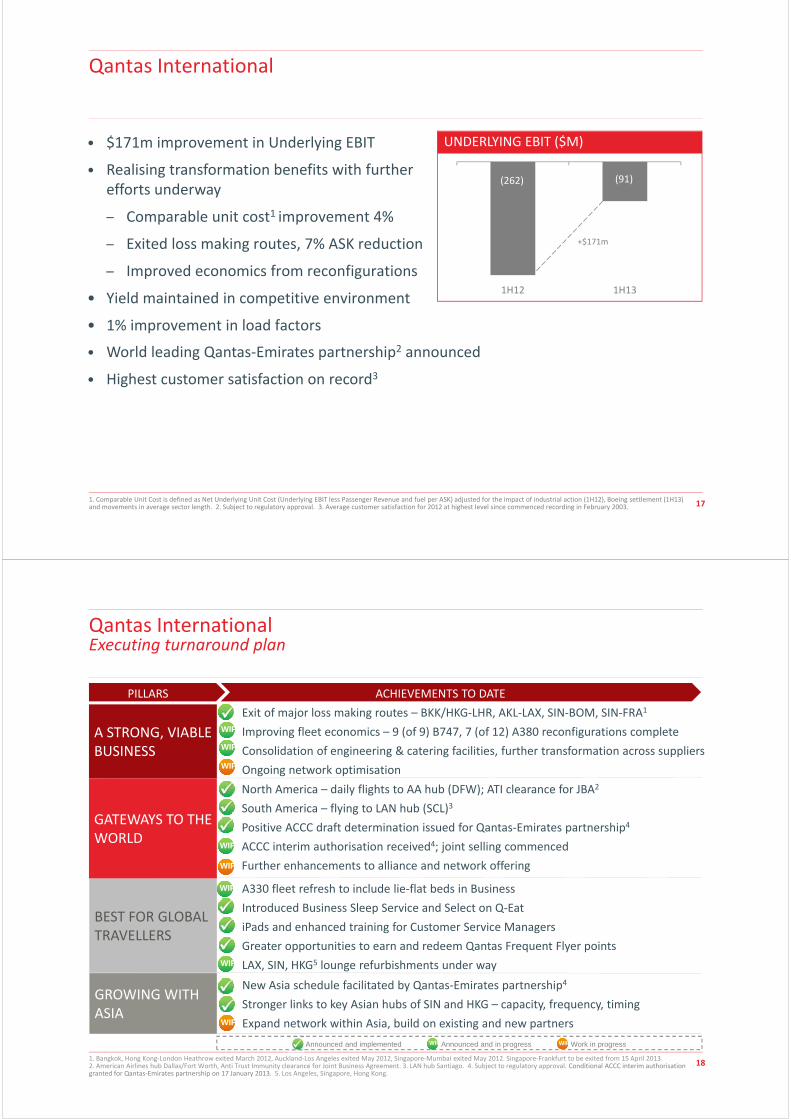
Qantas International
• $171m improvement in Underlying EBIT
• Realising transformation benefits with further efforts underway
– Comparable unit cost1 improvement 4%
– Exited loss making routes, 7% ASK reduction
– Improved economics from reconfigurations
• Yield maintained in competitive environment
• 1% improvement in load factors
1. Comparable Unit Cost is defined as Net Underlying Unit Cost (Underlying EBIT less Passenger Revenue and fuel per ASK) adjusted for the impact of industrial action (1H12), Boeing settlement (1H13) and movements in average sector length. 2. Subject to regulatory approval. 3. Average customer satisfaction for 2012 at highest level since commenced recording in February 2003.
• World leading Qantas‐Emirates partnership2 announced
• Highest customer satisfaction on record3
UNDERLYING EBIT ($M)
+$171m
18
New Asia schedule facilitated by Qantas‐Emirates partnership4
Stronger links to key Asian hubs of SIN and HKG – capacity, frequency, timing
Expand network within Asia, build on existing and new partners
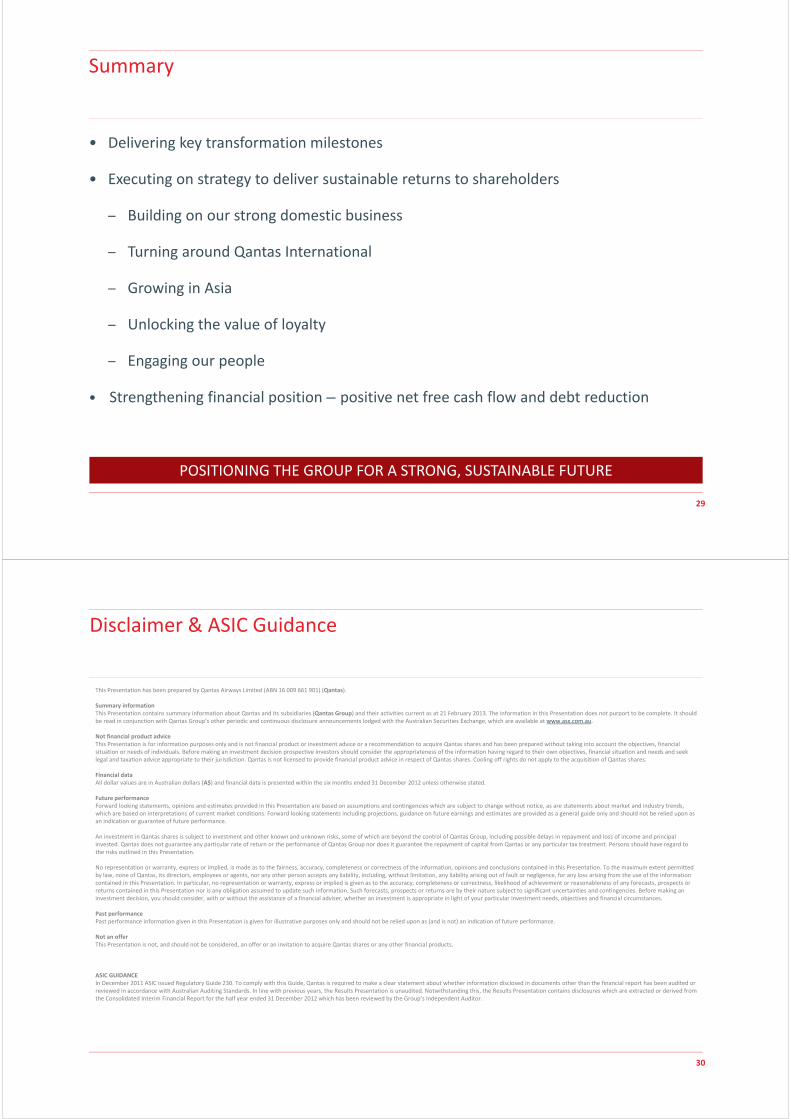
Qantas InternationalExecuting turnaround plan
A STRONG, VIABLE BUSINESS
GROWING WITH ASIA
BEST FOR GLOBAL TRAVELLERS
Exit of major loss making routes – BKK/HKG‐LHR, AKL‐LAX, SIN‐BOM, SIN‐FRA1
Improving fleet economics – 9 (of 9) B747, 7 (of 12) A380 reconfigurations complete
Consolidation of engineering & catering facilities, further transformation across suppliers
Ongoing network optimisation
North America – daily flights to AA hub (DFW); ATI clearance for JBA2
South America – flying to LAN hub (SCL)3
Positive ACCC draft determination issued for Qantas‐Emirates partnership4
ACCC interim authorisation received4; joint selling commenced
Further enhancements to alliance and network offering
A330 fleet refresh to include lie‐flat beds in Business
Introduced Business Sleep Service and Select on Q‐Eat
iPads and enhanced training for Customer Service Managers
Greater opportunities to earn and redeem Qantas Frequent Flyer points
LAX, SIN, HKG5 lounge refurbishments under way
WIP
WIP
WIP
WIP
GATEWAYS TO THE WORLD
Announced and implemented Announced and in progress Work in progress
WIP
WIP
WIP
WIP
1. Bangkok, Hong Kong‐London Heathrow exited March 2012, Auckland‐Los Angeles exited May 2012, Singapore‐Mumbai exited May 2012. Singapore‐Frankfurt to be exited from 15 April 2013. 2. American Airlines hub Dallas/Fort Worth, Anti Trust Immunity clearance for Joint Business Agreement. 3. LAN hub Santiago. 4. Subject to regulatory approval. Conditional ACCC interim authorisation granted for Qantas‐Emirates partnership on 17 January 2013. 5. Los Angeles, Singapore, Hong Kong.
WIP WIP
PILLARS ACHIEVEMENTS TO DATE

19
Qantas InternationalQantas‐Emirates partnership
WORLD LEADING AIRLINE PARTNERSHIP1
• One‐stop access to 65+ destinations in Europe, Middle East and North Africa
• Reduced travel time to Europe
• Greater opportunity to earn and redeem frequent flyer points
• World’s best lounges; seamless end‐to‐end customer experience between carriers
• Exclusive access to Dubai’s state‐of‐the‐art purpose built A380 concourse
• Emirates international passengers to access Qantas Domestic network
ON TRACK TO COMMENCE PARTNERSHIP FROM 31 MARCH 20131
• Positive ACCC draft determination for a 5 year partnership
– Interim authorisation granted2; joint marketing and selling commenced
• Strong initial bookings since joint selling commenced
• New Asia schedule announced February 2013
• Substantial benefits expected to result from joint network, codeshare commissions, exit from loss making routes and Asia network restructure
• Adverse impact of hub transition $40‐50m to 2H13 Underlying PBT
1. Subject to regulatory approval. 2. Conditional ACCC interim authorisation granted for Qantas‐Emirates partnership on 17 January 2013.
20
LondonBirmingham
ManchesterNewcastle
Dublin
Glasgow
Paris
BarcelonaMadridLisbon
Nice
MilanVenice
Rome
MaltaAthens
Istanbul
Larnaca
Amsterdam
Dusseldorf
Frankfurt Prague
Vienna
Hamburg
Copenhagen
Warsaw
Moscow
St. Petersburg
Dubai
MuscatDohaBahrain
DammamKuwait
Basra
BaghdadErbil
Amman
DamascusBeirut Tehran
Sana’a
Casablanca
Tunis
Tripoli Cairo
Khartoum
Addis Ababa
EntebbeNairobi
Dar es Salaam
Dekar
AbidjanAccra Lagos
Sydney
Brisbane
Melbourne
Adelaide
Perth
Australia
Qantas InternationalUnparalleled Access to Europe, Middle East and North Africa
COMBINED QANTAS‐EMIRATES NETWORK1
• 175+ destinations in world‐wide combined network
• 98 weekly services Australia‐Dubai
• 65+ one‐stop destinations in Europe, Middle East, North Africa
~90% of Qantas Frequent Flyer members to directly benefit from new routes in combined network2
1. Subject to regulatory approval. 2. Based on identified travel patterns of Qantas Frequent Flyer members travelling to destinations within the new combined Qantas‐Emirates network.

21
Qantas InternationalGrowing with Asia
1. Singapore, Hong Kong, Bangkok. 2.Singapore, Sydney, Melbourne, Brisbane. 3. Subject to regulatory approval. 4. Lie flat beds in Business class.
Jet Airways
Cathay Pacific
Japan Airlines
Malaysia Airlines
China Eastern
40% increase in available seats25 net additional connections
19 net additional connections
Singapore
Hong Kong
Bangkok
Jakarta
Manilla
Kuala Lumpur
Shanghai
Tokyo
10% increase in available seats
NEW IMPROVED ASIA SCHEDULE
• Material enhancements in key markets SIN, HKG, BKK1
— Double daily to SIN from SYD, MEL, BNE2
— Leveraging Jetstar in Asia
— Extended capacity via Emirates network3
— SIN, HKG lounge refurbishments under way
• Increased intra‐Asia connections
• Superior product through A330 refresh – lie flat beds4, focus on comfort, supported by Sleep Service
New direct service via Emirates network3
Jetstar Group
22
Jetstar
ANCILLARY REVENUE1 ($/PAX)• Underlying EBIT $128m
• 12% capacity growth, 12% passenger growth
• Industry leading ancillary revenue1 up 7%
• Controllable unit cost2 improvement of 2%
1. Includes bag fees sold as bundle in JetSaver and JetFlex fares and excludes management and branding fee revenue. 2. Controllable unit cost excludes Jetstar’s Asian businesses and is calculated as total expenses excluding fuel and carbon tax per ASK. 3. Passengers flown from 3 July 2012 to 31 December 2012.
• 100 million passengers flown since launch
• Building strong brand and growth across Asia
– Jetstar Asia strong passenger growth
– Jetstar Japan ~600,000 passengers flown to date3
– Restructure of Jetstar Pacific
21.929.6 31.7
1H11 1H12 1H13
35%7%

23
18,819 19,460 21,394 21,768 24,310
1H11 2H11 1H12 2H12 1H13
JetstarOne of the fastest growing airlines in Asia Pacific
JETSTAR GROUP ASKs5 (M)
• Sustained low fares stimulating demand
• Jetstar ANZ1 – profitable every year since 2004
• Jetstar Asia – 19% passenger2 & 2% yield2,3
growth; improvement in profitability
• Jetstar Pacific – fleet renewal complete
• Jetstar Japan – strong start in competitive market
• Jetstar Hong Kong – local CEO & CFO appointed; progressing with regulator4
• Structural changes improving customer service
1. Includes Jetstar Australia Domestic and International and Jetstar New Zealand. 2. Excludes impact of SIN‐AKL service which was transferred from Jetstar Asia to Jetstar International from 1 July 2012. 3. Yield excludes impact of FX; narrow‐body operations only. 4. In March 2012, the Qantas Group and China Eastern entered into a strategic alliance to launch Jetstar Hong Kong, subject to regulatory approval. 5. Total ASKs includes Jetstar Australia Domestic and International, Jetstar New Zealand, Jetstar Asia, Jetstar Pacific and Jetstar Japan.
Route Map as at 31 December 2012
CAGR 14%
24
7.9
8.69.0
FY11 FY12 1H13
• Record EBIT $137m1, up 15%
• Total billings $607m, external billings up 6%
• 9m members2, up 5% from June 2012
• 2.7m awards redeemed, up 13%
• New redemption options – flight simulation, UNICEF, David Jones Gift Cards
• Qantas‐Emirates partnership3 member benefits announced
Qantas Loyalty
1. Record Underlying EBIT result compared to prior periods normalised for changes in accounting estimates of the fair value of points and breakage expectations effective 1 January 2009. 2. Qantas Frequent Flyer members reached 9 million on 5 January 2013. 3. Subject to regulatory approval.
MEMBERS (M)
• Qantas Cash announced, a prepaid multi‐currency travel card
• Successful relaunch of Qantas Loyalty and Frequent Flyer brands

25
Qantas LoyaltyA new card to transform the member experience
• Introducing the new Qantas Card with Qantas Cash technology
– Membership, check‐in, boarding pass and payments in one card
– A new way to earn points
– Multi‐currency prepaid, load up to 9 currencies to use at home or abroad
– Available later this year, pre‐registrations from May
• Qantas Cash functionality will be provided through partnership with leading financial services companies
The offer of Qantas Cash is subject to certain regulatory requirements being satisfied. To be eligible to receive the new Qantas Card with the option of Qantas Cash technology you must be an Australian resident Qantas Frequent Flyer Member. Alternative cards without the payment facility are available to all other members. Other terms and conditions and fees and charges may apply. The proposed issuer of the prepaid facility is Heritage Bank Limited, subject to final agreement. A Product Disclosure Statement will be made available when the prepaid facility is available, expected to be later this year, via qantas.com, and will also be given to applicants for the facility. A person should consider the Product Disclosure Statement when making any decisions about the prepaid facility.
TM
26
13.9
‐2.7 ‐1.2
1H11 1H12 1H13
• Underlying EBIT $22m
• Strong international result despite weak global markets and reduced capacity
– Yield1 (excluding FX) up 3%
– Loads1 improved to 56%
– Leading customer satisfaction results
• Weak domestic market with strong competition
1. International yield (excluding FX) / loads excludes Australian air Express (consolidated from 13 November 2012). 2. Subject to regulatory approval. 3. Demand measured by Revenue Freight Tonne Kilometres (RFTKs).
Qantas FreightDelivering excellence in air freight services leveraging Qantas Group network
• Network strengthened by Qantas‐Emirates partnership2
• Fundamental domestic JV restructure
– Sale of StarTrack complete
– Australian air Express integration underway
– Integration synergies to be realised
AVG INDUSTRY DEMAND GROWTH3 (% VLY)

27
Recognition byworld’s leading sustainability indices
• Dow Jones Sustainability Index
– 1 of only 2 airlines and only Australian airline in World Index
– RobecoSAM Sustainable Asset Management Bronze Class 2013
– Only Australian airline in Asia Pacific Index
– Only Australian airline in Australian SAM Sustainability Index
• FTSE4Good Index
– Only Australian airline in Index
• Carbon Disclosure Project
– Highest disclosure score on the Australia/New Zealand index
• Banksia Environmental Award for Leading in Sustainability
Key 1H13Achievements
• Ongoing commitment and investment in customer experience
– Qantas Domestic best on time performance in 20121
– Highest Qantas Domestic Net Promoter Score (NPS) ever achieved2
– Significant fleet refresh programs – B747, B763 and B717
• People safety improved across each of the three core measures3
• Ongoing investment in employee development initiatives
• 12 workplace agreements closed in last twelve months
• Fuel optimisation and carbon reduction program on target
Sustainability
1. Source: BITRE January ‐ December 2012. Qantas most on time domestic airline compared to main competitor. 2. Highest score since reporting commenced in August 2008. 3. Core people safety measures are Total Recordable Injury Frequency Rate, Lost Work Case Frequency Rate and Duration Rate.
281. As at 18 February 2013, excluding carbon tax.
Outlook
• The Group’s 2H13 operating environment remains challenging and volatile
• Current Group operating expectations for 2H13:
– Group capacity to increase by 0.5‐1.5% in 2H13 compared to 2H12
– Domestic capacity to increase by 5‐7% in 2H13 compared to 2H12, whilst
maintaining flexibility
– Underlying fuel costs expected to be ~$2.25b1 in 2H13
• No Group profit guidance provided at this time due to the high degree of volatility and
uncertainty in the competitive environment, global economic conditions, fuel prices
and FX rates.
29
• Delivering key transformation milestones
• Executing on strategy to deliver sustainable returns to shareholders
– Building on our strong domestic business
– Turning around Qantas International
– Growing in Asia
– Unlocking the value of loyalty
– Engaging our people
• Strengthening financial position – positive net free cash flow and debt reduction
Summary
POSITIONING THE GROUP FOR A STRONG, SUSTAINABLE FUTURE
30
Disclaimer & ASIC Guidance
This Presentation has been prepared by Qantas Airways Limited (ABN 16 009 661 901) (Qantas).
Summary information This Presentation contains summary information about Qantas and its subsidiaries (Qantas Group) and their activities current as at 21 February 2013. The information in this Presentation does not purport to be complete. It should be read in conjunction with Qantas Group’s other periodic and continuous disclosure announcements lodged with the Australian Securities Exchange, which are available at www.asx.com.au.
Not financial product advice This Presentation is for information purposes only and is not financial product or investment advice or a recommendation to acquire Qantas shares and has been prepared without taking into account the objectives, financial situation or needs of individuals. Before making an investment decision prospective investors should consider the appropriateness of the information having regard to their own objectives, financial situation and needs and seek legal and taxation advice appropriate to their jurisdiction. Qantas is not licensed to provide financial product advice in respect of Qantas shares. Cooling off rights do not apply to the acquisition of Qantas shares.
Financial data All dollar values are in Australian dollars (A$) and financial data is presented within the six months ended 31 December 2012 unless otherwise stated.
Future performanceForward looking statements, opinions and estimates provided in this Presentation are based on assumptions and contingencies which are subject to change without notice, as are statements about market and industry trends, which are based on interpretations of current market conditions. Forward looking statements including projections, guidance on future earnings and estimates are provided as a general guide only and should not be relied upon as an indication or guarantee of future performance.
An investment in Qantas shares is subject to investment and other known and unknown risks, some of which are beyond the control of Qantas Group, including possible delays in repayment and loss of income and principal invested. Qantas does not guarantee any particular rate of return or the performance of Qantas Group nor does it guarantee the repayment of capital from Qantas or any particular tax treatment. Persons should have regard to the risks outlined in this Presentation.
No representation or warranty, express or implied, is made as to the fairness, accuracy, completeness or correctness of the information, opinions and conclusions contained in this Presentation. To the maximum extent permitted by law, none of Qantas, its directors, employees or agents, nor any other person accepts any liability, including, without limitation, any liability arising out of fault or negligence, for any loss arising from the use of the information contained in this Presentation. In particular, no representation or warranty, express or implied is given as to the accuracy, completeness or correctness, likelihood of achievement or reasonableness of any forecasts, prospects or returns contained in this Presentation nor is any obligation assumed to update such information. Such forecasts, prospects or returns are by their nature subject to significant uncertainties and contingencies. Before making an investment decision, you should consider, with or without the assistance of a financial adviser, whether an investment is appropriate in light of your particular investment needs, objectives and financial circumstances.
Past performance Past performance information given in this Presentation is given for illustrative purposes only and should not be relied upon as (and is not) an indication of future performance.
Not an offer This Presentation is not, and should not be considered, an offer or an invitation to acquire Qantas shares or any other financial products.
ASIC GUIDANCEIn December 2011 ASIC issued Regulatory Guide 230. To comply with this Guide, Qantas is required to make a clear statement about whether information disclosed in documents other than the financial report has been audited or reviewed in accordance with Australian Auditing Standards. In line with previous years, the Results Presentation is unaudited. Notwithstanding this, the Results Presentation contains disclosures which are extracted or derived from the Consolidated Interim Financial Report for the half year ended 31 December 2012 which has been reviewed by the Group’s Independent Auditor.