Embed Size (px)
Citation preview
QCD: measuring manufacturing performance
Contents
01 About this brochure
02 The benefits of QCD
03 Measure 1: Not right first time
05 Measure 2: Delivery ScheduleAchievement
07 Measure 3: People Productivity
09 Measure 4: Stock Turns
11 Measure 5: Overall EquipmentEffectiveness
13 Measure 6: Value Added Per Person
15 Measure 7: Floor Space Utilisation
17 Further help and advice
The DTI drives our ambition of‘prosperity for all’ by working tocreate the best environment forbusiness success in the UK.We help people and companiesbecome more productive bypromoting enterprise, innovation and creativity.
We champion UK business at homeand abroad. We invest heavily inworld-class science and technology.We protect the rights of workingpeople and consumers. And westand up for fair and open markets in the UK, Europe and the world.
Achieving best practice in your business is a key
theme within DTI’s approach to business support
solutions, providing ideas and insights into how
you can improve performance across your
business. By showing what works in other
businesses, we can help you see what can help
you, and then support you in implementation.
This brochure focuses on these solutions.
In an increasingly global market it isessential that UK businesses remaincompetitive. And seeking continuousimprovement in all areas of your businesswill help you meet the challenge of thisglobal competition.
In this brochure the automotive sectorshares best practice by supplying seven key measures under the umbrella of Quality,Cost and Delivery (QCD).
Using these key measures, businesses in any sector can get things right first time more often – boost productivity, scrap reduction, get better customersatisfaction and reduce the amount of floor space needed.
The seven key performance measures areexplained, along with examples of bestpractice from other businesses. Look at allthe measures, then decide how you couldapply them to make your business prosper.
This brochure is for: Any business thatwants more efficient and productive.
It covers: The seven key measures underQuality, Cost and Delivery (QCD).
01
About this brochure
The seven key measures were developed by the IndustryForum of the Society of Motor Manufacturers and Traders(SMMT) and endorsed by the automotive industry in the UK.
But QCD (Quality, Cost, Delivery) is not sector-specific. The key measurescan be used to improve production performance across a whole range ofindustries.
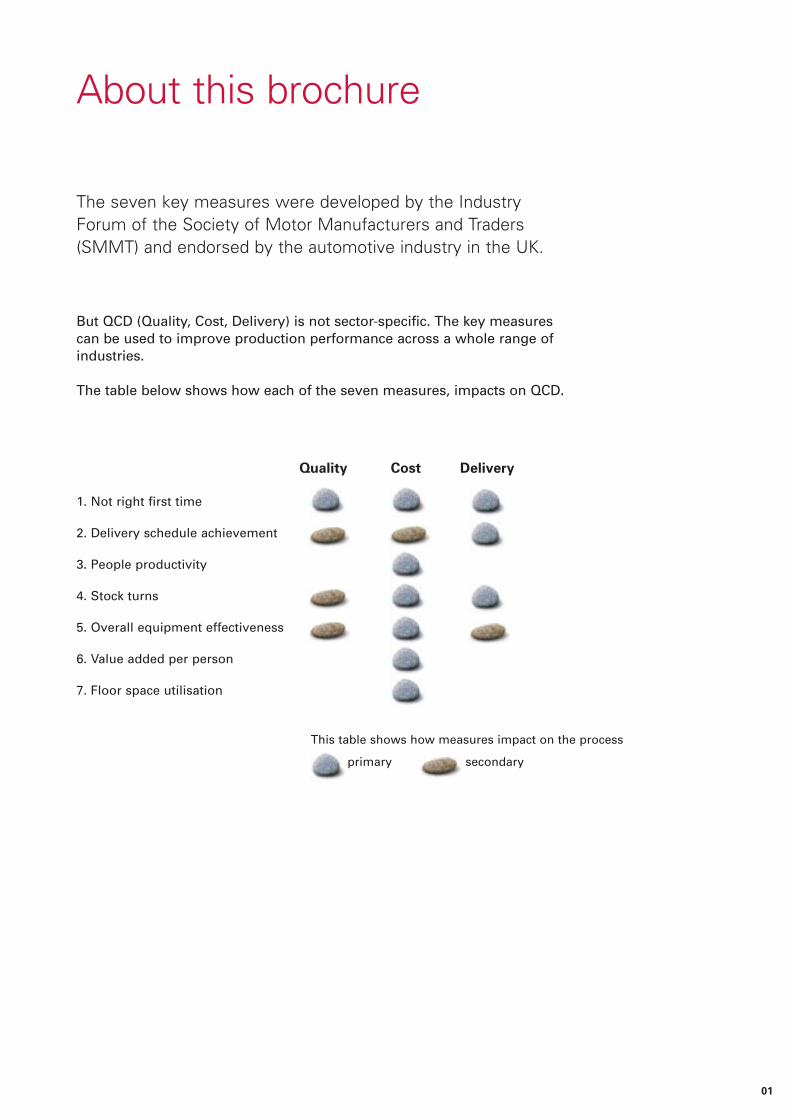
The table below shows how each of the seven measures, impacts on QCD.
1. Not right first time
2. Delivery schedule achievement
3. People productivity
4. Stock turns
5. Overall equipment effectiveness
6. Value added per person
7. Floor space utilisation
Quality Cost Delivery
This table shows how measures impact on the process
primary secondary
02
The benefits of QCD
CLARITY
The measures can focus and clarify your priorities forimproving your production management.
SIMPLICITY
The measures simplify even a complex productionprocess and identify a straightforward route forimprovements.
FEEDBACK
The seven QCD measures can be used to quantify theresults of any changes to a process. The effect of achange can be compared with the status of the processbefore the change. QCD provides rapid feedback andquantifiable numeric comparisons.
BENCHMARKING
QCD provides the basis for objective comparison withpeer group businesses. This will highlight processeswhich offer better methods and practices.
THE BOTTOM LINE
Using the tools and techniques will noticeably improveefficiency, which can lead to rapid return oninvestment and increased profits.
These QCD measures • should be used together
• use simple mathematical equations to analyseproduction performance
• provide results which you can use as the basis ofcontinuous measurement and improvement.
The case studies in this booklet share best practice byshowing how QCD has helped real businesses.
03
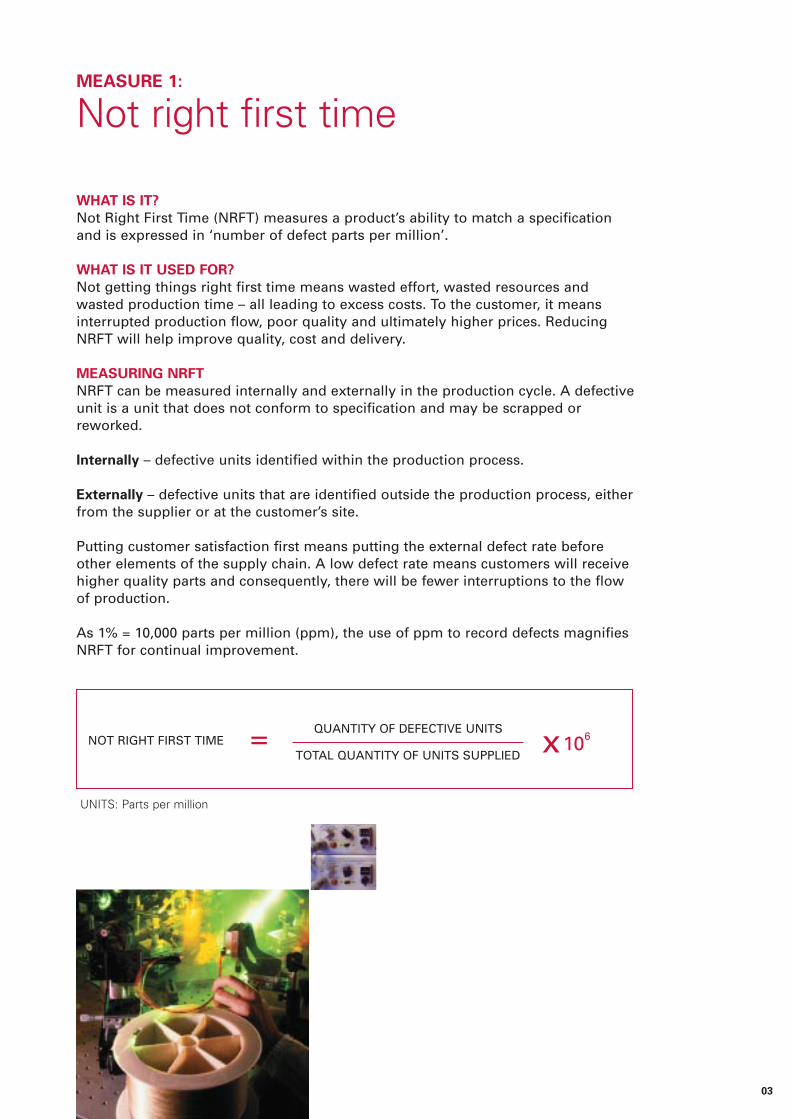
WHAT IS IT?
Not Right First Time (NRFT) measures a product’s ability to match a specificationand is expressed in ‘number of defect parts per million’.
WHAT IS IT USED FOR?
Not getting things right first time means wasted effort, wasted resources andwasted production time – all leading to excess costs. To the customer, it meansinterrupted production flow, poor quality and ultimately higher prices. ReducingNRFT will help improve quality, cost and delivery.
MEASURING NRFT
NRFT can be measured internally and externally in the production cycle. A defectiveunit is a unit that does not conform to specification and may be scrapped orreworked.
Internally – defective units identified within the production process.
Externally – defective units that are identified outside the production process, eitherfrom the supplier or at the customer’s site.
Putting customer satisfaction first means putting the external defect rate beforeother elements of the supply chain. A low defect rate means customers will receivehigher quality parts and consequently, there will be fewer interruptions to the flowof production.
As 1% = 10,000 parts per million (ppm), the use of ppm to record defects magnifiesNRFT for continual improvement.
MEASURE 1:
Not right first time
UNITS: Parts per million
QUANTITY OF DEFECTIVE UNITS
TOTAL QUANTITY OF UNITS SUPPLIED x106NOT RIGHT FIRST TIME =
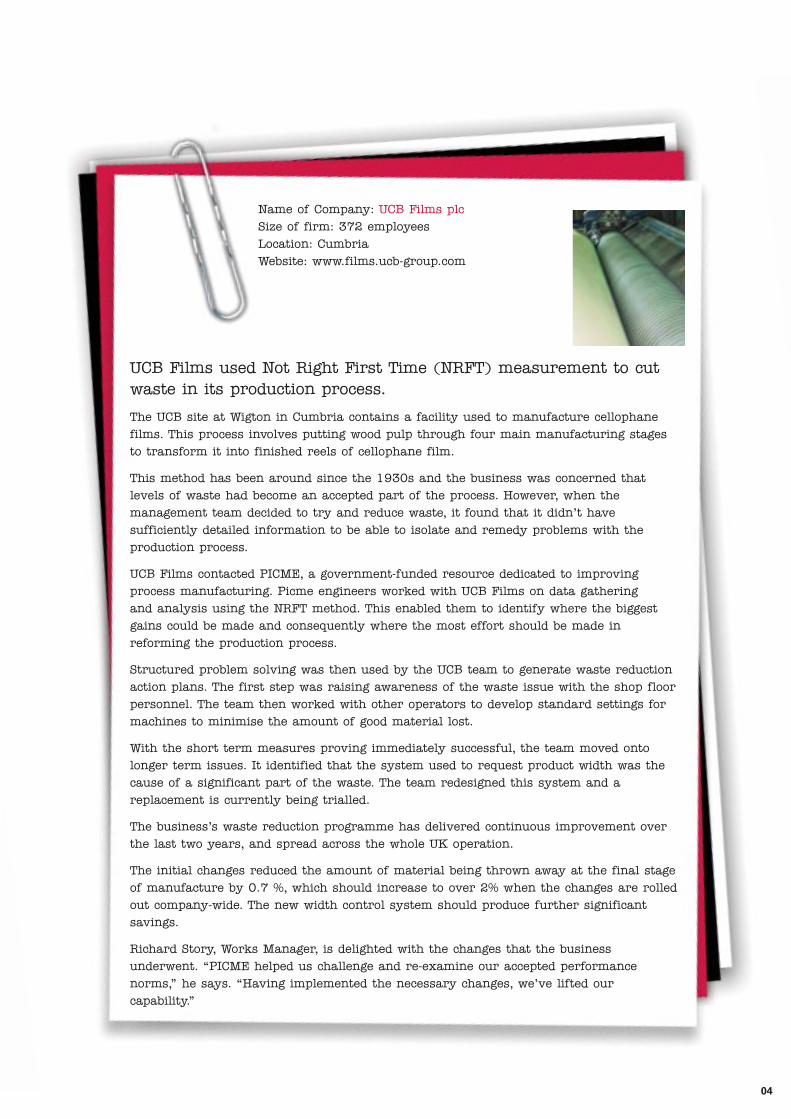
UCB Films used Not Right First Time (NRFT) measurement to cutwaste in its production process.
The UCB site at Wigton in Cumbria contains a facility used to manufacture cellophane
films. This process involves putting wood pulp through four main manufacturing stages
to transform it into finished reels of cellophane film.
This method has been around since the 1930s and the business was concerned that
levels of waste had become an accepted part of the process. However, when the
management team decided to try and reduce waste, it found that it didn’t have
sufficiently detailed information to be able to isolate and remedy problems with the
production process.
UCB Films contacted PICME, a government-funded resource dedicated to improving
process manufacturing. Picme engineers worked with UCB Films on data gathering
and analysis using the NRFT method. This enabled them to identify where the biggest
gains could be made and consequently where the most effort should be made in
reforming the production process.
Structured problem solving was then used by the UCB team to generate waste reduction
action plans. The first step was raising awareness of the waste issue with the shop floor
personnel. The team then worked with other operators to develop standard settings for
machines to minimise the amount of good material lost.
With the short term measures proving immediately successful, the team moved onto
longer term issues. It identified that the system used to request product width was the
cause of a significant part of the waste. The team redesigned this system and a
replacement is currently being trialled.
The business’s waste reduction programme has delivered continuous improvement over
the last two years, and spread across the whole UK operation.
The initial changes reduced the amount of material being thrown away at the final stage
of manufacture by 0.7 %, which should increase to over 2% when the changes are rolled
out company-wide. The new width control system should produce further significant
savings.
Richard Story, Works Manager, is delighted with the changes that the business
underwent. “PICME helped us challenge and re-examine our accepted performance
norms,” he says. “Having implemented the necessary changes, we’ve lifted our
capability.”
Name of Company: UCB Films plc
Size of firm: 372 employees
Location: Cumbria
Website: www.films.ucb-group.com
04
05
WHAT IS IT?
Delivery Schedule Achievement (DSA) measures how well a supplier matchesthe planned delivery requirement of the customer.
WHAT IS IT USED FOR?
The ability to deliver products on time is fundamental to customer satisfaction.However, 100% on time delivery must be achieved without unnecessaryadditional costs such as special deliveries, overtime payments, increases instocks, scrap or rework costs. These additional costs are a reflection of a lack ofcontrol over the manufacturing process.
DSA is a function of good plant performance, which in turn is an indication ofgood management. Good plant performance is demonstrated when productionflows through the plant without interruptions.
MEASURING DSA
The DSA measures the actual delivery performance against the planned deliveryschedule. • Late and early deliveries are regarded as failures and are called ‘not on time’
in the measure.
• ‘Incorrect quantity deliveries’ are deliveries of too many or too few parts andparts that don’t conform to the job, even if they can be reworked.
• If a delivery is both ‘not on time’ and ‘incorrect quantity’ then count it onlyonce.WHAT IS IT?
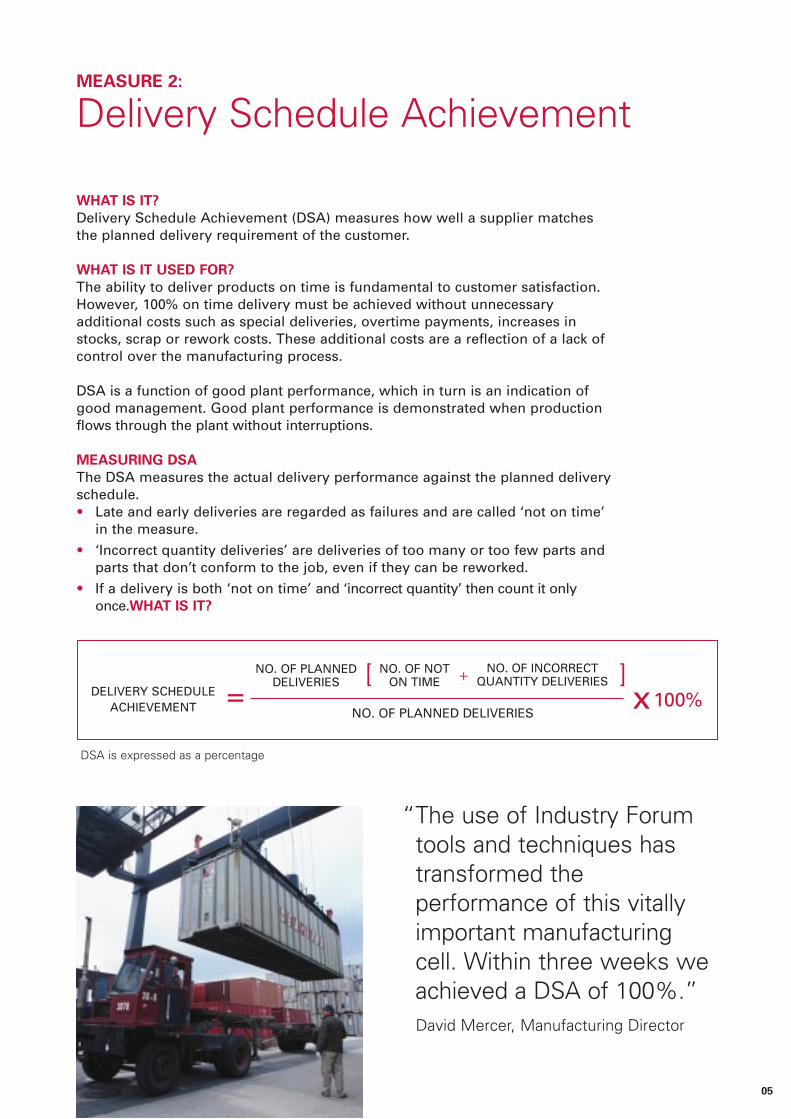
MEASURE 2:
Delivery Schedule Achievement
NO. OF PLANNEDDELIVERIES
NO. OF NOTON TIME
NO. OF INCORRECTQUANTITY DELIVERIES[ + ]
DSA is expressed as a percentage
NO. OF PLANNED DELIVERIESx100%DELIVERY SCHEDULE
ACHIEVEMENT =
“The use of Industry Forumtools and techniques hastransformed theperformance of this vitallyimportant manufacturingcell. Within three weeks weachieved a DSA of 100%.”David Mercer, Manufacturing Director
06
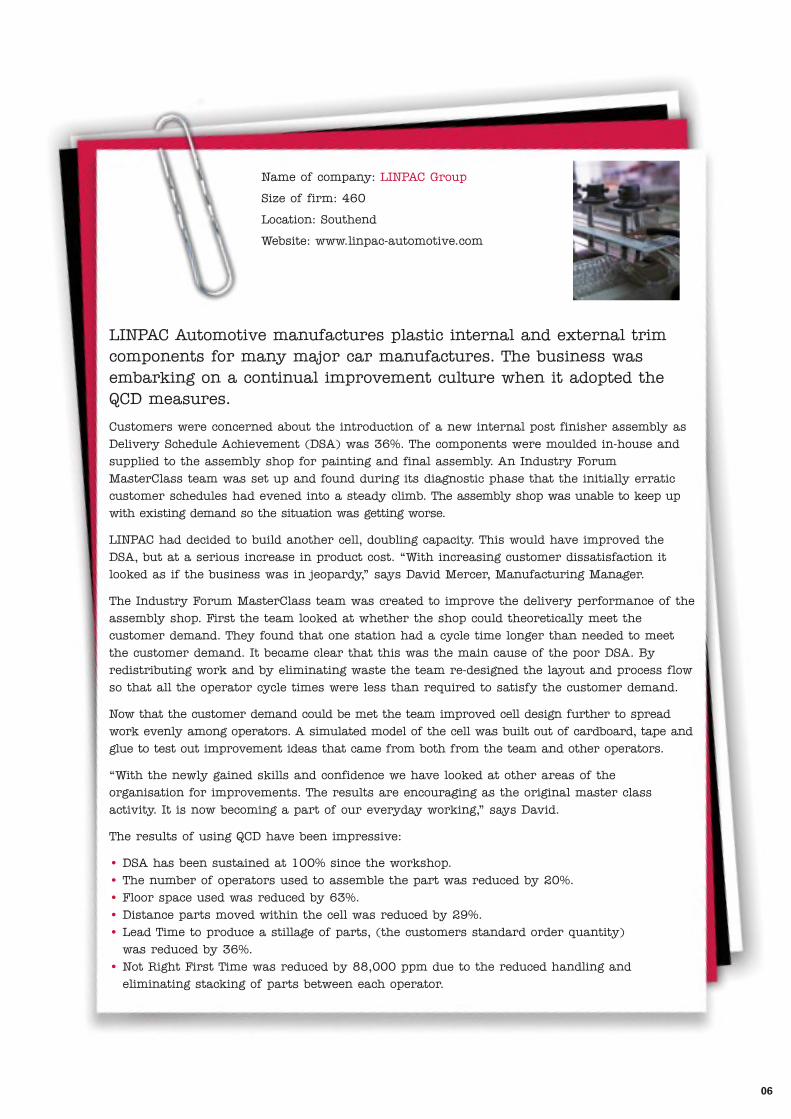
LINPAC Automotive manufactures plastic internal and external trimcomponents for many major car manufactures. The business wasembarking on a continual improvement culture when it adopted theQCD measures.
Customers were concerned about the introduction of a new internal post finisher assembly as
Delivery Schedule Achievement (DSA) was 36%. The components were moulded in-house and
supplied to the assembly shop for painting and final assembly. An Industry Forum
MasterClass team was set up and found during its diagnostic phase that the initially erratic
customer schedules had evened into a steady climb. The assembly shop was unable to keep up
with existing demand so the situation was getting worse.
LINPAC had decided to build another cell, doubling capacity. This would have improved the
DSA, but at a serious increase in product cost. “With increasing customer dissatisfaction it
looked as if the business was in jeopardy,” says David Mercer, Manufacturing Manager.
The Industry Forum MasterClass team was created to improve the delivery performance of the
assembly shop. First the team looked at whether the shop could theoretically meet the
customer demand. They found that one station had a cycle time longer than needed to meet
the customer demand. It became clear that this was the main cause of the poor DSA. By
redistributing work and by eliminating waste the team re-designed the layout and process flow
so that all the operator cycle times were less than required to satisfy the customer demand.
Now that the customer demand could be met the team improved cell design further to spread
work evenly among operators. A simulated model of the cell was built out of cardboard, tape and
glue to test out improvement ideas that came from both from the team and other operators.
“With the newly gained skills and confidence we have looked at other areas of the
organisation for improvements. The results are encouraging as the original master class
activity. It is now becoming a part of our everyday working,” says David.
The results of using QCD have been impressive:
• DSA has been sustained at 100% since the workshop.
• The number of operators used to assemble the part was reduced by 20%.
• Floor space used was reduced by 63%.
• Distance parts moved within the cell was reduced by 29%.
• Lead Time to produce a stillage of parts, (the customers standard order quantity)
was reduced by 36%.
• Not Right First Time was reduced by 88,000 ppm due to the reduced handling and
eliminating stacking of parts between each operator.
Name of company: LINPAC Group
Size of firm: 460
Location: Southend
Website: www.linpac-automotive.com
07
WHAT IS IT?
People Productivity (PP) is a measure of the ratio between the number ofgood units made and the number of direct operator hours it takes to makethose units. Using this measure can help control the people costassociated with production. This objective is to maximise the PP figure byeither reducing the direct operator involvement, or increasing the numberof good units made.
WHAT IS IT USED FOR?
Measuring PP helps you focus in on a key element of product cost andreduces processing time, for example by reducing wasteful work andstandardising the process. Best practice means avoiding overproduction.
MEASURING PP
Work is defined under three divisions:• Work which adds value in line with the customers specification.
• Work which does not add value, but is necessary under currentconditions.
• Work which is wasteful and counter-productive.
A high PP can only be obtained when:• most of direct employees’ work is adding value to the process
• non-value added work is reduced to minimum
• waste is eliminated.
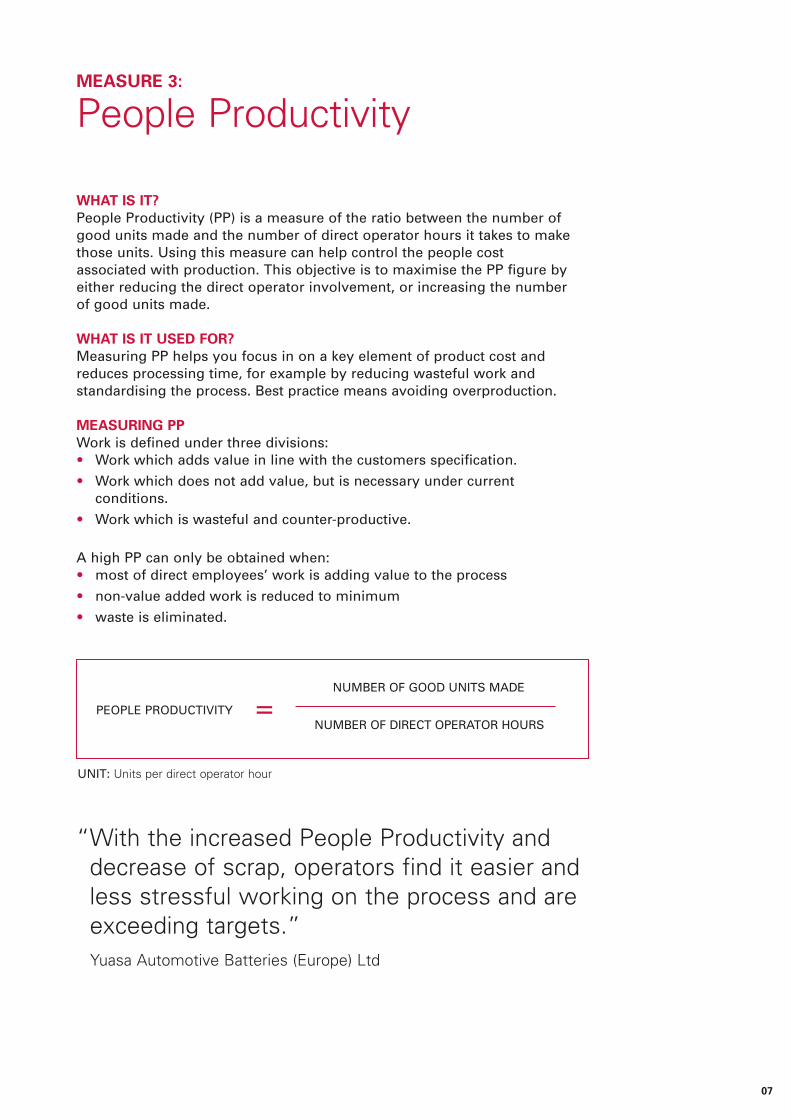
MEASURE 3:
People Productivity
NUMBER OF GOOD UNITS MADE
UNIT: Units per direct operator hour
NUMBER OF DIRECT OPERATOR HOURSPEOPLE PRODUCTIVITY =
“With the increased People Productivity anddecrease of scrap, operators find it easier andless stressful working on the process and areexceeding targets.”Yuasa Automotive Batteries (Europe) Ltd
Automotive batteries were first manufactured on the site in the 1920sand Yuasa has wholly owned the factory since 1997. The businessproduces batteries mostly for passenger cars (original equipmentmanufacturers and aftermarket), but also for commercial and off-highway vehicles.
“The late nineties brought about a situation where our products were being imported from
elsewhere within the world, at significantly reduced costs. It was very clear that the UK
operation needed to match many of these costs but still deliver superior quality and delivery.
A significant part of this task comes from people productivity. This was the prime area of
focus,” says Marcus Heather, Managing Director.
The team chose one area of operation for the QCD exercise and manufacturing line management
was identified as key to supporting the improvements and developing a sustainable process.
The output of the lines chosen had untapped capacity. Releasing this would have two benefits:
• reduction of overtime, freeing capacity
• reduction of internal costs.
The Industry Forum team carried out an in-depth analysis of performance within the chosen
area and a process was identified for improvement. The primary measures of performance
were Non-Right First Time, People Productivity and Overall Equipment Effectiveness (QCD
measures 1, 3 and 5).
Wasteful activities were identified and countermeasures put in place. Daily check sheets for
the operators and preventive maintenance systems, together with standardised operations and
visual controls, were implemented.
Targets were set for each improvement that was to be made. In addition to the hard measures
of QCD performance, ideas relating to planning, leadership and ownership were taken on-
board.
The team made an effort to challenge all fixed ideas and would ask ‘why?’ five times when
thinking about processes and improvements.
As a result of the process:
• People Productivity had increased 65% by the final Industry Forum visit.
• Scrap was reduced 68%.
• 100% of employees were guided through process improvement philosophy.
• Time was made available for preventive maintenance.
• A faster, more effective communication system was put in place.
• The business gained greater produce awareness and operators become more empowered.
Name of company: Yuasa Automotive Batteries (Europe) Ltd
Location: Birmingham
Size of firm: 500
Website: www.yuasa.co.uk
08
09
WHAT IS IT?
Stock Turns (ST) is a measure of how frequently the stock (raw material, work-in-progress and finished goods) are turned over in relation to the sales revenue of a product.
WHAT DOES IT DO?
ST is an important measure because it reflects the level of control and co-ordination of materials that flow through the process. Inventory levels (by value orquantity) are key indicators of the leanness of the process and are directly relatedto the simplicity of production flows. In contrast, excess inventory meansunnecessary cost.
MEASURING ST
ST ratios reveal how much control a business has over a process. Tightlycontrolled processes needs only low levels of raw material and work-in-progress(WIP).
A tightly controlled process is also more dependable, as the business knows howmuch stock it needs and does not have an excess of finished goods.
Ideally the operator aims to eliminate interruptions to the manufacturing processto keep the production stream continuous. With less interruptions, the productioncycle can be reduced so that less inventory is tied up, releasing cash and valuableproduction space. Furthermore, improvements in ST could allow the supplier torespond faster to customer demands and work to much tighter schedules.
• Inventories of incoming parts measure the efficiency of the flow of materialsfrom the supplier.
• Work-in-progress (WIP) indicates factory flow.
• The finished goods figure represents the available level of completed productfor delivery to the customer.
Faster throughput time and frequent deliveries to the customer will result in lowervalues for finished goods.
MEASURE 4:
Stock Turns
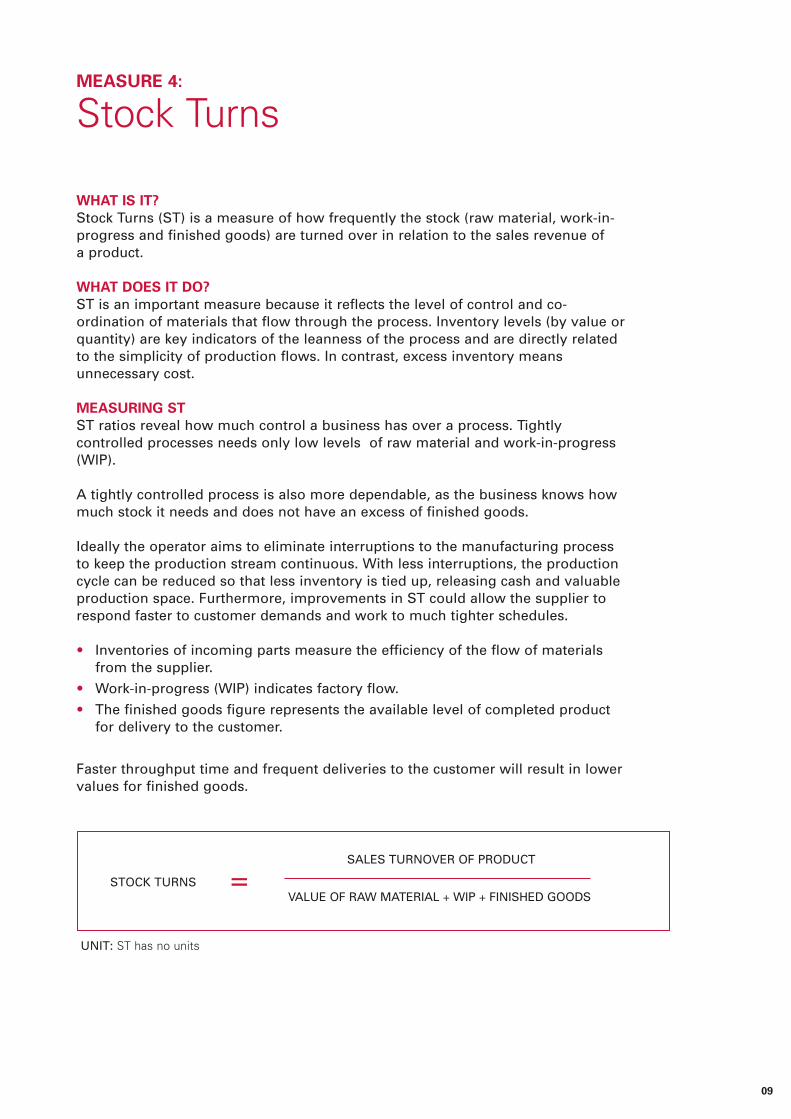
SALES TURNOVER OF PRODUCT
UNIT: ST has no units
VALUE OF RAW MATERIAL + WIP + FINISHED GOODSSTOCK TURNS =
Concord Engineering manufactures small pressed components, up to a250 tonne capacity, for vehicle manufacturers and tier one customers inthe automotive market.
The business has two main facilities, a manufacturing plant and a distribution centre. The
manufacturing was initially felt to be in most need of improvement and so Concord undertook an
Industry Forum MasterClass activity to introduce tools and techniques of Continuous Improvement.
This was sustained and cascaded within the manufacturing area. Concord was then invited to
take part in an Industry Forum Supply Chain activity by a tier one customer and decided to
focus on the distribution of parts to subcontractors and to the customer. The business was
already monitoring QCD performance and it was clear that the main issue was the low Stock
Turns ratio.
“The stores were chosen for our project because as a separate facility it had been neglected and fell
well below the standard of our manufacturing area,” says Managing Director Bob Reynolds.
Concord then decided to introduce a kanban system with subcontractors so that results could
easily be measured via QCD – Stock Turns and Delivery Schedule Achievement. (A kanban
system is a way of achieving Just--in-Time production.)
The team found a high proportion of the stock was as finished goods, with maximum added
value. In addition, the level of stock held for smaller customers was very high in comparison to
their turnover. Manufacture and distribution was controlled by an inflexible ‘push’ system from
internal manufacture, through finishing subcontract and then distribution. In addition the
stocking of material at subcontractors allowed them to overproduce, possibly using material for
non-critical components creating a shortfall on critical work.
To solve this problem the team decided to create a simple ‘pull’ system to ensure that the correct
parts were made when they were required with a minimum stock level. The main distribution
area was reorganised, creating space for a WIP storage area and a finished goods storage area.
Each of these areas can hold two batches of a particular part. A signal card travels with each
batch of parts. When a customer draws a batch of parts from the finished goods area the card is
taken and placed on a WIP board. This releases a fresh batch of material from the WIP storage
to subcontract and subsequently the release of the next batch of material from manufacturing to
the WIP stores. The card is placed with this batch and remains with it throughout the system.
Concord has seen real results from their activities:
• Stock turns have risen by 15%.
• Concord can tightly control the flow of material through the subcontract finishing and distribution
area. They now aim to cascade the ‘pull’ system back into the manufacturing area of business.
• Increased customer satisfaction has helped Concord win new business.
Name of company: Concord Engineering
Locations: Birmingham
Size of firm: 50
Website: www.concordengineering.co.uk
10
11
WHAT IS IT?
Overall Equipment Effectiveness (OEE) measures the availability, performance andquality of a process.
WHAT DOES IT DO?
The OEE measure shows how well the business is utilising its resources, includingequipment and labour.
MEASURING OEE
OEE is calculated by combining three elements: 1 availability2 performance3 quality.
You need to understand the level of each element, as well as knowing the OEEvalue. Comparison of the three element figures provides a focus for improvement.
Availability – expressed as a percentage, compares the planned and actual timeof the process run. An example of an improvement in availability is theelimination of unplanned down time, which interrupts the flow of productionand customer delivery.
Performance – expressed as a percentage, compares the actual and ideal outputachieved during the running of the process. An improvement would be returningthe cycle time of the process back to the ideal design specification of theequipment.
Quality – expressed as a percentage, compares the number of good parts madeagainst the total parts made. Quality improvements include reducing rework andscrap generated by the process.
MEASURE 5:
Overall Equipment Effectiveness
1
2
3
UNIT: OEE expressed as a percentage
AVAILABILITY % X PERFORMANCE % X QUALITY %OVERALL EQUIPMENT
EFFECTIVENESS =
“The process didn’t stop when the IndustryForum Engineers left either. It gave us theimpetus to continue working on other areashighlighted by the activity. We were also leftwith some skills, techniques and people nowfamiliar with the change process to continuemaking improvements.”
Jotun Paints used Overall Equipment Effectiveness (OEE) measurementto reduce production backlogs and improve productivity.
Jotun Paints is one of the UK’s leading manufacturers of paints and coatings. Its Flixborough
site in Lincolnshire produces a range of marine paints for ship hulls.
During the summer months the company found that demand was exceeded its manufacturing
capacity, which meant a large backlog of orders was developing. Rather than immediately
invest in new capacity, the management team decided to investigate if it could increase
production using the company’s existing assets.
Jotun contacted PICME, a government-funded resource dedicated to improving process
manufacturing. PICME engineers joined Jotun production operators, supervisory staff, a
planner, an engineer and a technical manager in performing an OEE analysis of the
production process.
The team identified one part of the production process, dissolver 218, as a significant cause
of the backlog owing to downtime and a significant variation in batch cycle time. Using
problem solving techniques, the team eliminated the main causes of downtime and reduced
the cycle time variation by producing a standard method of working and asking operators to
record their achieved batch cycle times.
This approach yielded a significant improvement in output over a short timescale.
Encouraged by the tremendous success on this dissolver, the team went on to apply the same
techniques to other dissolvers on site.
The production output in the problem area, dissolver 218, has been increased by roughly a
third in the space of only three months – resulting in an increase in OEE from around 60%
to 80%.
By applying the lessons of the analysis to other areas of the business, the team has also
been able to meet another key management objective: to reduce the impact of returned
product on financial and manufacturing performance
This success has helped raise expectations in all area of the business from production to
sales, supply chain, organisation and tidiness. The principles that the team developed are
now helping operators site-wide to work more efficiently and in a cleaner environment.
Process Manager Ben Parsley is enthusiastic about the changes and the way they were
implemented. “Being able to measure the improvements not only shows that you are heading
in the right direction,” he says, “but it also encourages both the team and the rest of the
employees that progress is really being made.”
Name of company: Jotun Paints (Europe) Ltd
Location: Lincolnshire
Size of firm: 145 employees
Website: www.jotun.co.uk
12
13
WHAT IS IT?
Value Added Per Person (VAPP) is a financial measure that relates the number ofdirect people involved in the conversion process to add value to the product.
WHAT IS IT USED FOR?
The VAPP has a direct impact on the costs associated with a process and showsspecifically how well people are used to transform materials into the finishedproduct.• Output value is the sales value of the unit after production.
• Input value is the value of the raw material unit before production.
• Direct employees are those employees without which the production processcannot operate.
MEASURING VAPP
The VAPP measure allows the production process to be controlled ensuring themaximum difference between output and input values. The output and inputvalues reflect the difference between the final value of the end product and thevalue of raw materials and services used. An example of a VAPP improvement isabsorbing up or down stream processes into the cell or factory while stillmaintaining the current number of direct employees.
MEASURE 6:
Value Added Per Person
OUTPUT VALUE – INPUT VALUE
UNIT: £s per person
NUMBER OF EMPLOYEES
VALUE ADDED PER PERSON =
“The Industry Forum project demonstrated top level commitment toworld class manufacturing within the company. The right people werereleased from their day-to-day activities and shown how to focus onroot causes of our problems and implement permanent fixes.”
Lander Automotive specialises in the design and manufacture ofseating mechanisms and tubular products for the automotive industry.
The machines used for manufacturing structural tubular components were spread around a
machine shop, causing a wasteful production flow. There was too much inventory and
transportation of parts because of batch production techniques operated at these machines.
Stillages were used to store and transport parts between processes, and overtime was needed
to satisfy demand in this area.
Three or four operators ran the process on a three-shift pattern. After assessing the process,
the team identified a number of ways to lessen waste that would improve the Value Added
Per Person measure.
An Industry Forum MasterClass team was created to address structural tube production.
Firstly, it carried out a 5C activity: clear out, configure, clean and check, conformity, custom and
practice. This ensured the work area was clear of unnecessary items and organised more
effectively.
Secondly, the cycle times for a tube at each process were measured, and the degree of
imbalance between the processes calculated. The team then conducted a comprehensive waste
elimination activity. Where possible, jobs were combined to use operator waiting time during
automatic machine cycles. This released one operator to do other work. An ideal balance was
then designed by the team to distribute the work evenly among the remaining operators.
This identified further operator capacity, which allowed inspection and packing to be added to
the end of the new cell.
Using the new balance a cell was designed to bring processes closer together allowing single
piece flow. This was essential to eliminate transport and double handling waste identified in
the process. The team used full sized cardboard templates, carried out process simulations
and involved other plant operators throughout. They proved that the new combined jobs
would be effective before any machines were moved.
• VAPP increase by 118% by the end of the three month programme.
• Work in progress reduced by 95%.
• Throughput time reduced by 93%.
• Lead-time reduced by 24%.
• Floor space reduced by 28%.
• Walking distance reduced by 25%.
• The need for a pump truck was eliminated. Parts are now passed between processes in the
cell using gravity conveyors.
• Operators now stand at their machines rather than sit. Although unpopular at first,
operators commented that they found this more comfortable when reviewed at the end of
the programme.
Company: Lander Automotive Ltd
Location: Birmingham
Size of firm: 500
Website: www.lander.co.uk
14
15
MEASURE 7:
Floor Space Utilisation
WHAT IS IT?
Floor Space Utilisation (FSU) is a measure of the sales revenue generated persquare metre of factory floor space.
WHAT IS IT USED FOR?
This measure relates the value of the factory space to the generation of sales,and demonstrates how effective use of space can reduce the fixed cost elementof the unit.
MEASURING FSU
The FSU measure can be applied at cell level or across the whole manufacturingsite for internal benchmarking. High fixed costs, such as factory space, are notusually desirable and capital decisions that require expanded buildings can beexpensive. So there is generally a strong desire to minimise the use of spacetaken up by the manufacturing process.
In order to achieve an increased FSU value the floor space has to be reduced.This often means rethinking a process layout and eliminating inventory toreduce the necessary space to the minimum.
SALES TURNOVER OF MODEL AREA
UNIT: £ per m2
SQUARE METRES OF MODEL AREA
FLOOR SPACEUTILISATION =
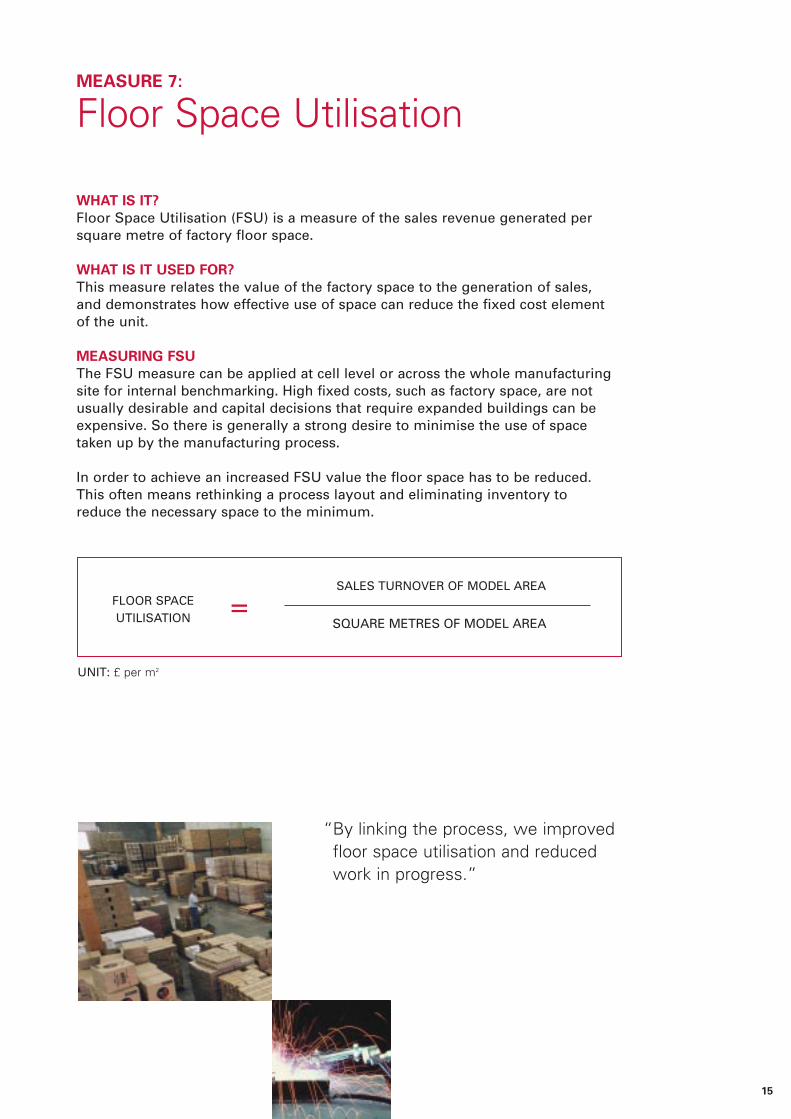
“By linking the process, we improvedfloor space utilisation and reducedwork in progress.”
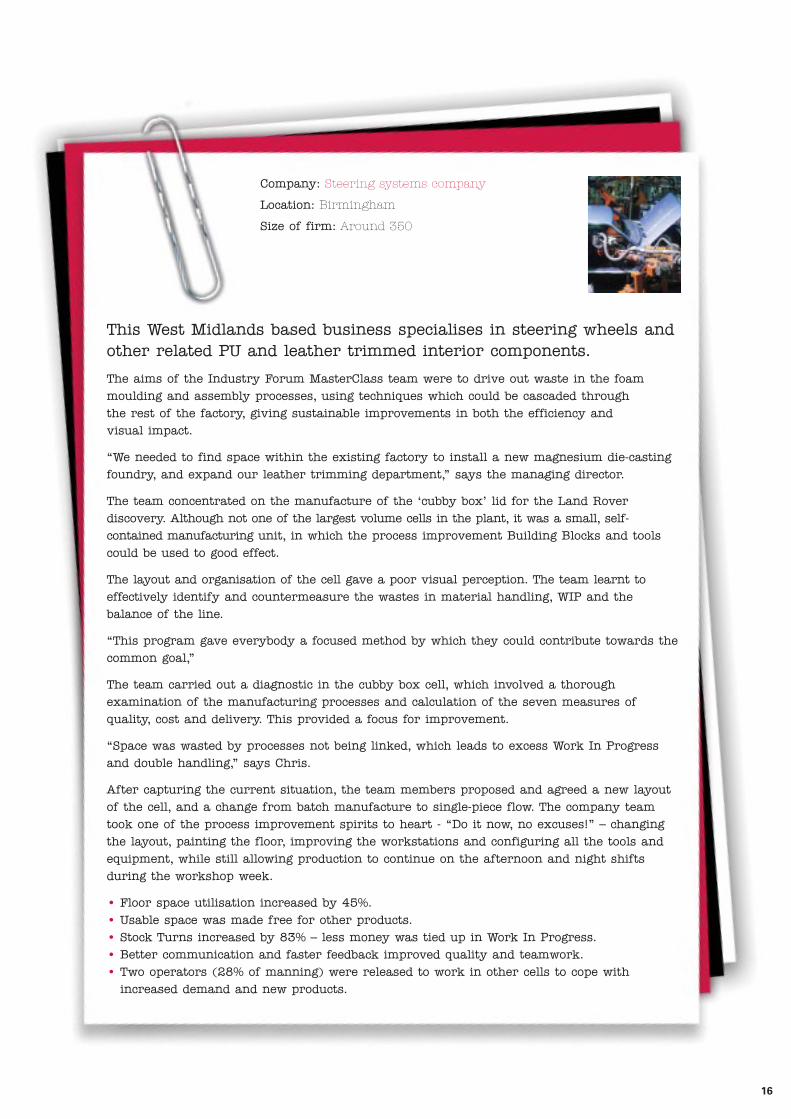
This West Midlands based business specialises in steering wheels andother related PU and leather trimmed interior components.
The aims of the Industry Forum MasterClass team were to drive out waste in the foam
moulding and assembly processes, using techniques which could be cascaded through
the rest of the factory, giving sustainable improvements in both the efficiency and
visual impact.
“We needed to find space within the existing factory to install a new magnesium die-casting
foundry, and expand our leather trimming department,” says the managing director.
The team concentrated on the manufacture of the ‘cubby box’ lid for the Land Rover
discovery. Although not one of the largest volume cells in the plant, it was a small, self-
contained manufacturing unit, in which the process improvement Building Blocks and tools
could be used to good effect.
The layout and organisation of the cell gave a poor visual perception. The team learnt to
effectively identify and countermeasure the wastes in material handling, WIP and the
balance of the line.
“This program gave everybody a focused method by which they could contribute towards the
common goal,”
The team carried out a diagnostic in the cubby box cell, which involved a thorough
examination of the manufacturing processes and calculation of the seven measures of
quality, cost and delivery. This provided a focus for improvement.
“Space was wasted by processes not being linked, which leads to excess Work In Progress
and double handling,” says Chris.
After capturing the current situation, the team members proposed and agreed a new layout
of the cell, and a change from batch manufacture to single-piece flow. The company team
took one of the process improvement spirits to heart - “Do it now, no excuses!” – changing
the layout, painting the floor, improving the workstations and configuring all the tools and
equipment, while still allowing production to continue on the afternoon and night shifts
during the workshop week.
• Floor space utilisation increased by 45%.
• Usable space was made free for other products.
• Stock Turns increased by 83% – less money was tied up in Work In Progress.
• Better communication and faster feedback improved quality and teamwork.
• Two operators (28% of manning) were released to work in other cells to cope with
increased demand and new products.
Company: Steering systems company
Location: Birmingham
Size of firm: Around 350
16
17
Further help and advice
Achieving best practice in your business is a key theme within DTI’sapproach to business support, providing ideas and insights into how toimprove performance across your business. By showing what works inother businesses, we can help you see which approaches can help you,and then support you in implementation.
ACHIEVING BEST PRACTICE IN YOUR BUSINESS
To access free information and publications on best practice:• visit our website at www.dti.gov.uk/bestpractice
• call the DTI Publications Orderline on 0870 150 2500 or visitwww.dti.gov.uk/publications
SUPPORT TO IMPLEMENT BEST BUSINESS PRACTICE
To get help bringing best practice to your business, contact Business Link– the national business advice service. Backed by the DTI, Business Linkis an easy-to-use business support and information service, which canput you in touch with one of its network of experienced businessadvisers.• Visit the Business Link website at www.businesslink.gov.uk
• Call Business Link on 0845 600 9 006.
SMMT INDUSTRY FORUM
Industry Forum has developed a common approach to ProcessImprovement, based around its products of MasterClass, Supply ChainGroup, Team Leader Training and Value Stream Mapping. These arestructured programmes, with teams drawn from all disciplines and levelswithin the host companies, working and learning together under theguidance of expert Industry Forum engineers to undertake and sustainprocess improvement on the shop floor.
The Industry Forum was established by the automotive industry to driveand support the achievement of sustainable world-leadingcompetitiveness in the UK based vehicle and components industry. Itaims to achieve this through practical shop-floor improvements formember companies, concentrating on manufacturing process to delivertangible results. DTI provides support towards its activities.
Businesses supplying the automotive sector can obtain furtherinformation about the SMMT Industry Forum and its companyimprovement programmes by contacting:
SMMT Industry ForumTel: 0121 717 6600 Fax: 0121 717 6699E-mail: [email protected] Web: www.industryforum.co.uk
18
INDUSTRY FORUMS
Contact your own industry forum and find out if thesemeasures are being used, or could be used, in your sector.
Best Practice Forum (Tourism, Hospitality and Leisure)Hospitality and Leisure ManpowerTel: 020 8977 4419Fax: 020 8977 5519E-mail: [email protected]: www.bestpracticeforum.org
Ceramic Industry ForumTel: 01782 415 210Fax: 01782 745 771E-mail: [email protected]: www.ceramicindustryforum.co.uk
Cereals Industry Forum Tel: 020 7520 3997 Fax: 020 7520 3918Website: www.hgca.com/cif
Constructing ExcellenceTel: 0845 605 5556Fax: 01923 664 690E-mail: [email protected]: www.constructingexcellence.org.uk
Construction Equipment AssociationTel: 01883 334 499Fax: 01883 334 490E-mail: [email protected]: www.coneq.org.uk
LOGIC (Leading Oil and Gas Industry Competitiveness)Tel: 01224 853 420Fax: 01224 853 429E-mail: [email protected]: www.logic-oil.com
MICE (Metals Industry Competitiveness Enterprise)Tel: 0114 244 6833Fax: 0114 256 2855E-mail: [email protected]: www.metalsindustry.co.uk
19
PICME (Purpose Industries for Manufacturing Excellence)Tel: 01642 430021Fax: 01642 430025E-mail: [email protected]: www.picme.org
RMIF (Red Meat Industry Forum)Tel: 01908 844 710Fax: 01908 844 302E-mail: [email protected]: www.redmeatindustryforum.org.uk/forum
Shipbuilders & Shiprepairers AssociationTel: 01784 223 770Fax: 01784 223 775E-mail: [email protected]: www.ssa.org.uk
Industry Forum (Textile and Clothing)Tel: 020 7636 7788Fax: 020 7636 4418E-mail: [email protected]: www.industryforum.net
UK Lean Aerospace InitiativeTel: 07887 562 833Fax: 020 7227 1025E-mail: [email protected]: www.sbac.co.uk
GENERAL BUSINESS ADVICE
You can also get a range of generalbusiness advice from the followingorganisations:
England
• Call Business Link on 0845 600 9 006
• Visit the website atwww.businesslink.gov.uk
Scotland
• Call Business Gateway on 0845 609 6611
• Visit the website at www.bgateway.com
Wales
• Call Business Eye/Llygad Busnes on 08457 96 97 98
• Visit the website atwww.businesseye.org.uk
Northern Ireland
• Call Invest Northern Ireland on 028 9023 9090
• Visit the website at www.investni.com
Examples of products and companiesincluded in this leaflet do not in any wayimply endorsement or recommendation byDTI. Bear in mind that prices quoted areindicative at the time it was published.
Published by the Department of Trade and Industry. www.dti.gov.uk © Crown Copyright. URN 04/814; 04/04