Embed Size (px)
Citation preview
Suburban Forest Change and Vegetation Water Dynamicsin Atlanta, USA
Mario A. Giraldo, Paula Jackson, Wayne Van-Horne
Southeastern Geographer, Volume 55, Number 2, Summer 2015, pp.193-212 (Article)
Published by The University of North Carolina PressDOI: 10.1353/sgo.2015.0016
For additional information about this article
Access provided by Calif State Univ @ Northridge (5 Oct 2015 23:23 GMT)
http://muse.jhu.edu/journals/sgo/summary/v055/55.2.giraldo.html
southeastern geogr apher, 55(2) 2015: pp. 193–213
tanto, debe considerarse al evaluar el efecto del
cambio de la cubierta de tierra en el ciclo de agua
de las zonas suburbanas. En un típico fragmento
de bosque mixto se encontró una diversa cubierta
forestal con una rica composición de especies de
árboles caducifolios y perennes. Los resultados
muestran una relación de más de 2:1 del flujo de
agua para los árboles caducifolios (Liquidam-
bar styraciflua L.) que para las especies de pinos
perennes (Pinus taeda L.) bajo diferentes niveles
de humedad del suelo. El análisis del cambio de
la cubierta de tierra en la cuenca baja Etowah y
cinco condados del noroeste de Atlanta entre 1992
y 2007 indica una pérdida de cubierta forestal, un
desajuste dentro de las áreas forestales, cambios
de bosque perenne a bosque mixto y un proceso lo-
calizado de transición de bosque a urbanización.
En general, esta investigación sugiere que el ciclo
del agua en el norte de Atlanta puede verse afec-
tado por la disminución de la cubierta forestal y
por los cambios en la composición de especies del
fragmento forestal hacia un bosque mixto.
key words: land cover change, Atlanta, forest
fragments, urban, hydrology
palabras clave: cambio de cubierta de
tierra, Atlanta, fragmentos forestales, urbano,
hidrología
In the suburban area of northwestern Atlanta, this
project tests the hypothesis that tree species com-
position affects the hydrological response of forest
patches and therefore should be considered when
assessing the effect of land cover change in the water
cycle of suburban areas. In a typical mixed forest
fragment a diverse canopy with a rich tree species
composition of several deciduous and evergreen
tree species was found. The results show a relation-
ship of more than 2:1 water flow under different
soil moisture levels, for the broadleaf deciduous
(Liquidambar styraciflua L.) compared to the ev-
ergreen pine tree species (Pinus taeda L.). The land
cover change analysis for the lower Etowah wa-
tershed and five counties of northwestern Atlanta
from 1992 to 2007 indicates forest cover loss, dis-
turbance within the forest areas, changes from ev-
ergreen forest into mixed forest, and localized pro-
cess of transition from forest towards urbanization.
Overall, this research suggests that the water cycle
in northern Atlanta may be affected by forest cover
decrease, and by changes in the species composition
of the forest fragment towards mixed forest.
En el área suburbana del noroeste de Atlanta, este
proyecto pone a prueba la hipótesis de que la com-
posición de especies arbóreas afecta la respuesta
hidrológica de los parches forestales y por lo
Suburban Forest Change and Vegetation Water dynamics in Atlanta, uSA
MARIO A. GIRALdOCalifornia State University Northridge
PAuLA JACKSONKennesaw State University
WAYNE VAN-HORNEKennesaw State University
194 gir aldo et al.
introduction
Cities create a state of disequilibrium in the landscape; they generate a local gra-dient of disturbance and are considered one of the most homogenizing human ac-tivities in the physical environment (Mck-inney 2006). Urban growth is expected to affect the dynamics of local ecosystems by modifying the hydrogeology of the landscape, introducing nonnative species, altering nutrient cycle, changing local at-mospheric conditions and affecting forest health (Zipperer 2002; Wear and Greis 2010). At the regional scale, urban infra-structure creates a complex mosaic of land uses where high spatial and temporal vari-ation of hydrological processes is expected to occur. In comparison with other land uses, forested areas provide quantity and quality of fresh water for human consump-tion and as such are becoming critical re-sources for a city’s long-term sustainabil-ity (Neary et al. 2009). As urban growth continues, remaining forest fragments, especially those located at the headwaters and in riparian zones become refugees of native animal and plant species (Barrett and Guyer 2008; Burton et al. 2009), and hence are considered priority areas for conservation for the city and the region (Dawson 1995).
In the southeastern U.S.A., climate and vegetation are considered to play a larger role in the water budget with a strong effect of forest cover on regional evapo-transpiration (Lu et al. 2003). Decreases in the forest cover are found to increase water yield with a large spatial variation, where changes from forest to urban areas will produce the highest impact in a region particularly those with high precipitation (Sun et al. 2005).
Historically, during the late nineteenth century, colonization of north Georgia transformed the landscape and its forest cover into agriculture and livestock areas (Turner and Ruscher 1988). As agricul-ture and extensive cattle ranching moved west, processes of forest regeneration took place in the early 20th century interrupted only by the growth of the Atlanta metro-politan area in the last thirty years (Turner and Ruscher 1988). In fact, the period be-tween 1979 and 1997 the city of Atlanta’s impermeable surfaces increased substan-tially. This increase was predominantly in industrial, commercial, and small res-idential complexes that substituted the previous forest cover for a mosaic of forest fragments (Gilliesa et al. 2003).
Within forest fragments, differences in tree species diversity, and dominant tree species may affect the physical and ecological process to which the forest con-tributes. Landscape fragments are spatial units in which biophysical factors interact (Hay et al. 2002; Nagendra et al. 2004). Within landscape fragments, hydrological process presents a behavior that is signif-icantly different from the adjacent ones under different conditions of soil type, land use, or both (Giraldo et al. 2009). Changes in the tree species composition of a forest may affect the water dynamics since individual species have a dominant role in processes such as evapotranspira-tion, interception, or infiltration within the forest (Ford and Vose 2007). This is considered a potential source of error in predictive models that assume tree cover to have a homogeneous behavior regard-less of tree species composition within study areas (Zhang et al. 2001).
Research has been conducted on the contributions of forest resources and
Forest Change and Water Dynamics 195
fragments to the hydrological cycle in the southeastern United States. However, little research has been done in studying the fragmented landscape of suburban Atlanta resulting from urban sprawl and the water dynamics within forest fragments (Burton et al. 2009). Studying the environmental processes at the fragment level becomes a first step in analyzing the spatial variation caused by the city at the regional level and its effects on the water cycle.
Satellite data is considered an efficient way to produce a regional ecosystem as-sessment, to provide information regarding land cover patterns and environmentally impacted areas, and to verify the context of environmental stress over broad scales as a cost efficient means to monitor ecosystem health (Styers et al. 2009). This research produces a land cover and vegetation change analysis, quantifying forest change from 1992 to 2007 in five counties of North-western Atlanta and the lower Etowah wa-tershed using satellite data; it produces a botanical description of dominant tree spe-cies composition within typical forest frag-ments; and it quantifies water dynamics in two dominant tree species as an indicator of water dynamics for the study area. The project hypothesized that there are differ-ences in the hydrological response of indi-vidual tree species within forest fragments in suburban Atlanta, and that these differ-ences will affect at the landscape scale the role that forest cover change has in the hy-drological cycle under scenarios of rapid urban growth in Northern Atlanta.
methods
This research includes the assessment of land cover change and the spatial analysis of forest change using Landsat
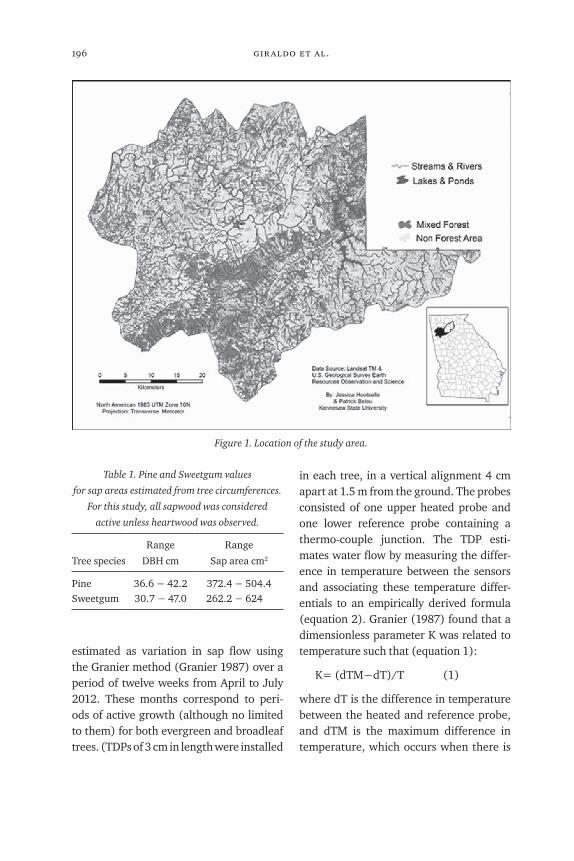
satellite imagery and geographic informa-tion systems in north western Atlanta, a field survey to assess species composition of typical forest fragments and two dom-inant tree species, and the assessment of variation in the soil/water relationships in dominant trees using sap flow, soil mois-ture and weather data. At the local scale the study area includes a forest fragment located in a suburban area northwest of Atlanta, U.S.A. At the regional scale the study includes the Little Etowah Water-shed (LEW) and the counties of Bartow, Cobb, Floyd, Paulding and Polk (Figure 1).
Hydro-climatic assessment on local vegetationA forest fragment located five kilome-
ters east of the city of Kennesaw, Georgia, was selected to evaluate sap flow differ-ences among two dominant tree species. Evapotranspiration and soil moisture were estimated from a 25-year-old sub-urban forest naturally regenerated from a previously grassy area. The forest frag-ment was surveyed and six trees from two species, Pinus taeda L. (commonly known as loblolly pine) and Liquidambar styraci-flua L. (a broadleaf commonly known as Sweetgum; Table 1) of similar age and di-ameter were chosen to measure sap flow, and to estimate evapotranspiration during a 12 week period in late spring 2012. Both tree species are considered dominant in the canopies in successional forests of the southeastern U.S. (Ford et al. 2005; Stoy et al. 2006).
Thermal dissipation probes (TDP), a data Logger (Dynamax Probe12 Sap Flow instrument) powered by a battery and a solar panel were used to collect data from trees located inside the forest fragment. Water consumption by plant species was
196 gir aldo et al.
Figure 1. Location of the study area.
Table 1. Pine and Sweetgum values
for sap areas estimated from tree circumferences.
For this study, all sapwood was considered
active unless heartwood was observed.
Tree species
Range
DBH cm
Range
Sap area cm2
Pine 36.6 − 42.2 372.4 − 504.4Sweetgum 30.7 − 47.0 262.2 − 624
estimated as variation in sap flow using the Granier method (Granier 1987) over a period of twelve weeks from April to July 2012. These months correspond to peri-ods of active growth (although no limited to them) for both evergreen and broadleaf trees. (TDPs of 3 cm in length were installed
in each tree, in a vertical alignment 4 cm apart at 1.5 m from the ground. The probes consisted of one upper heated probe and one lower reference probe containing a thermo-couple junction. The TDP esti-mates water flow by measuring the differ-ence in temperature between the sensors and associating these temperature differ-entials to an empirically derived formula (equation 2). Granier (1987) found that a dimensionless parameter K was related to temperature such that (equation 1):
K= (dTM−dT)/T (1)
where dT is the difference in temperature between the heated and reference probe, and dTM is the maximum difference in temperature, which occurs when there is
Forest Change and Water Dynamics 197
no sap flow. Sap flow velocity is related to K in that
V = 0.0119 x K 1.231 (cm/s) (2)
Knowing the sapwood area, velocity (v) is then transformed to sap flow rate as:
F = A x V 3600 (s/h) (cm3/h) (3)
where F is flow rate, A is the sap wood cross-sectional area.
Probe installation included shaving the bark from the trees at breast height on the north side of each tree, drilling the tree and inserting the probes entirely into the xylem. The probes were protected with a foam block and reflective insulation bub-ble wrap. The reflective wrap protects the sensor from the elements and prevents radiation from influencing temperature of the probes. Sap flow values for each tree type were summarized and averaged by tree type and expressed in g/hr.
Linking soil moisture with sap flows has been shown to provide information regarding the ecological role of tree spe-cies within the ecosystem (Kume et al. 2007). Continuous soil moisture data was collected using a DeltaT Soil Moisture Probe that works under the principle of Time Domain Reflectometry (TDR) (Ford et al. 2005). A soil moisture sensor was pre- calibrated for the soil conditions of the study site. A weather station located in situ and the edge of the forest fragment was used to continuously record precipi-tation, relative humidity, wind speed, and air temperature. Also, similar weather records from a weather station operated by the National Weather Service near Kennesaw, 5 km away from the research site, were used to check the accuracy of our own data. Statistical analyses of sap flow differences were performed establishing
tree type behavior and comparisons be-tween the two types of trees at days with minimum and higher soil moisture values (Ford et al. 2005). Soil moisture change rates were calculated to estimate resi-dence time of moisture in the upper layer of the soil. Finally, comparisons between sap flow and weather variables such as evapotranspiration and air pressure were established for selected days
Composition of forest fragmentsIn the early 20th century, Georgia went
through a process of natural reforestation of the landscape that was interrupted by the growth of the city of Atlanta. In order to assess the tree composition of typical natural forest fragments in northwestern Atlanta, a site was selected that is believed to have been undisturbed for the last 50 years. At this site a vegetation survey was conducted to serve as indicator of the composition of typical forest fragments. The survey was conducted in a 20 ha for-est fragment located 6 km north of the city of White, Georgia (Bartow County). Tree species composition was assessed over three 50 m long transects across the property. From the forest fragment sur-vey dominant tree species were identified and the relationships between deciduous and evergreen trees within the fragment was established. The results of this survey were used to select dominant tree species that serve as indicators of variation in tree species function in the ecosystem.
Land cover change satellite data analysisFor the assessment of land use change
between 1992 and 2007, two sets of Landsat Thematic Mapper (TM) satellite
198 gir aldo et al.
data path 19 and rows 36 and 37 were used. The datasets were in the Universal Transverse Mercator projection, zone 16, and datum and spheroid WGS 84. Land-sat multispectral bands 1 to 5 with 30 m spatial resolution were obtained from the United States Geological Survey data center, geometrically and radiometrically corrected and stacked in a single mul-tispectral file. After stacking the bands, the scenes (rows 36 and 37) were used to generate a mosaic of a single multispec-tral file for each year (Jensen 2005). The mosaic process used a seamless line to ac-count for small color balancing differences in the scenes of an overlapping area. Anni-versary cloud free data was not available for the study area. Therefore, the analysis used data that shared similar phenological leaf-off characteristics (Jensen 2005). For the 1992 data late fall November scenes were selected while for the 2007 data early spring, May data sets were used. The May dataset was visually and spectrally in-spected to make sure it corresponded to a leaf off period. Shape files of the Georgia counties of Bartow, Cobb, Floyd, Paulding, and Polk, as well as for the lower Etowah watershed were used as areas of interest to clip and subset the Landsat scenes. The resulting six study areas were individually classified using a supervised classification approach with 24 classes, recoded to the 6 final classes: Evergreen forest, mixed for-est, other vegetation, no vegetation, and water. For the classification approach, at least 10 signatures were collected for each of the six classes and the final file, classi-fied using a maximum likelihood paramet-ric rule. After classification, several visual and quantitative accuracy assessment analyses were performed to identify prob-lematic areas from which new signatures
were collected. Accuracy assessment used 10 pixels for each of the five summary classes in the dataset. The classification process was considered satisfactory when the study area showed higher than 90 percent accuracy for all classes (Jensen 2005). After classification, change ma-trixes from 1992 to 2007 were produced for each of the six sub set areas estimating total values and percentage of change for each class in each sub set area. Change matrixes are summarized in Table 5.
results
Forest fragment surveyTwo similar types of forest were identi-
fied in this research. For the assessment of plant composition and diversity, the forest fragment surveyed in this research was classified as Allegheny-Cumberland Dry Oak Forest and Woodland, equivalent to a typical Eastern Forest, Oak-Pine Forest Ac-cording to the USGS Forest Cover Types: National Atlas of the United States (USDA Forest Service and USGS). The results of the survey are listed in table 2.
The forest fragment instrumented for the hydroecological analysis was classified as Southern Appalachian Low-elevation Pine Forest. Summary information for this type of forest is reported in the national atlas of North America for the Bailey’s ecological region as Southern Ridge and Valley/Cumberland Dry Calcareous For-est. This forest ecosystem includes dry to dry-mesic calcareous forests of the South-ern Ridge and Valley region of Alabama and Georgia, extending north into Tennes-see, Kentucky, Virginia, and adjacent West Virginia. It includes calcareous forests on lower escarpments of the Cumberland Plateau and other related areas. Examples
Forest Change and Water Dynamics 199
Table 2. List of tree species found in a field survey of an undisturbed forest area.
Genus / Species Common Name Plot A Plot B Plot C Total
Acer leucoderme vel aff. Chalk Maple 10 1 11
Acer rubrum Red Maple 1 1 21 23
Carpinus caroliniana Ironwood 2 2
Carya spp. Hickory 23 14 16 53
Celtis sp. Hackberry 4 4
Cornus florida Flowering Dogwood 11 30 51 92
Juniperus virginiana Eastern Red Cedar 20 9 29
Liquidamber styraciflua Sweetgum 16 16
Liriodendron tulipifera Tuliptree 1 1
Nyssa sylvatica Blackgum 5 3 13 21
Ostrya virginiana Eastern Hophornbeam 9 9
Pinus virginiana Virginia Pine 4 10 14
Prunus serotina Black Cherry 8 3 3 14
Quercus spp. Oak 17 7 29 53
Ulmus alata Winged Elm 2 4 6Total 114 69 165 348
occur on a variety of different landscape positions and occur on generally deeper soils than glade systems of the same re-gions. For both forest fragments, Pinus taeda L. commonly known as loblolly Pine and Liquidambar styraciflua L. commonly known as Sweetgum are considered dom-inant of the canopies in southeastern U.S. in successional forest (Stoy et al. 2006).
The United States Department of Agri-culture Web Soil Service (2014) lists the soil properties of the area of Madison as clay loam, 6 to 10 percent slopes, severely eroded, well drained with more than 2 m depth, moderate water capacity (20 cm), moderate to high (1.5 to 5 cm/hr) water infiltration with a clay loam upper layer, followed by clay and sandy clay layers. These properties suggest a good drainage under wet conditions and poor water re-tention during dry conditions that may
affect plant species distribution if either of these events occurs for extended periods of time.
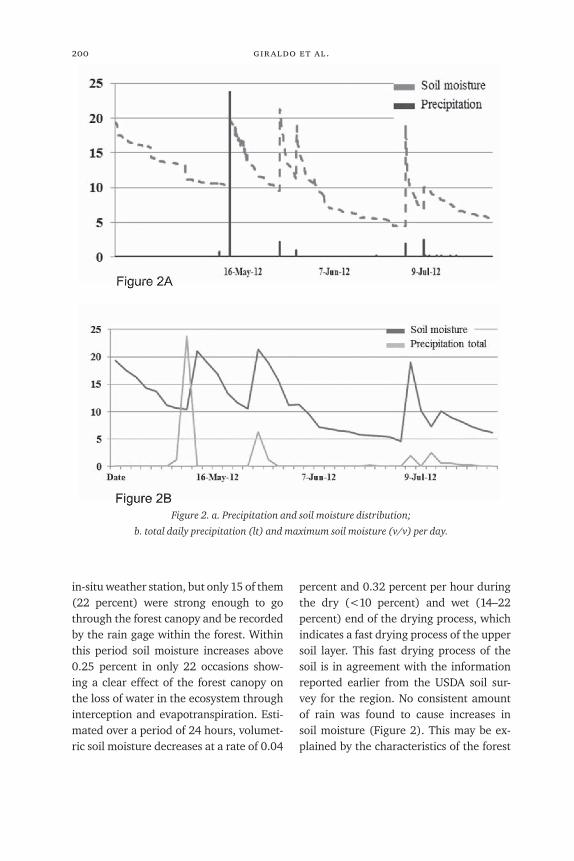
Soil moistureThe graph of precipitation and soil
moisture shows agreement between the precipitation and soil moisture increases, with an increase in soil moisture values at 10 cm depth almost immediately when a strong rain event occurred (Figure 2a). In a similar way, the figure of cumulative pre-cipitation reaching the forest ground and maximum soil moisture per day ( Figure 2b) shows agreement between the timing of the events. Despite the agreement between precipitation and soil moisture, only few rain events produced changes in surface soil moisture. In fact, in the period between May 15th and July 22nd, 67 episodes of rain larger than 0.5mm were recorded by the
200 gir aldo et al.
Figure 2. a. Precipitation and soil moisture distribution;
b. total daily precipitation (lt) and maximum soil moisture (v/v) per day.
in-situ weather station, but only 15 of them (22 percent) were strong enough to go through the forest canopy and be recorded by the rain gage within the forest. Within this period soil moisture increases above 0.25 percent in only 22 occasions show-ing a clear effect of the forest canopy on the loss of water in the ecosystem through interception and evapotranspiration. Esti-mated over a period of 24 hours, volumet-ric soil moisture decreases at a rate of 0.04
percent and 0.32 percent per hour during the dry (<10 percent) and wet (14–22 percent) end of the drying process, which indicates a fast drying process of the upper soil layer. This fast drying process of the soil is in agreement with the information reported earlier from the USDA soil sur-vey for the region. No consistent amount of rain was found to cause increases in soil moisture (Figure 2). This may be ex-plained by the characteristics of the forest
Forest Change and Water Dynamics 201
structure, the topographic variation of the terrain, the heterogeneous nature of the forest understory, forest floor disturbance and by the different levels of soil moisture conditions when the rain occurs. A more detailed analysis of infiltration and soil moisture distribution throughout the soil profile may be required to establish such a relationship (Giraldo et al. 2009a; Miller et al. 2007).
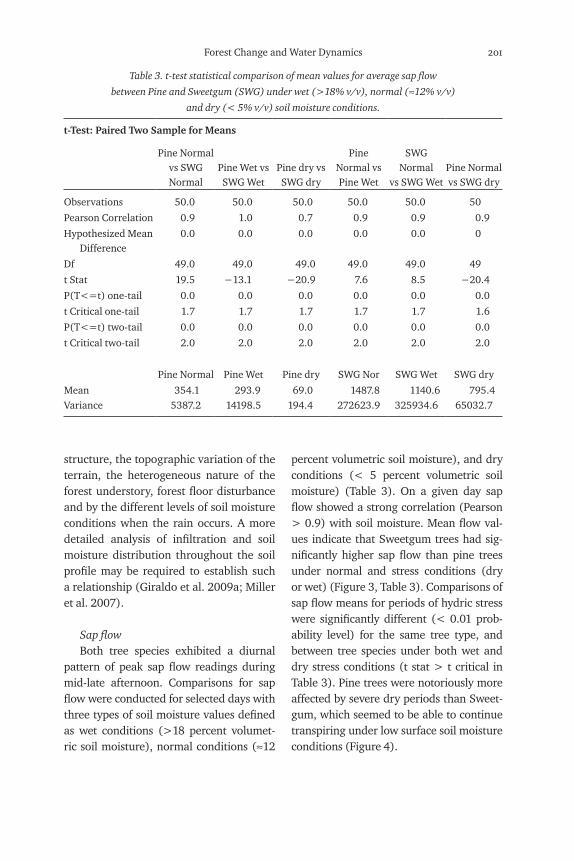
Sap flowBoth tree species exhibited a diurnal
pattern of peak sap flow readings during mid-late afternoon. Comparisons for sap flow were conducted for selected days with three types of soil moisture values defined as wet conditions (>18 percent volumet-ric soil moisture), normal conditions (≈12
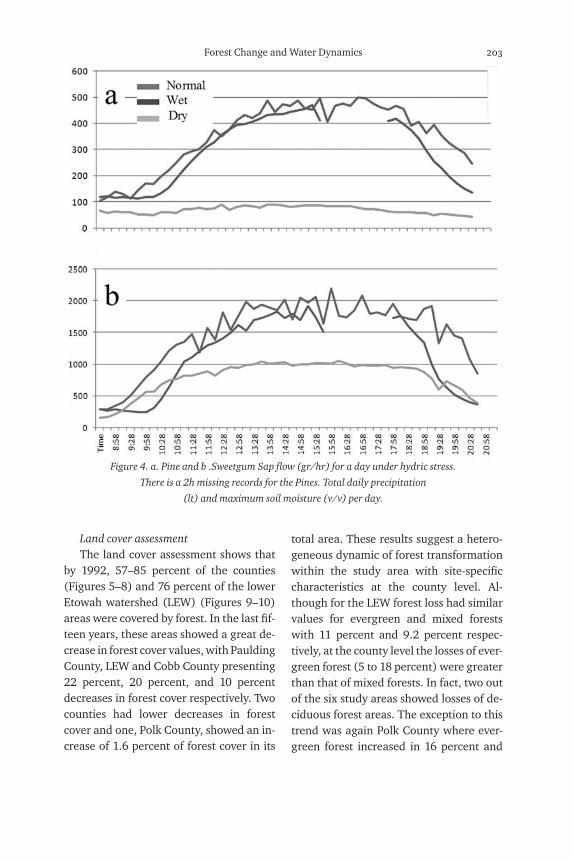
percent volumetric soil moisture), and dry conditions (< 5 percent volumetric soil moisture) (Table 3). On a given day sap flow showed a strong correlation (Pearson > 0.9) with soil moisture. Mean flow val-ues indicate that Sweetgum trees had sig-nificantly higher sap flow than pine trees under normal and stress conditions (dry or wet) (Figure 3, Table 3). Comparisons of sap flow means for periods of hydric stress were significantly different (< 0.01 prob-ability level) for the same tree type, and between tree species under both wet and dry stress conditions (t stat > t critical in Table 3). Pine trees were notoriously more affected by severe dry periods than Sweet-gum, which seemed to be able to continue transpiring under low surface soil moisture conditions (Figure 4).
Table 3. t-test statistical comparison of mean values for average sap flow
between Pine and Sweetgum (SWG) under wet (>18% v/v), normal (≈12% v/v)
and dry (< 5% v/v) soil moisture conditions.
t-Test: Paired Two Sample for Means
Pine Normal vs SWG Normal
Pine Wet vs SWG Wet
Pine dry vs SWG dry
Pine Normal vs Pine Wet
SWG Normal
vs SWG WetPine Normal vs SWG dry
Observations 50.0 50.0 50.0 50.0 50.0 50
Pearson Correlation 0.9 1.0 0.7 0.9 0.9 0.9
Hypothesized Mean Difference
0.0 0.0 0.0 0.0 0.0 0
Df 49.0 49.0 49.0 49.0 49.0 49
t Stat 19.5 −13.1 −20.9 7.6 8.5 −20.4
P(T<=t) one-tail 0.0 0.0 0.0 0.0 0.0 0.0
t Critical one-tail 1.7 1.7 1.7 1.7 1.7 1.6
P(T<=t) two-tail 0.0 0.0 0.0 0.0 0.0 0.0
t Critical two-tail 2.0 2.0 2.0 2.0 2.0 2.0
Pine Normal Pine Wet Pine dry SWG Nor SWG Wet SWG dry
Mean 354.1 293.9 69.0 1487.8 1140.6 795.4Variance 5387.2 14198.5 194.4 272623.9 325934.6 65032.7
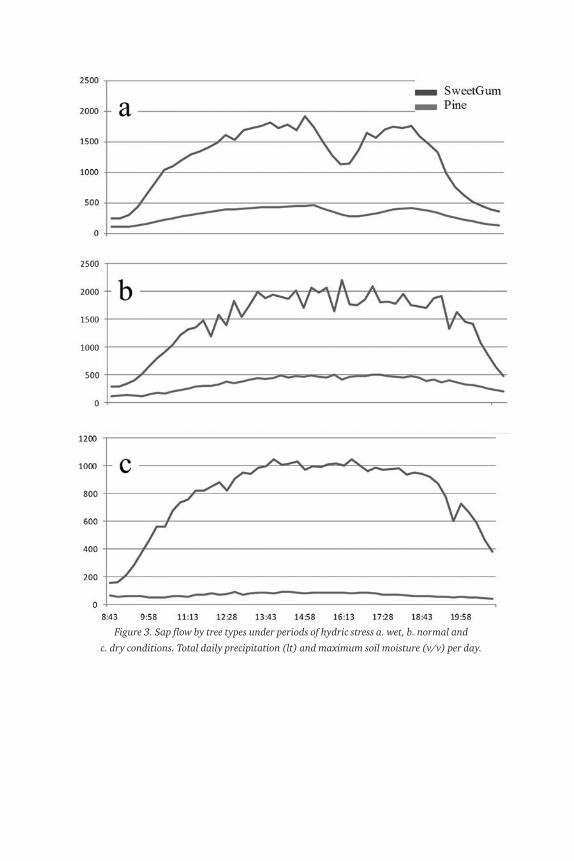
Figure 3. Sap flow by tree types under periods of hydric stress a. wet, b. normal and
c. dry conditions. Total daily precipitation (lt) and maximum soil moisture (v/v) per day.
Forest Change and Water Dynamics 203
Figure 4. a. Pine and b .Sweetgum Sap flow (gr/hr) for a day under hydric stress.
There is a 2h missing records for the Pines. Total daily precipitation
(lt) and maximum soil moisture (v/v) per day.
Land cover assessmentThe land cover assessment shows that
by 1992, 57–85 percent of the counties (Figures 5–8) and 76 percent of the lower Etowah watershed (LEW) (Figures 9–10) areas were covered by forest. In the last fif-teen years, these areas showed a great de-crease in forest cover values, with Paulding County, LEW and Cobb County presenting 22 percent, 20 percent, and 10 percent decreases in forest cover respectively. Two counties had lower decreases in forest cover and one, Polk County, showed an in-crease of 1.6 percent of forest cover in its
total area. These results suggest a hetero-geneous dynamic of forest transformation within the study area with site-specific characteristics at the county level. Al-though for the LEW forest loss had similar values for evergreen and mixed forests with 11 percent and 9.2 percent respec-tively, at the county level the losses of ever-green forest (5 to 18 percent) were greater than that of mixed forests. In fact, two out of the six study areas showed losses of de-ciduous forest areas. The exception to this trend was again Polk County where ever-green forest increased in 16 percent and
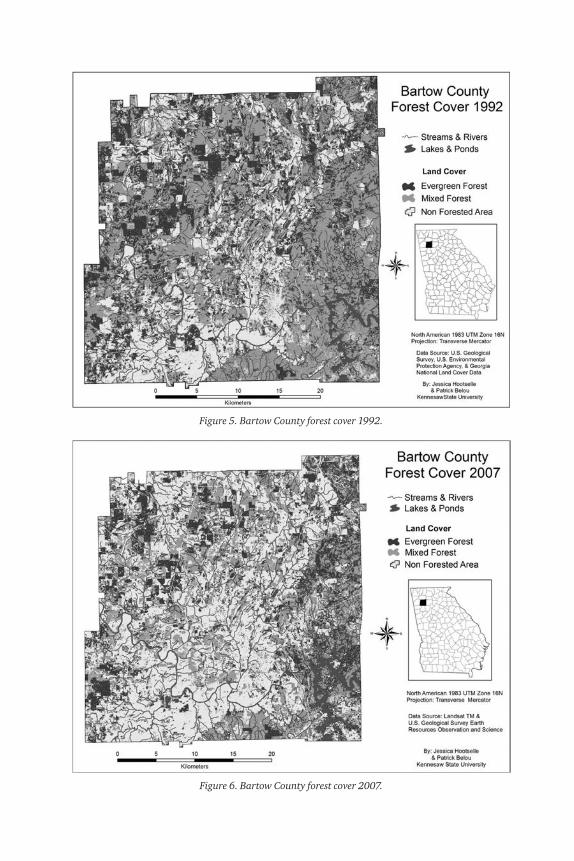
Figure 5. Bartow County forest cover 1992.
Figure 6. Bartow County forest cover 2007.
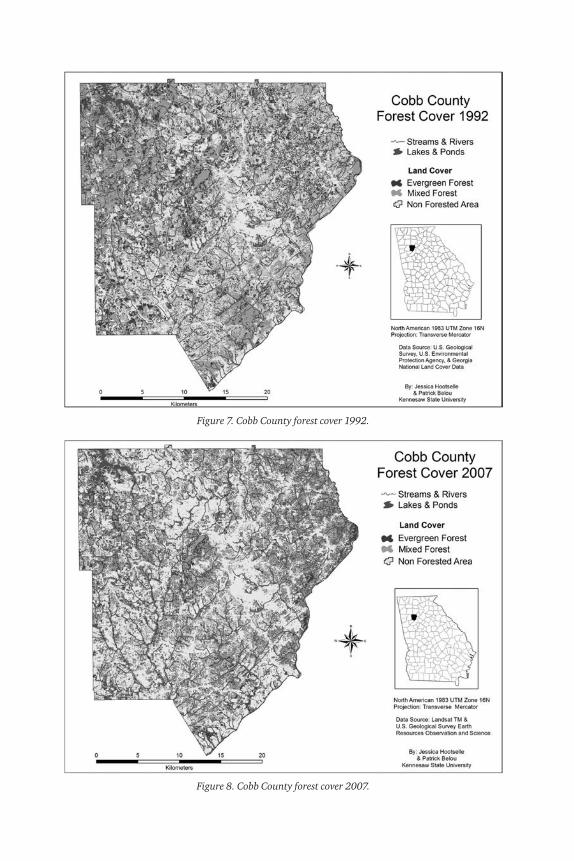
Figure 7. Cobb County forest cover 1992.
Figure 8. Cobb County forest cover 2007.
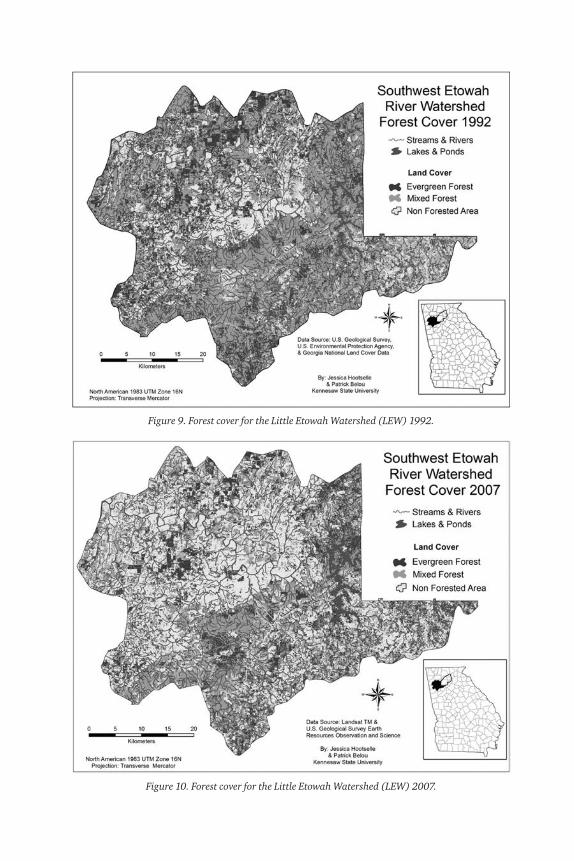
Figure 9. Forest cover for the Little Etowah Watershed (LEW) 1992.
Figure 10. Forest cover for the Little Etowah Watershed (LEW) 2007.
Forest Change and Water Dynamics 207
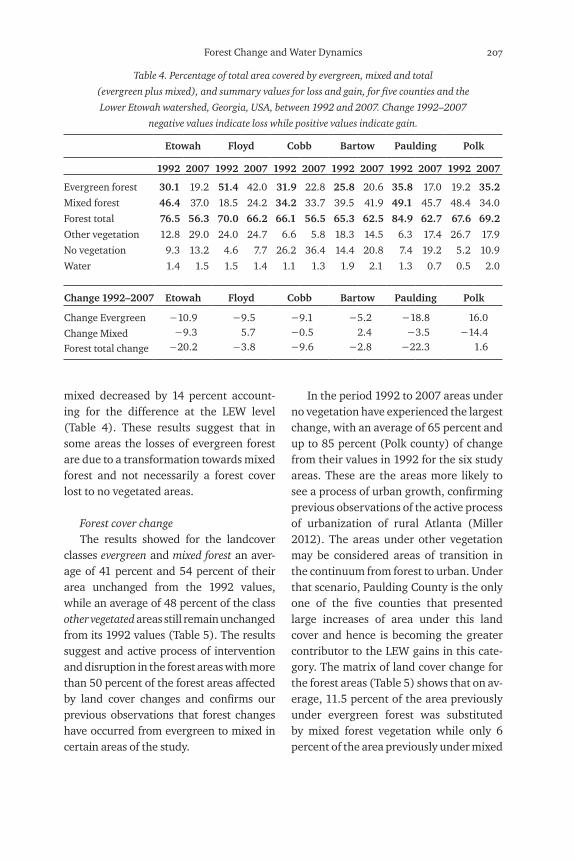
Table 4. Percentage of total area covered by evergreen, mixed and total
(evergreen plus mixed), and summary values for loss and gain, for five counties and the
Lower Etowah watershed, Georgia, USA, between 1992 and 2007. Change 1992–2007
negative values indicate loss while positive values indicate gain.
Etowah Floyd Cobb Bartow Paulding Polk
1992 2007 1992 2007 1992 2007 1992 2007 1992 2007 1992 2007
Evergreen forest 30.1 19.2 51.4 42.0 31.9 22.8 25.8 20.6 35.8 17.0 19.2 35.2
Mixed forest 46.4 37.0 18.5 24.2 34.2 33.7 39.5 41.9 49.1 45.7 48.4 34.0
Forest total 76.5 56.3 70.0 66.2 66.1 56.5 65.3 62.5 84.9 62.7 67.6 69.2
Other vegetation 12.8 29.0 24.0 24.7 6.6 5.8 18.3 14.5 6.3 17.4 26.7 17.9
No vegetation 9.3 13.2 4.6 7.7 26.2 36.4 14.4 20.8 7.4 19.2 5.2 10.9
Water 1.4 1.5 1.5 1.4 1.1 1.3 1.9 2.1 1.3 0.7 0.5 2.0
Change 1992–2007 Etowah Floyd Cobb Bartow Paulding Polk
Change Evergreen −10.9−9.3
−20.2
−9.55.7
−3.8
−9.1−0.5−9.6
−5.22.4
−2.8
−18.8−3.5
−22.3
16.0−14.4
1.6Change MixedForest total change
mixed decreased by 14 percent account-ing for the difference at the LEW level (Table 4). These results suggest that in some areas the losses of evergreen forest are due to a transformation towards mixed forest and not necessarily a forest cover lost to no vegetated areas.
Forest cover changeThe results showed for the landcover
classes evergreen and mixed forest an aver-age of 41 percent and 54 percent of their area unchanged from the 1992 values, while an average of 48 percent of the class other vegetated areas still remain unchanged from its 1992 values (Table 5). The results suggest and active process of intervention and disruption in the forest areas with more than 50 percent of the forest areas affected by land cover changes and confirms our previous observations that forest changes have occurred from evergreen to mixed in certain areas of the study.
In the period 1992 to 2007 areas under no vegetation have experienced the largest change, with an average of 65 percent and up to 85 percent (Polk county) of change from their values in 1992 for the six study areas. These are the areas more likely to see a process of urban growth, confirming previous observations of the active process of urbanization of rural Atlanta (Miller 2012). The areas under other vegetation may be considered areas of transition in the continuum from forest to urban. Under that scenario, Paulding County is the only one of the five counties that presented large increases of area under this land cover and hence is becoming the greater contributor to the LEW gains in this cate-gory. The matrix of land cover change for the forest areas (Table 5) shows that on av-erage, 11.5 percent of the area previously under evergreen forest was substituted by mixed forest vegetation while only 6 percent of the area previously under mixed
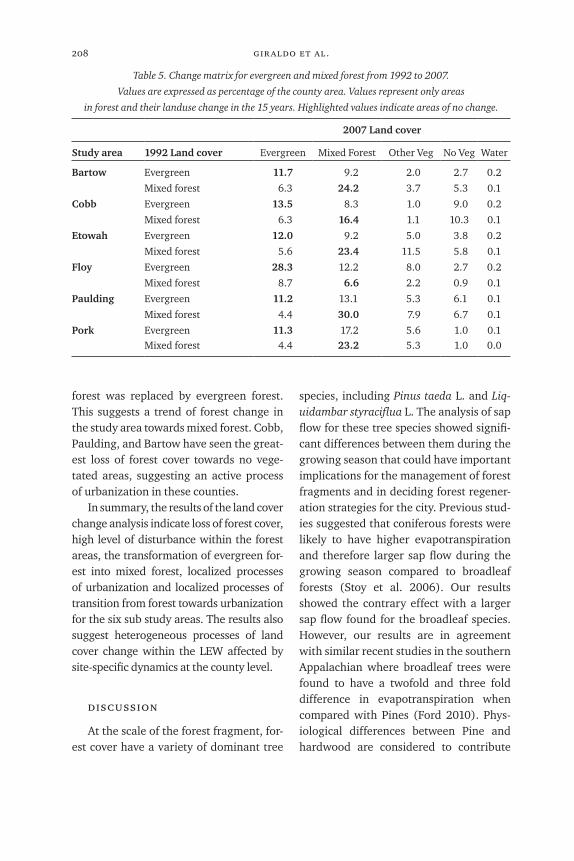
208 gir aldo et al.
forest was replaced by evergreen forest. This suggests a trend of forest change in the study area towards mixed forest. Cobb, Paulding, and Bartow have seen the great-est loss of forest cover towards no vege-tated areas, suggesting an active process of urbanization in these counties.
In summary, the results of the land cover change analysis indicate loss of forest cover, high level of disturbance within the forest areas, the transformation of evergreen for-est into mixed forest, localized processes of urbanization and localized processes of transition from forest towards urbanization for the six sub study areas. The results also suggest heterogeneous processes of land cover change within the LEW affected by site-specific dynamics at the county level.
discussion
At the scale of the forest fragment, for-est cover have a variety of dominant tree
species, including Pinus taeda L. and Liq-uidambar styraciflua L. The analysis of sap flow for these tree species showed signifi-cant differences between them during the growing season that could have important implications for the management of forest fragments and in deciding forest regener-ation strategies for the city. Previous stud-ies suggested that coniferous forests were likely to have higher evapotranspiration and therefore larger sap flow during the growing season compared to broadleaf forests (Stoy et al. 2006). Our results showed the contrary effect with a larger sap flow found for the broadleaf species. However, our results are in agreement with similar recent studies in the southern Appalachian where broadleaf trees were found to have a twofold and three fold difference in evapotranspiration when compared with Pines (Ford 2010). Phys-iological differences between Pine and hardwood are considered to contribute
Table 5. Change matrix for evergreen and mixed forest from 1992 to 2007.
Values are expressed as percentage of the county area. Values represent only areas
in forest and their landuse change in the 15 years. Highlighted values indicate areas of no change.
2007 Land cover
Study area 1992 Land cover Evergreen Mixed Forest Other Veg No Veg Water
Bartow Evergreen 11.7 9.2 2.0 2.7 0.2
Mixed forest 6.3 24.2 3.7 5.3 0.1
Cobb Evergreen 13.5 8.3 1.0 9.0 0.2
Mixed forest 6.3 16.4 1.1 10.3 0.1
Etowah Evergreen 12.0 9.2 5.0 3.8 0.2
Mixed forest 5.6 23.4 11.5 5.8 0.1
Floy Evergreen 28.3 12.2 8.0 2.7 0.2
Mixed forest 8.7 6.6 2.2 0.9 0.1
Paulding Evergreen 11.2 13.1 5.3 6.1 0.1
Mixed forest 4.4 30.0 7.9 6.7 0.1
Pork Evergreen 11.3 17.2 5.6 1.0 0.1Mixed forest 4.4 23.2 5.3 1.0 0.0
Forest Change and Water Dynamics 209
as much as differences in tree structure (Ford et al. 2010) affecting interception, water intake, and infiltration. In a simi-lar way, our results are in agreement with studies that showed broadleaf species less affected by changes in soil moisture com-pared to Pine trees (Stoy 2006), which is particularly important for the southeast-ern U.S. where severe drought has been more frequent in recent years.
At the landscape scale, our study found northwestern suburban Atlanta to be a heterogeneous region where the dy-namics of land cover change are affected by decisions at the county level. Recent studies have showed a dynamic process of forest loss, forest fragmentation, and forest composition change in the counties surrounding the city of Atlanta (Miller 2012). In this way active processes of ur-banization in Cobb, Bartow, and Paulding are contrasted by slow urban growth and regeneration of the forest cover in Polk County. Forest dynamics were also found to have different characteristics among the different counties where Paulding and Cobb showed an active loss of evergreen forest that other counties did not show. Polk County was a notorious exception presenting gains in its forest cover due to processes of re-vegetation with an ever-green forest cover at the expense of decid-uous forest.
Change in the forest cover of a region has important effects in the evapotranspi-ration and interception components of the water budget, affecting potential regional water yield. Although it is clear that a re-duction in the forest cover increases the water yield by decreasing evapotranspir-aton (Zhang et al. 2001), effects in the water budget caused by changes in species composition of the forest rather than in
the forest cover area are less evident but may be equally important. In fact, local water regimes are expected to show var-iations affected by tree species (Ford and Vose 2007), and forest types (Lu et al. 2001) due to the variation of individual tree species water use. In this way, our re-sults suggest that in addition to the large scale changes in the hydrological regime brought about by the changes in the forest cover of the region, changing the species composition of the forest dominant tree species may have also an important addi-tional effect on the hydrological regime particularly during periods of hydric stress (Gardner et al. 2009).
Recent regional assessments in the southeastern U.S. suggest that land cover areas of pine plantations will increase at the expense of hardwood forest (Stoy et al. 2006). This has the potential to modify the local contributions of forest fragments to the water cycle of the region.
The results are in agreement with in-creasing literature in the area of ecohy-drology (Vose et al. 2011) suggesting that traditional approaches where forests are lumped into a single land cover need to be revisited since the different contribu-tion of tree species to the forest water dy-namics are very important. We found that the study of suburban forest fragments is of significance since tree species compo-sition changes happening at the scale of the forest fragments are expected to play a significant role in the hydrological budget of the region as well as in other critical ecological events such as the conservation of native species of plants, and animal habitats for local species. At the water-shed level, drastic land cover changes and change in forest cover composition caused by urbanization are expected to produce
210 gir aldo et al.
changes in the composition of riparian vegetation ( Burton et al. 2009) that in addition to modifying the hydrological budget has effects on other elements of the hydrological system. Some of those changes include decreases of channel base-flow, sediment increases during storm-flow (Schoonover et al. 2007), the transformation of the channel sediment characteristics, and changes in the solute transport of the stream network (Ryan and Packman 2006).
In this way, a better understanding of the individual contributions of tree species to the water budget are particularly im-portant in hydrological studies, especially in those seeking to refine conceptual com-puter base hydrological models that have been unable to describe the hydrological process of southern forest ecosystems (Sun et al. 2005). We found that a multidiscipli-nary approach to the study of the water budget is required to account for the dif-ferent variables and components of the re-gional water system. In this case we found that in addition to the hydrological analy-sis, the use of GIS remote sensing tools al-lows us to quantify the effects of local deci-sions at different landscape scales.
conclusions
We found that forest patches in subur-ban northwestern Atlanta have a diverse canopy with a rich tree species composition of several deciduous and evergreen tree species. When considered at the regional scale, different behavior between trees species may have an important impact in the estimations of the water cycle. In this research, we tested the hypothesis that tree species within forest patches have a differ-ent behavior regarding water intake. The
results showed a relationship of more than 2:1 for the broadleaf deciduous (Liquid-ambar styraciflua L.) compared to the ev-ergreen pine tree species (Pinus taeda L.).
We found also that the study area in northwestern Atlanta shows a great level of disturbance in the forest cover, with forest cover loss, changes from evergreen forest into mixed forest, and localized pro-cess of transition from forest towards ur-banization. In addition to the negative im-pact in the water cycle of the area caused by a decrease in forest area of up to 20 per-cent in all the five counties of the Etowah watershed, additional disruptions to the water budget may be expected by changes in the dominant tree species composition of the forest fragments due to the differ-ences in water use between tree species.
The change in forest cover and species composition within the canopy are ex-pected to have a combined effect within the water cycle that is not considered in studies where mixed forest covers are considered homogeneous areas. Our re-sults suggest that the species composition of the forest should be considered when studying the overall impact of land cover change over the water cycle with special attention to those forests with mix canopy cover. Although a more comprehensive modeling of the combined effects of forest cover and species composition change in the water budget are beyond the scope of this paper, it is suggested to be a natural follow up of this research.
acknowledgmentsFunding for this research was provided by
the College of Humanities and Social Science
at Kennesaw State University, Atlanta, Georgia.
Many thanks to geographers: James VanHorne,
Forest Change and Water Dynamics 211
Phillip Oliver, Jessica Hootselle, Patrick Belou,
T.J. Stark for their assistance during field work
and data analysis. The authors express gratitude
to anonymous reviewers for their comments
and contributions to improve this manuscript.
referencesBurton, M.L., Samuelson, L.J., Mackenzie,
M.D. 2009. Riparian woody plant traits
across an urban–rural land use gradient
and implications for watershed function
with urbanization. Landscape and Urban
Planning 90(1–2):42–55.
Barrett, K., Guyer, C. 2008. Differential
responses of amphibians and reptiles in
riparian and stream habitats to land use
disturbances in western Georgia, USA.
Biological Conservation 141(9):2290–2300.
Dawson, K. 1995. A comprehensive conservation
strategy for Georgia’s greenways. Landscape
and Urban Planning 33:27–43.
Ford, C.R., Hubbard, R.M., and Vose,
J.M. 2010. Quantifying structural
and physiological controls on canopy
transpiration of planted pine and hardwood
stands in the southern Appalachians.
Ecohydrology 4(2):183–195.
Ford, C.R., and Vose, J.M. 2007. Tsuga
Canadiensis (L.) CARR. Mortality will
impact hydrologic processes in southern
Appalachian forest ecosystems. Ecological
applications 17(4):1156–1167
Ford, C.R., Goranson, C.E., Mitchell, R.J., Will,
R.E., Teskey, R.O. 2005. Modeling canopy
transpiration using time series analysis:
A case study illustrating the effect of soil
moisture deficit on Pinus taeda. Agricultural
and Forest Meteorology 130(3–4):163–175
Gartner, K., Nadezhdina, N., Englisch, M.,
Cermak, J., Leitgeb, E. 2009. Sap flow of birch
and Norway spruce during the European heat
and drought in summer 2003. Forest Ecology
and Management 258(5):590–599
Gilliesa, R.A., Boxb, J.B., Symanzikc, J.,
and Rodemakerd, E.J. 2003. Effects of
urbanization on the aquatic fauna of the
Line Creek watershed, Atlanta—a satellite
perspective. Remote Sensing of Environment
86:411–422.
Giraldo, M.A., Grundstein, A., Bosch, D.D.
2009a. Testing FASST a one-dimensional
hydrological model for soil moisture
studies at the Little River Watershed,
Tifton, Georgia. Georgia Water Resources
Conference April 27–29, 2009, Athens,
Georgia.
Giraldo, M.A., Madden, M., Grunstein, A., and
Bosch, D. 2009b. Land use/Land cover and
soil type covariation in a heterogeneous
landscape for soil moisture studies using
point data. Journal of GIS science and
Remote Sensing 46:1–24
Granier, A. 1987. Evaluation of transpiration
in a Douglas-fir stand by means of sap flow
measurements. Tree Physiology 3:309–320.
Hay, G.D., Dube, P., Bouchard, A., and
Marceau, D.J. 2002. A scale-space
primer for exploring and quantifying
complex landscapes. Ecological Modeling
153:27–49.
Jensen, J. 2005. Introductory digital image
processing: A remote sensing perspective.
New York: Prentice Hall.
Kume, T., Takizawa, H., Yoshifuji, N., Tanaka,
K., Tantasirin, C., Tanaka, N., Suzuki,
M. 2007. Impact of soil drought on sap
flow and water status of evergreen trees
in a tropical monsoon forest in northern
Thailand, Forest Ecology and Management
238(1–3):220–230.
Lu, J., Sun, G., McNulty, S.G., Amatya, D.M.
2003. Modeling actual evapotranspiration
from forested watersheds across the
southeastern United States. Journal of
the American Water Resources Association
39(4):887–895.
212 gir aldo et al.
McKinney, M. 2006. Urbanization as a major
cause of biotic homogenization. Biological
Conservation 127:247–260.
Miller, M. 2012. The impacts of Atlanta’s urban
sprawl on forest cover and fragmentation.
Applied Geography 34:171–179
Miller, G.R., Baldocchi, D.D., Law, B.E.,
Meyers, T. 2007. An analysis of soil
moisture dynamics using multi-year data
from a network of micrometeorological
observation sites. Advances in Water
Resources 30(5):1065–1081.
Nagendra, H., Munroe, D.K., and Southworth,
J. 2004. From pattern to process: Landscape
fragmentation and the analysis of landuse/
land cover change. Agriculture, Ecosystems
and the Environment 101:111–115.
Neary, D.G., Ice, G.G., Jackson, C.R. 2009.
Linkages between forest soils and water
quality and quantity. Forest Ecology and
Management 258:2269–2281.
Ryan, R.J., and Packman, A.I. 2006. Changes
in streambed sediment characteristics and
solute transport in the headwaters of Valley
Creek, an urbanizing watershed, Journal of
Hydrology 323:1–4.
Schoonover, J.E., Lockaby, B.G., Helms, B.S.
2006. Impacts of land cover on stream
hydrology in the west Georgia piedmont,
USA. Journal of Environmental Quality
35:2123–2131.
Stoy, P.C., Katul, G.A., Siqueira, M.B., Juang,
J.G., Novick, K.A., Mccarthy, H.R., Oishi,
C., Uebelherr, J.M., Kim, H., Oren, R.M.
2006. Separating the effects of climate and
vegetation on evapotranspiration along
a successional chronosequence in the
southeastern US. Global Change Biology
12:1–21.
Styers, D.M., Chappelka, A.H., Marzen,
L.J., Somers, G.L. 2010. Scale matters:
Indicators of ecological health along
the urban–rural interface near
Columbus, Georgia. Ecological Indicators
10(2):224–233
Sun, G., McNultya, S.G., Lu, J., Arnatyac, D.M.,
Liang, Y., Kolkae, R.K. 2005. Regional
annual water yield from forest lands and its
response to potential deforestation across
the southeastern United States. Journal of
Hydrology 308:258–268.
Turner, M.G., and Ruscher, C.L. 1988. Changes
in landscape patterns in Georgia, USA.
Landscape Ecology 1(4):241–251
United States Department of Agriculture
(USDA). 2014. “Web Soil Service.” Natural
Resources Conservation Service. Accessed
20 December 2014 at http://websoilsurvey
.nrcs.usda.gov/app/WebSoilSurvey.aspx.
Vose, J.M., Sun, G., Ford, CR., Bredemeier,
M. 2011. Forest ecohydrological research
in the 21st century: What are the critical
needs? Ecohydrology 4(2):146–158.
Wear, D.N., Greis, J.G., Walters, N. 2009. The
Southern forest futures project: Using
public input to define the issues. General
Technical Report SRS-115. Asheville, NC:
U.S. Department of Agriculture Forest
Service, Southern Research Station.
Zhang, L., Dawes, W.R., and Walker, G.R. 2001.
Response to mean annual evapotranspiration
to vegetation changes at catchment scale.
Water resources research 37(3):701–708.
Zipperer, W. Urban Influences on forest
ecosystems. 2002. In Human influences on
forest ecosystems: The southern wildland-
urban interface assessment, eds. E.A.
Macie and L.A. Hermansen, General
Technical Report SRS-55. Asheville, NC: US
Department of Agriculture Forest Service,
Southern Research Station.
mario a. gir aldo ph.d. is a geographer
interested in urban ecosystems and in land
use, land cover change effects in hydrological

Forest Change and Water Dynamics 213
process. He analyzes spatial fragmentation of
agriculture and urban landscapes and study
water dynamics on plant species. In watersheds
in the colombian Andes he studies climatic
variables in mountain gradients and spatial
variation of vegetation. He teaches general ed
courses and specializes in remote sensing, GIS
applications to the environment, biogeography
and conservation.
paula jackson ph.d. is a professor of
ecology, modern biology, tropical ecology,
interested in studying the ecology and
physiology of plants. Her research focuses in
the interplay between water availability, plant
photosynthetic rates, and plant distribution
patterns incorporating both classical ecological
methods (e.g. quadrats and transects to look at
patterns of distribution), and new techniques
such as stable isotopes.
wayne van-horne ph.d. is an
ethnologist, ethnohistorian and ecological
anthropologist. His research areas includes
ecology and conservation issues in the
Southeastern U.S., and the role of warfare
in social evolution of the American Indian
cultures of the Southeastern United States. He
teaches a variety of courses in both ecological
and cultural Anthropology.