Embed Size (px)
Citation preview

QGIS Tutorials DocumentationRelease 0.1
Nathaniel Roth
November 30, 2016

Contents
1 Installation 31.1 Basic Installation . . . . . . . . . . . . . . . . . . . . . . . . . . . . . . . . . . . . . . . . . . . . . 31.2 Advanced Installation . . . . . . . . . . . . . . . . . . . . . . . . . . . . . . . . . . . . . . . . . . 3
2 Basics 212.1 Anatomy of QGIS . . . . . . . . . . . . . . . . . . . . . . . . . . . . . . . . . . . . . . . . . . . . 212.2 Layers . . . . . . . . . . . . . . . . . . . . . . . . . . . . . . . . . . . . . . . . . . . . . . . . . . 32
3 Projections 373.1 Project on-the-fly . . . . . . . . . . . . . . . . . . . . . . . . . . . . . . . . . . . . . . . . . . . . . 383.2 Layer Projections . . . . . . . . . . . . . . . . . . . . . . . . . . . . . . . . . . . . . . . . . . . . . 393.3 Reprojecting Data . . . . . . . . . . . . . . . . . . . . . . . . . . . . . . . . . . . . . . . . . . . . 403.4 EPSG Codes . . . . . . . . . . . . . . . . . . . . . . . . . . . . . . . . . . . . . . . . . . . . . . . 41
4 Tables 434.1 Adding the Data . . . . . . . . . . . . . . . . . . . . . . . . . . . . . . . . . . . . . . . . . . . . . 434.2 Inspect the Data . . . . . . . . . . . . . . . . . . . . . . . . . . . . . . . . . . . . . . . . . . . . . 444.3 Joining Tables . . . . . . . . . . . . . . . . . . . . . . . . . . . . . . . . . . . . . . . . . . . . . . 464.4 Symbolize . . . . . . . . . . . . . . . . . . . . . . . . . . . . . . . . . . . . . . . . . . . . . . . . 48
5 Editing 515.1 Calculating an Attribute . . . . . . . . . . . . . . . . . . . . . . . . . . . . . . . . . . . . . . . . . 515.2 Geometry Editing . . . . . . . . . . . . . . . . . . . . . . . . . . . . . . . . . . . . . . . . . . . . 56
6 Geoprocessing 636.1 Create Polygon Centroids . . . . . . . . . . . . . . . . . . . . . . . . . . . . . . . . . . . . . . . . 636.2 Buffer . . . . . . . . . . . . . . . . . . . . . . . . . . . . . . . . . . . . . . . . . . . . . . . . . . . 656.3 Intersect . . . . . . . . . . . . . . . . . . . . . . . . . . . . . . . . . . . . . . . . . . . . . . . . . 686.4 Voronoi Polygons . . . . . . . . . . . . . . . . . . . . . . . . . . . . . . . . . . . . . . . . . . . . 716.5 SpatialLite and PostGIS . . . . . . . . . . . . . . . . . . . . . . . . . . . . . . . . . . . . . . . . . 73
7 Rasters 757.1 Terrain Processing . . . . . . . . . . . . . . . . . . . . . . . . . . . . . . . . . . . . . . . . . . . . 757.2 Raster Math . . . . . . . . . . . . . . . . . . . . . . . . . . . . . . . . . . . . . . . . . . . . . . . 89
8 Resources 978.1 User Manuals . . . . . . . . . . . . . . . . . . . . . . . . . . . . . . . . . . . . . . . . . . . . . . . 978.2 Other Tutorials . . . . . . . . . . . . . . . . . . . . . . . . . . . . . . . . . . . . . . . . . . . . . . 978.3 Advanced Materials . . . . . . . . . . . . . . . . . . . . . . . . . . . . . . . . . . . . . . . . . . . 97
i

9 Sample Data 99
ii

QGIS Tutorials Documentation, Release 0.1
Please check out the installation and sample data sections for information on getting QGIS installed and a copy of thesample data I’ll be using in the workshop.
Thank you,
Nate
Contents:
Contents 1

QGIS Tutorials Documentation, Release 0.1
2 Contents
CHAPTER 1
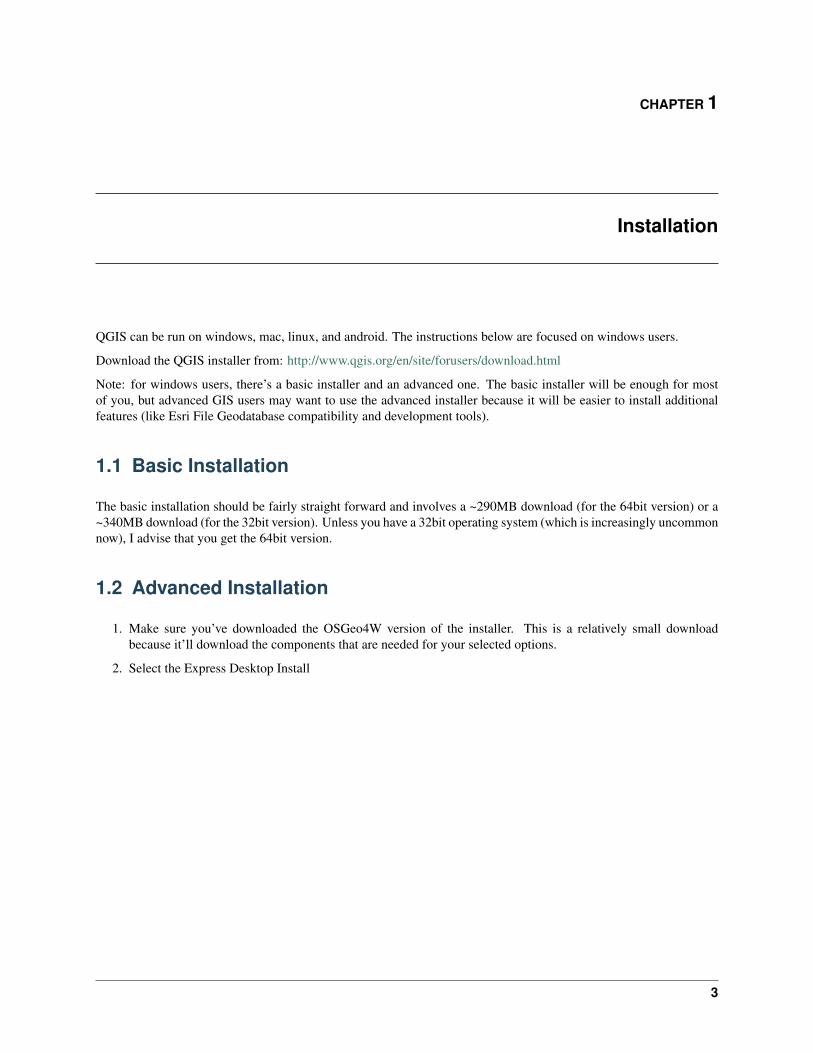
Installation
QGIS can be run on windows, mac, linux, and android. The instructions below are focused on windows users.
Download the QGIS installer from: http://www.qgis.org/en/site/forusers/download.html
Note: for windows users, there’s a basic installer and an advanced one. The basic installer will be enough for mostof you, but advanced GIS users may want to use the advanced installer because it will be easier to install additionalfeatures (like Esri File Geodatabase compatibility and development tools).
1.1 Basic Installation
The basic installation should be fairly straight forward and involves a ~290MB download (for the 64bit version) or a~340MB download (for the 32bit version). Unless you have a 32bit operating system (which is increasingly uncommonnow), I advise that you get the 64bit version.
1.2 Advanced Installation
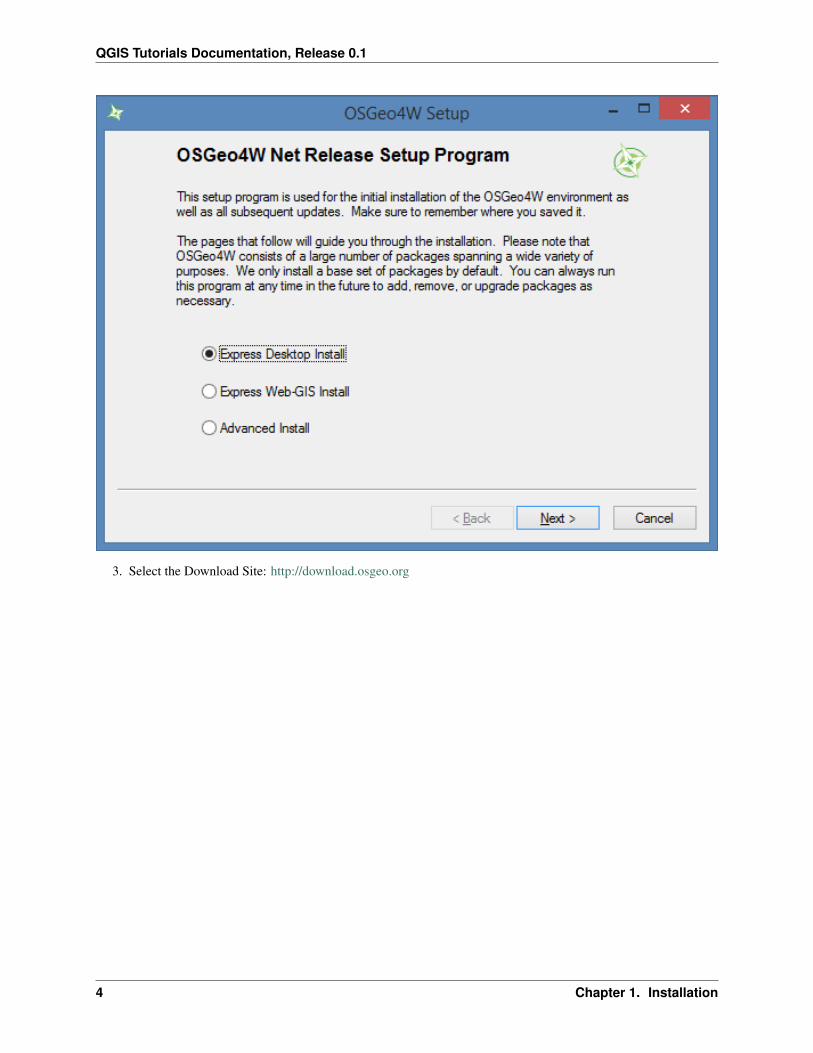
1. Make sure you’ve downloaded the OSGeo4W version of the installer. This is a relatively small downloadbecause it’ll download the components that are needed for your selected options.
2. Select the Express Desktop Install
3
QGIS Tutorials Documentation, Release 0.1
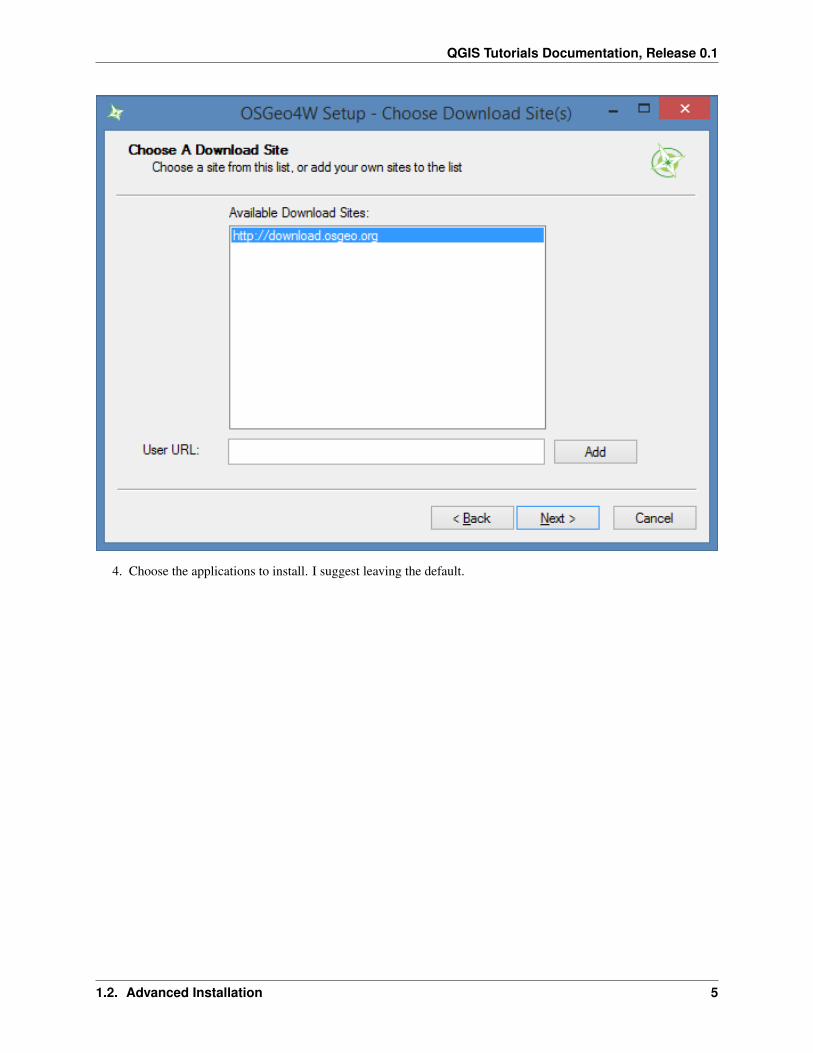
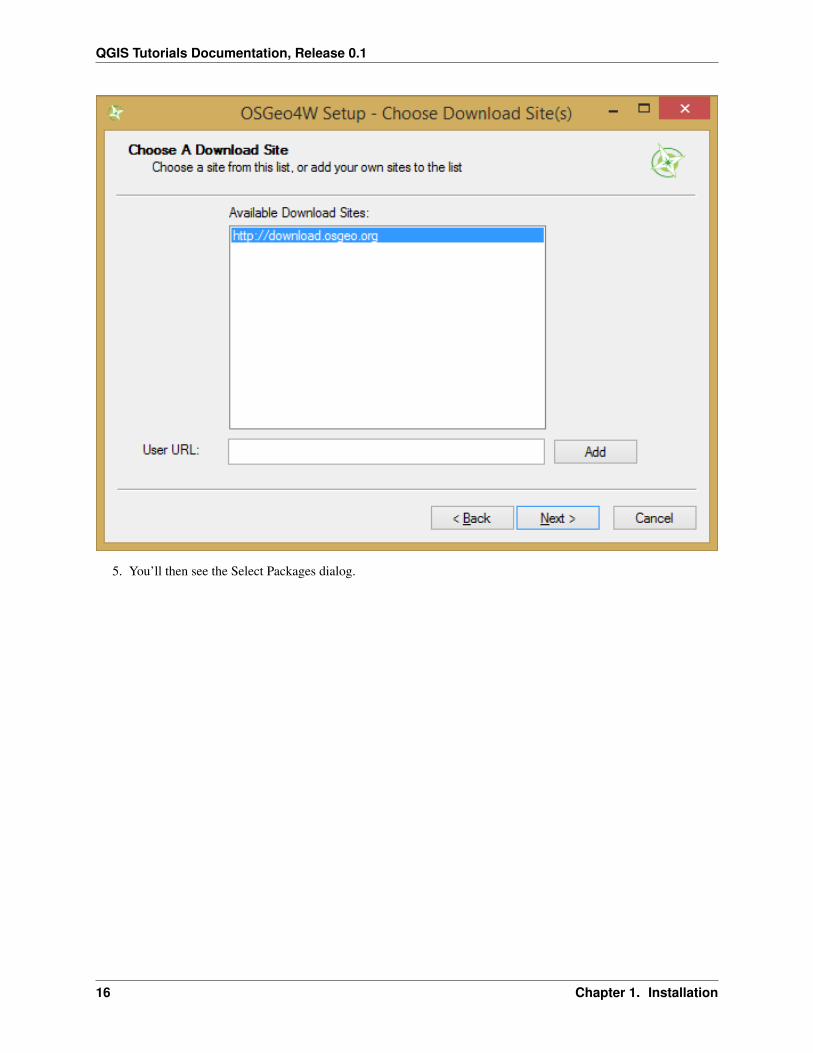
3. Select the Download Site: http://download.osgeo.org
4 Chapter 1. Installation
QGIS Tutorials Documentation, Release 0.1
4. Choose the applications to install. I suggest leaving the default.
1.2. Advanced Installation 5

QGIS Tutorials Documentation, Release 0.1
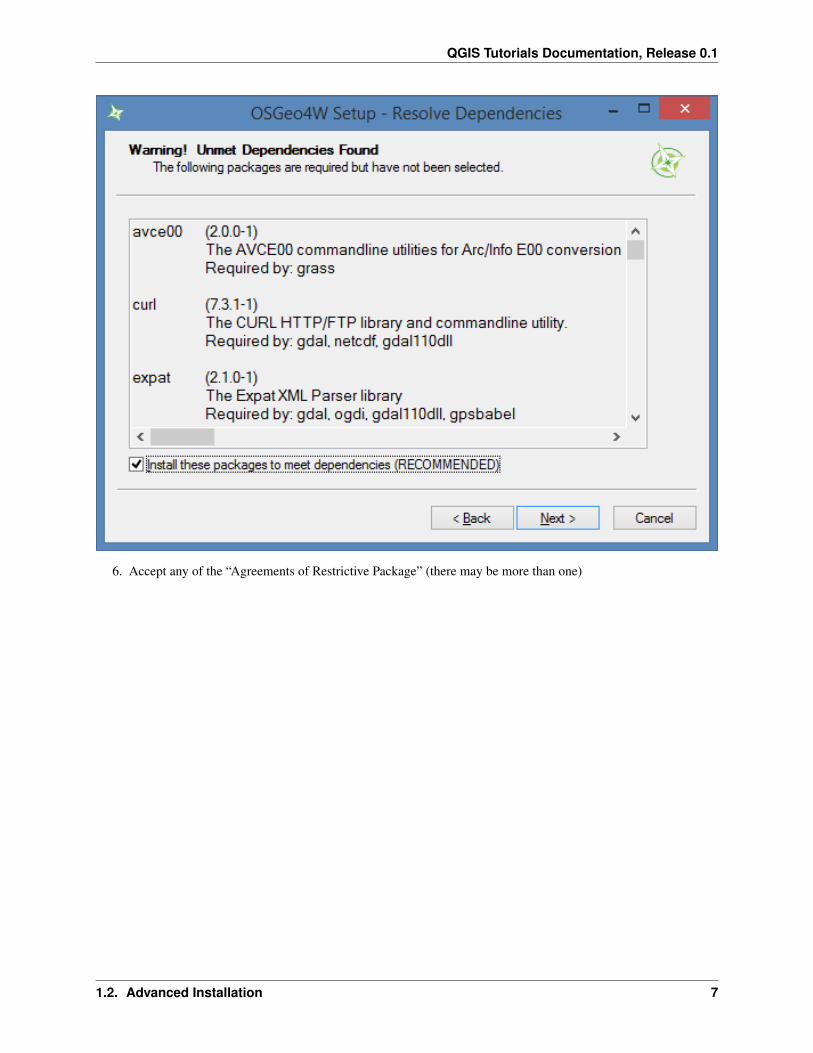
5. Accept the list of unmet dependencies and allow the installter to install them.
6 Chapter 1. Installation
QGIS Tutorials Documentation, Release 0.1
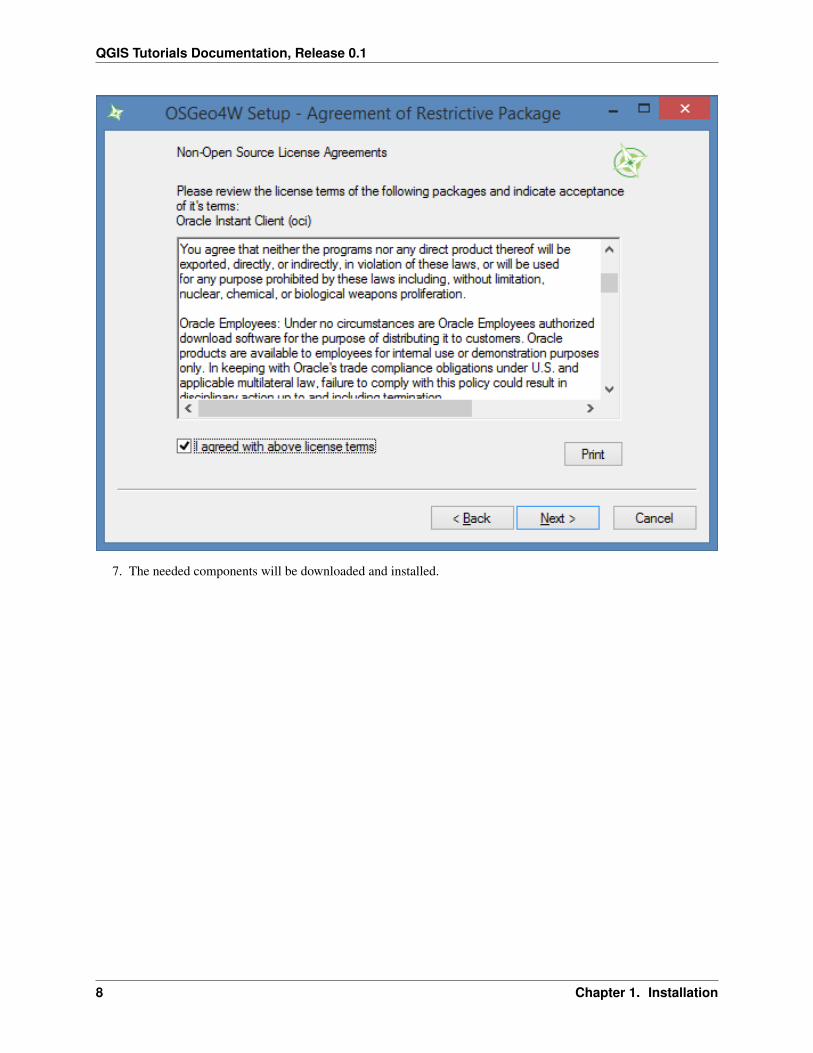
6. Accept any of the “Agreements of Restrictive Package” (there may be more than one)
1.2. Advanced Installation 7
QGIS Tutorials Documentation, Release 0.1
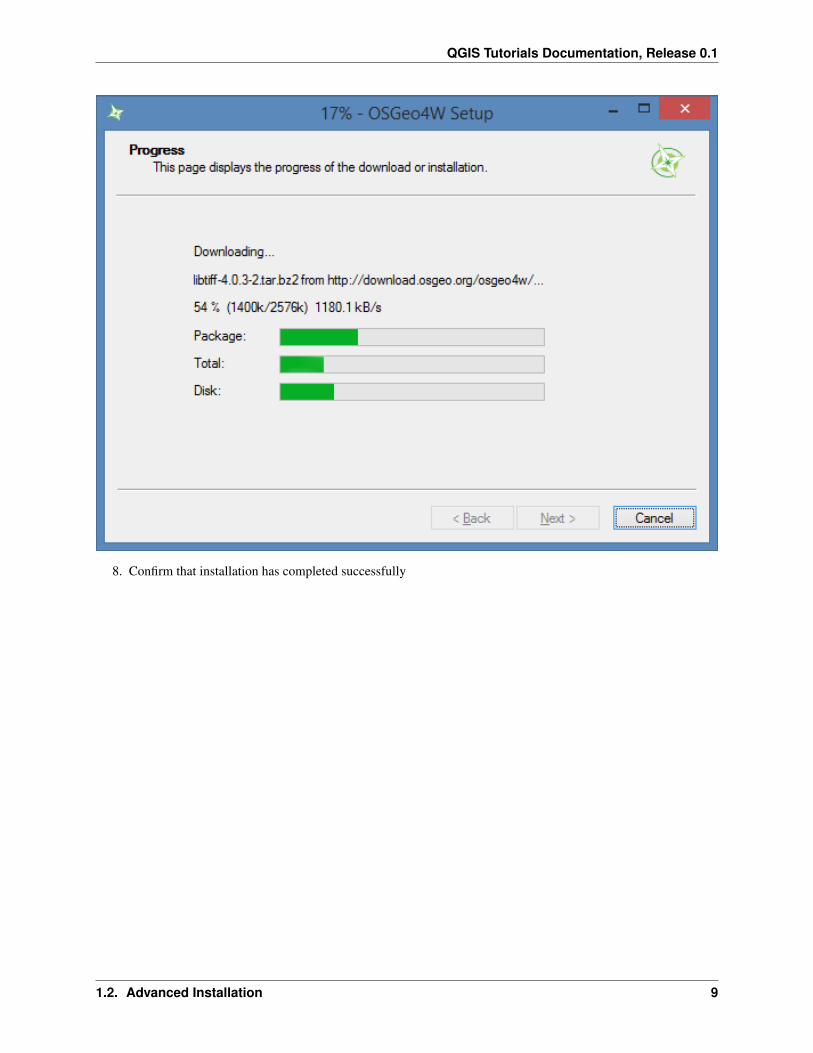
7. The needed components will be downloaded and installed.
8 Chapter 1. Installation
QGIS Tutorials Documentation, Release 0.1
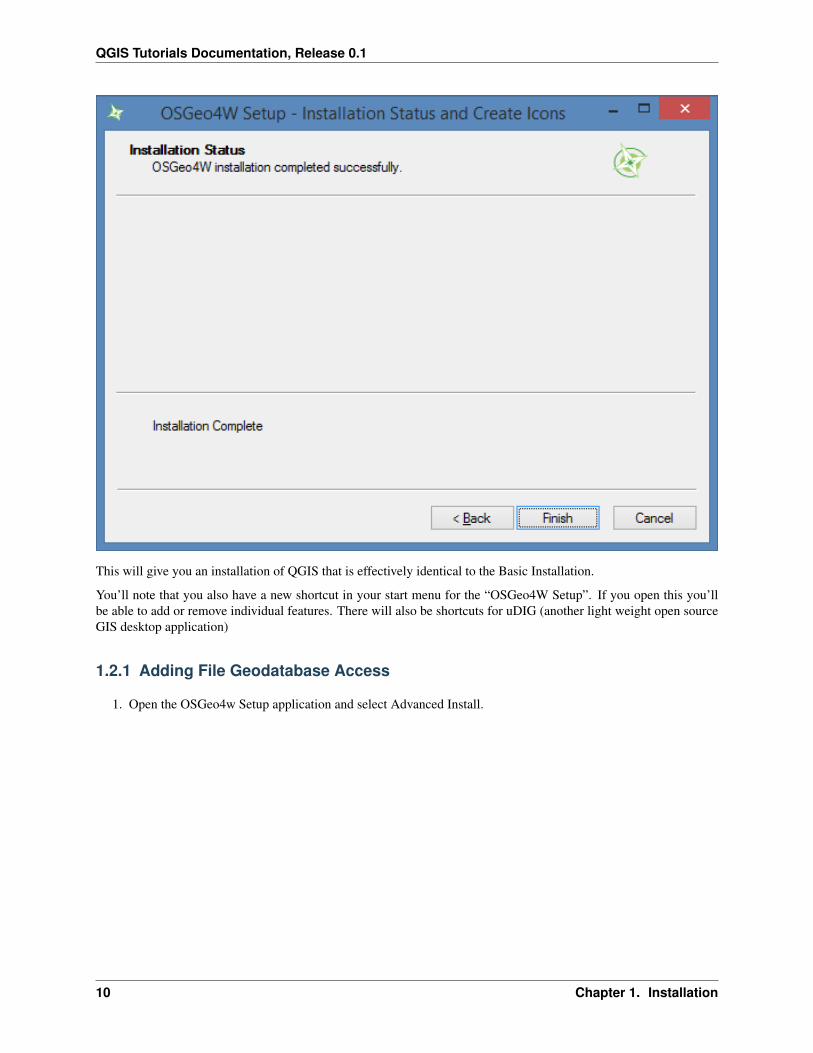
8. Confirm that installation has completed successfully
1.2. Advanced Installation 9
QGIS Tutorials Documentation, Release 0.1
This will give you an installation of QGIS that is effectively identical to the Basic Installation.
You’ll note that you also have a new shortcut in your start menu for the “OSGeo4W Setup”. If you open this you’llbe able to add or remove individual features. There will also be shortcuts for uDIG (another light weight open sourceGIS desktop application)
1.2.1 Adding File Geodatabase Access
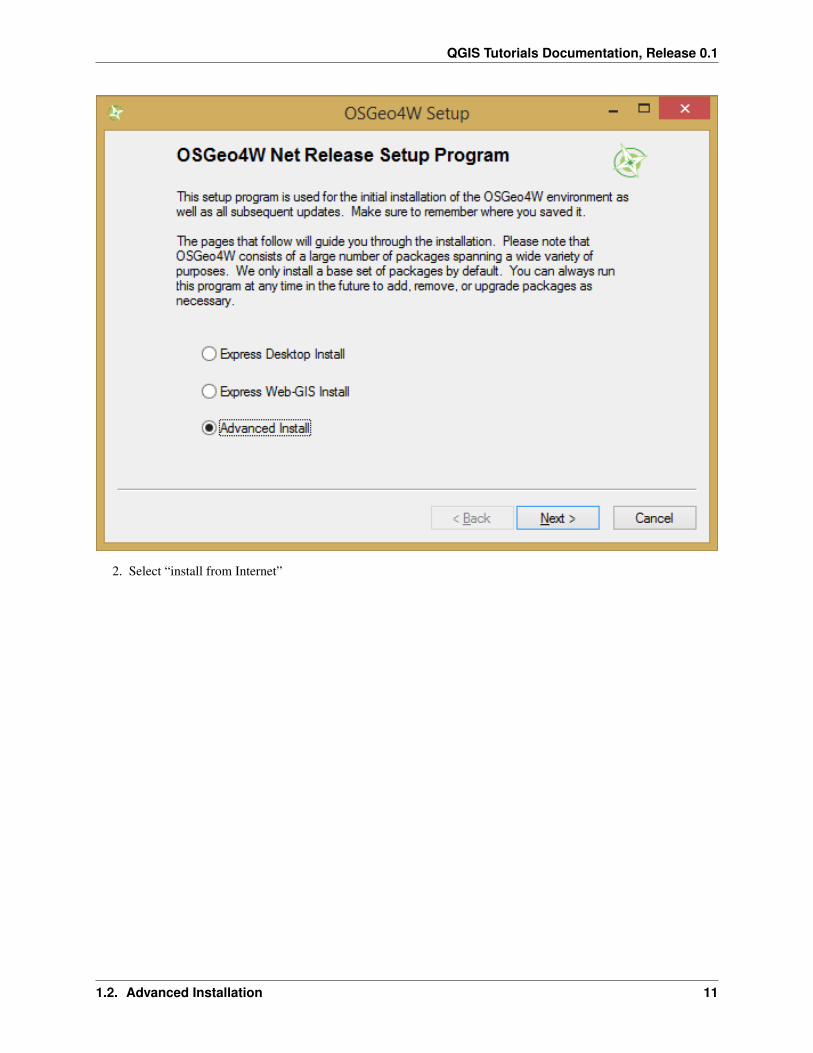
1. Open the OSGeo4w Setup application and select Advanced Install.
10 Chapter 1. Installation
QGIS Tutorials Documentation, Release 0.1
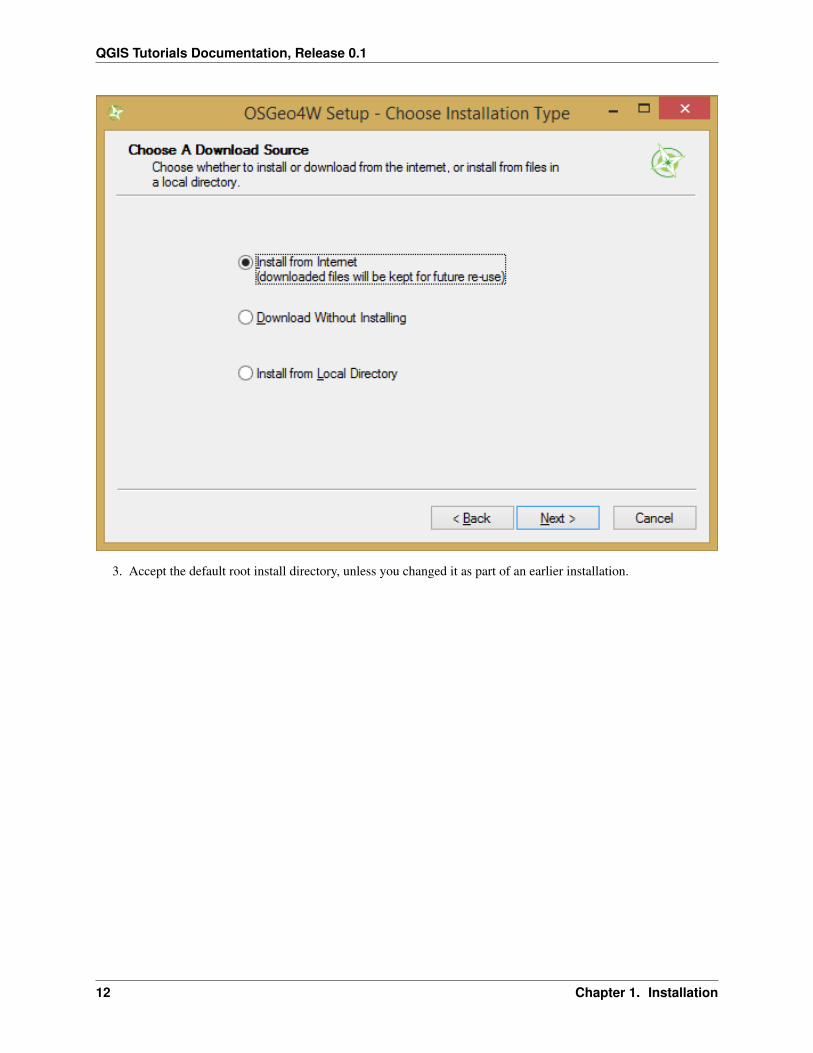
2. Select “install from Internet”
1.2. Advanced Installation 11
QGIS Tutorials Documentation, Release 0.1
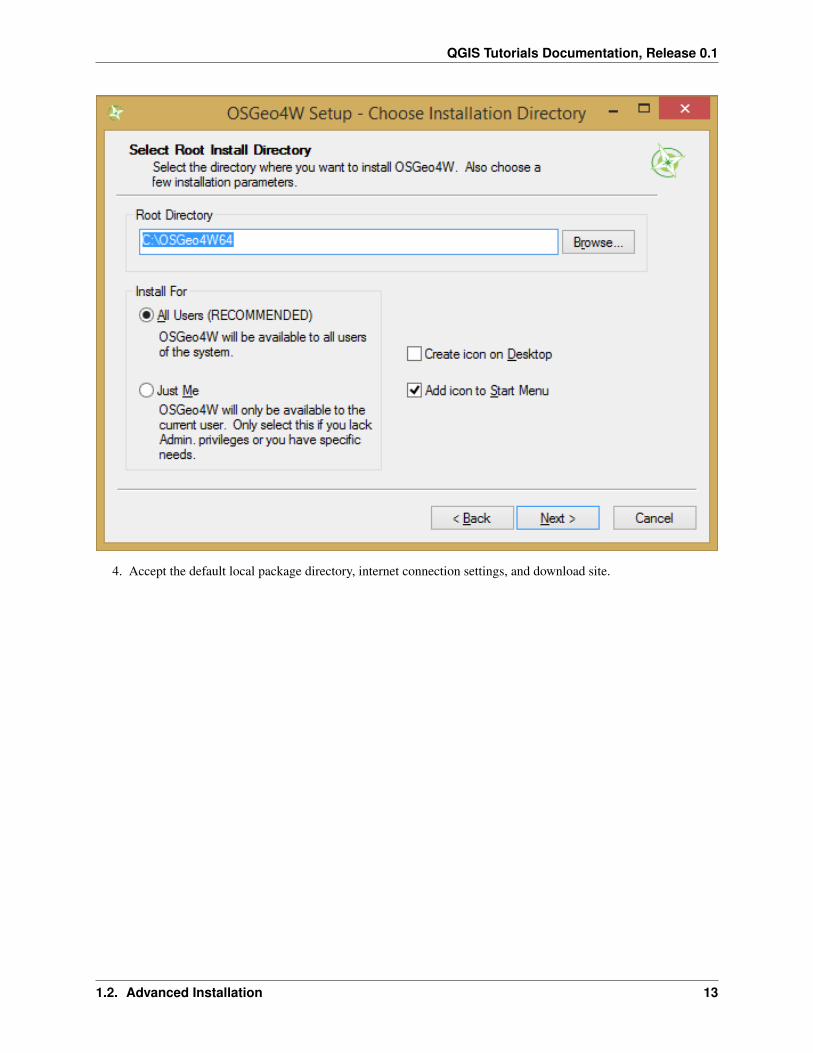
3. Accept the default root install directory, unless you changed it as part of an earlier installation.
12 Chapter 1. Installation
QGIS Tutorials Documentation, Release 0.1
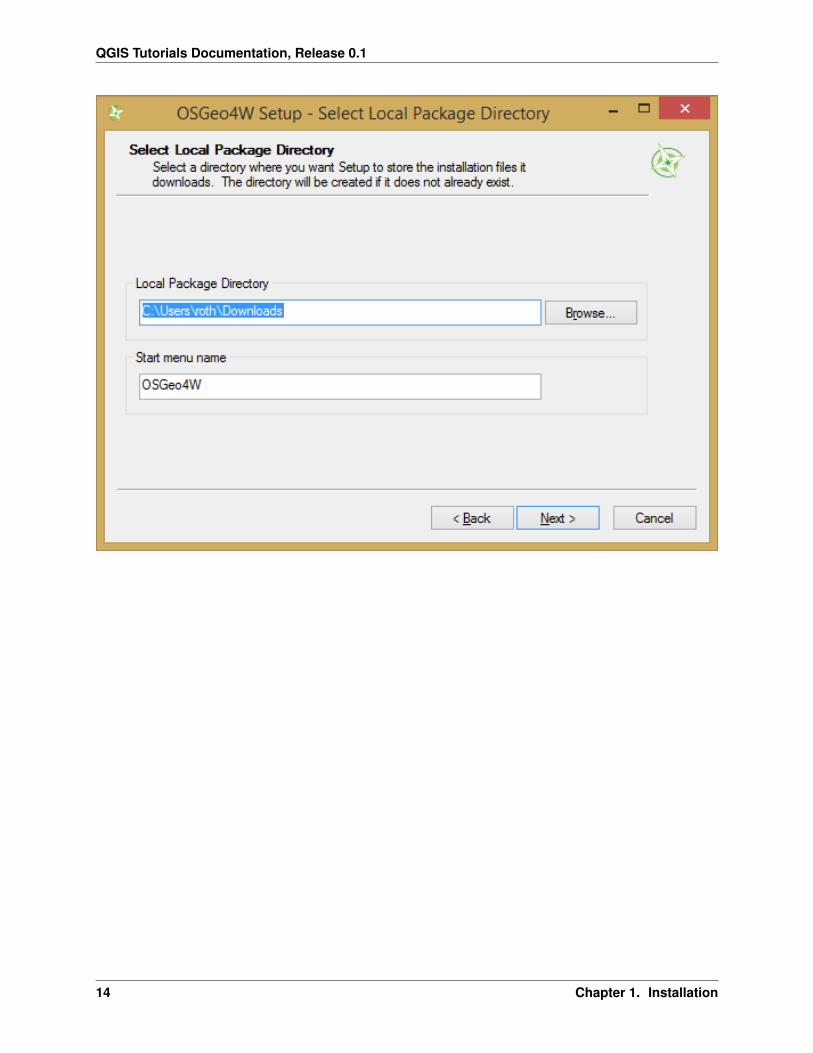
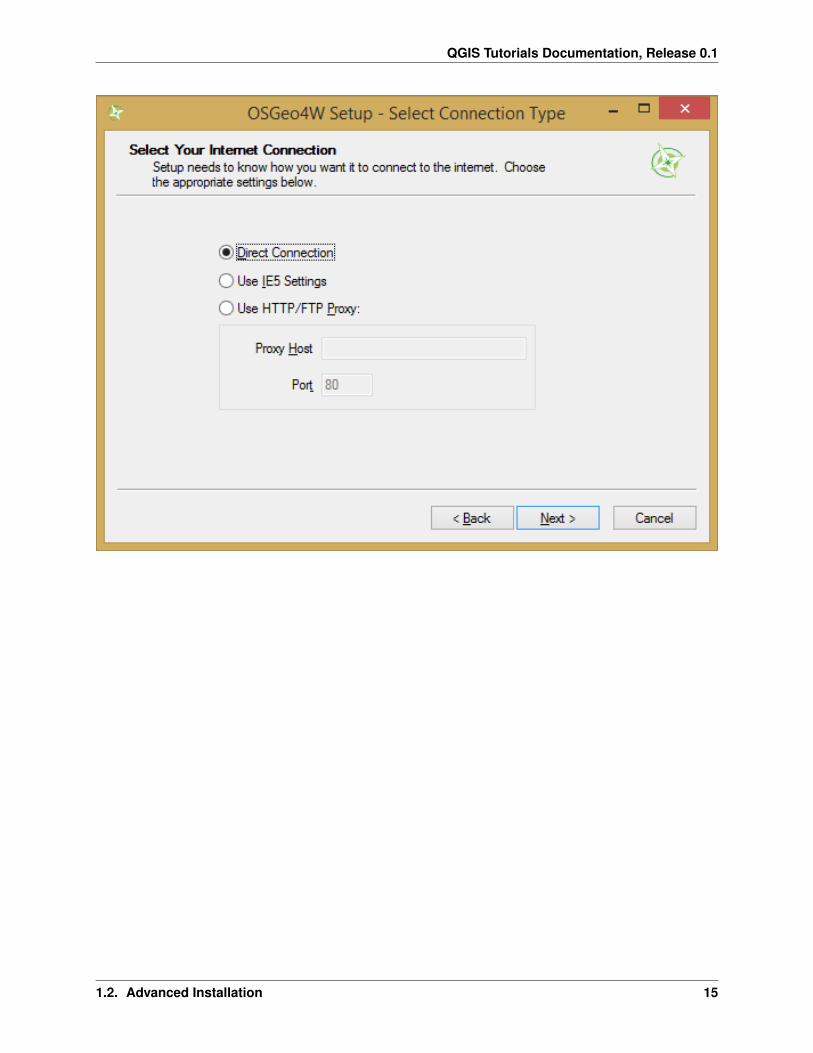
4. Accept the default local package directory, internet connection settings, and download site.
1.2. Advanced Installation 13
QGIS Tutorials Documentation, Release 0.1
14 Chapter 1. Installation
QGIS Tutorials Documentation, Release 0.1
1.2. Advanced Installation 15
QGIS Tutorials Documentation, Release 0.1
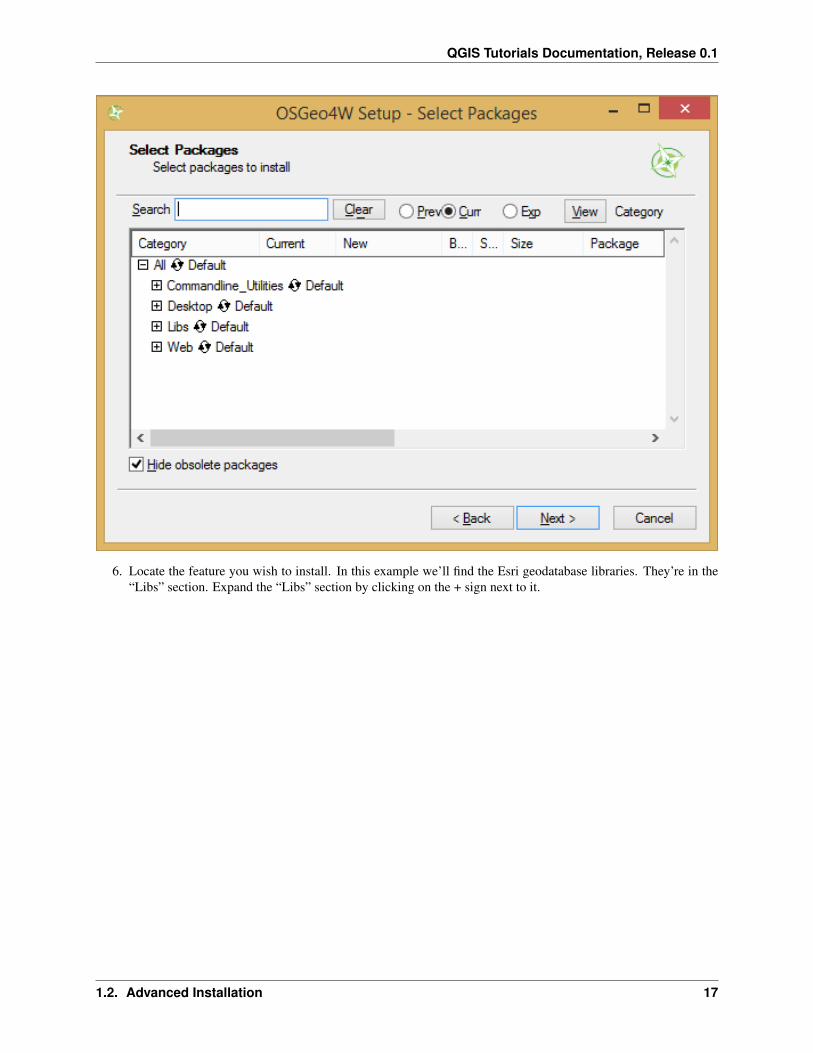
5. You’ll then see the Select Packages dialog.
16 Chapter 1. Installation
QGIS Tutorials Documentation, Release 0.1
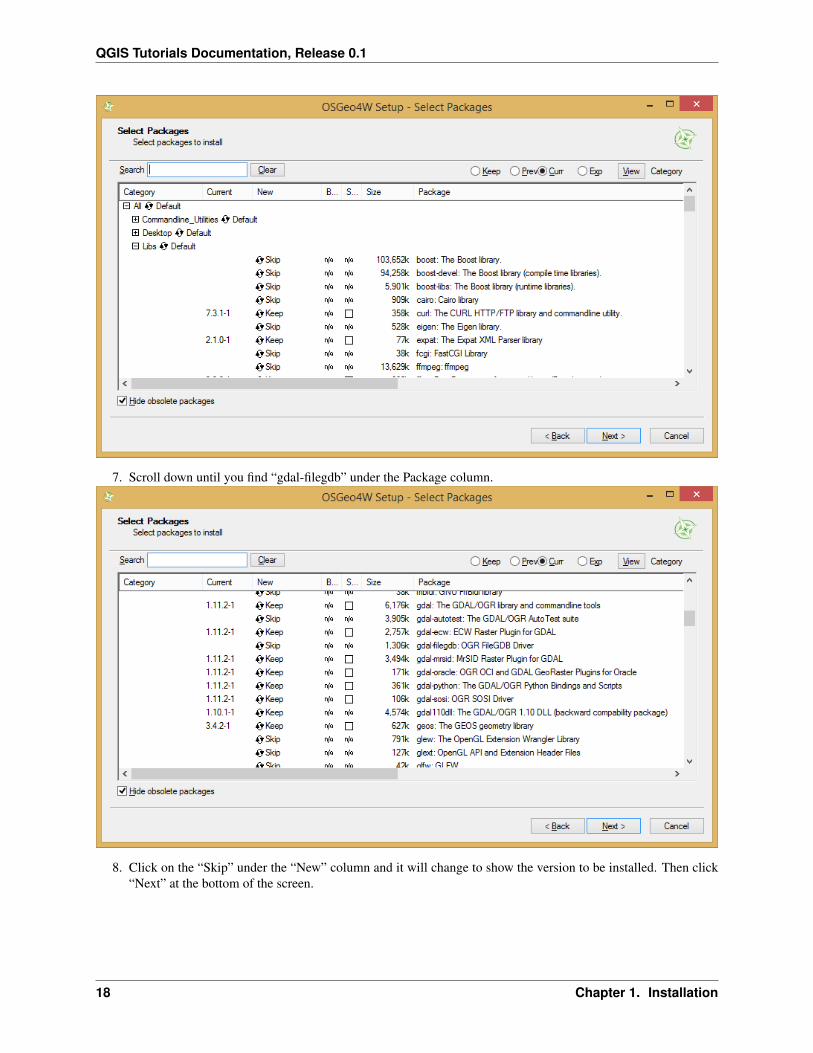
6. Locate the feature you wish to install. In this example we’ll find the Esri geodatabase libraries. They’re in the“Libs” section. Expand the “Libs” section by clicking on the + sign next to it.
1.2. Advanced Installation 17
QGIS Tutorials Documentation, Release 0.1
7. Scroll down until you find “gdal-filegdb” under the Package column.
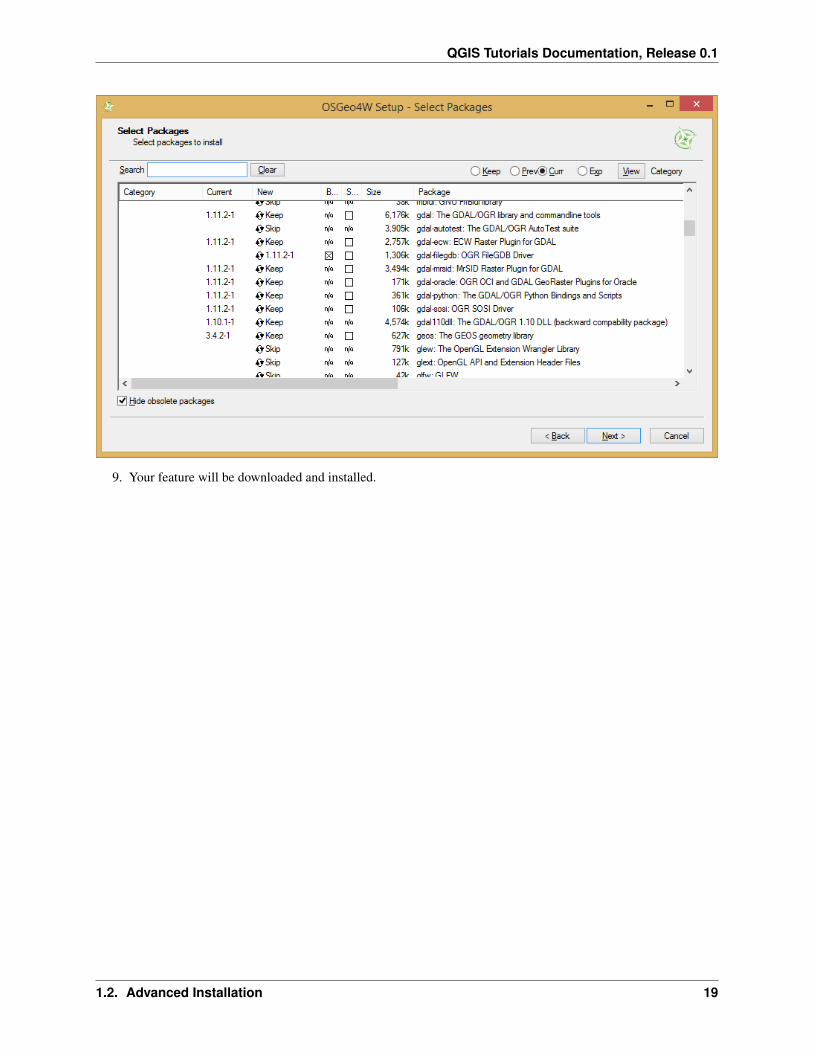
8. Click on the “Skip” under the “New” column and it will change to show the version to be installed. Then click“Next” at the bottom of the screen.
18 Chapter 1. Installation
QGIS Tutorials Documentation, Release 0.1
9. Your feature will be downloaded and installed.
1.2. Advanced Installation 19

QGIS Tutorials Documentation, Release 0.1
20 Chapter 1. Installation

CHAPTER 2
Basics
Much of QGIS should be familiar to those of you with existing GIS experience. Learning to work with QGIS will belargely a matter of learning where tools are located and possibly alternate names for them. The concepts are all thesame, and much of the functionality is as well.
There are some places where QGIS is better, or more flexible than ArcGIS, some places where you can accomplishtasks in QGIS freely that require higher level licenses in ArcGIS, and others where ArcGIS is the better tool (Cartog-raphy and map production).
2.1 Anatomy of QGIS
21

QGIS Tutorials Documentation, Release 0.1
The anatomy of QGIS is very similar to ArcMap
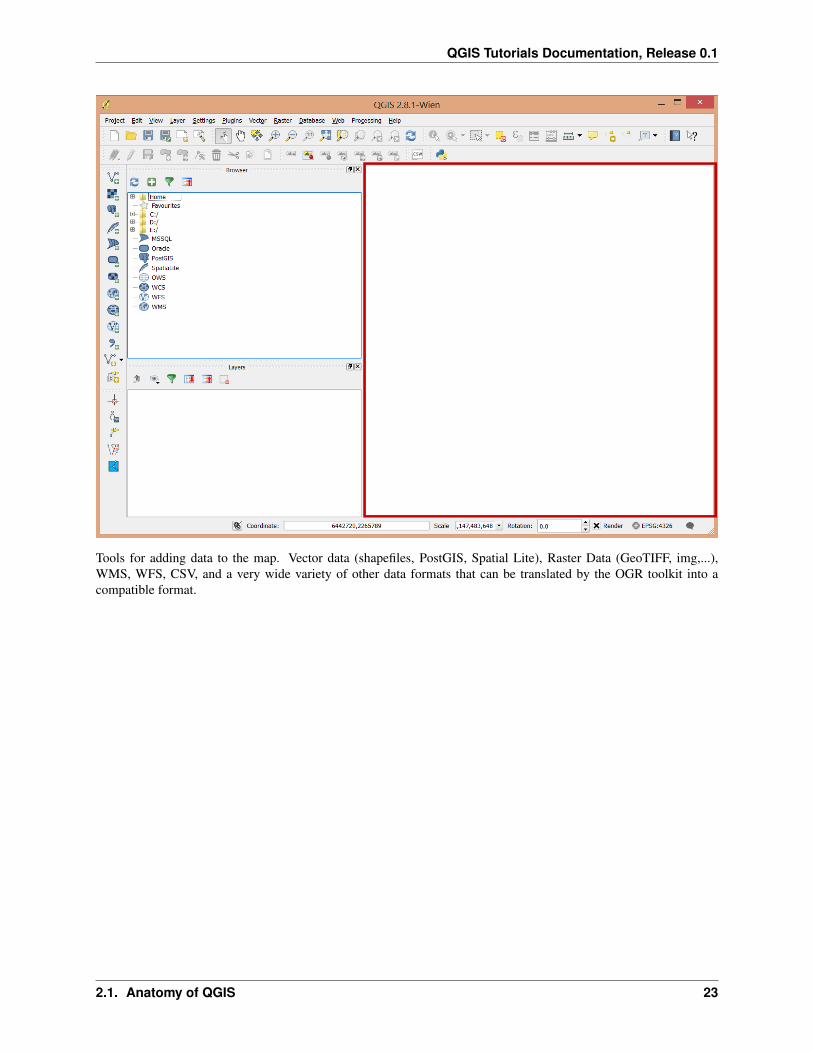
Many of the toolbars and windows are dockable so they may move around depending on how you set things up. Here’sa view of my version.
The Main Menu with access to settings, plugins, geoprocessing and raster processing menus.
The map.
22 Chapter 2. Basics
QGIS Tutorials Documentation, Release 0.1
Tools for adding data to the map. Vector data (shapefiles, PostGIS, Spatial Lite), Raster Data (GeoTIFF, img,...),WMS, WFS, CSV, and a very wide variety of other data formats that can be translated by the OGR toolkit into acompatible format.
2.1. Anatomy of QGIS 23
QGIS Tutorials Documentation, Release 0.1
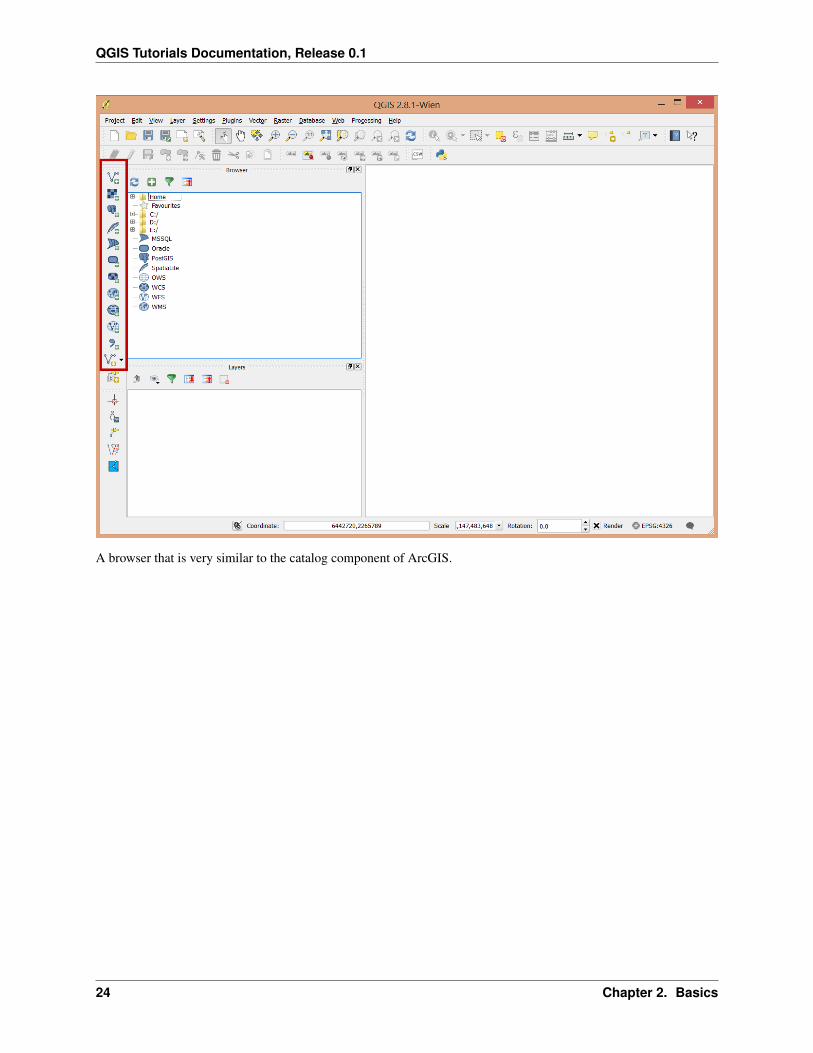
A browser that is very similar to the catalog component of ArcGIS.
24 Chapter 2. Basics
QGIS Tutorials Documentation, Release 0.1
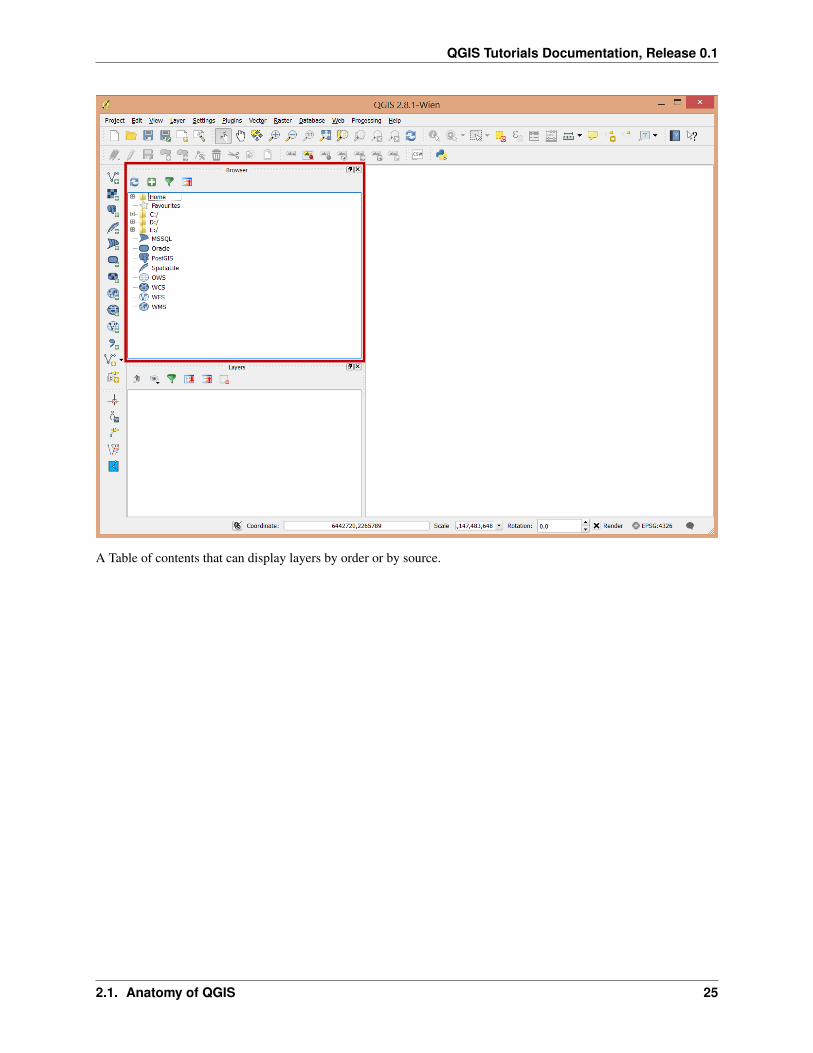
A Table of contents that can display layers by order or by source.
2.1. Anatomy of QGIS 25
QGIS Tutorials Documentation, Release 0.1
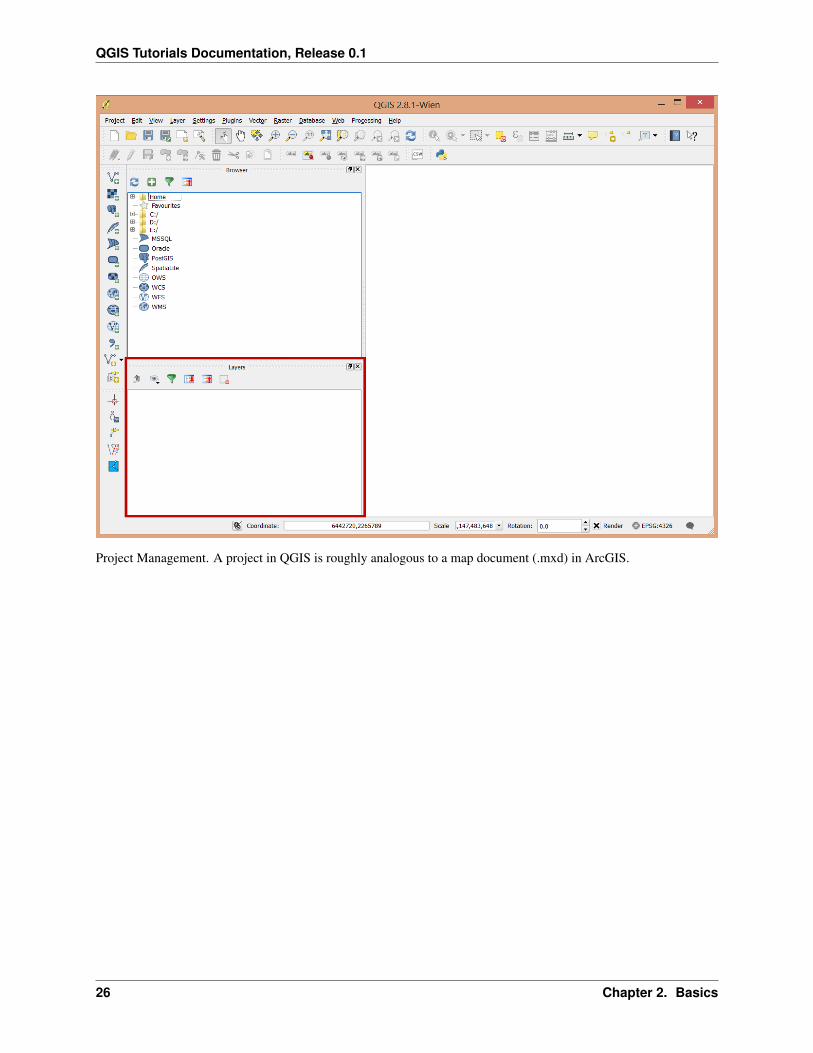
Project Management. A project in QGIS is roughly analogous to a map document (.mxd) in ArcGIS.
26 Chapter 2. Basics
QGIS Tutorials Documentation, Release 0.1
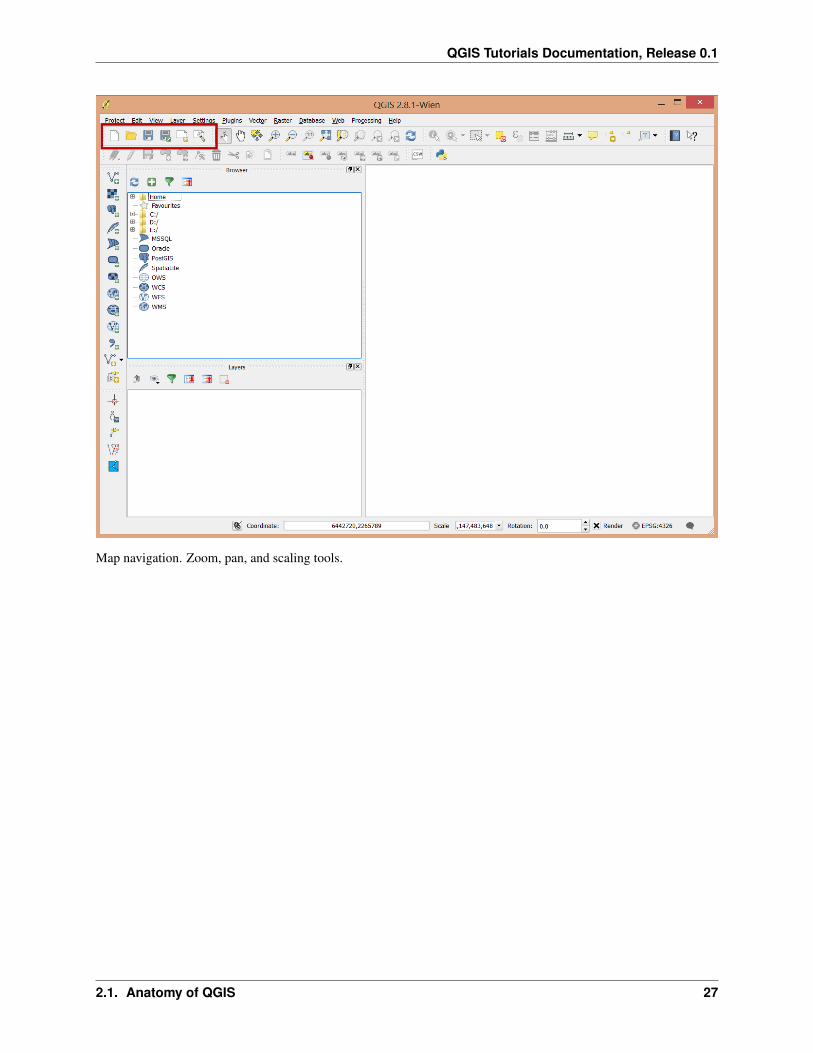
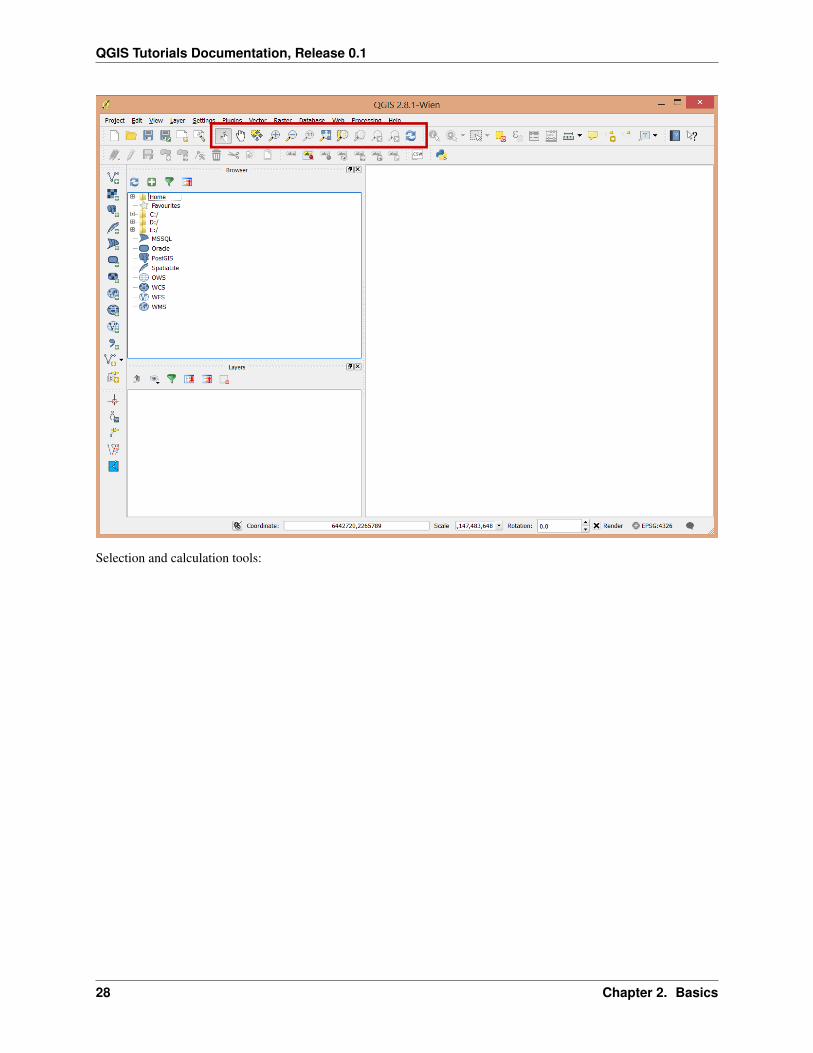
Map navigation. Zoom, pan, and scaling tools.
2.1. Anatomy of QGIS 27
QGIS Tutorials Documentation, Release 0.1
Selection and calculation tools:
28 Chapter 2. Basics

QGIS Tutorials Documentation, Release 0.1
Labeling tools
2.1. Anatomy of QGIS 29

QGIS Tutorials Documentation, Release 0.1
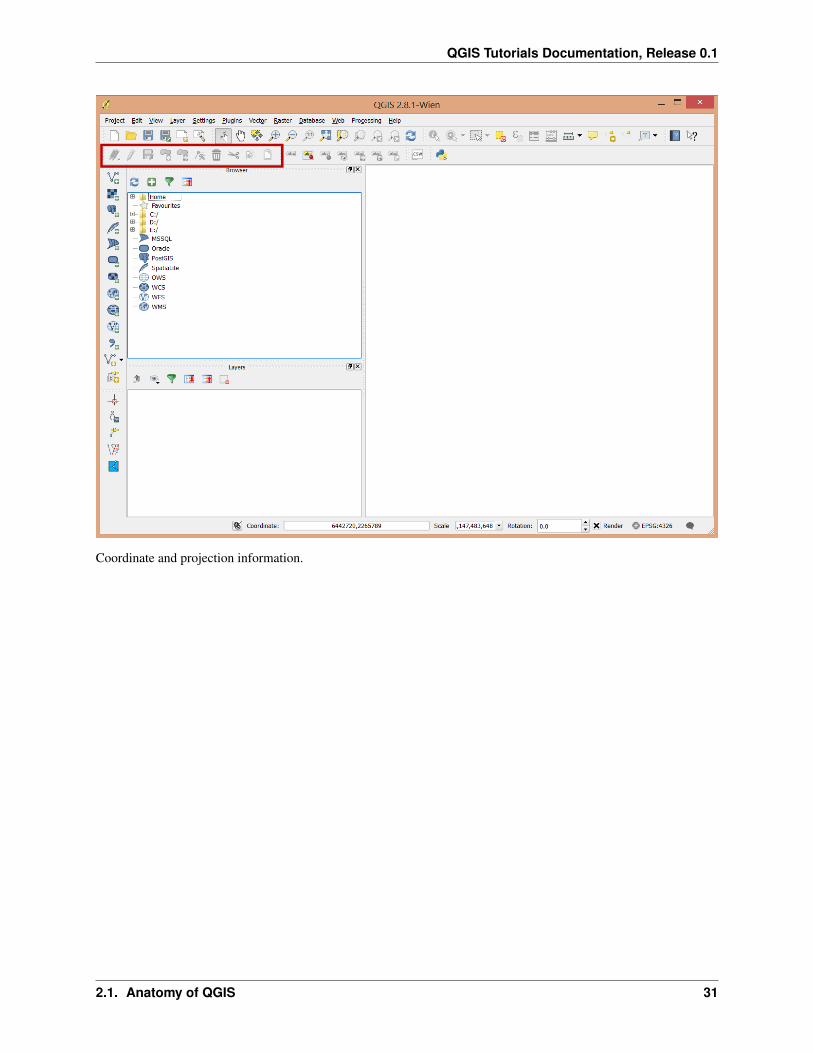
Editing tools
30 Chapter 2. Basics
QGIS Tutorials Documentation, Release 0.1
Coordinate and projection information.
2.1. Anatomy of QGIS 31

QGIS Tutorials Documentation, Release 0.1
2.2 Layers
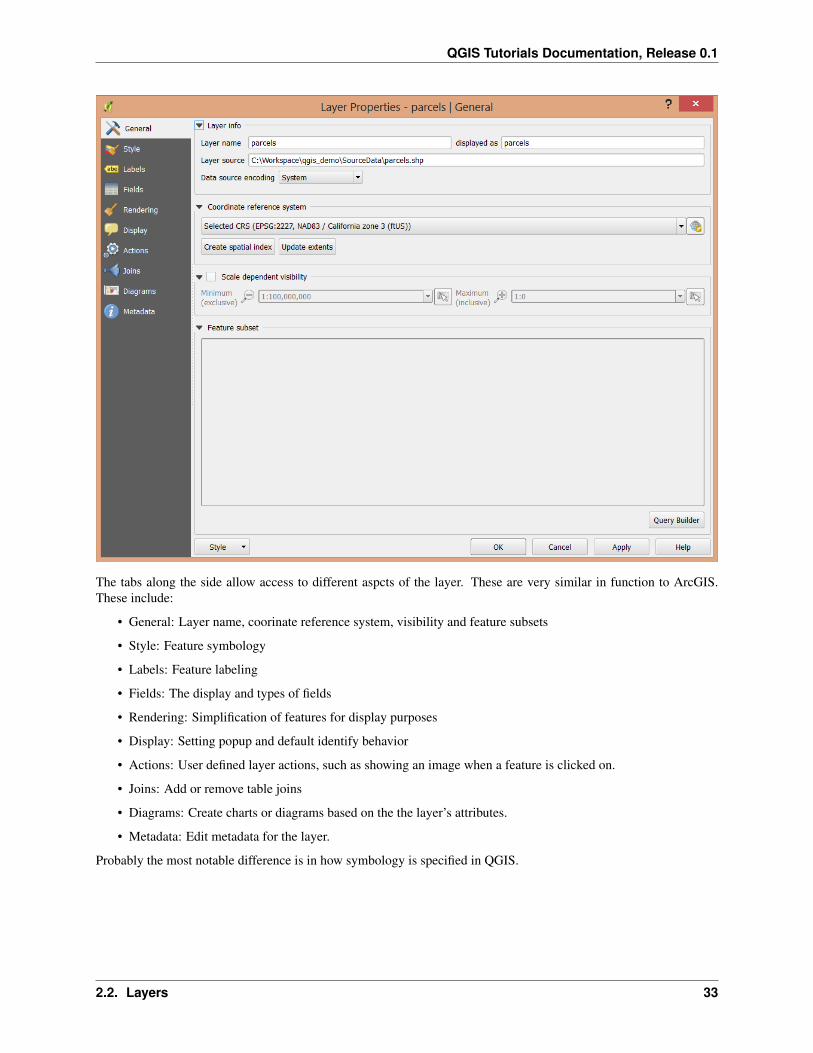
Once you’ve added a layer to the table of contents you can double click on it to get into it’s properties.
32 Chapter 2. Basics
QGIS Tutorials Documentation, Release 0.1
The tabs along the side allow access to different aspcts of the layer. These are very similar in function to ArcGIS.These include:
• General: Layer name, coorinate reference system, visibility and feature subsets
• Style: Feature symbology
• Labels: Feature labeling
• Fields: The display and types of fields
• Rendering: Simplification of features for display purposes
• Display: Setting popup and default identify behavior
• Actions: User defined layer actions, such as showing an image when a feature is clicked on.
• Joins: Add or remove table joins
• Diagrams: Create charts or diagrams based on the the layer’s attributes.
• Metadata: Edit metadata for the layer.
Probably the most notable difference is in how symbology is specified in QGIS.
2.2. Layers 33

QGIS Tutorials Documentation, Release 0.1
There are seven types of symbology for vector layers:
• Single symbol, Categorized, and Graduated. These first three behave much as you’d expect.
• Rule-based allows you to specify individual rules for displaying features.
• Point displacement is for specifying the displacement of points based on feature attributes.
• Inverted Polygons, styles everything outside of the features. This is useful for drop shadows or area boundaries.
• The Heatmap renderer generates dynamic heatmaps for point or multipoint layers.
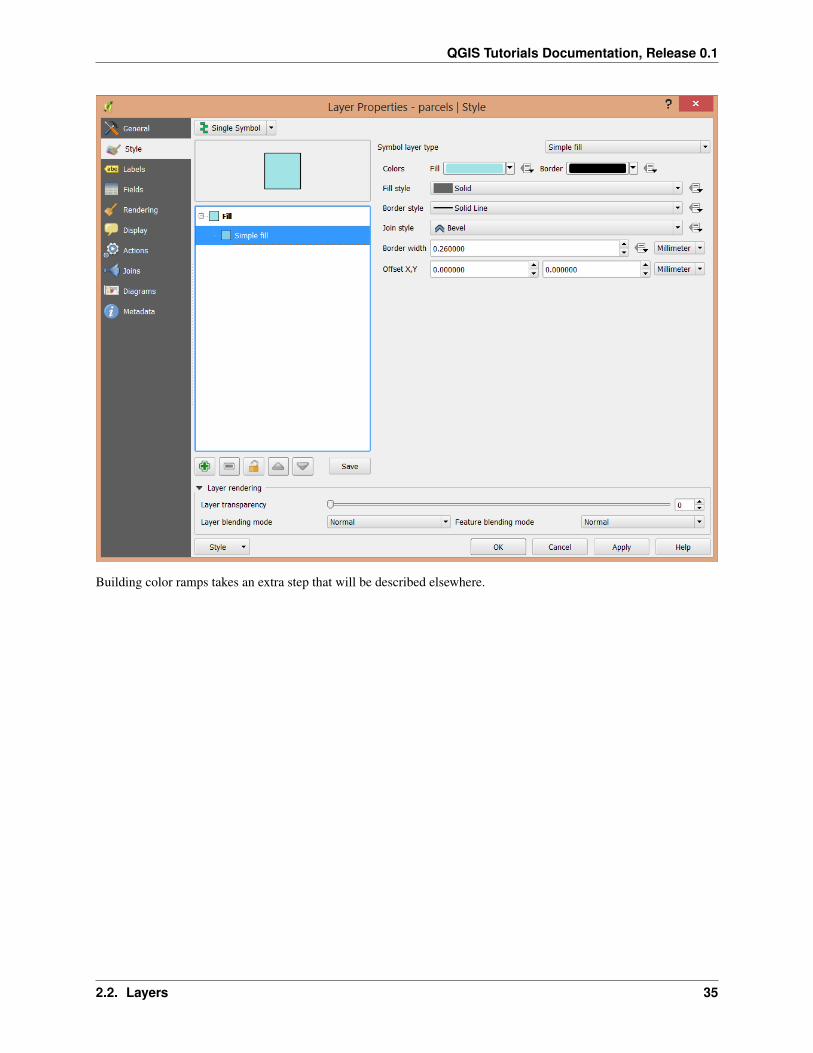
Setting the symbols takes some getting used to. You’ll need to specify the fill and the boundary. “No Pen” and “NoBrush” are use to indicate that there is either no fill or no outline on features.
34 Chapter 2. Basics
QGIS Tutorials Documentation, Release 0.1
Building color ramps takes an extra step that will be described elsewhere.
2.2. Layers 35

QGIS Tutorials Documentation, Release 0.1
36 Chapter 2. Basics

CHAPTER 3
Projections
Projections take a bit of getting used to in QGIS if you’re used to ArcGIS. Most projections are dealt with throughspecifying their EPSG codes.
QGIS does have a very useful set of tools for searching for and specifying projections and unlike ArcGIS we can turnreprojection on the fly on and off easily.
37
QGIS Tutorials Documentation, Release 0.1
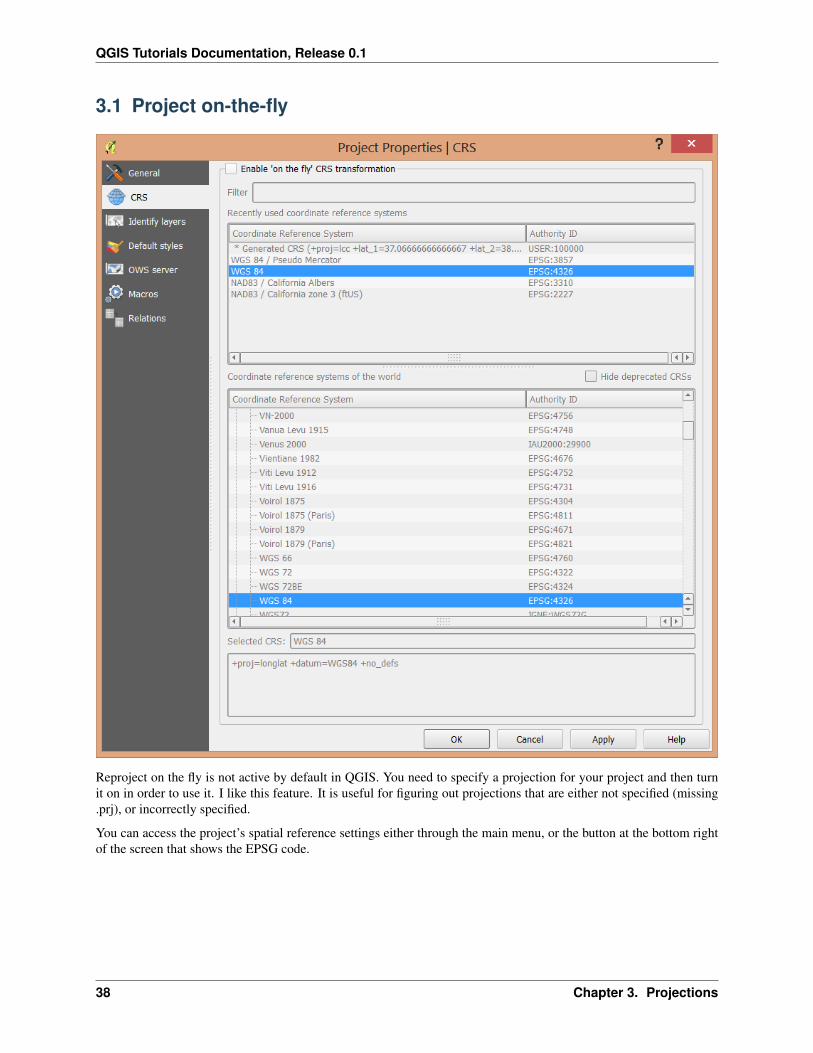
3.1 Project on-the-fly
Reproject on the fly is not active by default in QGIS. You need to specify a projection for your project and then turnit on in order to use it. I like this feature. It is useful for figuring out projections that are either not specified (missing.prj), or incorrectly specified.
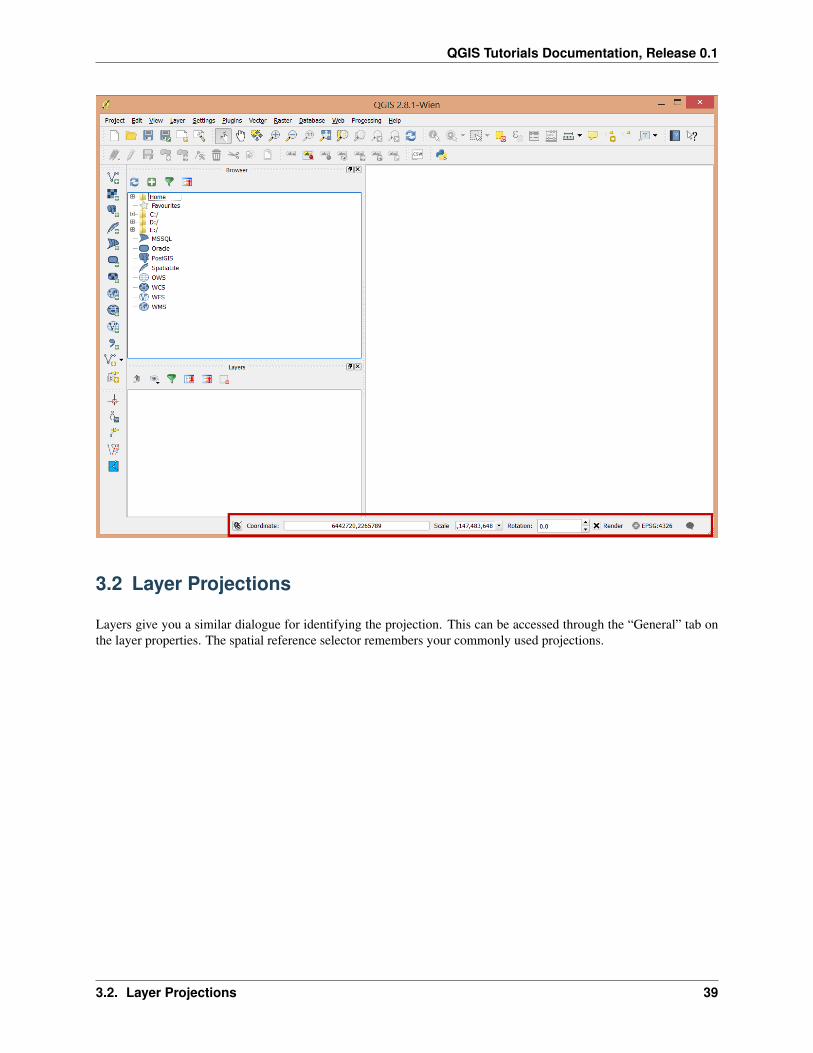
You can access the project’s spatial reference settings either through the main menu, or the button at the bottom rightof the screen that shows the EPSG code.
38 Chapter 3. Projections
QGIS Tutorials Documentation, Release 0.1
3.2 Layer Projections
Layers give you a similar dialogue for identifying the projection. This can be accessed through the “General” tab onthe layer properties. The spatial reference selector remembers your commonly used projections.
3.2. Layer Projections 39
QGIS Tutorials Documentation, Release 0.1
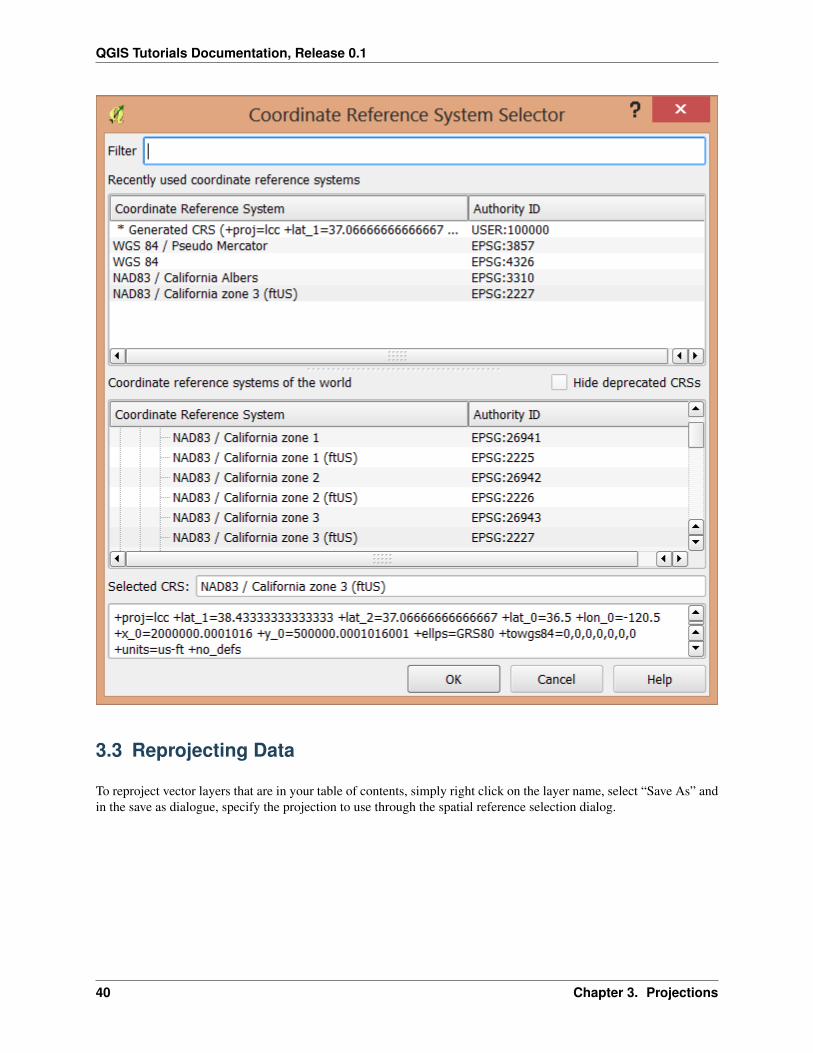
3.3 Reprojecting Data
To reproject vector layers that are in your table of contents, simply right click on the layer name, select “Save As” andin the save as dialogue, specify the projection to use through the spatial reference selection dialog.
40 Chapter 3. Projections
QGIS Tutorials Documentation, Release 0.1
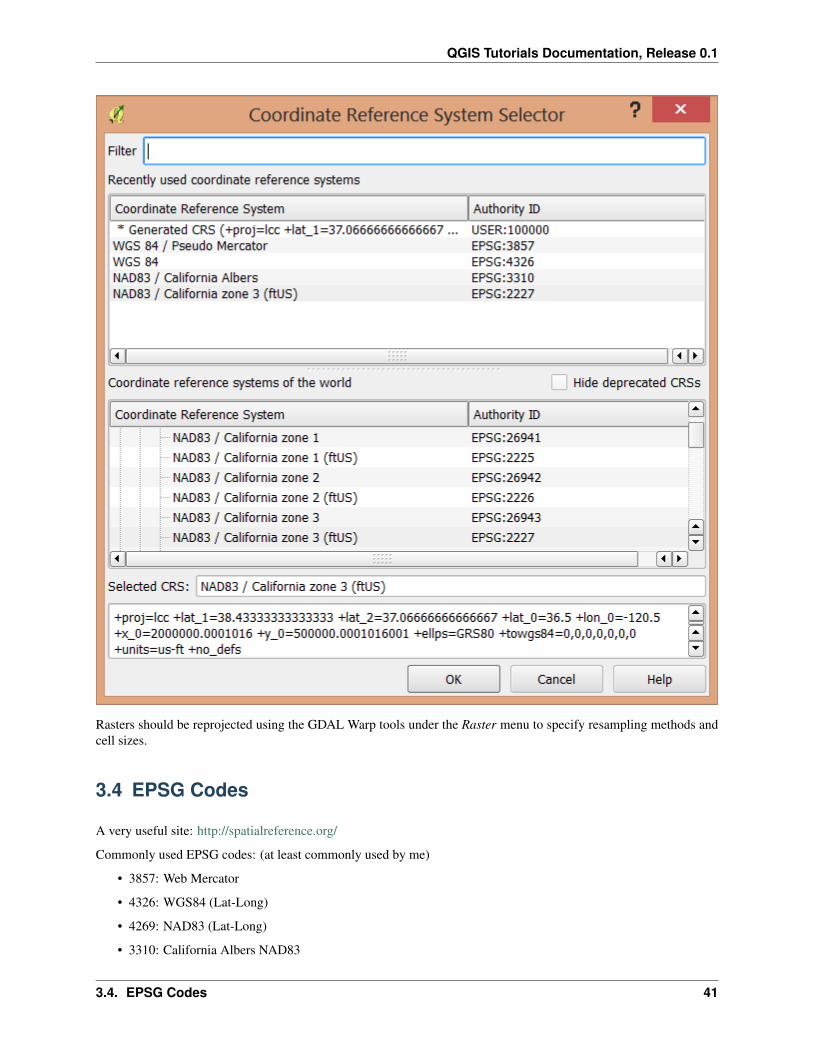
Rasters should be reprojected using the GDAL Warp tools under the Raster menu to specify resampling methods andcell sizes.
3.4 EPSG Codes
A very useful site: http://spatialreference.org/
Commonly used EPSG codes: (at least commonly used by me)
• 3857: Web Mercator
• 4326: WGS84 (Lat-Long)
• 4269: NAD83 (Lat-Long)
• 3310: California Albers NAD83
3.4. EPSG Codes 41
QGIS Tutorials Documentation, Release 0.1
• 3309: California Albers NAD27
• 2225: NAD83, California State Plane Zone 1(US Feet)
• 2226: NAD83, California State Plane Zone 2(US Feet)
• 2227: NAD83, California State Plane Zone 3(US Feet)
• 2228: NAD83, California State Plane Zone 4(US Feet)
• 2229: NAD83, California State Plane Zone 5(US Feet)
• 2230: NAD83, California State Plane Zone 6(US Feet)
42 Chapter 3. Projections
CHAPTER 4
Tables
Tables work very similarly to ArcGIS
The data used below is available at: Link
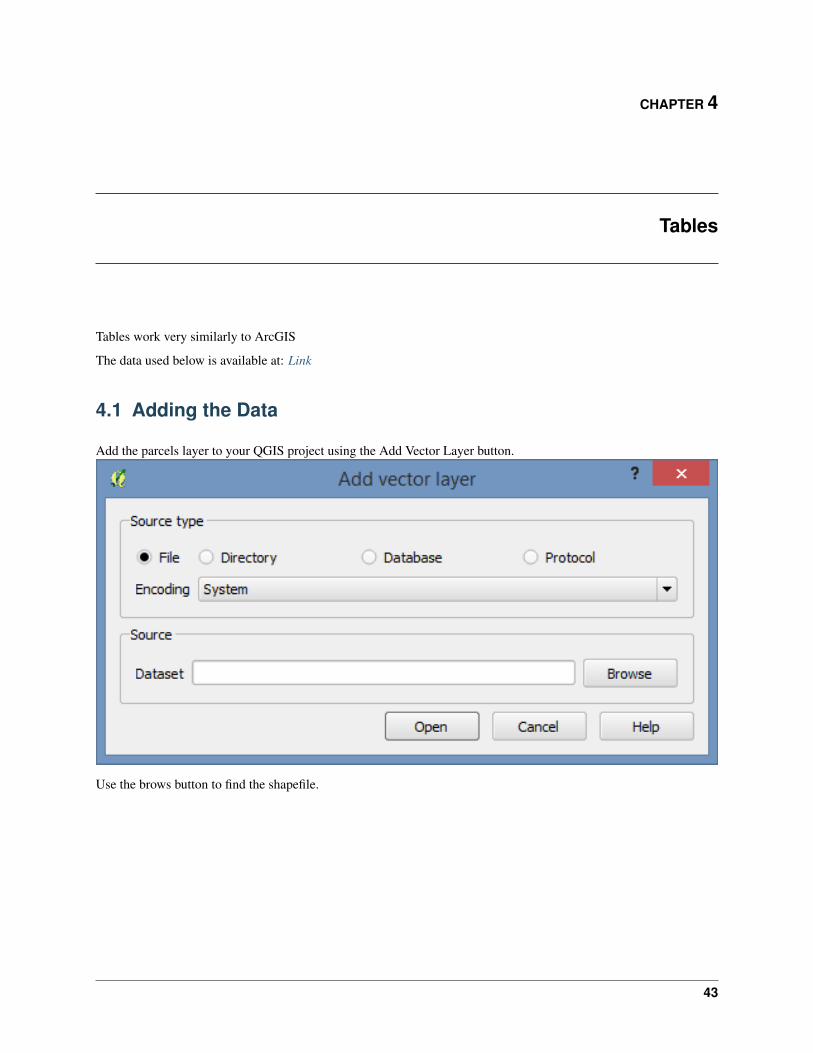
4.1 Adding the Data
Add the parcels layer to your QGIS project using the Add Vector Layer button.
Use the brows button to find the shapefile.
43
QGIS Tutorials Documentation, Release 0.1
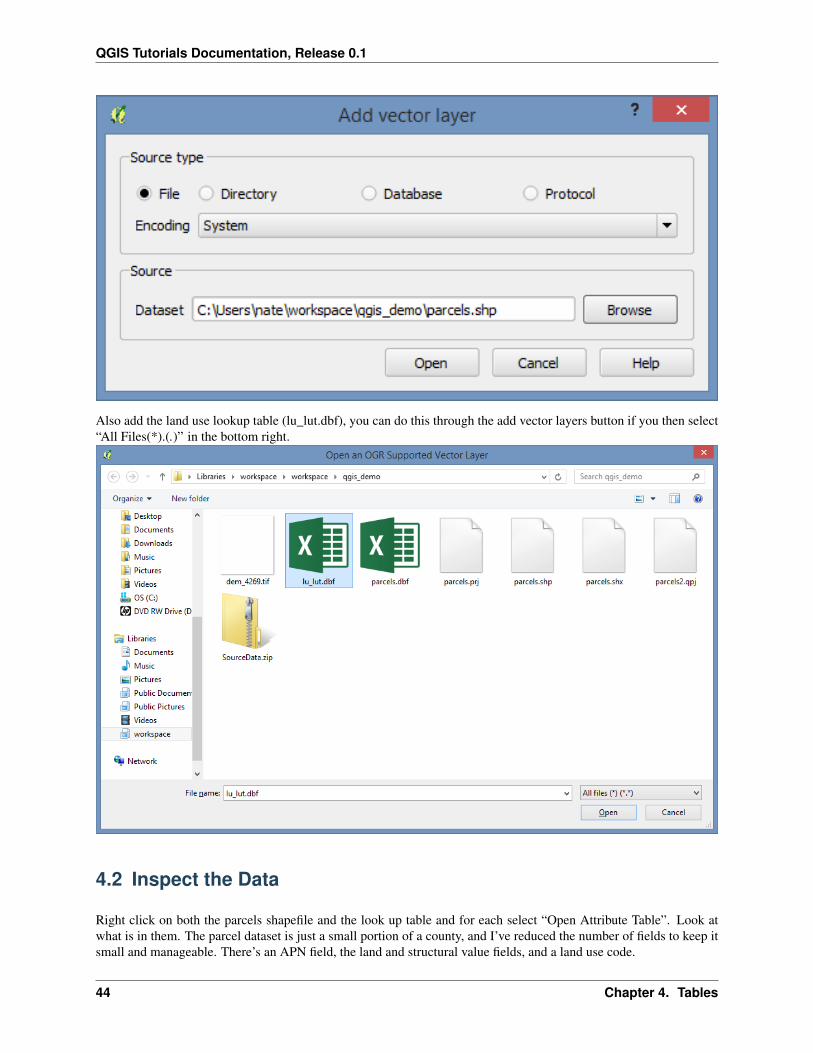
Also add the land use lookup table (lu_lut.dbf), you can do this through the add vector layers button if you then select“All Files(*).(.)” in the bottom right.
4.2 Inspect the Data
Right click on both the parcels shapefile and the look up table and for each select “Open Attribute Table”. Look atwhat is in them. The parcel dataset is just a small portion of a county, and I’ve reduced the number of fields to keep itsmall and manageable. There’s an APN field, the land and structural value fields, and a land use code.
44 Chapter 4. Tables
QGIS Tutorials Documentation, Release 0.1
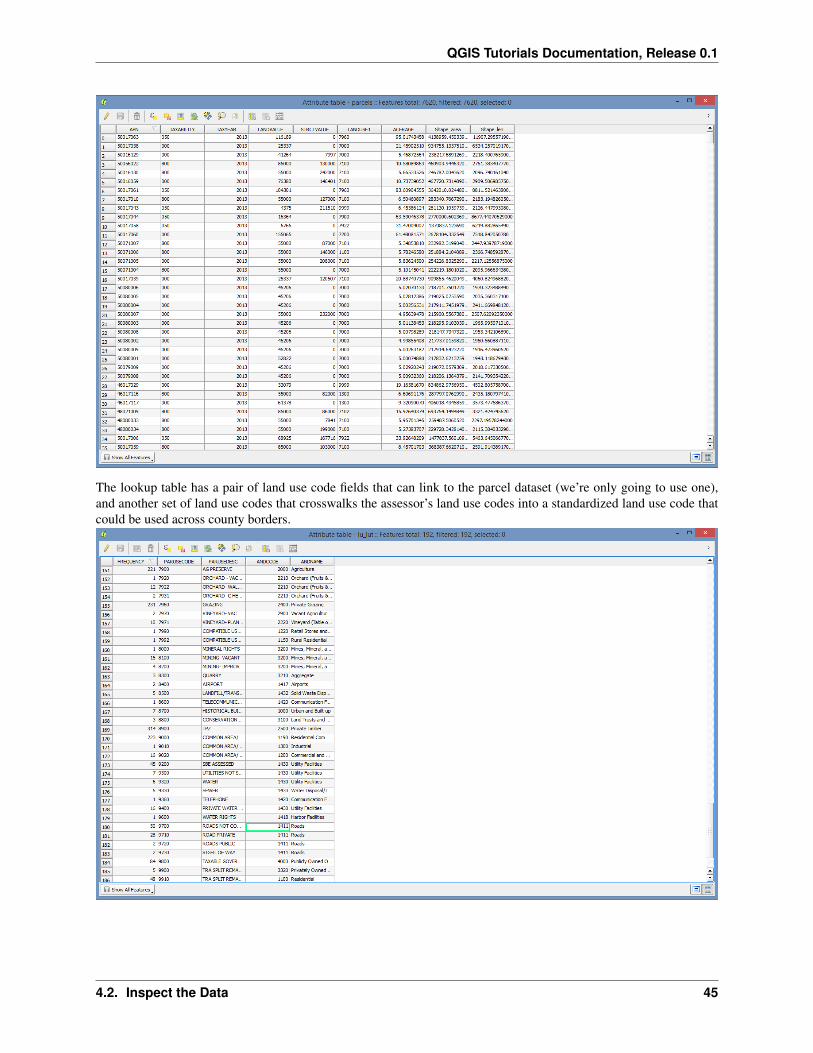
The lookup table has a pair of land use code fields that can link to the parcel dataset (we’re only going to use one),and another set of land use codes that crosswalks the assessor’s land use codes into a standardized land use code thatcould be used across county borders.
4.2. Inspect the Data 45

QGIS Tutorials Documentation, Release 0.1
4.3 Joining Tables
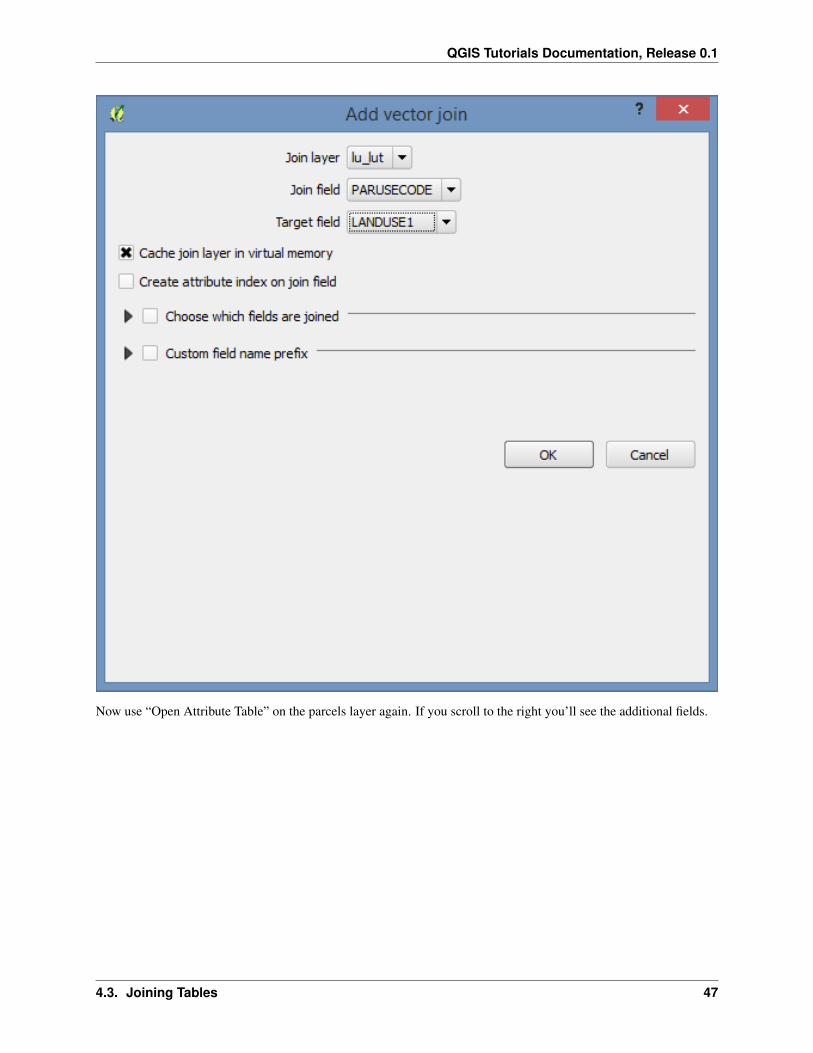
Double click on the parcel layer to open the layer’s properties, and then click on the “Joins” tab on the left side.
Now click on the little green plus sign near the bottom. Fill out the menu:
• Join Layer: lu_lut
• Join Field: PARUSECODE
• Target Field: LANDUSE1
46 Chapter 4. Tables
QGIS Tutorials Documentation, Release 0.1
Now use “Open Attribute Table” on the parcels layer again. If you scroll to the right you’ll see the additional fields.
4.3. Joining Tables 47
QGIS Tutorials Documentation, Release 0.1
4.4 Symbolize
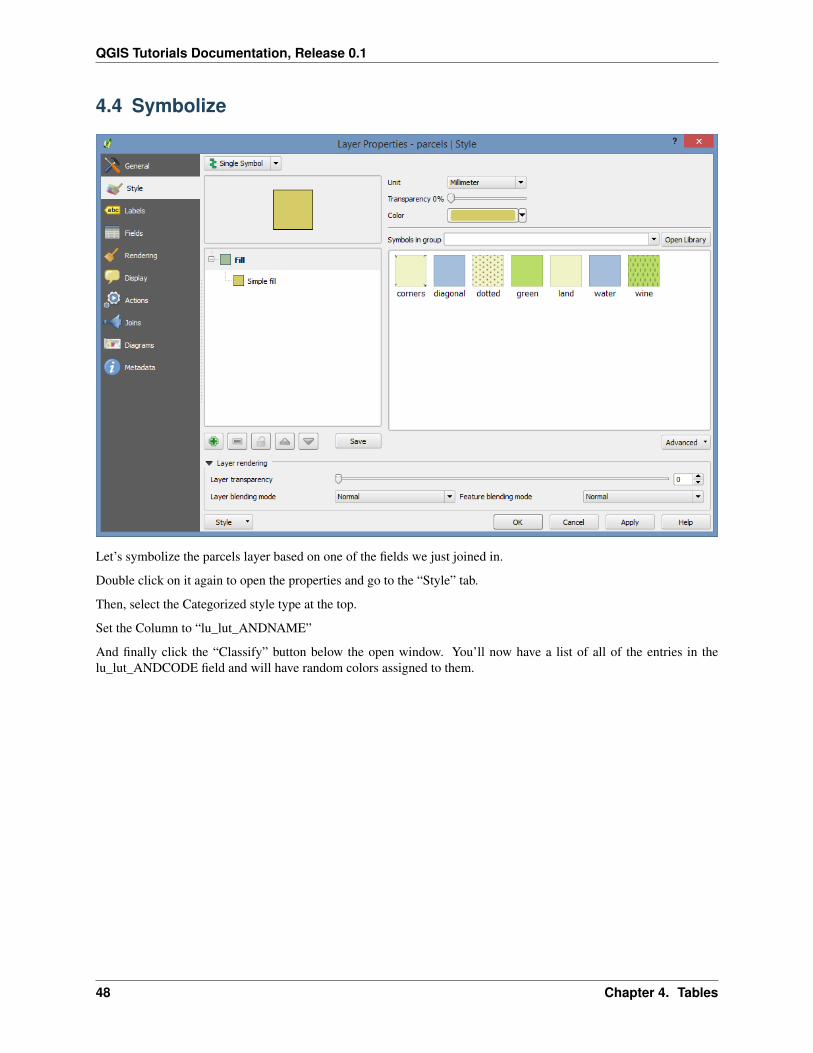
Let’s symbolize the parcels layer based on one of the fields we just joined in.
Double click on it again to open the properties and go to the “Style” tab.
Then, select the Categorized style type at the top.
Set the Column to “lu_lut_ANDNAME”
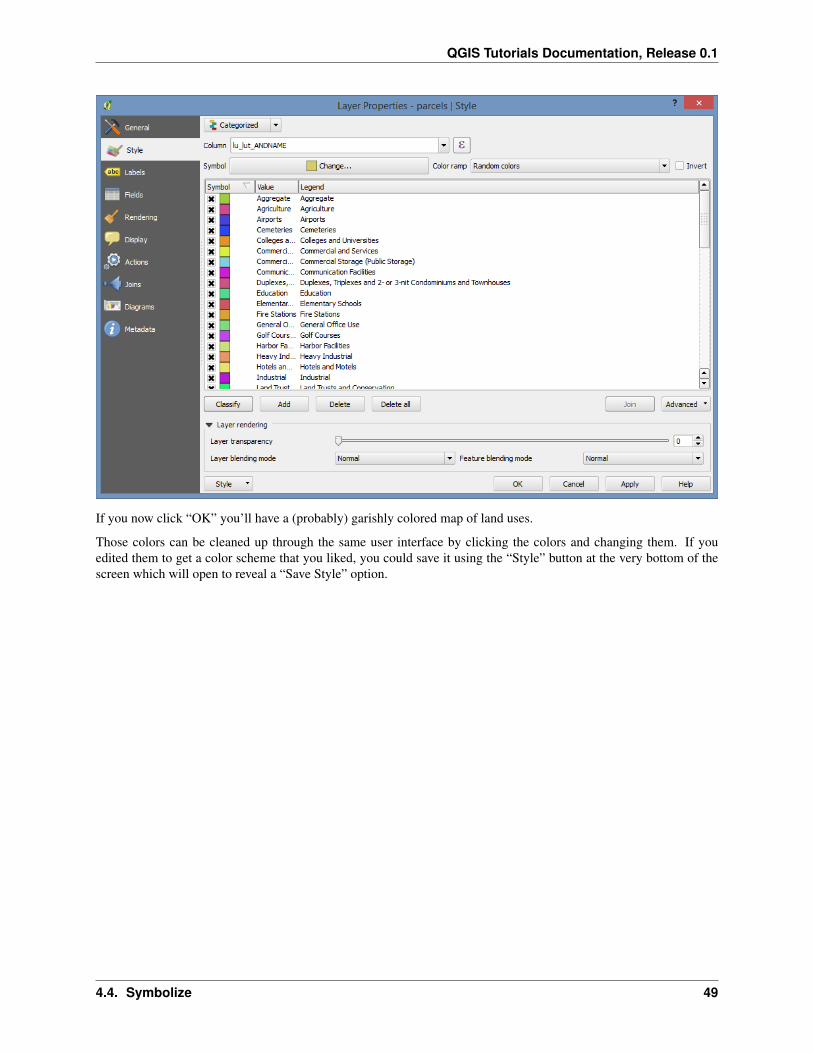
And finally click the “Classify” button below the open window. You’ll now have a list of all of the entries in thelu_lut_ANDCODE field and will have random colors assigned to them.
48 Chapter 4. Tables
QGIS Tutorials Documentation, Release 0.1
If you now click “OK” you’ll have a (probably) garishly colored map of land uses.
Those colors can be cleaned up through the same user interface by clicking the colors and changing them. If youedited them to get a color scheme that you liked, you could save it using the “Style” button at the very bottom of thescreen which will open to reveal a “Save Style” option.
4.4. Symbolize 49

QGIS Tutorials Documentation, Release 0.1
50 Chapter 4. Tables
CHAPTER 5
Editing
Editing in QGIS uses an edit session much like ArcGIS does. Both attributes and geometries can be edited.
5.1 Calculating an Attribute
Add the parcel data to the project if it isn’t already there. If you’re continuing on from the last example, remove anyjoins using the layer properties to keep things simple.
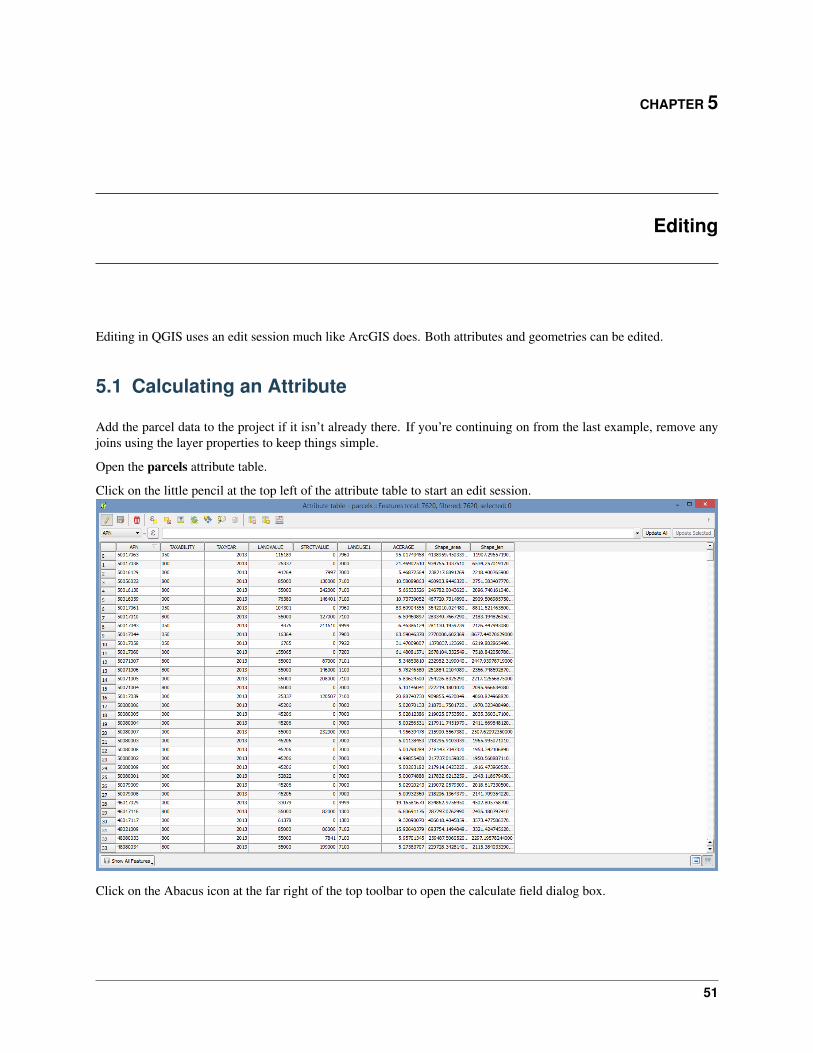
Open the parcels attribute table.
Click on the little pencil at the top left of the attribute table to start an edit session.
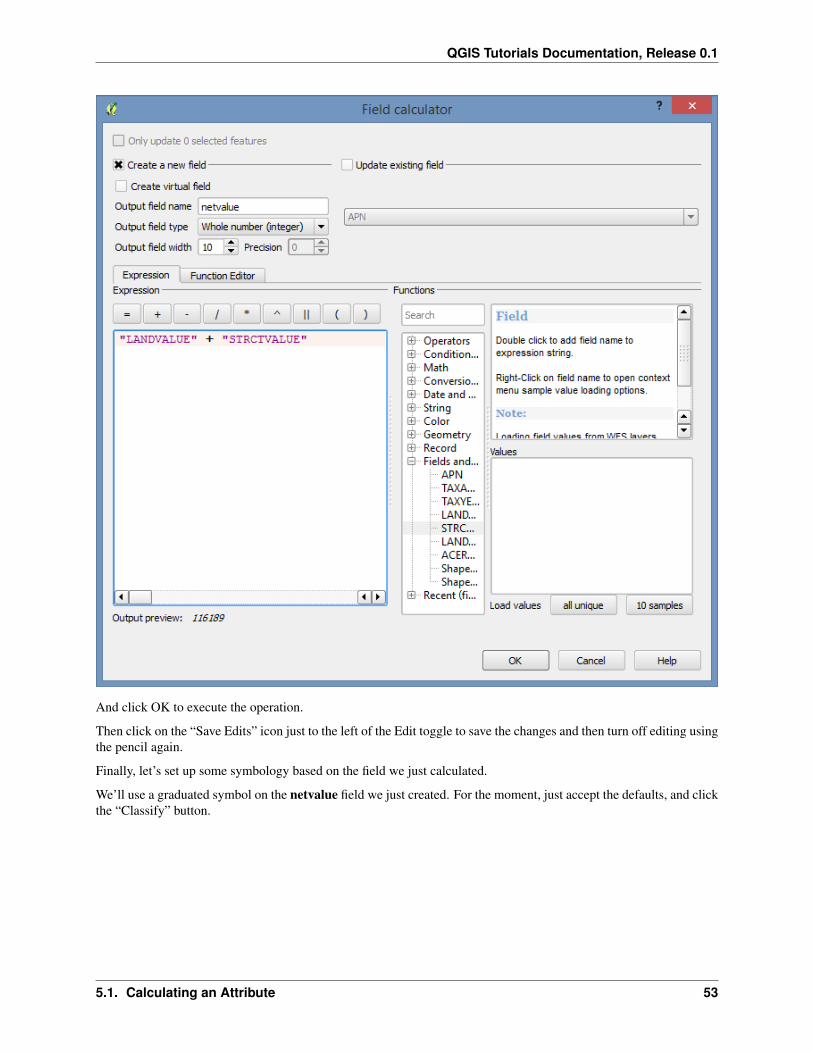
Click on the Abacus icon at the far right of the top toolbar to open the calculate field dialog box.
51

QGIS Tutorials Documentation, Release 0.1
And then fill out the form. We can have it perform the calculation into a new field that will be created to hold theresult. An example is shown below.
52 Chapter 5. Editing
QGIS Tutorials Documentation, Release 0.1
And click OK to execute the operation.
Then click on the “Save Edits” icon just to the left of the Edit toggle to save the changes and then turn off editing usingthe pencil again.
Finally, let’s set up some symbology based on the field we just calculated.
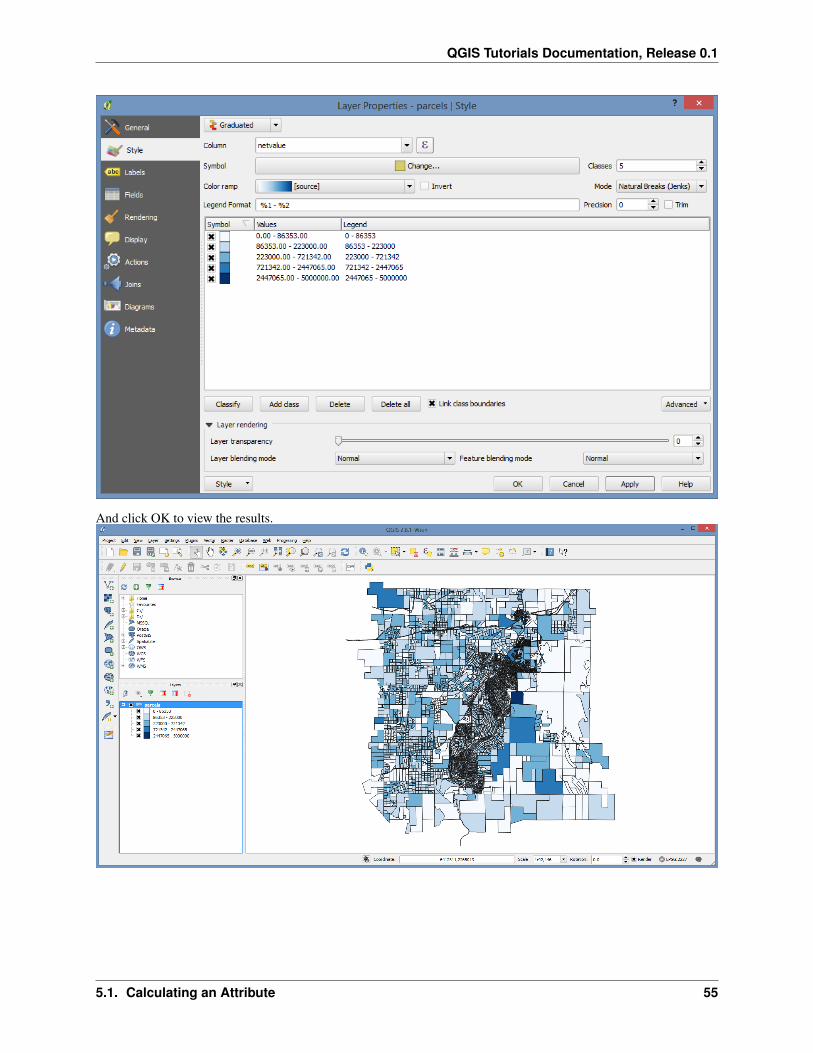
We’ll use a graduated symbol on the netvalue field we just created. For the moment, just accept the defaults, and clickthe “Classify” button.
5.1. Calculating an Attribute 53

QGIS Tutorials Documentation, Release 0.1
Then click “OK” to view the results on the map.
That’s really not so interesting to view, so let’s fix it a bit. Go back into the Style editor (Layer Properties).
And pick the “Natural Breaks” mode on the right side to use the “Jenks” method for splitting the data into the numberof classes selected (default = 5).
54 Chapter 5. Editing
QGIS Tutorials Documentation, Release 0.1
And click OK to view the results.
5.1. Calculating an Attribute 55
QGIS Tutorials Documentation, Release 0.1
5.2 Geometry Editing
Editing geometries should be similar to what you’re accustomed to. The feature templates that are available in ArcGISaren’t present in QGIS, but the basic editing tools are available, and highly functional.
Snapping controls are available through the Settings menu.
5.2.1 Splitting a Feature
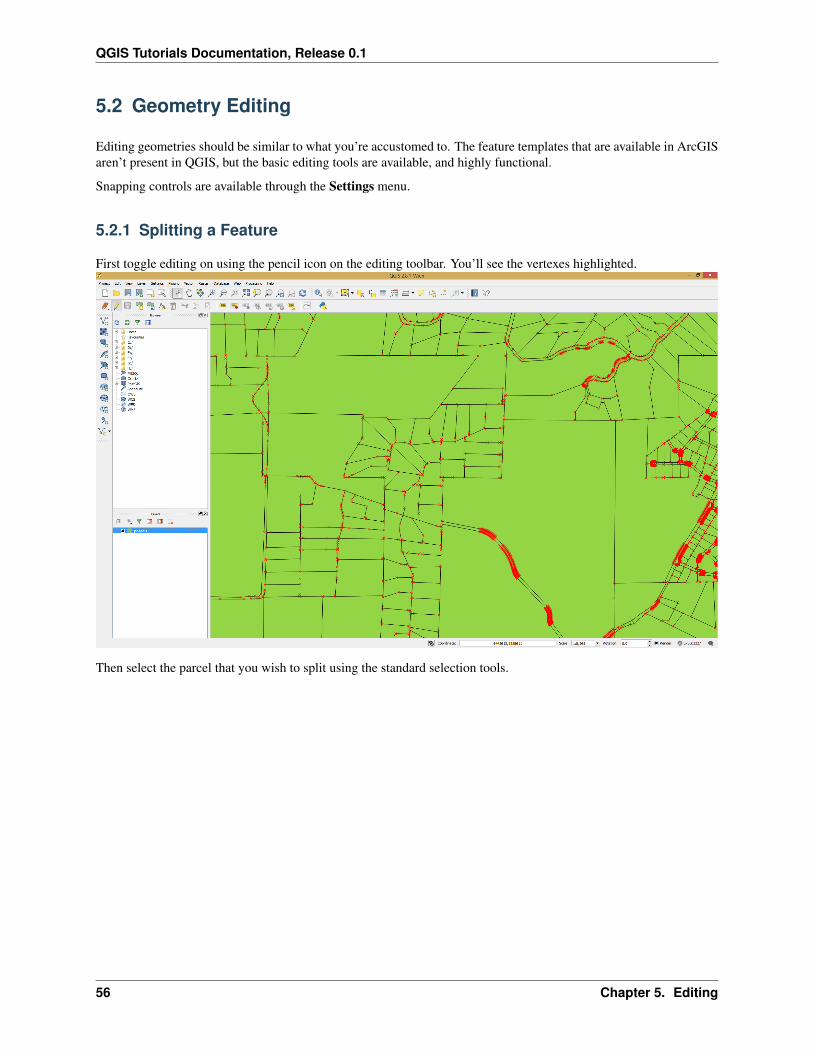
First toggle editing on using the pencil icon on the editing toolbar. You’ll see the vertexes highlighted.
Then select the parcel that you wish to split using the standard selection tools.
56 Chapter 5. Editing
QGIS Tutorials Documentation, Release 0.1
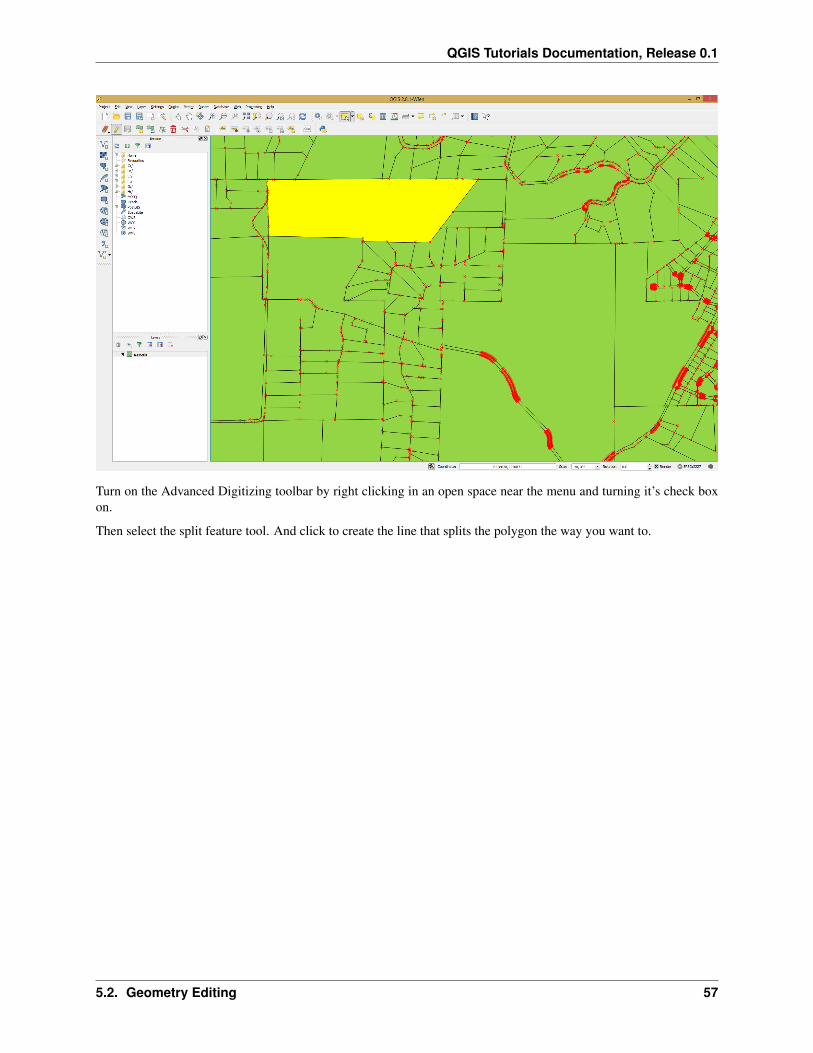
Turn on the Advanced Digitizing toolbar by right clicking in an open space near the menu and turning it’s check boxon.
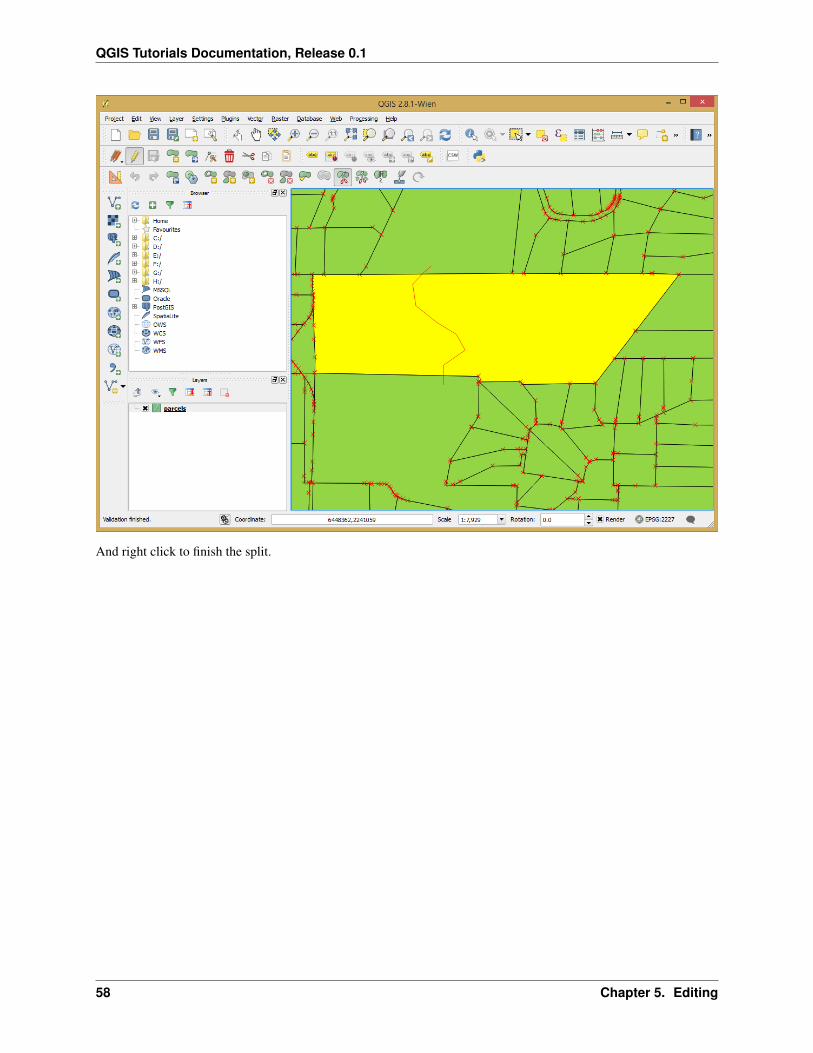
Then select the split feature tool. And click to create the line that splits the polygon the way you want to.
5.2. Geometry Editing 57
QGIS Tutorials Documentation, Release 0.1
And right click to finish the split.
58 Chapter 5. Editing
QGIS Tutorials Documentation, Release 0.1
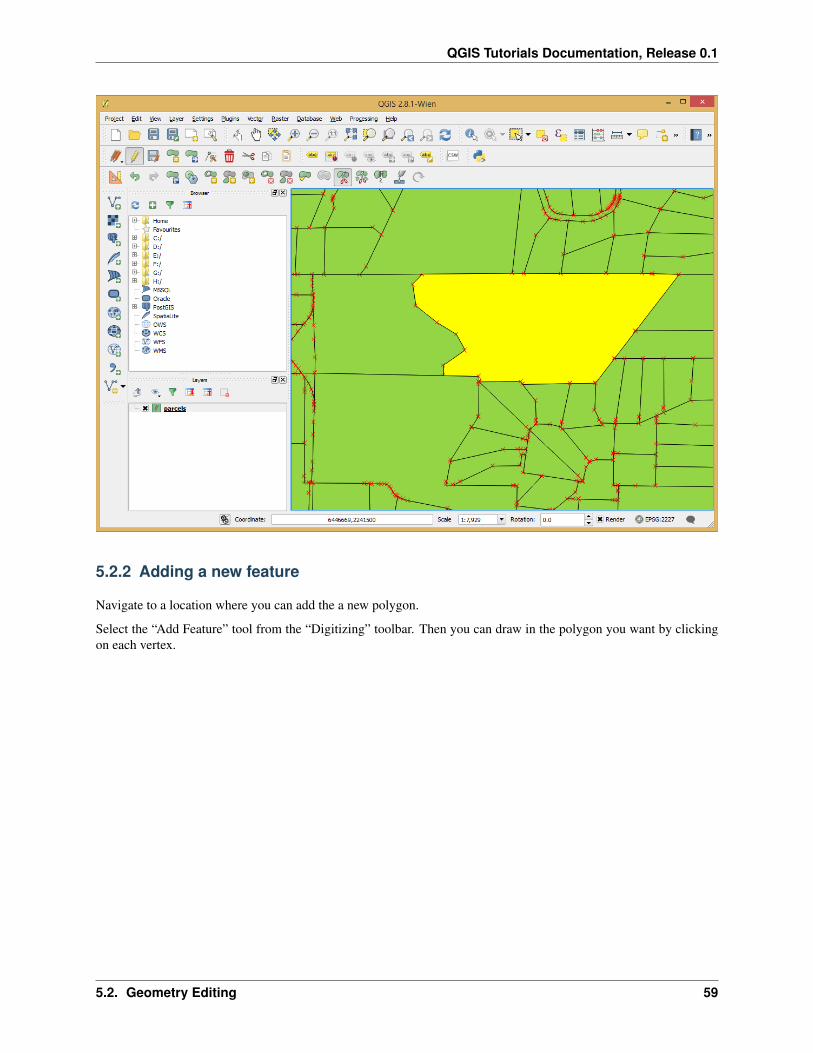
5.2.2 Adding a new feature
Navigate to a location where you can add the a new polygon.
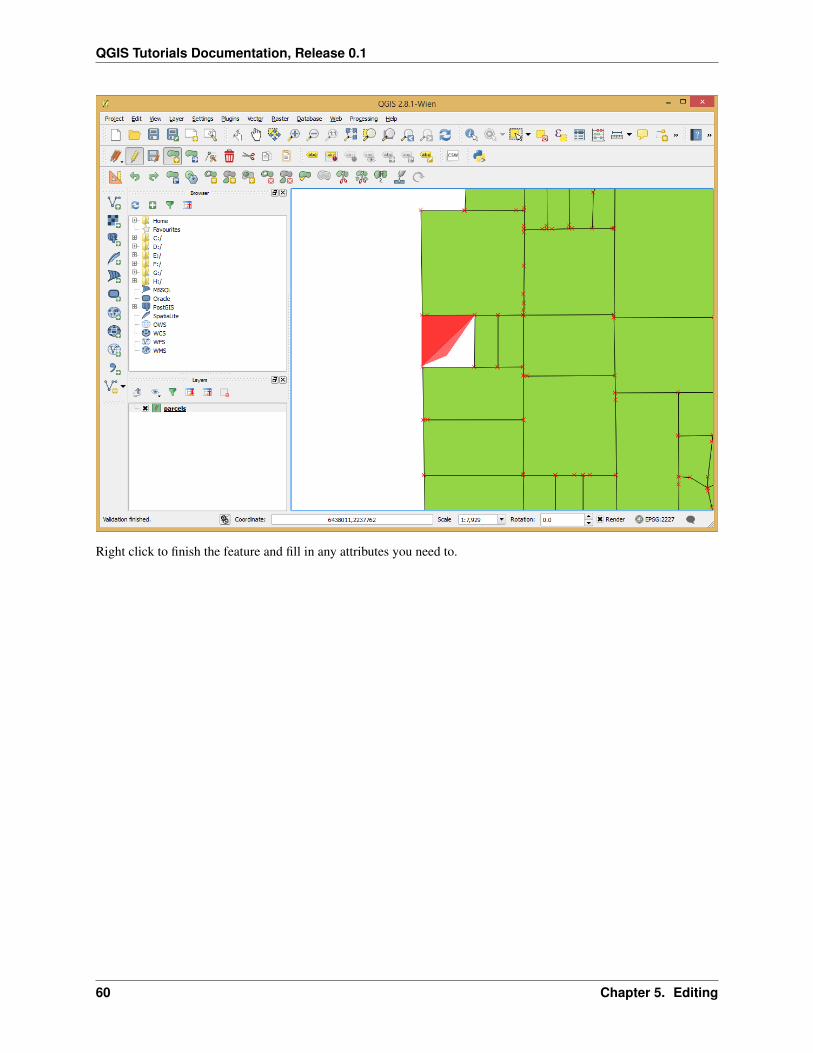
Select the “Add Feature” tool from the “Digitizing” toolbar. Then you can draw in the polygon you want by clickingon each vertex.
5.2. Geometry Editing 59
QGIS Tutorials Documentation, Release 0.1
Right click to finish the feature and fill in any attributes you need to.
60 Chapter 5. Editing
QGIS Tutorials Documentation, Release 0.1
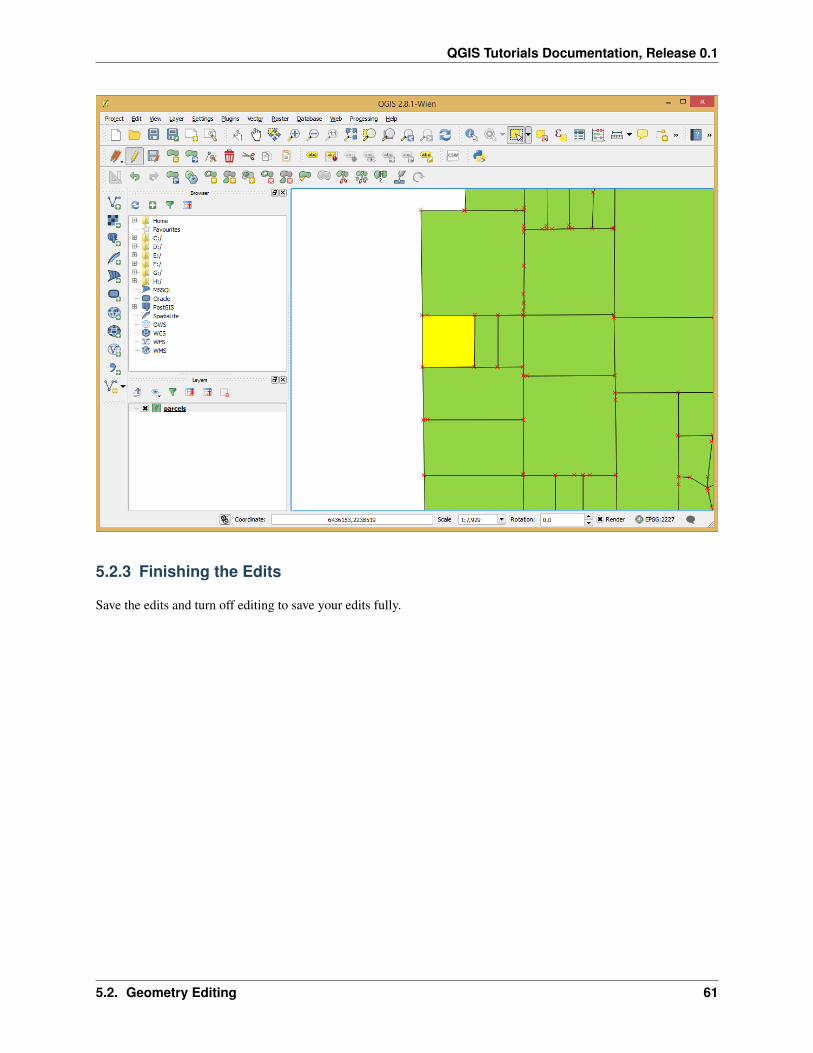
5.2.3 Finishing the Edits
Save the edits and turn off editing to save your edits fully.
5.2. Geometry Editing 61

QGIS Tutorials Documentation, Release 0.1
62 Chapter 5. Editing

CHAPTER 6
Geoprocessing
The concepts for geoprocessing are very similar to those you’ve learned in ArcGIS. All of the common methods areavailable:
• Intersect
• Union
• Buffer
• Clip
• Difference
• Dissolve
These are all located under the Vector menu.
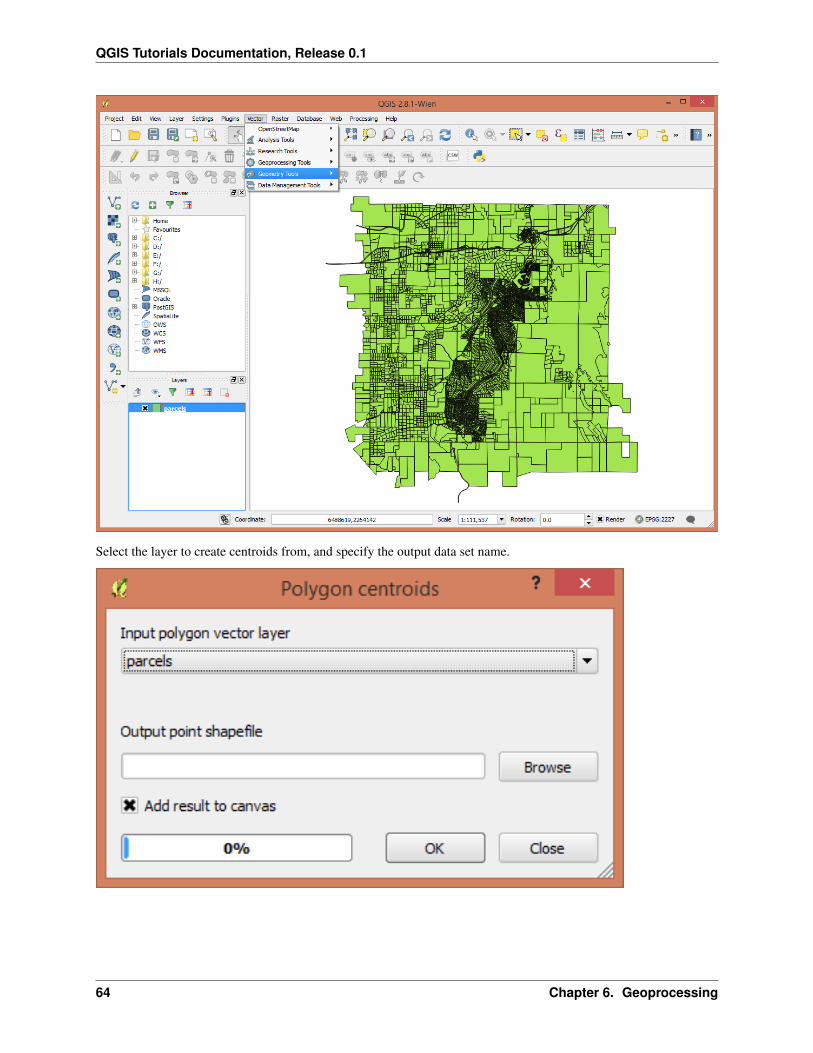
6.1 Create Polygon Centroids
Add the parcels layer to your project.
Under Vector select Geometry Tools and then Polygon Centroids.
The image below doesn’t show the last portion of menu tree.
63
QGIS Tutorials Documentation, Release 0.1
Select the layer to create centroids from, and specify the output data set name.
64 Chapter 6. Geoprocessing
QGIS Tutorials Documentation, Release 0.1
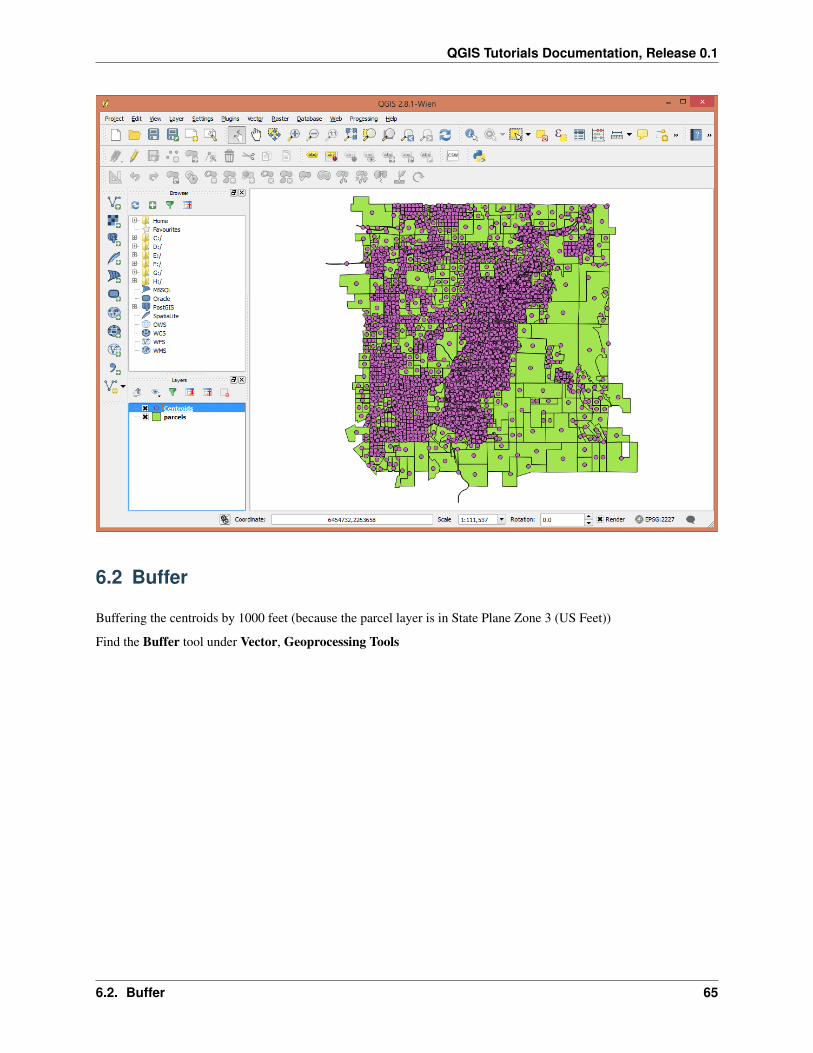
6.2 Buffer
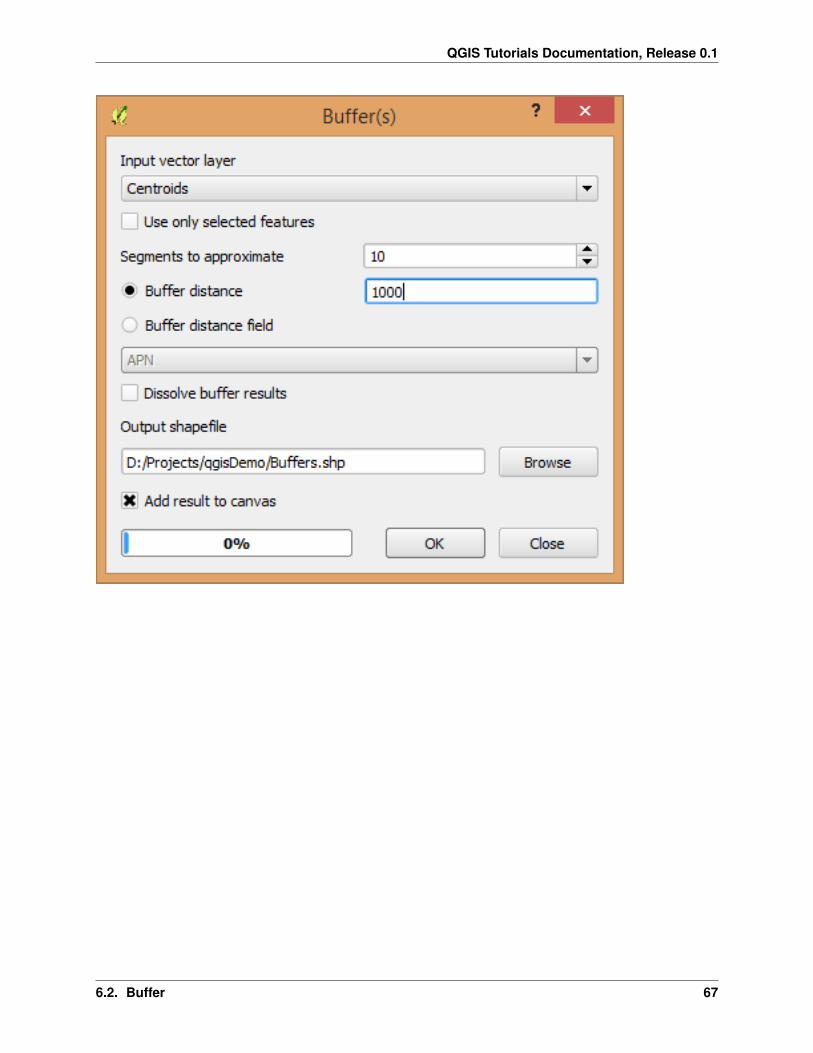
Buffering the centroids by 1000 feet (because the parcel layer is in State Plane Zone 3 (US Feet))
Find the Buffer tool under Vector, Geoprocessing Tools
6.2. Buffer 65
QGIS Tutorials Documentation, Release 0.1
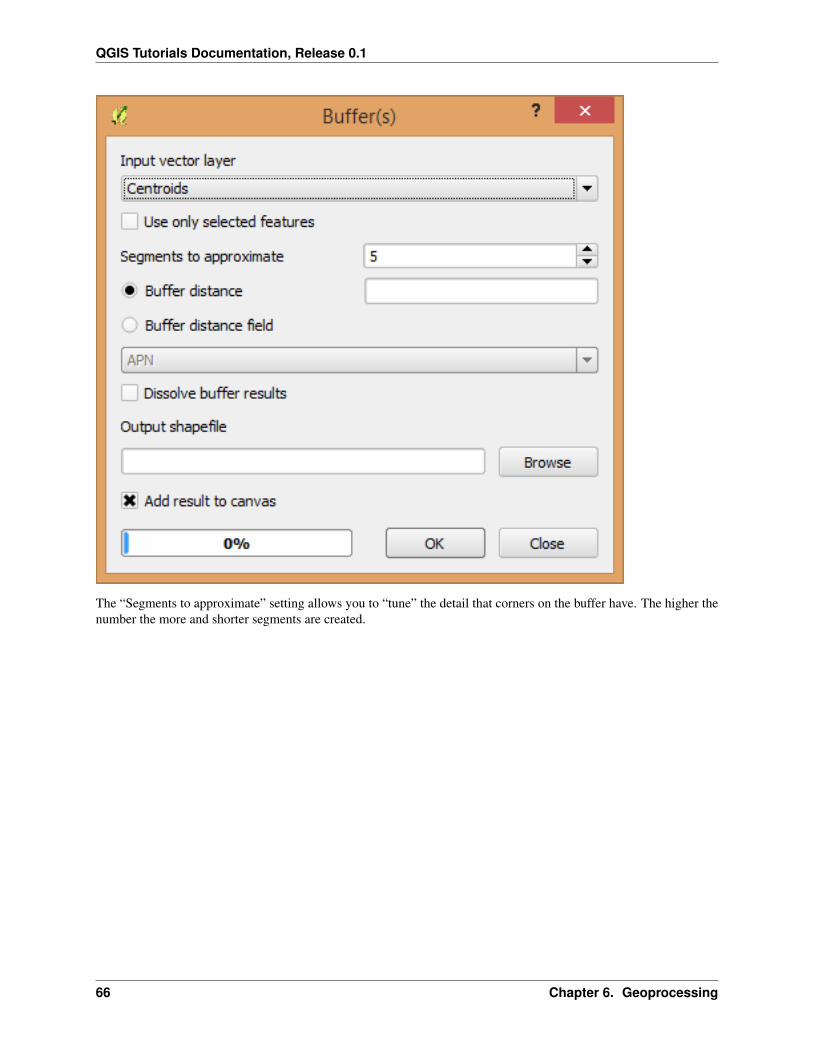
The “Segments to approximate” setting allows you to “tune” the detail that corners on the buffer have. The higher thenumber the more and shorter segments are created.
66 Chapter 6. Geoprocessing
QGIS Tutorials Documentation, Release 0.1
6.2. Buffer 67
QGIS Tutorials Documentation, Release 0.1
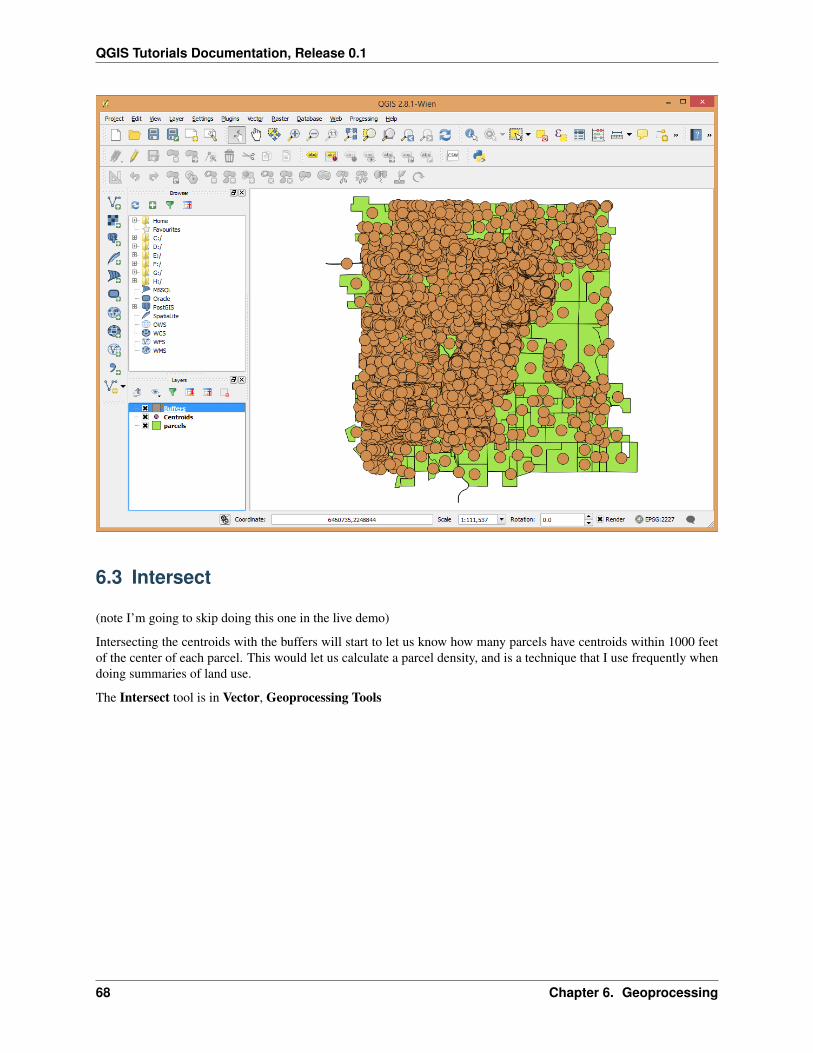
6.3 Intersect
(note I’m going to skip doing this one in the live demo)
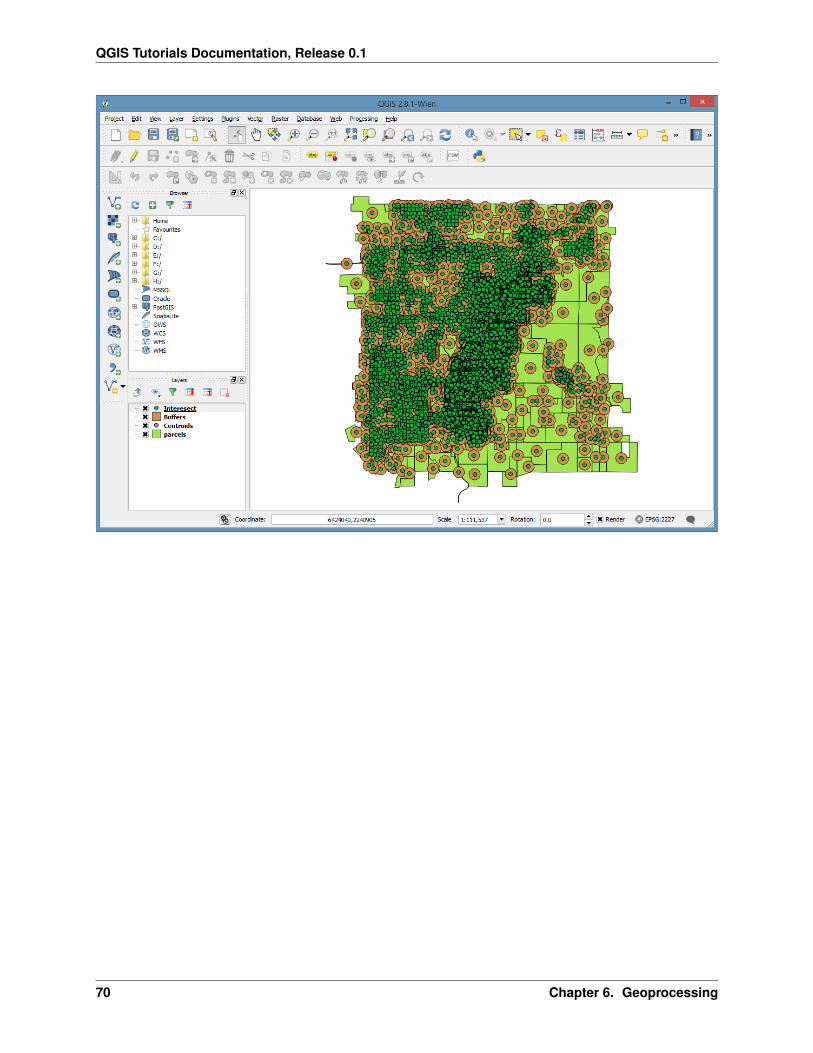
Intersecting the centroids with the buffers will start to let us know how many parcels have centroids within 1000 feetof the center of each parcel. This would let us calculate a parcel density, and is a technique that I use frequently whendoing summaries of land use.
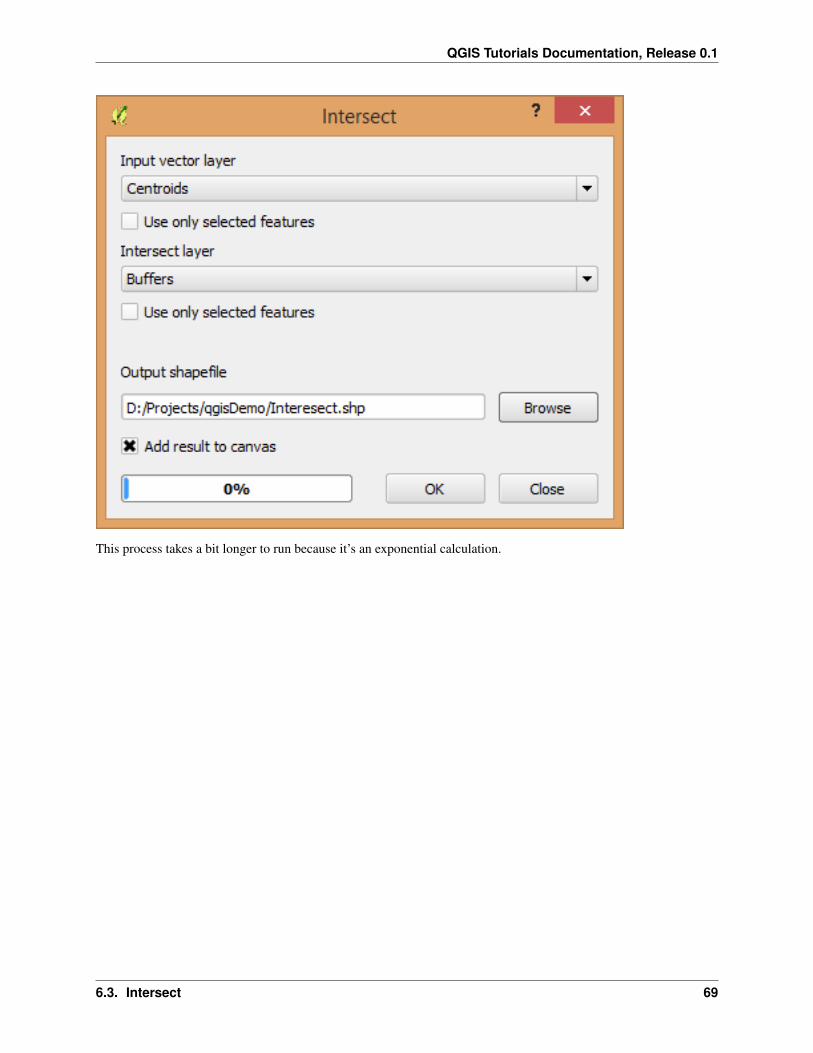
The Intersect tool is in Vector, Geoprocessing Tools
68 Chapter 6. Geoprocessing
QGIS Tutorials Documentation, Release 0.1
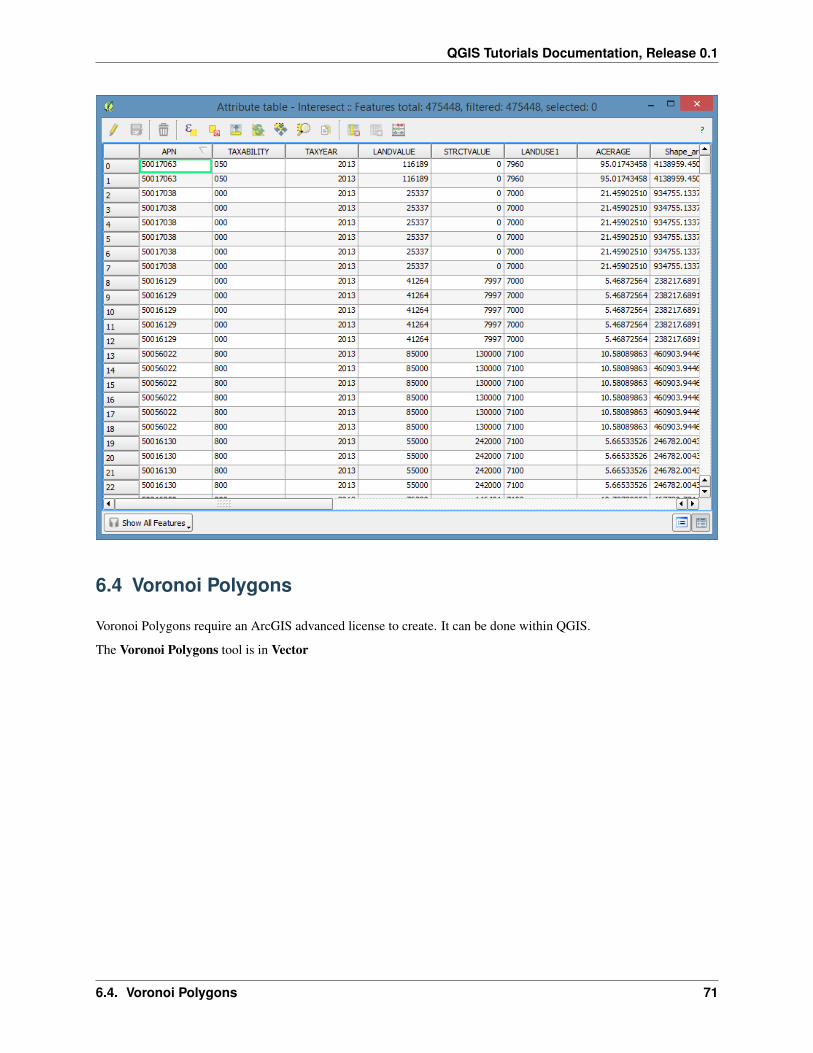
This process takes a bit longer to run because it’s an exponential calculation.
6.3. Intersect 69
QGIS Tutorials Documentation, Release 0.1
70 Chapter 6. Geoprocessing
QGIS Tutorials Documentation, Release 0.1
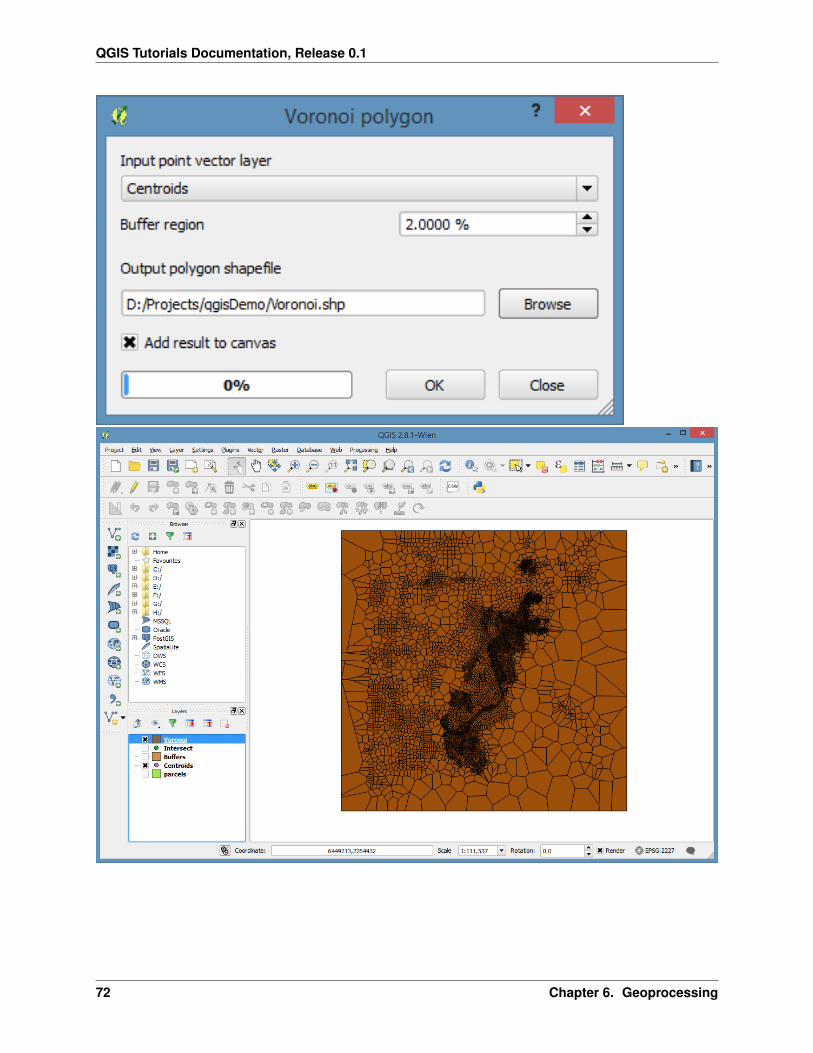
6.4 Voronoi Polygons
Voronoi Polygons require an ArcGIS advanced license to create. It can be done within QGIS.
The Voronoi Polygons tool is in Vector
6.4. Voronoi Polygons 71
QGIS Tutorials Documentation, Release 0.1
72 Chapter 6. Geoprocessing

QGIS Tutorials Documentation, Release 0.1
6.5 SpatialLite and PostGIS
One of the really powerful features of QGIS is the ability to link directly to SpatialLite and PostGIS databases. Thisallows the use of complex spatial queries that may take many steps to complete through the linking of individualGeoprocessing steps.
6.5. SpatialLite and PostGIS 73

QGIS Tutorials Documentation, Release 0.1
74 Chapter 6. Geoprocessing
CHAPTER 7
Rasters
All of these examples will start from the dem_4269.Tif raster in the demo dataset.
Start by adding dem_4269.tif to an empty project. Bonus points if you can tell me where it is... Elevation is in meters.
7.1 Terrain Processing
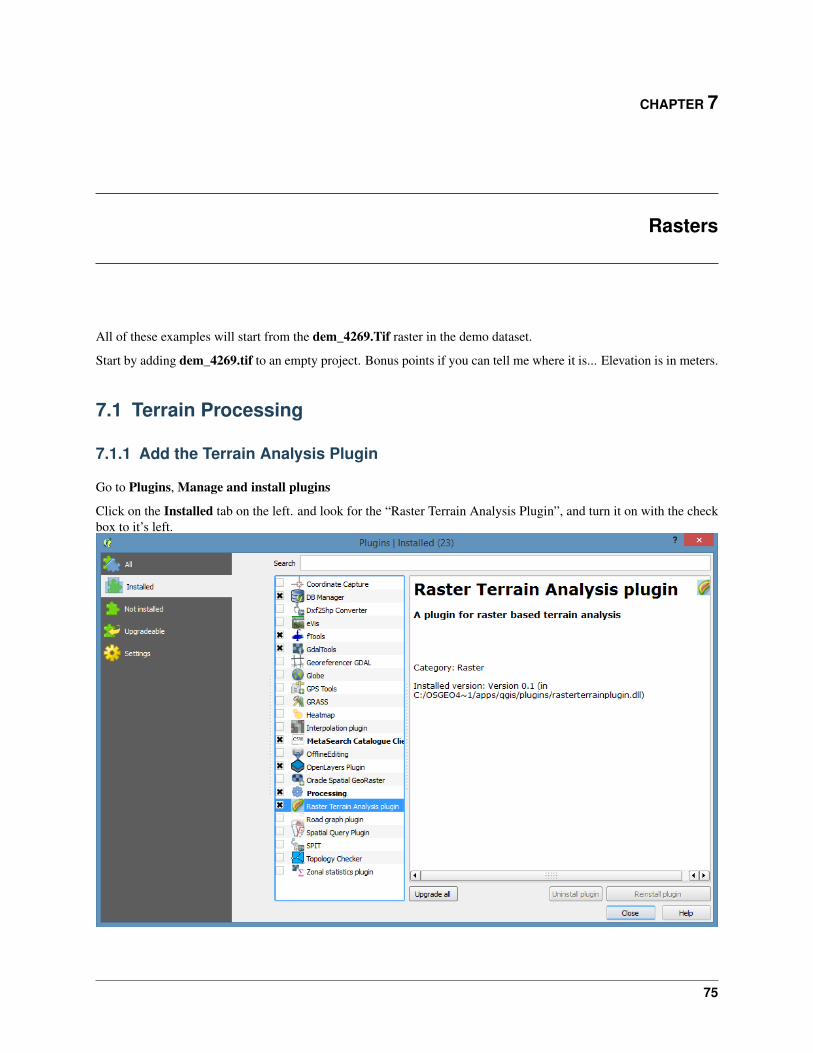
7.1.1 Add the Terrain Analysis Plugin
Go to Plugins, Manage and install plugins
Click on the Installed tab on the left. and look for the “Raster Terrain Analysis Plugin”, and turn it on with the checkbox to it’s left.
75

QGIS Tutorials Documentation, Release 0.1
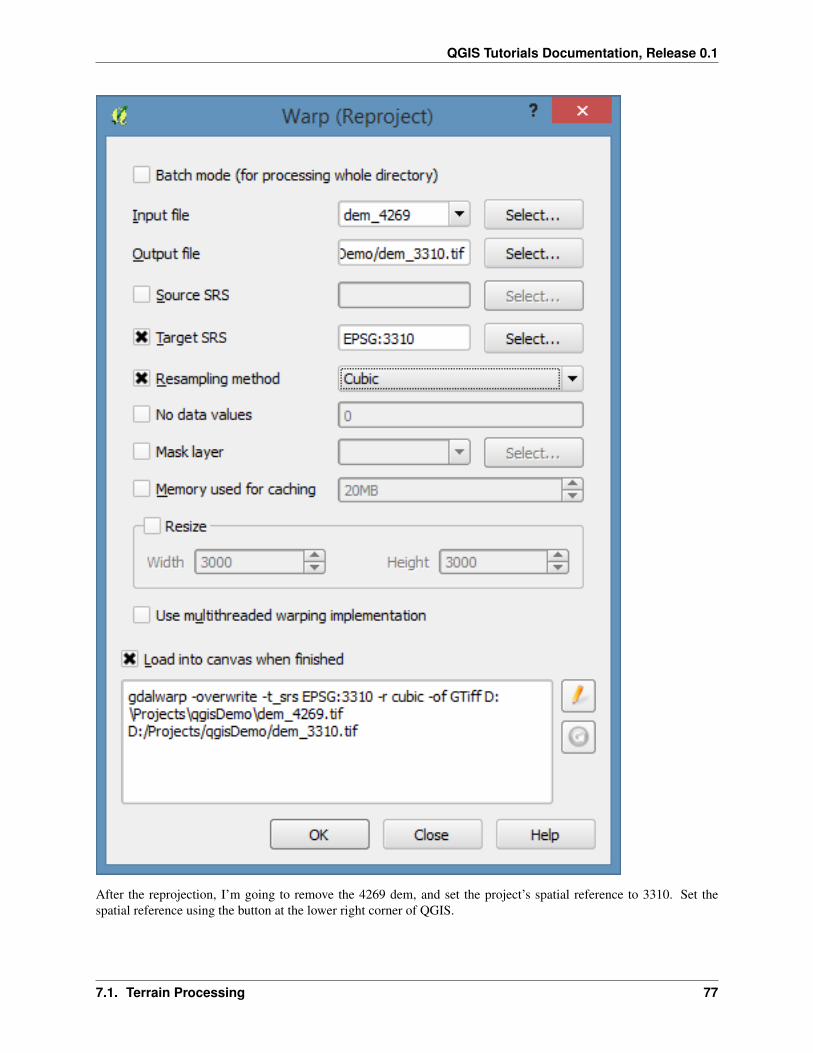
7.1.2 Reprojecting a Raster
Reproject from the current geographic projection (NAD83) (EPSG: 4269) into something a little more friendly fordoing terrain analysis (without using Z-factors).
Under the Raster menu, go to Projections and select Warp
I’m going to reproject it to California Albers NAD83 (EPSG: 3310) using the cubic convolution resampling method.
76 Chapter 7. Rasters
QGIS Tutorials Documentation, Release 0.1
After the reprojection, I’m going to remove the 4269 dem, and set the project’s spatial reference to 3310. Set thespatial reference using the button at the lower right corner of QGIS.
7.1. Terrain Processing 77

QGIS Tutorials Documentation, Release 0.1
7.1.3 Generate a Hillshade
Go to Raster, Terrain Analysis, Hillshade
78 Chapter 7. Rasters
QGIS Tutorials Documentation, Release 0.1
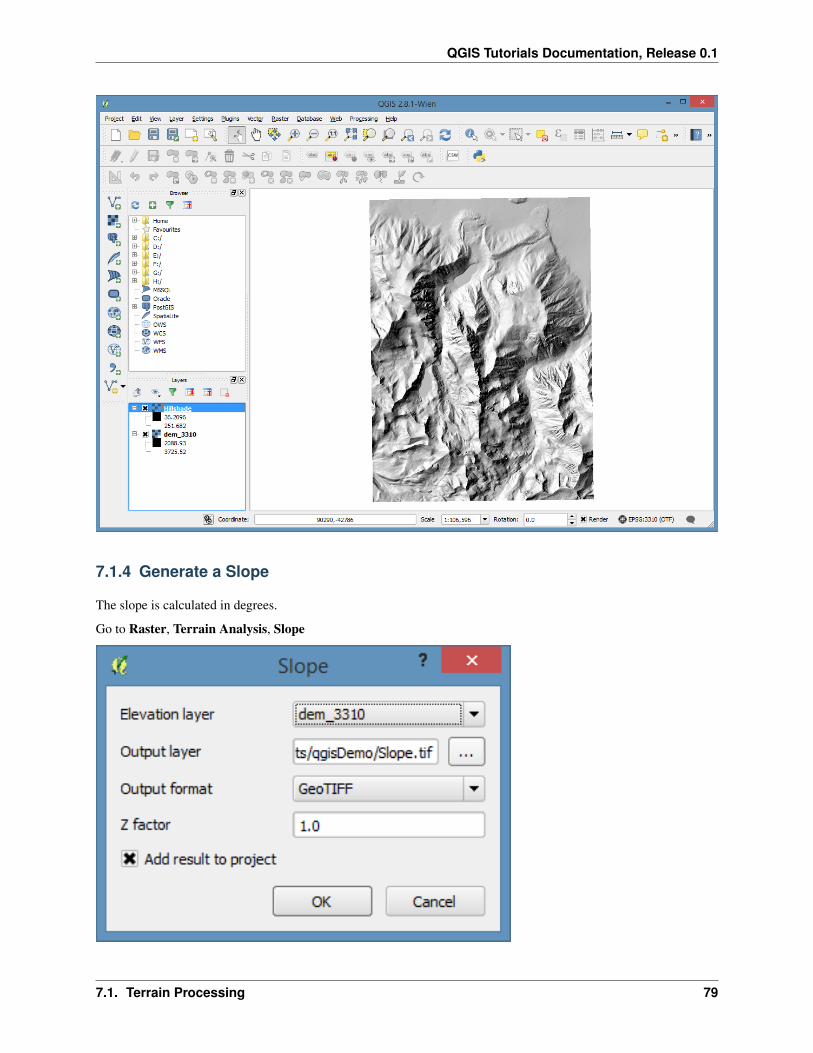
7.1.4 Generate a Slope
The slope is calculated in degrees.
Go to Raster, Terrain Analysis, Slope
7.1. Terrain Processing 79
QGIS Tutorials Documentation, Release 0.1
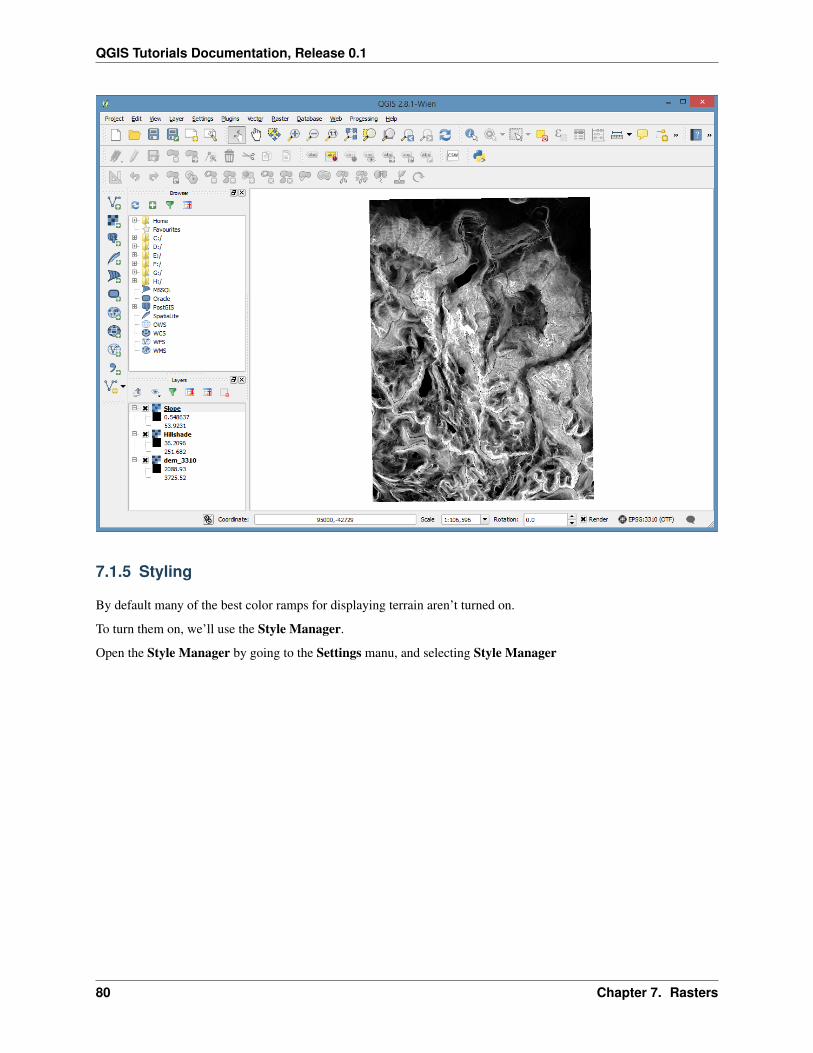
7.1.5 Styling
By default many of the best color ramps for displaying terrain aren’t turned on.
To turn them on, we’ll use the Style Manager.
Open the Style Manager by going to the Settings manu, and selecting Style Manager
80 Chapter 7. Rasters
QGIS Tutorials Documentation, Release 0.1
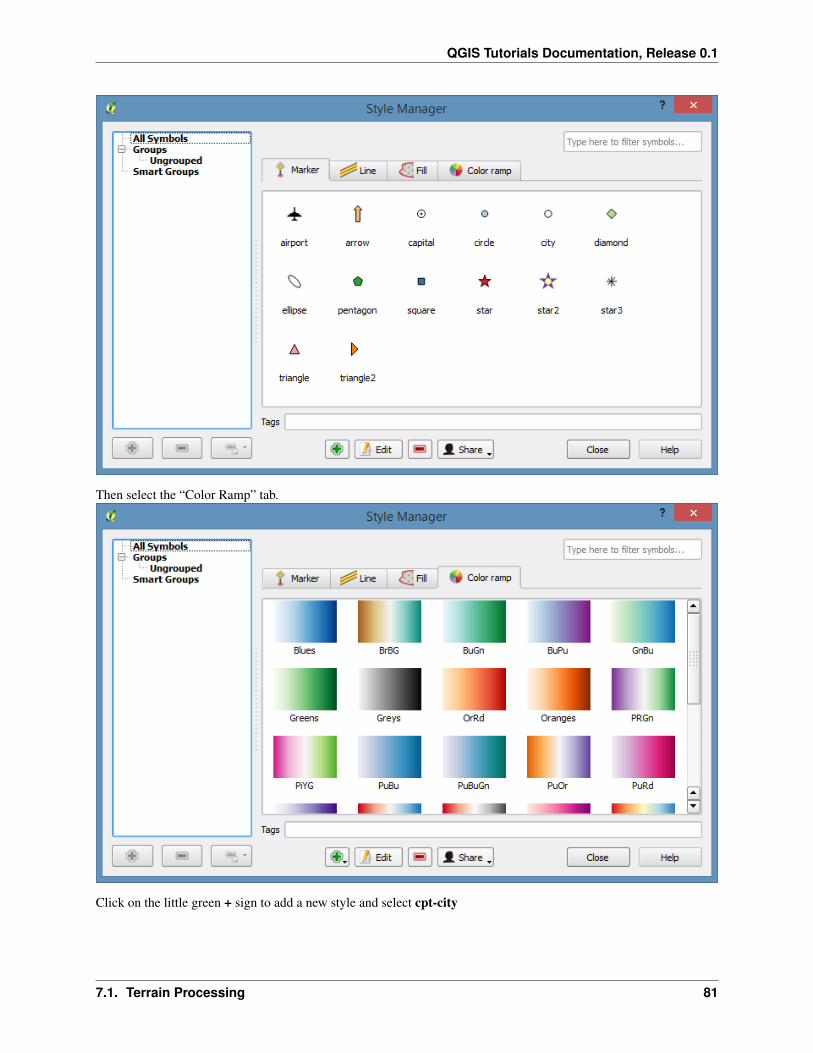
Then select the “Color Ramp” tab.
Click on the little green + sign to add a new style and select cpt-city
7.1. Terrain Processing 81
QGIS Tutorials Documentation, Release 0.1
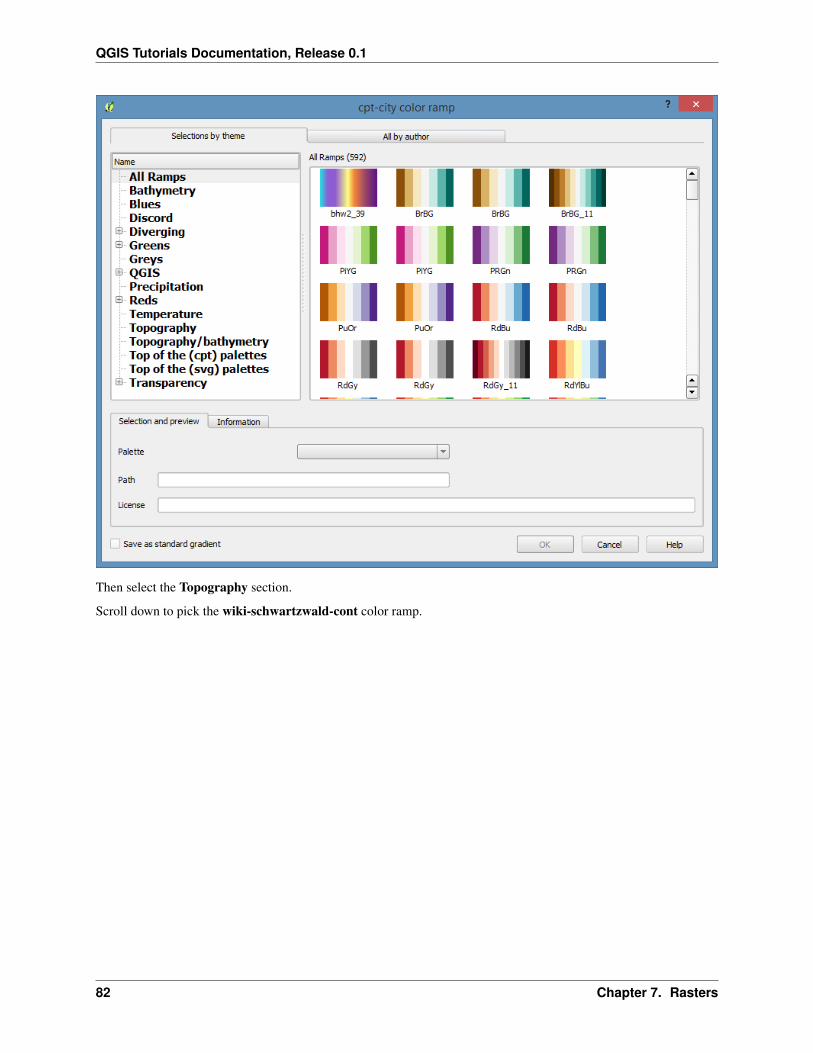
Then select the Topography section.
Scroll down to pick the wiki-schwartzwald-cont color ramp.
82 Chapter 7. Rasters

QGIS Tutorials Documentation, Release 0.1
Then click OK and accept the default name for the gradient and close the style manager.
Last, let’s apply it to the dem.
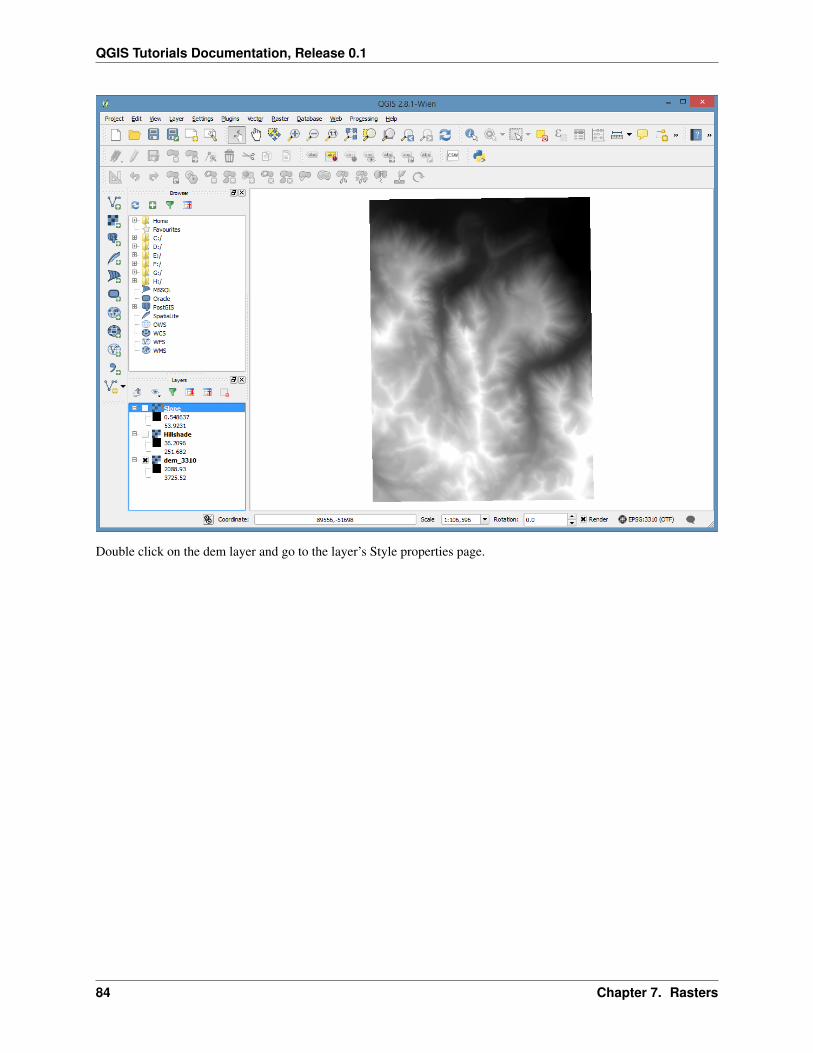
Turn off or reorder the layers so that the dem is visible. I suggest leaving the hillshade on top of the dem.
7.1. Terrain Processing 83
QGIS Tutorials Documentation, Release 0.1
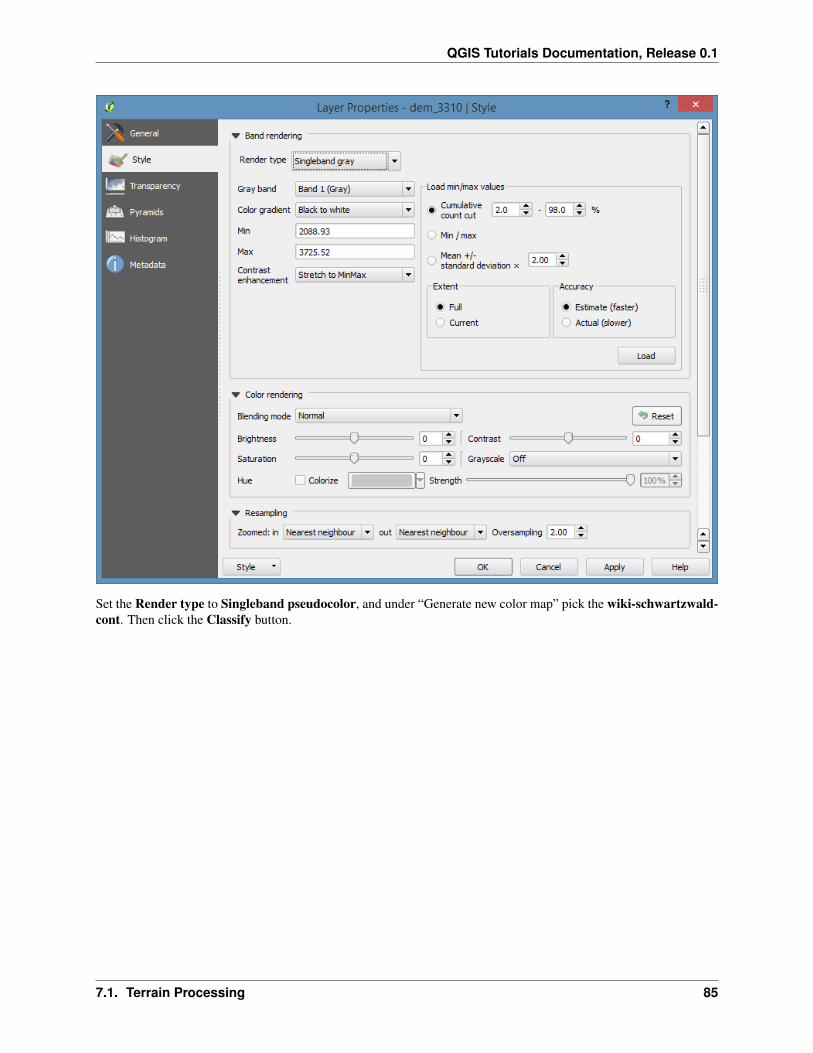
Double click on the dem layer and go to the layer’s Style properties page.
84 Chapter 7. Rasters
QGIS Tutorials Documentation, Release 0.1
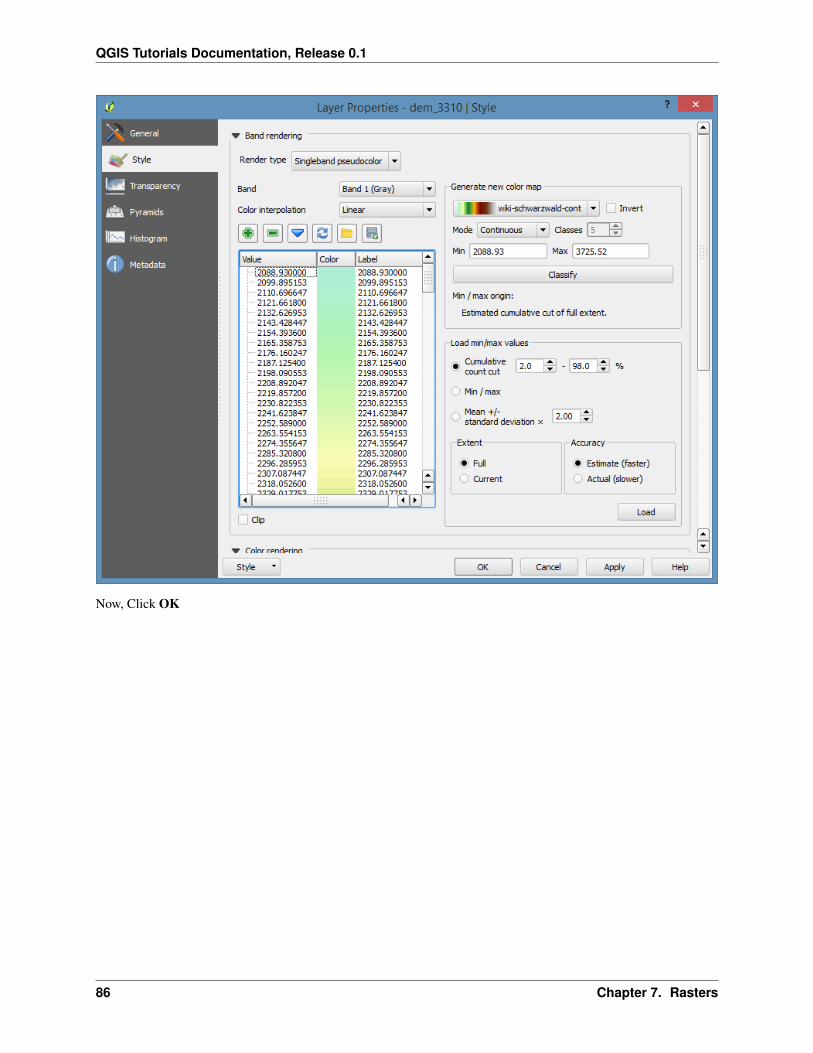
Set the Render type to Singleband pseudocolor, and under “Generate new color map” pick the wiki-schwartzwald-cont. Then click the Classify button.
7.1. Terrain Processing 85
QGIS Tutorials Documentation, Release 0.1
Now, Click OK
86 Chapter 7. Rasters
QGIS Tutorials Documentation, Release 0.1
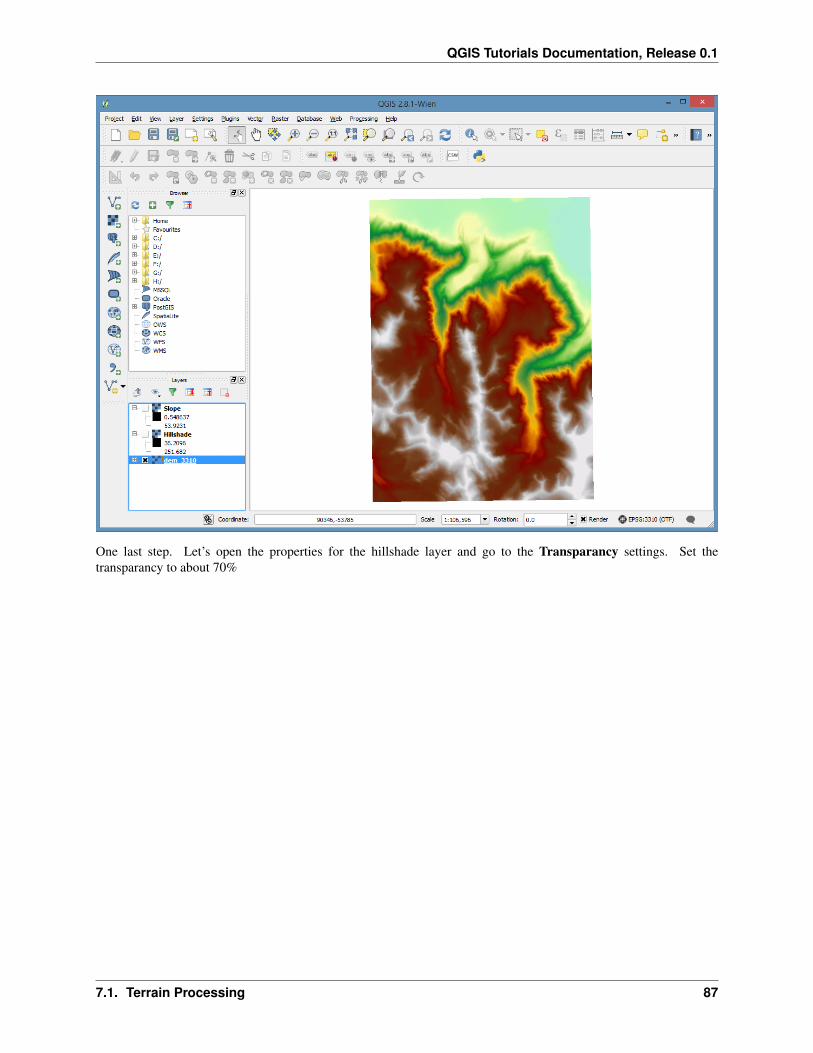
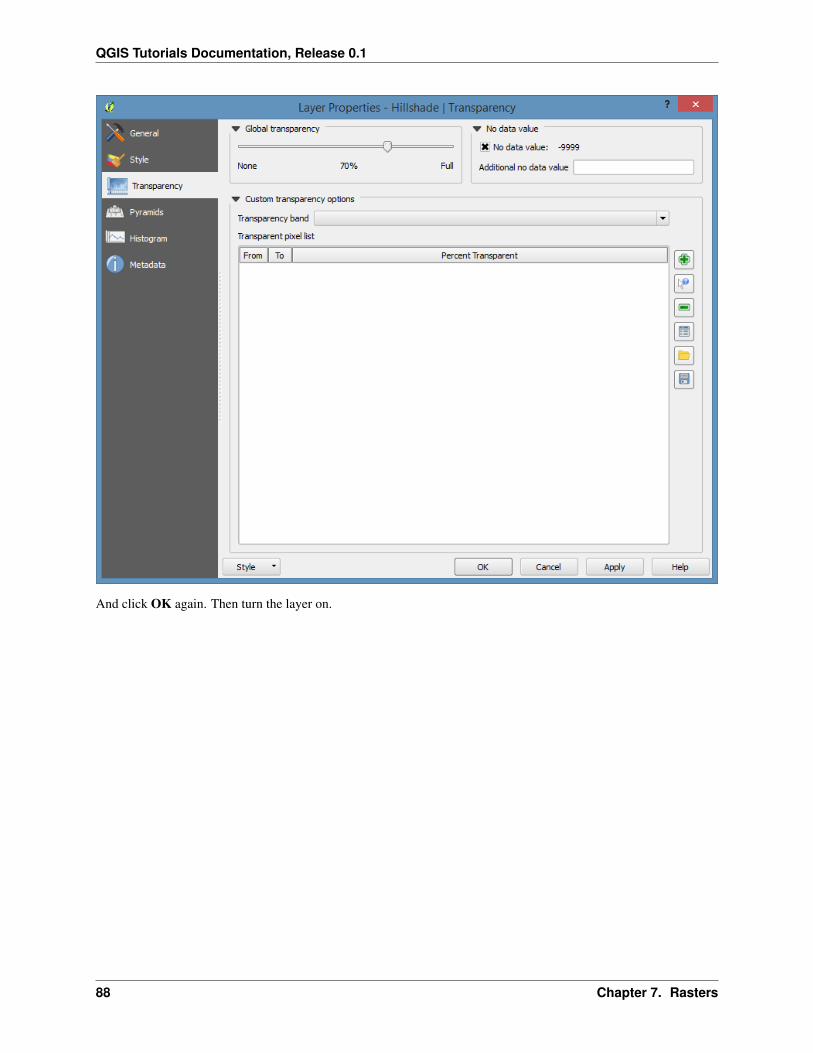
One last step. Let’s open the properties for the hillshade layer and go to the Transparancy settings. Set thetransparancy to about 70%
7.1. Terrain Processing 87
QGIS Tutorials Documentation, Release 0.1
And click OK again. Then turn the layer on.
88 Chapter 7. Rasters
QGIS Tutorials Documentation, Release 0.1
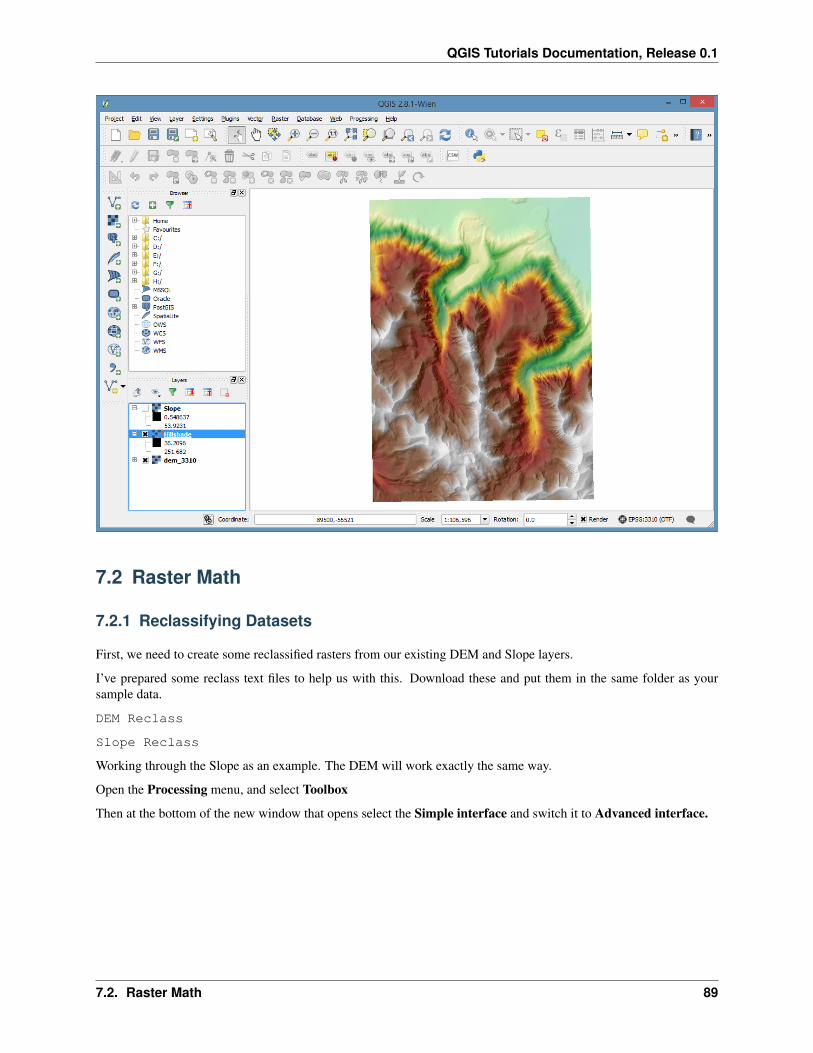
7.2 Raster Math
7.2.1 Reclassifying Datasets
First, we need to create some reclassified rasters from our existing DEM and Slope layers.
I’ve prepared some reclass text files to help us with this. Download these and put them in the same folder as yoursample data.
DEM Reclass
Slope Reclass
Working through the Slope as an example. The DEM will work exactly the same way.
Open the Processing menu, and select Toolbox
Then at the bottom of the new window that opens select the Simple interface and switch it to Advanced interface.
7.2. Raster Math 89
QGIS Tutorials Documentation, Release 0.1
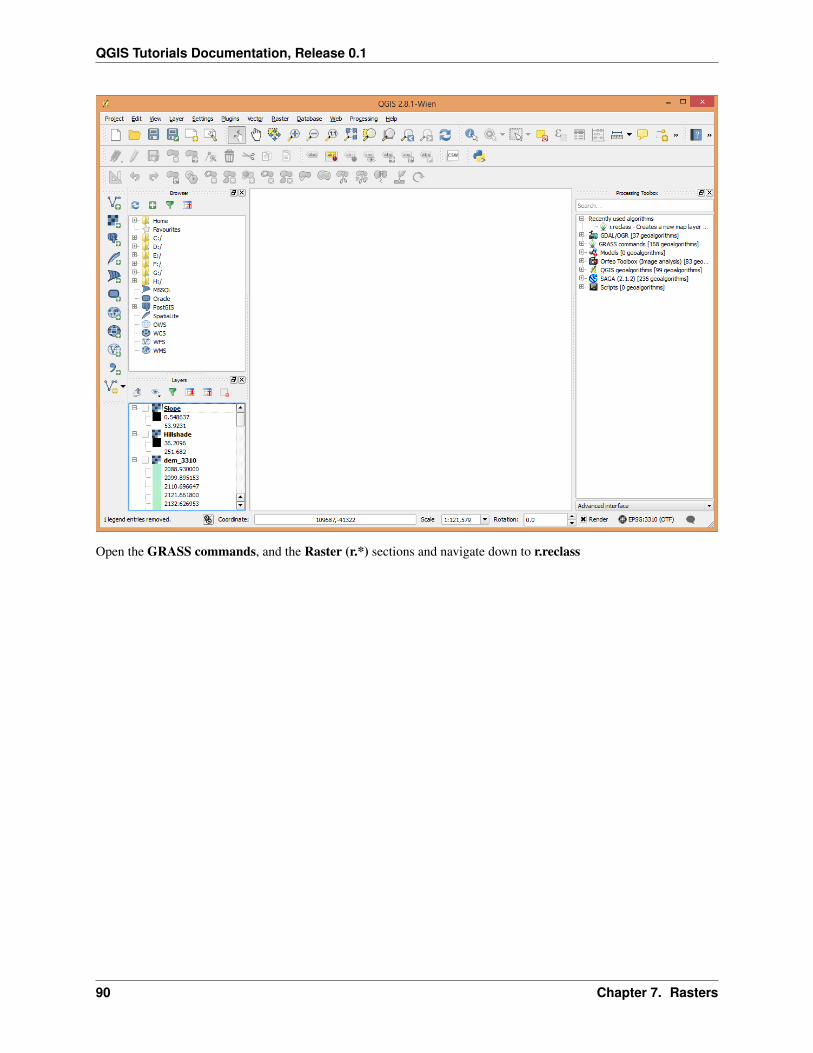
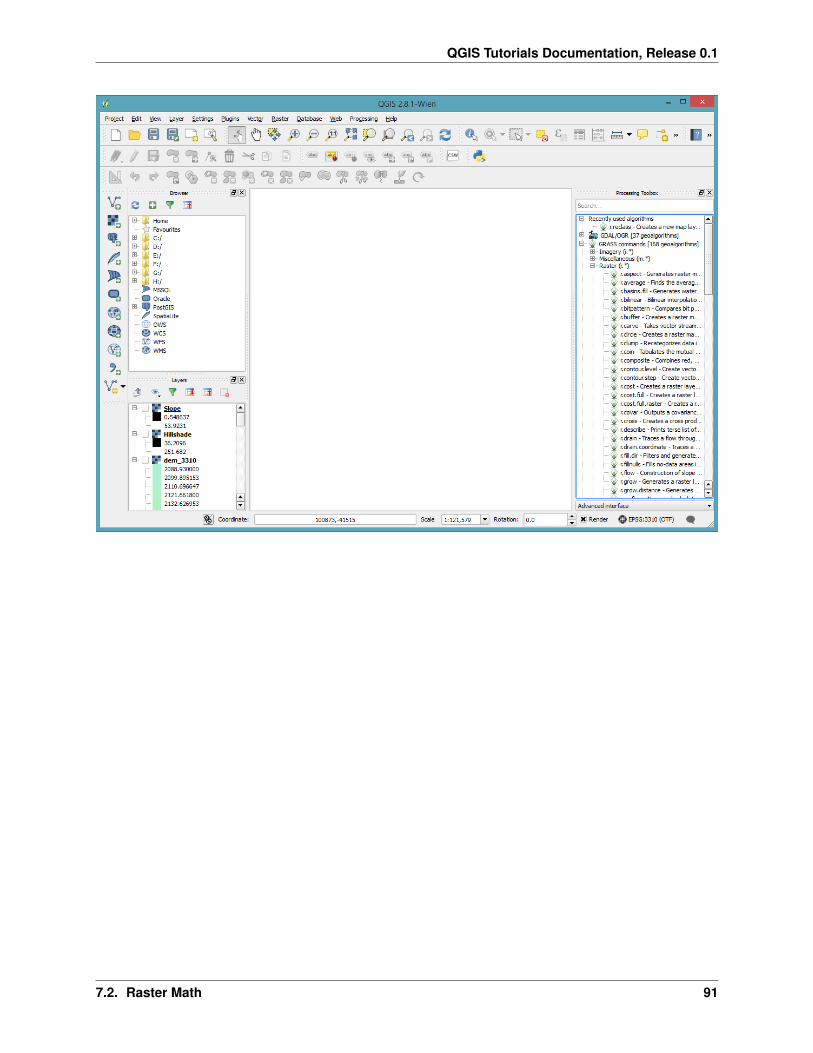
Open the GRASS commands, and the Raster (r.*) sections and navigate down to r.reclass
90 Chapter 7. Rasters
QGIS Tutorials Documentation, Release 0.1
7.2. Raster Math 91
QGIS Tutorials Documentation, Release 0.1
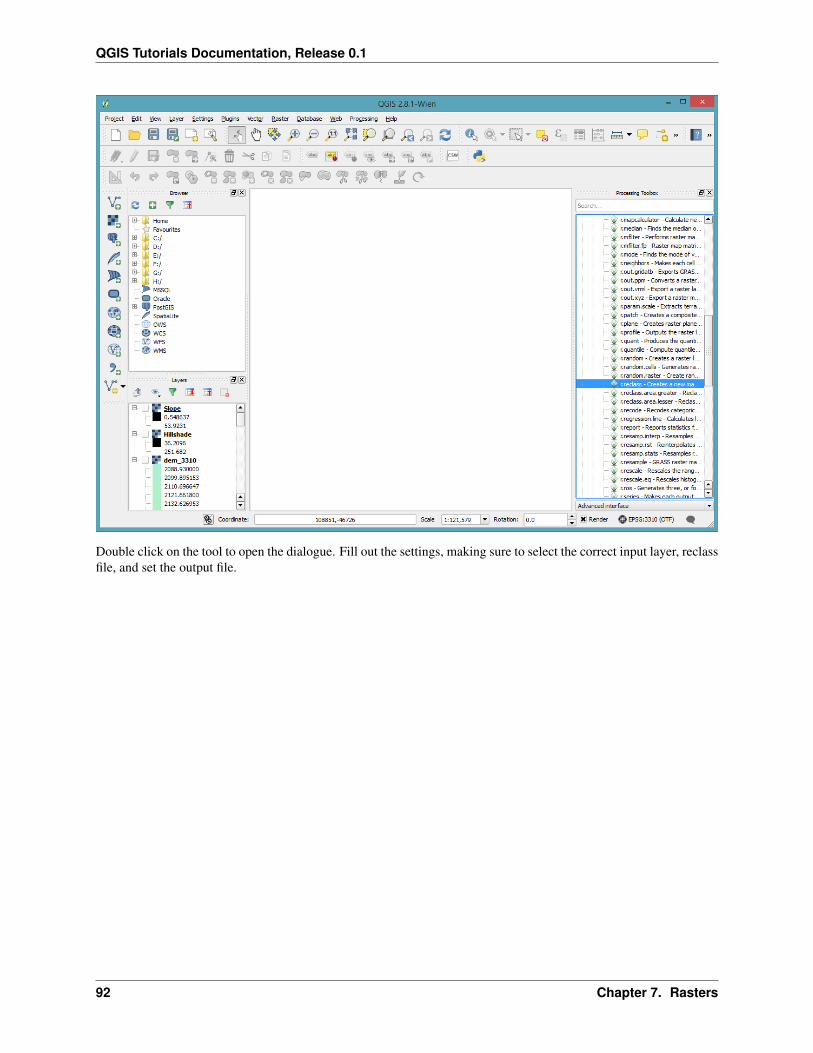
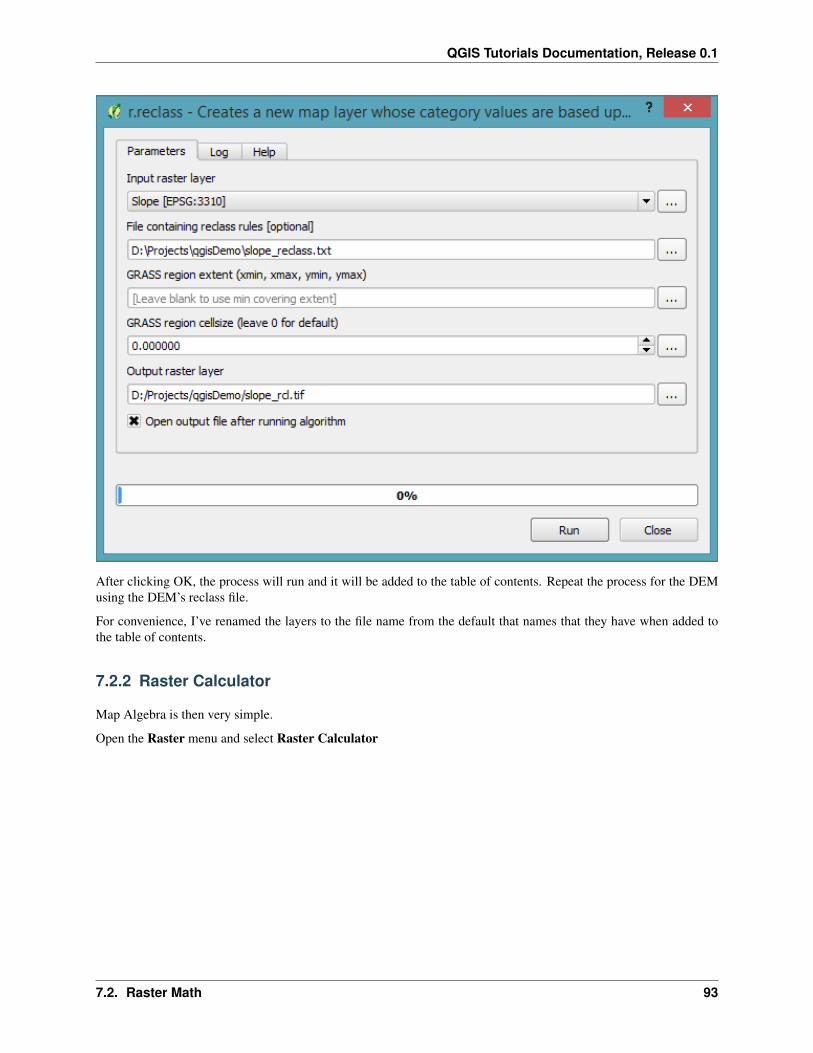
Double click on the tool to open the dialogue. Fill out the settings, making sure to select the correct input layer, reclassfile, and set the output file.
92 Chapter 7. Rasters
QGIS Tutorials Documentation, Release 0.1
After clicking OK, the process will run and it will be added to the table of contents. Repeat the process for the DEMusing the DEM’s reclass file.
For convenience, I’ve renamed the layers to the file name from the default that names that they have when added tothe table of contents.
7.2.2 Raster Calculator
Map Algebra is then very simple.
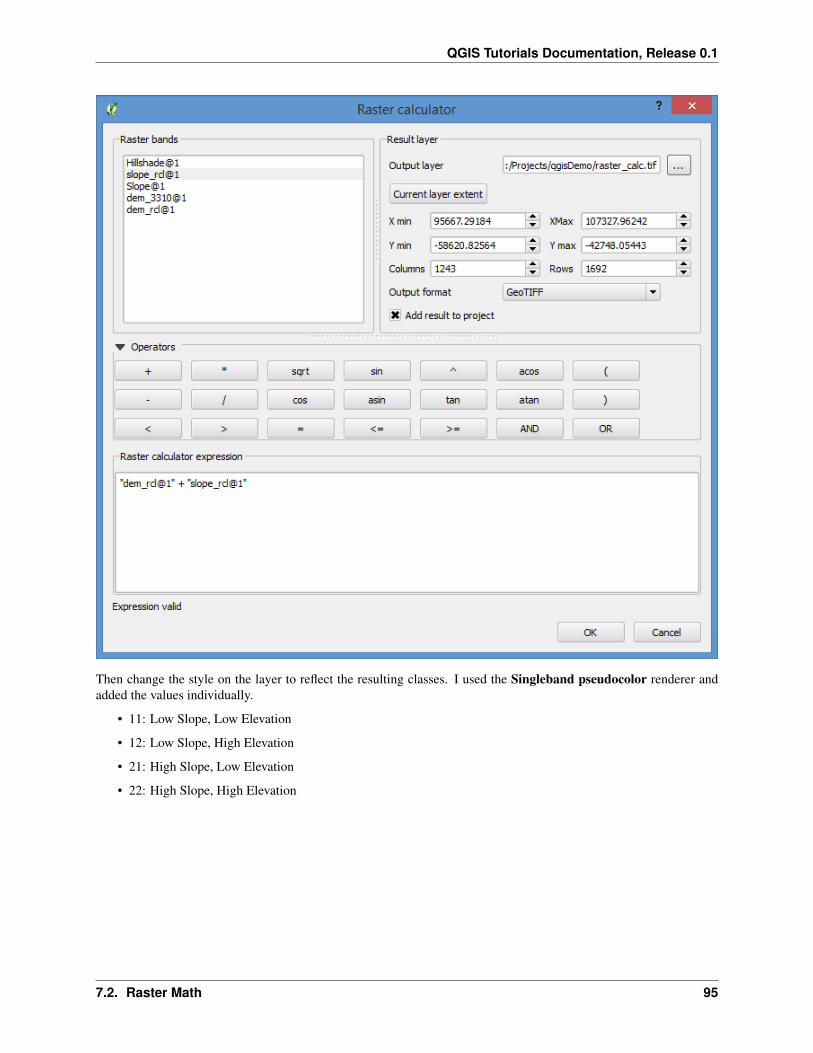
Open the Raster menu and select Raster Calculator
7.2. Raster Math 93

QGIS Tutorials Documentation, Release 0.1
And build your map algebra function and set the output file.
94 Chapter 7. Rasters
QGIS Tutorials Documentation, Release 0.1
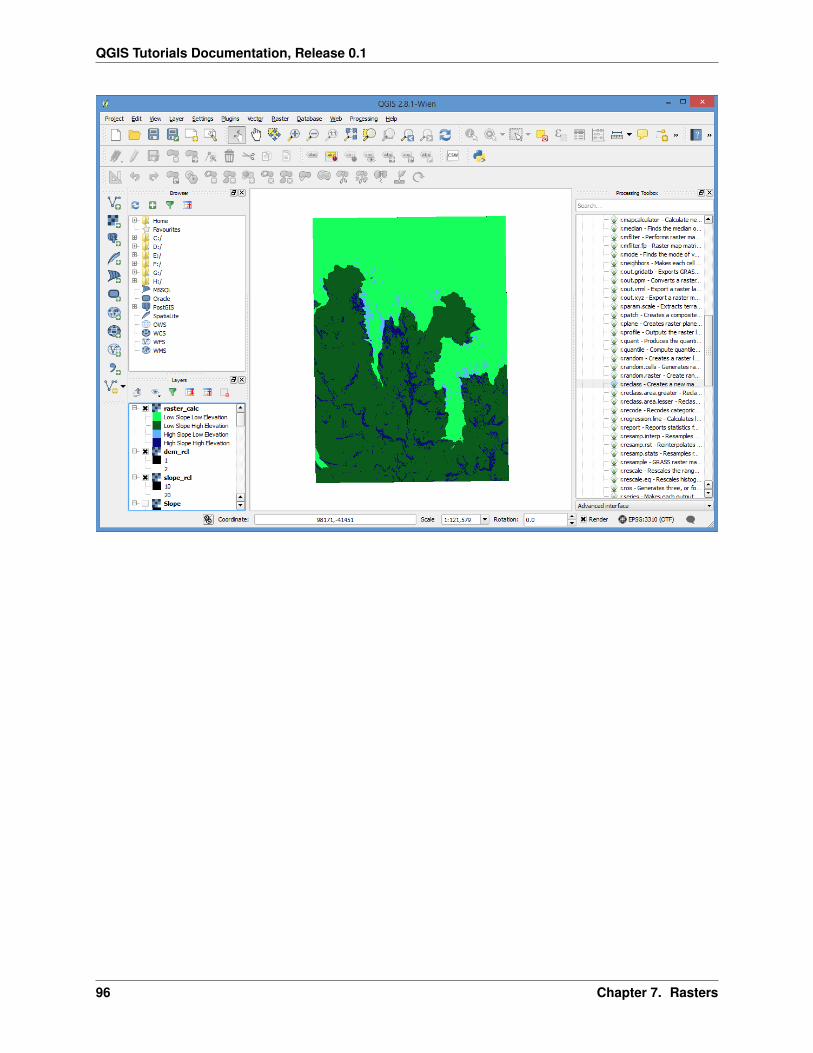
Then change the style on the layer to reflect the resulting classes. I used the Singleband pseudocolor renderer andadded the values individually.
• 11: Low Slope, Low Elevation
• 12: Low Slope, High Elevation
• 21: High Slope, Low Elevation
• 22: High Slope, High Elevation
7.2. Raster Math 95
QGIS Tutorials Documentation, Release 0.1
96 Chapter 7. Rasters
CHAPTER 8
Resources
8.1 User Manuals
The official documentation http://www.qgis.org/en/docs/
8.2 Other Tutorials
http://docs.qgis.org/2.2/en/docs/training_manual/
http://www.qgistutorials.com/en/
http://maps.cga.harvard.edu/qgis/
8.3 Advanced Materials
QGIS API documentation http://www.qgis.org/api/
PyQGIS Cookbook for python programming in QGIS http://docs.qgis.org/testing/en/docs/pyqgis_developer_cookbook/
QGIS Plugin Development http://anitagraser.com/tag/plugin-development/
97

QGIS Tutorials Documentation, Release 0.1
98 Chapter 8. Resources
CHAPTER 9
Sample Data
Sample Data (10.5MB)
99