Embed Size (px)
Citation preview
Seamless Refined Copper Pipe and TubeFrom China and Mexico
Investigation Nos. 731-TA-1174-1175 (Preliminary)
Publication 4116 November 2009
Washington, DC 20436

U.S. International Trade Commission
COMMISSIONERS
Shara L. Aranoff, ChairmanDaniel R. Pearson, Vice Chairman
Deanna Tanner OkunCharlotte R. Lane
Irving A. WilliamsonDean A. Pinkert
Robert A. RogowskyDirector of Operations
Staff assigned
Elizabeth Haines, InvestigatorKarl Tsuji, Industry Analyst
James Fetzer, EconomistMary Klir, Accountant
Charles St. Charles, AttorneySteven Hudgens, Senior Statistician
Lita David-Harris, Statistician
James McClure, Supervisor Investigator
Address all communications toSecretary to the Commission
United States International Trade CommissionWashington, DC 20436
U.S. International Trade Commission
Washington, DC 20436www.usitc.gov
Seamless Refined Copper Pipe and TubeFrom Mexico and China
Investigation Nos. 731-TA-1174-1175 (Preliminary)
Publication 4116 November 2009


TABLE OF CONTENTS
Page
Determination . . . . . . . . . . . . . . . . . . . . . . . . . . . . . . . . . . . . . . . . . . . . . . . . . . . . . . . . . . . . . . . . . . I-1Views of the Commission . . . . . . . . . . . . . . . . . . . . . . . . . . . . . . . . . . . . . . . . . . . . . . . . . . . . . . . . . 3Separate and dissenting views of Chairman Shara L. Aranoff, Vice Chairman Daniel R. Pearson, and Commissioner Deanna Tanner Okun . . . . . . . . . . . . . . . . . . . . . . . . . . . . . . . . 27Part I: Introduction . . . . . . . . . . . . . . . . . . . . . . . . . . . . . . . . . . . . . . . . . . . . . . . . . . . . . . . . . . . . I-1
Background . . . . . . . . . . . . . . . . . . . . . . . . . . . . . . . . . . . . . . . . . . . . . . . . . . . . . . . . . . . . . . . . . . I-1Statutory criteria and organization of the report . . . . . . . . . . . . . . . . . . . . . . . . . . . . . . . . . . . . . . I-1
Statutory criteria . . . . . . . . . . . . . . . . . . . . . . . . . . . . . . . . . . . . . . . . . . . . . . . . . . . . . . . . . . . I-1Organization of the report . . . . . . . . . . . . . . . . . . . . . . . . . . . . . . . . . . . . . . . . . . . . . . . . . . . . I-2
U.S. market summary . . . . . . . . . . . . . . . . . . . . . . . . . . . . . . . . . . . . . . . . . . . . . . . . . . . . . . . . . . I-2Summary data and data sources . . . . . . . . . . . . . . . . . . . . . . . . . . . . . . . . . . . . . . . . . . . . . . . . . . I-3Previous and related Title VII investigations . . . . . . . . . . . . . . . . . . . . . . . . . . . . . . . . . . . . . . . . I-3Nature and extent of alleged sales at LTFV . . . . . . . . . . . . . . . . . . . . . . . . . . . . . . . . . . . . . . . . . I-3
Alleged sales at LTFV . . . . . . . . . . . . . . . . . . . . . . . . . . . . . . . . . . . . . . . . . . . . . . . . . . . . . . . I-3The subject merchandise . . . . . . . . . . . . . . . . . . . . . . . . . . . . . . . . . . . . . . . . . . . . . . . . . . . . . . . . I-4
Commerce’s scope . . . . . . . . . . . . . . . . . . . . . . . . . . . . . . . . . . . . . . . . . . . . . . . . . . . . . . . . . . I-4Tariff treatment . . . . . . . . . . . . . . . . . . . . . . . . . . . . . . . . . . . . . . . . . . . . . . . . . . . . . . . . . . . . I-5
The product . . . . . . . . . . . . . . . . . . . . . . . . . . . . . . . . . . . . . . . . . . . . . . . . . . . . . . . . . . . . . . . . . . I-5Description and applications . . . . . . . . . . . . . . . . . . . . . . . . . . . . . . . . . . . . . . . . . . . . . . . . . . I-5Manufacturing processes . . . . . . . . . . . . . . . . . . . . . . . . . . . . . . . . . . . . . . . . . . . . . . . . . . . . . I-9
Domestic like product issues . . . . . . . . . . . . . . . . . . . . . . . . . . . . . . . . . . . . . . . . . . . . . . . . . . . . I-12
Part II: Conditions of competition in the U.S. market . . . . . . . . . . . . . . . . . . . . . . . . . . . . . . . . II-1U.S. market characteristics . . . . . . . . . . . . . . . . . . . . . . . . . . . . . . . . . . . . . . . . . . . . . . . . . . . . . . II-1Channels of distribution . . . . . . . . . . . . . . . . . . . . . . . . . . . . . . . . . . . . . . . . . . . . . . . . . . . . . . . . II-1Supply and demand considerations . . . . . . . . . . . . . . . . . . . . . . . . . . . . . . . . . . . . . . . . . . . . . . . . II-1
Supply . . . . . . . . . . . . . . . . . . . . . . . . . . . . . . . . . . . . . . . . . . . . . . . . . . . . . . . . . . . . . . . . . . . II-1Demand . . . . . . . . . . . . . . . . . . . . . . . . . . . . . . . . . . . . . . . . . . . . . . . . . . . . . . . . . . . . . . . . . . II-4
Substitutability issues . . . . . . . . . . . . . . . . . . . . . . . . . . . . . . . . . . . . . . . . . . . . . . . . . . . . . . . . . . II-8Factors affecting purchasing decisions . . . . . . . . . . . . . . . . . . . . . . . . . . . . . . . . . . . . . . . . . . II-8Comparison of the U.S.-produced and imported SRC pipe and tube . . . . . . . . . . . . . . . . . . . II-9
Part III: U.S. producers’ production, shipments, and employment . . . . . . . . . . . . . . . . . . . . . . III-1U.S. producers . . . . . . . . . . . . . . . . . . . . . . . . . . . . . . . . . . . . . . . . . . . . . . . . . . . . . . . . . . . . . . . III-1U.S. capacity, production, and capacity utilization . . . . . . . . . . . . . . . . . . . . . . . . . . . . . . . . . . . III-3U.S. producers’ shipments . . . . . . . . . . . . . . . . . . . . . . . . . . . . . . . . . . . . . . . . . . . . . . . . . . . . . . III-4U.S. producers’ inventories . . . . . . . . . . . . . . . . . . . . . . . . . . . . . . . . . . . . . . . . . . . . . . . . . . . . . III-6U.S. producers’ imports and purchases . . . . . . . . . . . . . . . . . . . . . . . . . . . . . . . . . . . . . . . . . . . . . III-6U.S. employment, wages, and productivity . . . . . . . . . . . . . . . . . . . . . . . . . . . . . . . . . . . . . . . . . III-7
Part IV: U.S. imports, apparent consumption, and market shares . . . . . . . . . . . . . . . . . . . . . . IV-1U.S. importers . . . . . . . . . . . . . . . . . . . . . . . . . . . . . . . . . . . . . . . . . . . . . . . . . . . . . . . . . . . . . . . . IV-1U.S. imports . . . . . . . . . . . . . . . . . . . . . . . . . . . . . . . . . . . . . . . . . . . . . . . . . . . . . . . . . . . . . . . . . IV-4
i
TABLE OF CONTENTS
Page
Part IV: U.S. imports, apparent consumption, and market shares–ContinuedCumulation considerations . . . . . . . . . . . . . . . . . . . . . . . . . . . . . . . . . . . . . . . . . . . . . . . . . . . . . . IV-7
Geographic markets . . . . . . . . . . . . . . . . . . . . . . . . . . . . . . . . . . . . . . . . . . . . . . . . . . . . . . . . . IV-7Simultaneous presence in the market . . . . . . . . . . . . . . . . . . . . . . . . . . . . . . . . . . . . . . . . . . . IV-9
Negligibility . . . . . . . . . . . . . . . . . . . . . . . . . . . . . . . . . . . . . . . . . . . . . . . . . . . . . . . . . . . . . . . . . IV-11Apparent U.S. consumption . . . . . . . . . . . . . . . . . . . . . . . . . . . . . . . . . . . . . . . . . . . . . . . . . . . . . IV-12U.S. market shares . . . . . . . . . . . . . . . . . . . . . . . . . . . . . . . . . . . . . . . . . . . . . . . . . . . . . . . . . . . . IV-14Ratio of imports to U.S. production . . . . . . . . . . . . . . . . . . . . . . . . . . . . . . . . . . . . . . . . . . . . . . . IV-15
Part V: Pricing and related information . . . . . . . . . . . . . . . . . . . . . . . . . . . . . . . . . . . . . . . . . . . . V-1Factors affecting prices . . . . . . . . . . . . . . . . . . . . . . . . . . . . . . . . . . . . . . . . . . . . . . . . . . . . . . . . . V-1
Raw material costs . . . . . . . . . . . . . . . . . . . . . . . . . . . . . . . . . . . . . . . . . . . . . . . . . . . . . . . . . . V-1U.S. inland transportation costs . . . . . . . . . . . . . . . . . . . . . . . . . . . . . . . . . . . . . . . . . . . . . . . . V-1
Pricing practices . . . . . . . . . . . . . . . . . . . . . . . . . . . . . . . . . . . . . . . . . . . . . . . . . . . . . . . . . . . . . . V-1Pricing methods . . . . . . . . . . . . . . . . . . . . . . . . . . . . . . . . . . . . . . . . . . . . . . . . . . . . . . . . . . . . V-1Lead times . . . . . . . . . . . . . . . . . . . . . . . . . . . . . . . . . . . . . . . . . . . . . . . . . . . . . . . . . . . . . . . . V-2Sales terms and discounts . . . . . . . . . . . . . . . . . . . . . . . . . . . . . . . . . . . . . . . . . . . . . . . . . . . . V-2
Price data . . . . . . . . . . . . . . . . . . . . . . . . . . . . . . . . . . . . . . . . . . . . . . . . . . . . . . . . . . . . . . . . . . . V-3Price trends . . . . . . . . . . . . . . . . . . . . . . . . . . . . . . . . . . . . . . . . . . . . . . . . . . . . . . . . . . . . . . . V-3Price comparisons . . . . . . . . . . . . . . . . . . . . . . . . . . . . . . . . . . . . . . . . . . . . . . . . . . . . . . . . . . V-7
Lost sales and lost revenues . . . . . . . . . . . . . . . . . . . . . . . . . . . . . . . . . . . . . . . . . . . . . . . . . . . . . V-7
Part VI: Financial experience of the U.S. producers . . . . . . . . . . . . . . . . . . . . . . . . . . . . . . . . . . VI-1Introduction . . . . . . . . . . . . . . . . . . . . . . . . . . . . . . . . . . . . . . . . . . . . . . . . . . . . . . . . . . . . . . . . . . VI-1Operations on SRC pipe and tube . . . . . . . . . . . . . . . . . . . . . . . . . . . . . . . . . . . . . . . . . . . . . . . . VI-1Variance analysis . . . . . . . . . . . . . . . . . . . . . . . . . . . . . . . . . . . . . . . . . . . . . . . . . . . . . . . . . . . . . VI-3Capital expenditures and research and development expenses . . . . . . . . . . . . . . . . . . . . . . . . . . . VI-4Assets and return on investment . . . . . . . . . . . . . . . . . . . . . . . . . . . . . . . . . . . . . . . . . . . . . . . . . . VI-5Capital and investment . . . . . . . . . . . . . . . . . . . . . . . . . . . . . . . . . . . . . . . . . . . . . . . . . . . . . . . . . VI-5
Actual negative effects . . . . . . . . . . . . . . . . . . . . . . . . . . . . . . . . . . . . . . . . . . . . . . . . . . . . . . VI-5Anticipated negative effects . . . . . . . . . . . . . . . . . . . . . . . . . . . . . . . . . . . . . . . . . . . . . . . . . . VI-5
Part VII: Threat considerations and information on nonsubject countries . . . . . . . . . . . . . . . VII-1The industry in China . . . . . . . . . . . . . . . . . . . . . . . . . . . . . . . . . . . . . . . . . . . . . . . . . . . . . . . . . . VII-2The industry in Mexico . . . . . . . . . . . . . . . . . . . . . . . . . . . . . . . . . . . . . . . . . . . . . . . . . . . . . . . . . VII-5U.S. importers’ inventories of SRC pipe and tube . . . . . . . . . . . . . . . . . . . . . . . . . . . . . . . . . . . . VII-6U.S. importer’s current orders . . . . . . . . . . . . . . . . . . . . . . . . . . . . . . . . . . . . . . . . . . . . . . . . . . . VII-7Antidumping and countervailing duty investigations in third-country markets . . . . . . . . . . . . . . VII-7Information on producers in nonsubject countries . . . . . . . . . . . . . . . . . . . . . . . . . . . . . . . . . . . . VII-7
AppendixesA. Federal Register notices . . . . . . . . . . . . . . . . . . . . . . . . . . . . . . . . . . . . . . . . . . . . . . . . . . . . . . . . A-1B. Conference witnesses . . . . . . . . . . . . . . . . . . . . . . . . . . . . . . . . . . . . . . . . . . . . . . . . . . . . . . . . . . B-1
ii

TABLE OF CONTENTS
Page
Appendixes–ContinuedC. Summary data . . . . . . . . . . . . . . . . . . . . . . . . . . . . . . . . . . . . . . . . . . . . . . . . . . . . . . . . . . . . . . . . C-1D. Tariff treatment . . . . . . . . . . . . . . . . . . . . . . . . . . . . . . . . . . . . . . . . . . . . . . . . . . . . . . . . . . . . . . . D-1E. Nonsubject country price data . . . . . . . . . . . . . . . . . . . . . . . . . . . . . . . . . . . . . . . . . . . . . . . . . . . E-1
Note.–Information that would reveal confidential operations of individual concerns may not bepublished and therefore has been deleted from this report. Such deletions are indicated byasterisks.
iii


UNITED STATES INTERNATIONAL TRADE COMMISSION
Investigation Nos. 731-TA-1174-1175 (Preliminary)
SEAMLESS REFINED COPPER PIPE AND TUBE FROM CHINA AND MEXICO
DETERMINATIONS
On the basis of the record1 developed in the subject investigations, the United States InternationalTrade Commission (Commission) determines, pursuant to section 733(a) of the Tariff Act of 1930 (19U.S.C. § 1673b(a)) (the Act), that there is a reasonable indication that an industry in the United States ismaterially injured2 or threatened with material injury,3 by reason of imports from China and Mexico ofseamless refined copper pipe and tube, provided for in subheadings 7411.10.10, and 8415.90.80 of theHarmonized Tariff Schedule of the United States, that are alleged to be sold in the United States at lessthan fair value (LTFV).
COMMENCEMENT OF FINAL PHASE INVESTIGATION
Pursuant to section 207.18 of the Commission’s rules, the Commission also gives notice of thecommencement of the final phase of its investigations. The Commission will issue a final phase notice ofscheduling, which will be published in the Federal Register as provided in section 207.21 of theCommission’s rules, upon notice from the Department of Commerce (Commerce) of affirmativepreliminary determinations in the investigations under section 733(b) of the Act, or, if the preliminarydeterminations are negative, upon notice of affirmative final determinations in the investigations undersection 735(a) of the Act. Parties that filed entries of appearance in the preliminary phase of theinvestigations need not enter a separate appearance for the final phase of the investigations. Industrialusers, and, if the merchandise under investigation is sold at the retail level, representative consumerorganizations have the right to appear as parties in Commission antidumping and countervailing dutyinvestigations. The Secretary will prepare a public service list containing the names and addresses of allpersons, or their representatives, who are parties to the investigations.
BACKGROUND
On September 30, 2009, a petition was filed with the Commission and Commerce by Cerro FlowProducts, Inc., St. Louis, MO; Kobe Wieland Copper Products, LLC, Pine Hall, NC; Mueller CopperTube Products, Inc. and Mueller Copper Tube Company, Inc., Memphis, TN, alleging that an industry inthe United States is materially injured or threatened with material injury by reason of LTFV
1 The record is defined in sec. 207.2(f) of the Commission’s Rules of Practice and Procedure (19 CFR § 207.2(f)).
2 Commissioner Charlotte R. Lane, Commissioner Irving A. Williamson, and Commissioner Dean A. Pinkertdetermine that there is a reasonable indication that an industry in the United States is materially injured by reason ofimports of seamless refined copper pipe and tube from China and Mexico.
3 Chairman Shara L. Aranoff, Vice Chairman Daniel R. Pearson, and Commissioner Deanna Tanner Okundetermine that there is a reasonable indication that an industry in the United States is threatened with material injuryby reason of imports of seamless refined copper pipe and tube from China and Mexico.

imports of seamless refined copper pipe and tube from China and Mexico. Accordingly, effectiveSeptember 30, 2009, the Commission instituted antidumping duty investigation Nos. 731-TA-1174-1175(Preliminary).
Notice of the institution of the Commission’s investigations and of a public conference to beheld in connection therewith was given by posting copies of the notice in the Office of the Secretary,U.S. International Trade Commission, Washington, DC, and by publishing the notice in the FederalRegister of October 6, 2009 (74 FR 51318). The conference was held in Washington, DC, on October21, 2009, and all persons who requested the opportunity were permitted to appear in person or bycounsel.

VIEWS OF THE COMMISSION
Based on the record in the preliminary phase of these investigations, we find that there is areasonable indication that an industry in the United States is materially injured or threatened with materialinjury by reason of imports of seamless refined copper pipe and tube from China and Mexico that areallegedly sold in the United States at less than fair value.1
I. THE LEGAL STANDARD FOR PRELIMINARY DETERMINATIONS
The legal standard for preliminary antidumping determinations requires the Commission todetermine, based upon the information available at the time of the preliminary determination, whetherthere is a reasonable indication that a domestic industry is materially injured or threatened with materialinjury, or that the establishment of an industry is materially retarded, by reason of the allegedly unfairlytraded imports.2 In applying this standard, the Commission weighs the evidence before it and determineswhether “(1) the record as a whole contains clear and convincing evidence that there is no material injuryor threat of such injury; and (2) no likelihood exists that contrary evidence will arise in a finalinvestigation.”3
II. BACKGROUND
The antidumping duty petition in these investigations was filed on September 30, 2009, bydomestic producers Cerro Flow Products, Inc. (“Cerro”), St. Louis, Missouri; Kobe Wieland CopperProducts, LLC (“Kobe Wieland”), Pine Hall, North Carolina; Mueller Copper Tube Products, Inc. andMueller Copper Tube Company, Inc. (“Mueller”), Memphis, Tennessee. Petitioners appeared at the staffconference and filed a joint postconference brief.
Respondents that participated in the staff conference and filed postconference briefs includeShanghai Hailiang Copper Co. Ltd. (“Hailiang”), a Chinese producer of the subject merchandise; GoldenDragon Precise Copper Tube Group Inc., GD Affiliates S. de R.L. de C.V., and GD Copper (U.S.A.) Inc.,a Chinese producer, a Mexican producer, and a U.S. importer of subject merchandise, respectively(collectively, “Golden Dragon”); IUSA, S.A. de C.V. (“IUSA”) and Nacional de Cobre, S.A. de C.V.(“Nacobre”), Mexican producers of subject merchandise (collectively, “Mexican Respondents”); andDayco Industries, LLC (“Dayco”), Homewerks Worldwide, LLC (“Homewerks”), JMF Company(“JMF”), and Marubeni American Corp. (“Marubeni”), importers of subject merchandise (collectively,“Importer Respondents”).
A joint postconference statement was filed by Luvata Alltop (Zhongshan), Ltd., Luvata Tube(Zhongshan) Ltd., foreign producers of subject merchandise in China, Luvata Monterrey S. de R.L. deC.V., described as a future foreign producer of subject merchandise in Mexico, and Luvata Franklin, Inc.and Luvata Grenada LLC, importers of subject merchandise (collectively, “Luvata”). A postconferencestatement was also filed by Johnson Controls, Inc., a purchaser of subject imports.
1 Commissioners Lane, Pinkert, and Williamson determine that there is a reasonable indication that the domesticindustry is materially injured, and Chairman Aranoff, Vice Chairman Pearson, and Commissioner Okun determinethat there is a reasonable indication that the domestic industry is threatened with material injury, by reason of thesubject imports from China and Mexico. All Commissioners join in parts I-VI.B of these Views. 2 19 U.S.C. § 1673b(a) (2000); see also American Lamb Co. v. United States, 785 F.2d 994, 1001-04 (Fed. Cir.1986); Aristech Chem. Corp. v. United States, 20 CIT 353, 354-55 (1996). No party argued that the establishment ofan industry is materially retarded by reason of the allegedly unfairly traded imports. 3 American Lamb Co., 785 F.2d at 1001; see also Texas Crushed Stone Co. v. United States, 35 F.3d 1535, 1543(Fed. Cir. 1994).
3

The Commission received questionnaire responses from 12 domestic producers, estimated toaccount for 95 percent of U.S. production of seamless refined copper pipe and tube (hereinafter, “SRCpipe and tube”).4 The Commission received questionnaire responses from 42 importers, believed toaccount for 91 percent of total imports from China, 100 percent of total imports from Mexico, and 44percent of total imports from all other sources.5 The Commission sent foreign producer questionnaires to14 Chinese firms and six Mexican firms believed to be producing SRC pipe and tube. The Commissionreceived questionnaire responses from 10 Chinese firms, believed to account for 97.9 percent of Chineseexport shipments to the United States in 2008, and from four Mexican firms, believed to account for ***percent of Mexican export shipments in 2008.6
III. DOMESTIC LIKE PRODUCT
A. In General
In determining whether an industry in the United States is materially injured or threatened withmaterial injury by reason of imports of the subject merchandise, the Commission first defines the“domestic like product” and the “industry.”7 Section 771(4)(A) of the Tariff Act of 1930, as amended(“the Tariff Act”), defines the relevant domestic industry as the “producers as a whole of a domestic likeproduct, or those producers whose collective output of a domestic like product constitutes a majorproportion of the total domestic production of the product.”8 In turn, the Tariff Act defines “domestic likeproduct” as “a product which is like, or in the absence of like, most similar in characteristics and useswith, the article subject to an investigation ... .”9
The decision regarding the appropriate domestic like product(s) in an investigation is a factualdetermination, and the Commission has applied the statutory standard of “like” or “most similar incharacteristics and uses” on a case-by-case basis.10 No single factor is dispositive, and the Commissionmay consider other factors it deems relevant based on the facts of a particular investigation.11 TheCommission looks for clear dividing lines among possible like products and disregards minor variations.12
4 CR/PR at III-1. The responding producers other than the petitioning firms are Cambridge Lee, Freeport-McMoRan, H & H, Howell Metal, National Copper, Packless, Precision Tube, S.T. Products, and Wolverine. CR/PR at Table III-1. 5 CR/PR at IV-1, CR/PR at Table IV-1 (list of reporting importers). 6 CR at VII-3, VII-7; PR at VII-3, VII-5. 7 19 U.S.C. § 1677(4)(A). 8 19 U.S.C. § 1677(4)(A). 9 19 U.S.C. § 1677(10). 10 See, e.g., Cleo, Inc. v. United States, 501 F.3d 1291, 1299 (Fed. Cir. 2007); NEC Corp. v. Department ofCommerce, 36 F. Supp. 2d 380, 383 (Ct. Int’l Trade 1998); Nippon Steel Corp. v. United States, 19 CIT 450, 455(1995); Torrington Co. v. United States, 747 F. Supp. 744, 749 n.3 (Ct. Int’l Trade 1990), aff’d, 938 F.2d 1278 (Fed.Cir. 1991) (“every like product determination ‘must be made on the particular record at issue’ and the ‘unique factsof each case’”). The Commission generally considers a number of factors including the following: (1) physicalcharacteristics and uses; (2) interchangeability; (3) channels of distribution; (4) customer and producer perceptionsof the products; (5) common manufacturing facilities, production processes, and production employees; and, whereappropriate, (6) price. See Nippon, 19 CIT at 455 n.4; Timken Co. v. United States, 913 F. Supp. 580, 584 (Ct. Int’lTrade 1996). 11 See, e.g., S. Rep. No. 96-249 at 90-91 (1979). 12 Nippon, 19 CIT at 455; Torrington, 747 F. Supp. at 748-49; see also S. Rep. No. 96-249 at 90-91 (1979)(Congress has indicated that the like product standard should not be interpreted in “such a narrow fashion as topermit minor differences in physical characteristics or uses to lead to the conclusion that the product and article arenot ‘like’ each other, nor should the definition of ‘like product’ be interpreted in such a fashion as to prevent
(continued...)
4
Although the Commission must accept the U.S. Department of Commerce’s (“Commerce”) determinationas to the scope of the imported merchandise that is subsidized or sold at less than fair value,13 theCommission determines what domestic product is like the imported articles Commerce has identified.14 The Commission must base its domestic like product determination on the record in these investigations. The Commission is not bound by prior determinations, even those pertaining to the same importedproducts, but may draw upon previous determinations in addressing pertinent domestic like productissues.15
B. Product Description and Analysis
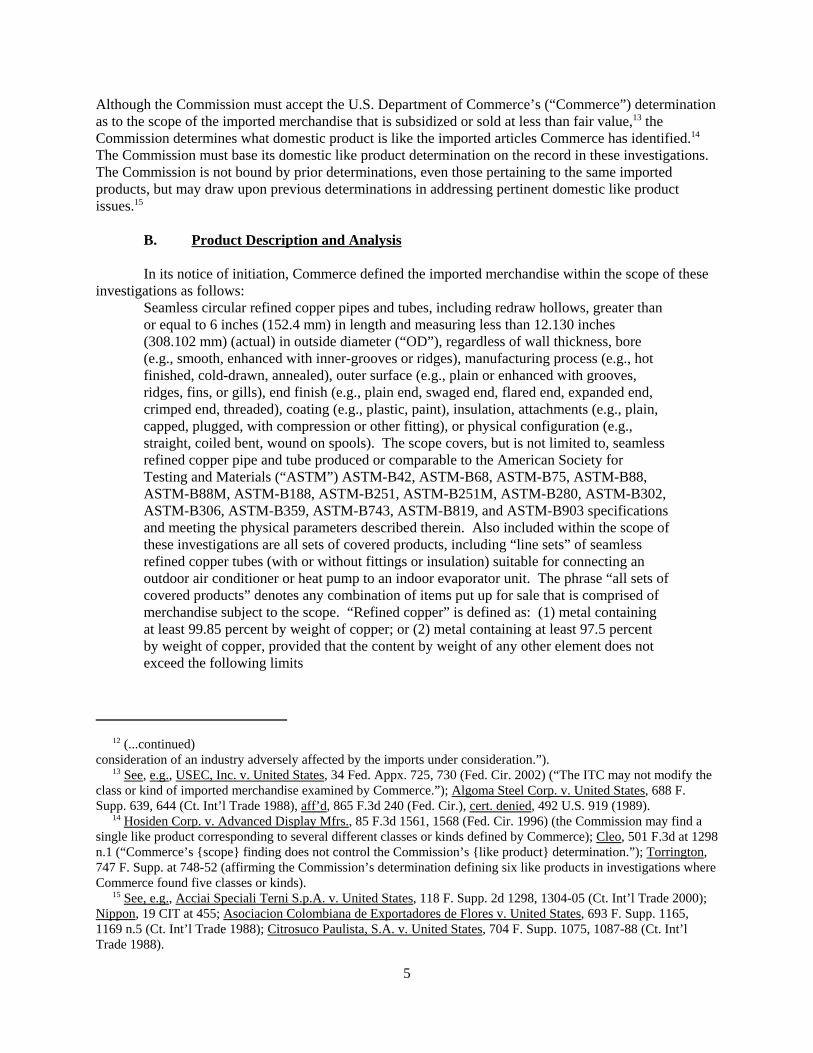
In its notice of initiation, Commerce defined the imported merchandise within the scope of theseinvestigations as follows:
Seamless circular refined copper pipes and tubes, including redraw hollows, greater thanor equal to 6 inches (152.4 mm) in length and measuring less than 12.130 inches(308.102 mm) (actual) in outside diameter (“OD”), regardless of wall thickness, bore(e.g., smooth, enhanced with inner-grooves or ridges), manufacturing process (e.g., hotfinished, cold-drawn, annealed), outer surface (e.g., plain or enhanced with grooves,ridges, fins, or gills), end finish (e.g., plain end, swaged end, flared end, expanded end,crimped end, threaded), coating (e.g., plastic, paint), insulation, attachments (e.g., plain,capped, plugged, with compression or other fitting), or physical configuration (e.g.,straight, coiled bent, wound on spools). The scope covers, but is not limited to, seamlessrefined copper pipe and tube produced or comparable to the American Society forTesting and Materials (“ASTM”) ASTM-B42, ASTM-B68, ASTM-B75, ASTM-B88,ASTM-B88M, ASTM-B188, ASTM-B251, ASTM-B251M, ASTM-B280, ASTM-B302,ASTM-B306, ASTM-B359, ASTM-B743, ASTM-B819, and ASTM-B903 specificationsand meeting the physical parameters described therein. Also included within the scope ofthese investigations are all sets of covered products, including “line sets” of seamlessrefined copper tubes (with or without fittings or insulation) suitable for connecting anoutdoor air conditioner or heat pump to an indoor evaporator unit. The phrase “all sets ofcovered products” denotes any combination of items put up for sale that is comprised ofmerchandise subject to the scope. “Refined copper” is defined as: (1) metal containingat least 99.85 percent by weight of copper; or (2) metal containing at least 97.5 percentby weight of copper, provided that the content by weight of any other element does notexceed the following limits
12 (...continued)consideration of an industry adversely affected by the imports under consideration.”). 13 See, e.g., USEC, Inc. v. United States, 34 Fed. Appx. 725, 730 (Fed. Cir. 2002) (“The ITC may not modify theclass or kind of imported merchandise examined by Commerce.”); Algoma Steel Corp. v. United States, 688 F.Supp. 639, 644 (Ct. Int’l Trade 1988), aff’d, 865 F.3d 240 (Fed. Cir.), cert. denied, 492 U.S. 919 (1989). 14 Hosiden Corp. v. Advanced Display Mfrs., 85 F.3d 1561, 1568 (Fed. Cir. 1996) (the Commission may find asingle like product corresponding to several different classes or kinds defined by Commerce); Cleo, 501 F.3d at 1298n.1 (“Commerce’s {scope} finding does not control the Commission’s {like product} determination.”); Torrington,747 F. Supp. at 748-52 (affirming the Commission’s determination defining six like products in investigations whereCommerce found five classes or kinds). 15 See, e.g., Acciai Speciali Terni S.p.A. v. United States, 118 F. Supp. 2d 1298, 1304-05 (Ct. Int’l Trade 2000);Nippon, 19 CIT at 455; Asociacion Colombiana de Exportadores de Flores v. United States, 693 F. Supp. 1165,1169 n.5 (Ct. Int’l Trade 1988); Citrosuco Paulista, S.A. v. United States, 704 F. Supp. 1075, 1087-88 (Ct. Int’lTrade 1988).
5

ELEMENT LIMITING CONTENT PERCENT BY WEIGHTAg - Silver 0.25As - Arsenic 0.5Cd - Cadmium 1.3Cr - Chromium 1.4Mg - Magnesium 0.8Pb - Lead 1.5S - Sulfur 0.7Sn - Tin 0.8Te - Tellurium 0.8Zn - Zinc 1.0Zr - Zirconium 0.3Other elements (each) 0.3
Excluded from the scope of these investigations are all seamless circular hollows of refinedcopper less than 12 inches in length whose OD (actual) exceeds its length.16 SRC pipe and tube is fabricated of high-purity copper and has a circular cross section.
Depending upon the requirements of industry standards or customer specifications, additionalcharacteristics can include the following: outer surface coatings for corrosion protection or insulation;marking with paint or plastic color coding for product identification; cleaning, pressurizing with nitrogengas, and capping of each end to assure interior cleanliness; end finishes; and attachments.17 SRC pipe and tube applications generally involve fluids under pressure, either for conveyance orclosed-loop thermal transfer, in which copper’s properties (e.g., strength, malleability, thermalconductivity, and corrosion resistance) are important. Conveyance applications include residential,commercial, industrial, and municipal water systems, as well as distribution systems for other liquids andgases. Thermal transfer applications in which SRC pipe and tube are used include heating systems,commercial refrigeration systems, and air-conditioning systems.18
“Plumbing” or “standard” SRC pipe and tube (hereafter “plumbing tube”) is commonly producedto various standards of the American Society for Testing and Materials (“ASTM”), which specifychemical composition, outside diameter, wall thickness, and other characteristics of the SRC pipe or tubebased on end-use applications. Commercial or industrial SRC pipe and tube (hereafter “commercialtube”) is produced to either ASTM specifications or nonstandard specifications of customers, e.g.,original equipment manufacturers (“OEMs”), which can include inner or outer features to enhancethermal transfer capabilities. Common applications for commercial SRC pipe and tube includerefrigeration, freezer, heating, and air conditioner systems and units.19
16 Seamless Refined Copper Pipe and Tube from the People’s Republic of China and Mexico: Initiation ofAntidumping Duty Investigations, 74 Fed. Reg. 55194 (Oct 27, 2009). Commerce explained that the productssubject to these investigations are currently classifiable under subheadings 7411.10.1030, 7411.10.1090 of theHarmonized Tariff Schedule of the United States (HTS), and may also enter under HTSUS subheadings7407.10.1500, 7419.99.5050, 8415.90.8065, and 8415.90.8085. Id. 17 CR at I-7, PR at I-5 18 CR at I-7-8, PR at I-5-6. 19 CR at I-8, PR at I-6.
6

SRC pipe and tube production involves three stages: (1) prefabricating, which includes melting,casting, and either extrusion or rolling of rough tubing; (2) intermediate fabrication, consisting of colddrawing of unfinished tubing; and (3) finishing of the SRC pipe and tube.20
C. Parties’ Arguments
Petitioners request that the Commission define a single domestic like product consisting of allSRC pipe and tube, coterminous with the scope of these investigations.21 While Mexican Respondents donot contest Petitioners’ proposed definition of the domestic like product at the preliminary phase of theseinvestigations, they contend that the record would support defining plumbing tube and SRC commercialtube as separate domestic like products.22 Luvata urges the Commission to note the distinction betweenplumbing and commercial tube as a relevant condition of competition in the SRC pipe and tube market,and relies in that regard upon the factors the Commission traditionally considers in defining the domesticlike product.23
Petitioners assert that all SRC pipe and tube share the same basic physical characteristics and usesin that all SRC pipes and tubes are seamless products, they have circular cross sections, they consistentirely or virtually entirely of refined copper, and they are used to transport fluids, either in conveyanceapplications or in closed loops for thermal transfer. Petitioners contend that there is some degree ofinterchangeability between plumbing and commercial tube. All plumbing tube must conform to ASTMspecifications and some commercial tube is also produced to ASTM specifications, and the specificationsof purchasers of commercial tube can mirror ASTM specifications or can be stated in terms of ASTMspecifications with adjustments or additions.24 They maintain that, although plumbing tube is generallysold to distributors and retailers and commercial tube is generally sold to OEMs, there is some overlap inchannels of distribution between plumbing and commercial tube.25 Petitioners argue that, overall,customers perceive SRC pipe and tube as a single product, with a broad mix of variations across acontinuum. They also claim that the prefabrication stage of production for plumbing and commercialtube is generally the same, that some U.S. producers manufacture both plumbing and commercial tube,and that at least one producer does so in the same facilities, using common production equipment andemployees.26 Petitioners acknowledge that the methods for setting prices for plumbing and commercialtube differ. Plumbing tube is sold at a discount off published price lists whereas commercial tube is soldat the price of the copper at the time of the sale plus a fabrication charge negotiated annually between theSRC pipe and tube mill and the OEM purchaser. Petitioners claim that, notwithstanding these pricingstructure differences, prices for SRC pipe and tube products generally fall within a continuum of pricesthat are ultimately determined primarily by the market price for copper as well as variations in finishingcosts and relative demand for different SRC pipe and tube products.27
Mexican Respondents note, regarding physical characteristic and uses, that plumbing tube is usedin residential and commercial construction for water distribution, while commercial tube is
20 CR at I-11, I-9. 21 Petition at 35-36, Petitioners Postconference Brief at 9-15. 22 Mexican Respondents Postconference Brief at 5-7. 23 Luvata Postconference Brief at 7-15. 24 Petitioners Postconference Brief at 9-11. 25 Petitioners Postconference Brief at 12. 26 Petitioners Postconference Brief at 13. Petitioners assert that Kobe Wieland and Cerro produce both plumbingand commercial tube, but they do not suggest that Cerro does so in the same facilities with the same workers. Instead, Petitioners refer to Kobe Wieland as the only domestic producer that produces both plumbing andcommercial tube on the same production line at its Pine Hall, North Carolina facility. 27 Petitioners Postconference Brief at 14.
7

predominantly used for containing refrigerants. They assert that plumbing tube is sold in both straightlengths and coils and is smooth internally and externally, whereas, they contend, commercial tube ispredominantly sold in coils and is often internally “rifled,” i.e., striated or textured.28 Luvata similarlyargues that plumbing and commercial tubing differ in several key respects, including shape, length,temper, diameter, thermal conductivity, and smoothness of interior surfaces, which determine the uses forwhich the plumbing and commercial tubing are ideally suited.29 Luvata also asserts, based on thesedifferences, that plumbing and commercial tube are not interchangeable.30 Mexican Respondents andLuvata contend that channels of distribution also differ, with plumbing tube sold ready for installationthrough distributors and retailers, and commercial tube sold for further manufacture to OEMs, primarilymanufacturers of air conditioning units.31 Mexican Respondents argue that plumbing and commercialtube are generally produced in different facilities with different workers, with each U.S. producer ***.32 Luvata claims that plumbing and commercial tube are most efficiently manufactured using differentprocesses and that switching production between plumbing and commercial tubes requires fundamentalchanges and substantial investments.33 Luvata claims that customers and producers perceive differencesbetween plumbing and commercial tube. It contends that plumbing tube is essentially a commodityproduct while commercial tube is subject to more exacting specifications of individual commercial tubepurchasers.34 Mexican Respondents and Luvata also cite the distinction between the approaches forsetting prices in the sale of plumbing and commercial tube.35
D. Analysis
Physical Characteristics and Uses. All SRC pipe and tube share certain basic physicalcharacteristics, including being seamless, made of refined copper, and having a circular cross section. AllSRC pipe and tube are used to transport or circulate fluids.36 The record indicates, however, thatspecifications for SRC pipe and tube used in plumbing applications and SRC pipe and tube used incommercial applications generally differ, with plumbing tube conforming to ASTM standards andcommercial tube conforming to individual OEMs’ specifications or ASTM standards. For instance, itappears that tube meeting certain ASTM standards (e.g., ASTM designations B-280, B-903, Type K,Type L, Type M, DWV, and ARC/RST) is designated for use in commercial applications (i.e., inconjunction with heating, ventilation, air conditioning and refrigeration systems), but some may also beused in plumbing applicatons.37 Accordingly, there is some degree of similarity in the physicalcharacteristics and uses of plumbing and commercial tube, although the current record does not shedmuch light on the extent of that similarity. Interchangeability. The limited record in these preliminary phase investigations also indicatesthat there is at least some interchangeability between plumbing tube and commercial tube. Requirementsfor commercial tube can include the same ASTM standards applicable to plumbing tube, or can mirrorASTM standards, or reflect ASTM standards plus other elements. According to Petitioners, distributors
28 Mexican Respondents Postconference Brief at 5-6. 29 Luvata Postconference Brief at 8-9. 30 Luvata Postconference Brief at 9-10. 31 Mexican Respondents Postconference Brief at 6, Luvata Postconference Brief at 10-11. 32 Mexican Respondents Postconference Brief at 5-7. 33 Luvata Postconference Brief at 12-13. 34 Luvata Postconference Brief at 11-12. 35 Mexican Respondents Postconference Brief at 7, Luvata Postconference Brief at 13-14. 36 See CR/PR at Tables I-1, I-2. 37 See CR/PR at Tables I-1, I-2; Petitioners Postonference Exhibit 1.
8

and converters can purchase commercial tube and repackage it for resale as plumbing tube, or maypurchase plumbing tube and convert it for resale as commercial tube product.38
Channels of distribution. All parties agree that domestic producers generally sell SRC pipe andtube for plumbing applications to distributors and retailers and that they generally sell commercial tube toOEMs. It appears, however, that both distributors and SRC pipe and tube mills sell tube conforming toASTM designations (e.g., Type K, Type L, Type M, DWV, and ARC/RST) to OEMs.39 Accordingly,there appears to be overlap between the channels through which plumbing and commercial tube are sold.
Common Manufacturing Facilities, Production Processes, and Production Employees. Theinitial stages of production are the same for plumbing and commercial tube and, therefore, they can beproduced in the same facilities with the same processes, and production employees. Although someproducers confine their production to either plumbing tube or commercial tube, certain producers produceboth plumbing and commercial tube, and at least one producer manufactures both in the same facilitywith the same employees. Thus, the limited information in this record suggests that there is some degreeof shared facilities, processes, and employees in the production of plumbing and commercial tube.
Producer and Customer Perceptions. Although producers and customers may view SRC pipeand tube to some extent as falling on a continuum of a single product, the record indicates that marketparticipants also perceive a distinction between plumbing and commercial tube.
Price. It is uncontested that plumbing and commercial tube are sold under different pricestructures. Plumbing tube is sold on the spot market at a discount off price lists published by certaindomestic producers, whereas commercial tube is sold at the contemporaneous COMEX price of copperplus a negotiated per-pound fabrication charge that is fixed for a 12-month period.40 Notwithstanding thedifferent pricing structures, domestic producers maintain that prices for SRC pipe and tube overall mayfall generally on a continuum of prices determined primarily by the prevailing market price for copper,variations in finishing costs, and relative demand for different SRC pipe and tube products.41
Conclusion. The record indicates that plumbing and commercial tube possess both similaritiesand differences with respect to physical characteristics and uses. There appears, moreover, to be at least aminimal degree of interchangeability between plumbing and commercial tube, as well as some similaritiesin terms of the channels through which they are traded, and some commonality of manufacturing facilitiesand employees. Although plumbing and commercial tube are sold under different price structures, thecurrent record is not clear as to whether or to what extent those structural differences result in actual pricedifferences between plumbing and commercial tube. Therefore, we conclude, on the basis of the currentrecord, that there is not a clear dividing line between plumbing and commercial tube. We note, moreover,that most respondent parties do not disagree with Petitioners’ view that all SRC pipe and tube constitute asingle domestic like product. We also note that the Mexican Respondents and Luvata have not framedtheir arguments as requests to define plumbing and commercial tube as separate domestic like productsfor purposes of these preliminary phase investigations.42 Accordingly, we find one domestic like product,coterminous with the scope, consisting of all SRC pipe and tube. We intend in any final phase of theseinvestigations to solicit additional information on the distinctions between plumbing and commercialtube.
38 Petitioners Postconference Brief at 9-11. 39 Petitioners Postconference Brief at 12. 40 Mexican Respondents Postconference Brief at 7, Luvata Postconference Brief at 13-14. 41 Petitioners Postconference Brief at 14. 42 Luvata notes that the welded copper tube produced by Luvata Franklin, Inc. is not within the domestic likeproduct. Luvata does not request expansion of the domestic like product to include welded copper tube. Rather,Luvata asserts simply that welded copper tube, although more costly than SRC pipe and tube, can be substituted forSRC pipe and tube under certain circumstances. Luvata Postconference Brief at at 3-4.
9
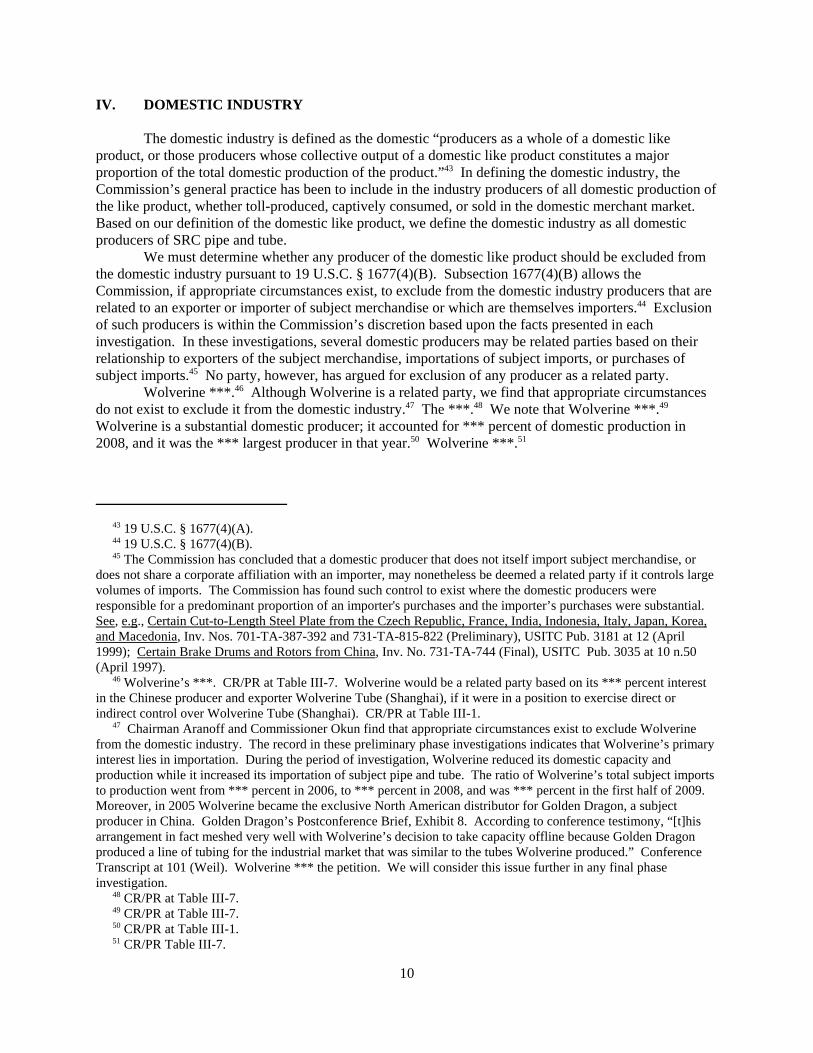
IV. DOMESTIC INDUSTRY
The domestic industry is defined as the domestic “producers as a whole of a domestic likeproduct, or those producers whose collective output of a domestic like product constitutes a majorproportion of the total domestic production of the product.”43 In defining the domestic industry, theCommission’s general practice has been to include in the industry producers of all domestic production ofthe like product, whether toll-produced, captively consumed, or sold in the domestic merchant market. Based on our definition of the domestic like product, we define the domestic industry as all domesticproducers of SRC pipe and tube.
We must determine whether any producer of the domestic like product should be excluded fromthe domestic industry pursuant to 19 U.S.C. § 1677(4)(B). Subsection 1677(4)(B) allows theCommission, if appropriate circumstances exist, to exclude from the domestic industry producers that arerelated to an exporter or importer of subject merchandise or which are themselves importers.44 Exclusionof such producers is within the Commission’s discretion based upon the facts presented in eachinvestigation. In these investigations, several domestic producers may be related parties based on theirrelationship to exporters of the subject merchandise, importations of subject imports, or purchases ofsubject imports.45 No party, however, has argued for exclusion of any producer as a related party.
Wolverine ***.46 Although Wolverine is a related party, we find that appropriate circumstancesdo not exist to exclude it from the domestic industry.47 The ***.48 We note that Wolverine ***.49 Wolverine is a substantial domestic producer; it accounted for *** percent of domestic production in2008, and it was the *** largest producer in that year.50 Wolverine ***.51
43 19 U.S.C. § 1677(4)(A). 44 19 U.S.C. § 1677(4)(B). 45 The Commission has concluded that a domestic producer that does not itself import subject merchandise, ordoes not share a corporate affiliation with an importer, may nonetheless be deemed a related party if it controls largevolumes of imports. The Commission has found such control to exist where the domestic producers wereresponsible for a predominant proportion of an importer's purchases and the importer’s purchases were substantial.See, e.g., Certain Cut-to-Length Steel Plate from the Czech Republic, France, India, Indonesia, Italy, Japan, Korea,and Macedonia, Inv. Nos. 701-TA-387-392 and 731-TA-815-822 (Preliminary), USITC Pub. 3181 at 12 (April1999); Certain Brake Drums and Rotors from China, Inv. No. 731-TA-744 (Final), USITC Pub. 3035 at 10 n.50(April 1997). 46 Wolverine’s ***. CR/PR at Table III-7. Wolverine would be a related party based on its *** percent interestin the Chinese producer and exporter Wolverine Tube (Shanghai), if it were in a position to exercise direct orindirect control over Wolverine Tube (Shanghai). CR/PR at Table III-1. 47 Chairman Aranoff and Commissioner Okun find that appropriate circumstances exist to exclude Wolverinefrom the domestic industry. The record in these preliminary phase investigations indicates that Wolverine’s primaryinterest lies in importation. During the period of investigation, Wolverine reduced its domestic capacity andproduction while it increased its importation of subject pipe and tube. The ratio of Wolverine’s total subject importsto production went from *** percent in 2006, to *** percent in 2008, and was *** percent in the first half of 2009. Moreover, in 2005 Wolverine became the exclusive North American distributor for Golden Dragon, a subjectproducer in China. Golden Dragon’s Postconference Brief, Exhibit 8. According to conference testimony, “[t]hisarrangement in fact meshed very well with Wolverine’s decision to take capacity offline because Golden Dragonproduced a line of tubing for the industrial market that was similar to the tubes Wolverine produced.” ConferenceTranscript at 101 (Weil). Wolverine *** the petition. We will consider this issue further in any final phaseinvestigation. 48 CR/PR at Table III-7. 49 CR/PR at Table III-7. 50 CR/PR at Table III-1. 51 CR/PR Table III-7.
10

The Petitioners argue that *** and that excluding Wolverine would skew the Commission’sanalysis of the condition of the domestic industry by disregarding these closures.52 The record, however,is not clear as to whether subject imports may have played a role in the closure of any U.S. operations. Wolverine reports that it closed its Decatur, Alabama manufacturing operation facilities in December2007 “due to the competitive nature of the majority of products produced in Decatur,” but does not statewhether, or to what extent, subject imports may have been part of this competition.53 The Commissionwill continue to explore the nature of this competition in any final phase investigations.
For purposes of these preliminary phase investigations, we do not find that appropriatecircumstances exist to exclude Wolverine as a related party. The record does not reflect that Wolverine isin a position to exercise direct or indirect control over Wolverine Tube (Shanghai). Wolverine has been asubstantial domestic producer throughout the period of investigation. Its interests appear to have beenfocused on domestic production and importation at different times during the period of investigation, andit is unclear why its interests appear to have changed. Moreover, Wolverine *** in view of its ***operating performance. Its operating income as a ratio of net sales was *** the industry average ***.54 55
56 Therefore, we do not find appropriate circumstances to exclude Wolverine from the domestic industry,although we intend to examine this issue in any final phase investigations.
Cambridge Lee is wholly owned by IUSA, a Mexican producer and exporter of SRC pipe andtube and, therefore, Cambridge Lee is a related party.57 ***.58 We find, however, that appropriatecircumstances do not exist to exclude Cambridge Lee from the domestic industry. ***.59 ***. Nonetheless, Cambridge Lee accounted for *** percent of domestic production in 2008 and is, thus, the*** domestic producer. Moreover, Cambridge Lee *** in view of its *** operating performance for mostof the period. Its operating income as a ratio of net sales was *** the industry average from 2006 to2008, and *** the average *** in interim 2009.60 61 Accordingly, we find, on balance, that circumstancesare not appropriate to exclude Cambridge Lee from the domestic industry, although we also intend toreview this issue in any final phase investigations.
52 Petitioner’s Postconference Brief at 16. 53 ***. CR/PR at Table III-3. ***. 54 CR/PR at Table VI-2. 55 In these investigations, Vice Chairman Aranoff does not rely on individual company operating income marginsin assessing whether particular related parties benefit from importation of subject merchandise. Rather, she has basedher determination regarding whether to exclude related parties principally on their ratios of subject imports todomestic shipments and on whether their primary interests lie in domestic production or importation. As discussedabove, appropriate circumstances exist to exclude Wolverine. 56 For purposes of the preliminary phase of these investigations, Commissioner Pinkert does not rely uponfinancial performance as a factor in determining whether there are appropriate circumstances to exclude relatedparties from the domestic industry. The present record is not sufficient to infer from the companies’ profitability ontheir U.S. operations whether they have derived a specific benefit from importing. See Allied Mineral Products v.United States, 28 C.I.T. 1861, 1865-67 (2004). 57 CR/PR at Table III-1. 58 CR/PR at Table III-7. 59 CR/PR at Table III-7. 60 CR/PR at Table VI-2. 61 Chairman Aranoff does not rely on individual company operating income margins in assessing whetherparticular related parties benefit from importation of subject merchandise. Rather, she bases her determinationregarding whether to exclude related parties principally on their ratios of subject imports to domestic shipments andon whether their primary interests lie in domestic production or importation.
Despite a relatively high subject imports to domestic shipment ratio, she does not find that Cambridge Leeshowed a decline in its domestic production proportional to its increase in imports. Therefore, she does not find thatappropriate circumstances exist to exclude Cambridge Lee from the domestic industry.
11
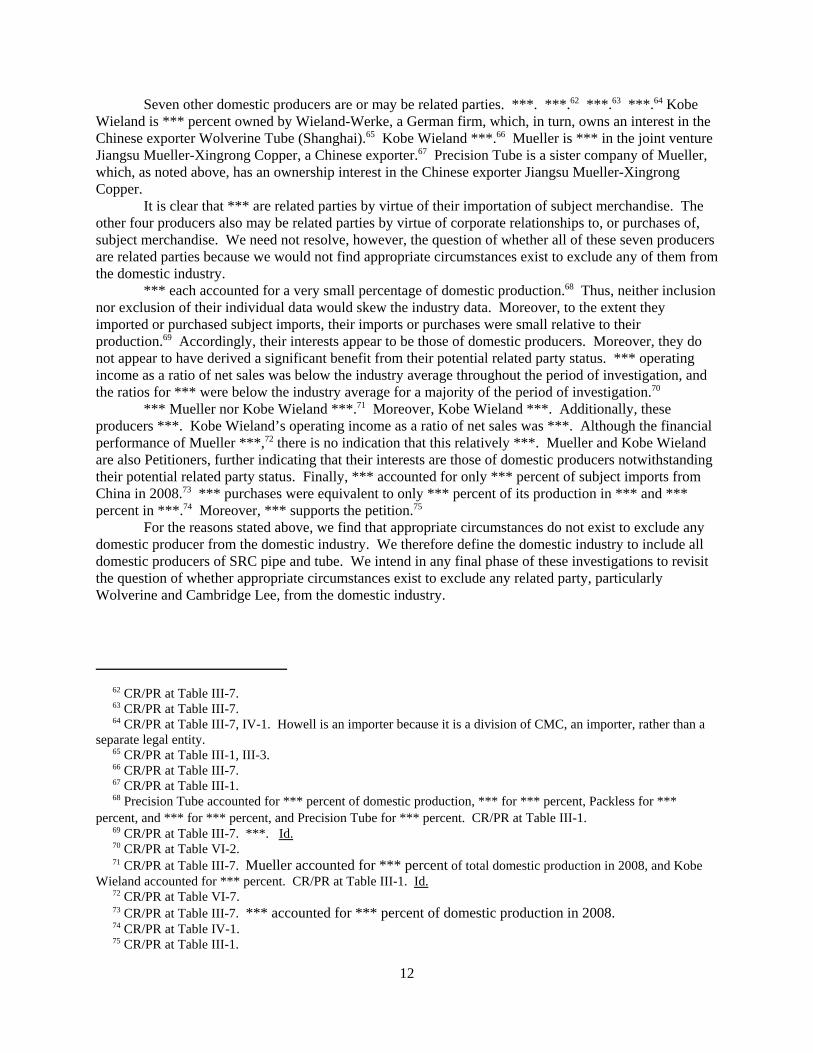
Seven other domestic producers are or may be related parties. ***. ***.62 ***.63 ***.64 KobeWieland is *** percent owned by Wieland-Werke, a German firm, which, in turn, owns an interest in theChinese exporter Wolverine Tube (Shanghai).65 Kobe Wieland ***.66 Mueller is *** in the joint ventureJiangsu Mueller-Xingrong Copper, a Chinese exporter.67 Precision Tube is a sister company of Mueller,which, as noted above, has an ownership interest in the Chinese exporter Jiangsu Mueller-XingrongCopper.
It is clear that *** are related parties by virtue of their importation of subject merchandise. Theother four producers also may be related parties by virtue of corporate relationships to, or purchases of,subject merchandise. We need not resolve, however, the question of whether all of these seven producersare related parties because we would not find appropriate circumstances exist to exclude any of them fromthe domestic industry.
*** each accounted for a very small percentage of domestic production.68 Thus, neither inclusionnor exclusion of their individual data would skew the industry data. Moreover, to the extent theyimported or purchased subject imports, their imports or purchases were small relative to theirproduction.69 Accordingly, their interests appear to be those of domestic producers. Moreover, they donot appear to have derived a significant benefit from their potential related party status. *** operatingincome as a ratio of net sales was below the industry average throughout the period of investigation, andthe ratios for *** were below the industry average for a majority of the period of investigation.70
*** Mueller nor Kobe Wieland ***.71 Moreover, Kobe Wieland ***. Additionally, theseproducers ***. Kobe Wieland’s operating income as a ratio of net sales was ***. Although the financialperformance of Mueller ***,72 there is no indication that this relatively ***. Mueller and Kobe Wielandare also Petitioners, further indicating that their interests are those of domestic producers notwithstandingtheir potential related party status. Finally, *** accounted for only *** percent of subject imports fromChina in 2008.73 *** purchases were equivalent to only *** percent of its production in *** and ***percent in ***.74 Moreover, *** supports the petition.75
For the reasons stated above, we find that appropriate circumstances do not exist to exclude anydomestic producer from the domestic industry. We therefore define the domestic industry to include alldomestic producers of SRC pipe and tube. We intend in any final phase of these investigations to revisitthe question of whether appropriate circumstances exist to exclude any related party, particularlyWolverine and Cambridge Lee, from the domestic industry.
62 CR/PR at Table III-7. 63 CR/PR at Table III-7. 64 CR/PR at Table III-7, IV-1. Howell is an importer because it is a division of CMC, an importer, rather than aseparate legal entity. 65 CR/PR at Table III-1, III-3. 66 CR/PR at Table III-7. 67 CR/PR at Table III-1. 68 Precision Tube accounted for *** percent of domestic production, *** for *** percent, Packless for ***percent, and *** for *** percent, and Precision Tube for *** percent. CR/PR at Table III-1. 69 CR/PR at Table III-7. ***. Id. 70 CR/PR at Table VI-2. 71 CR/PR at Table III-7. Mueller accounted for *** percent of total domestic production in 2008, and KobeWieland accounted for *** percent. CR/PR at Table III-1. Id. 72 CR/PR at Table VI-7. 73 CR/PR at Table III-7. *** accounted for *** percent of domestic production in 2008. 74 CR/PR at Table IV-1. 75 CR/PR at Table III-1.
12

V. CUMULATION
For purposes of evaluating the volume and price effects for a determination of material injury byreason of the subject imports, section 771(7)(G)(i) of the Act requires the Commission to assesscumulatively the volume and effect of imports of the subject merchandise from all countries as to whichpetitions were filed and/or investigations self-initiated by Commerce on the same day, if such importscompete with each other and with the domestic like products in the U.S. market.76 In assessing whethersubject imports compete with each other and with the domestic like product,77 the Commission hasgenerally considered the following four factors:
(1) the degree of fungibility between the subject imports from different countries andbetween imports and the domestic like product, including consideration of specificcustomer requirements and other quality related questions;
(2) the presence of sales or offers to sell in the same geographic markets of subjectimports from different countries and the domestic like product;
(3) the existence of common or similar channels of distribution for subject importsfrom different countries and the domestic like product; and
(4) whether the subject imports are simultaneously present in the market.78
Although no single factor is necessarily determinative, and the list of factors is not exclusive,these factors are intended to provide the Commission with a framework for determining whether thesubject imports compete with each other and with the domestic like product.79 Only a “reasonableoverlap” of competition is required.80
A. Parties’ Arguments
Petitioners and the Chinese producer Hailiang contend that the Commission should cumulatesubject imports from China and Mexico as there is a reasonable overlap of competition. They assert thatthe domestic like product and subject imports from China and Mexico are fungible and that there isconsiderable overlap between them, notwithstanding the greater focus of the imports from Mexico onplumbing tube and the greater focus of imports from China on commercial tube. They contend that thegeographic overlap and simultaneous presence requirement are also satisfied. They also argue that thedomestic like product and subject imports from China and Mexico are sold through the same channels ofdistribution.81
Mexican Respondents contend that these investigations are concerned solely with threat ofmaterial injury and, therefore, they limit their cumulation arguments to the Commission’s threat analysis. They argue, in the context of cumulation for purposes of threat of material injury, that the subject importsare not substantially fungible because the SRC pipe and tube from China are concentrated in commercial
76 19 U.S.C. § 1677(7)(G)(i). 77 The SAA expressly states that “the new section will not affect current Commission practice under which thestatutory requirement is satisfied if there is a reasonable overlap of competition.” SAA, H.R. Rep. 103-316, vol. I at848 (1994), citing Fundicao Tupy, S.A. v. United States, 678 F. Supp. 898, 902 (Ct. Int’l Trade 1988), aff’d, 859F.2d 915 (Fed. Cir. 1988). 78 See Certain Cast-Iron Pipe Fittings from Brazil, the Republic of Korea, and Taiwan, Inv. Nos. 731-TA-278-280(Final), USITC Pub. 1845 (May 1986) at 8 n.29, aff’d sub nom. Fundicao Tupy, S.A. v. United States, 678 F. Supp.898 (Ct. Int’l Trade), aff’d, 859 F.2d 915 (Fed. Cir. 1988). 79 See, e.g., Wieland Werke, AG v. United States, 718 F. Supp. 50 (Ct. Int’l Trade 1989). 80 See Goss Graphic System, Inc. v. United States, 33 F. Supp. 2d 1082, 1087 (Ct. Int’l Trade 1998) (“cumulationdoes not require two products to be highly fungible”); Mukand Ltd. v. United States, 937 F. Supp. 910, 916 (Ct. Int’lTrade 1996); Wieland Werke, 718 F. Supp. at 52 (“Completely overlapping markets are not required.”). 81 Petitioners Postconference Brief at 25-29, Hailiang Postconference Brief at 2-7.
13

tube and the SRC pipe and tube from Mexico is concentrated in plumbing tube. They also contend thatplumbing and commercial tube are generally sold through different channels of distribution and are priceddifferently.82 These arguments are also relevant to the Commission’s present material injury cumulationanalysis.
B. Analysis
In these investigations, the threshold criterion is satisfied because the Petitioners filed theantidumping duty petitions with respect to China and Mexico on the same day. None of the cumulationexceptions applies. Subject imports from China and Mexico are therefore eligible for cumulation. Weconsequently examine whether there is a reasonable overlap of competition between subject imports fromChina and Mexico, as well as among subject imports and the domestic like product.
Fungibility.83 There appears to be a reasonable degree of fungibility with respect to the subjectimports from China and Mexico as well as with respect to the subject imports from each source and thedomestic like product. The questionnaire responses indicate that market participants perceive domesticSRC pipe and tube and subject imports to be interchangeable. A majority of responding domesticproducers and importers reported that the domestic product is always or frequently interchangeable withthe subject imports from each subject source and that the Chinese and Mexican SRC pipe and tube areinterchangeable with each other.84
The available data suggest that, notwithstanding the greater focus of the imports from Mexico onplumbing tube and the greater focus of imports from China on commercial tube, the subject imports fromboth China and Mexico include both plumbing and commercial tube to some degree. We note, moreover,that Petitioners assert that there is at least some degree of fungibility among products used for plumbingand commercial and industrial purposes.85 We intend to further examine this issue in any final phaseinvestigations.
Geographic Overlap. All responding domestic producers reported that they serve a nationwidemarket.86 Official Commerce statistics show that the largest ports of entry for both the Chinese and theMexican imports were in Texas, with more than one-half the subject imports from China entering atHouston-Galveston and Dallas-Fort Worth and a large majority of the subject imports from Mexicoentering the port at Laredo.87 Moreover, 12 of 34 importers reported that they serve a nationwidemarket.88 Additionally, it appears, as Petitioners allege, that although some importers sell subject importsfrom China or Mexico only to a limited number of geographic regions, in the aggregate importers sellsubject imports to all geographic regions within the continental United States.89 Accordingly, the recordindicates that there was significant geographic overlap between the subject imports from China andMexico and between subject imports and the domestic like product.
82 Mexican Respondents Postconference Brief at 35-41. 83 Commissioner Lane notes that, with respect to fungibility, her analysis does not require such similarity ofproducts that a perfectly symmetrical fungibility is required, and she notes that this factor would be better describedas an analysis of whether subject imports from each country and the domestic like product could be substituted foreach other. See Separate Views of Commissioner Charlotte R. Lane, Certain Lightweight Thermal Paper fromChina, Germany, and Korea, Invs. Nos. 701-TA-451 and 731-TA-1126 to 1128 (Prelim.), USITC Pub. 3964 (Nov.2007). 84 CR/PR at Table II-2. 85 See Petitioners Postconference Brief at 10. 86 CR/PR at II-1. 87 CR/PR at Tables IV-4, IV-5. 88 CR/PR at II-1. 89 Petitioners Postconference Brief at 27-28.
14

Channels of Distribution. Closely related to the fungibility issue, U.S. producers’ shipments andshipments of subject imports from China and Mexico all included shipments to both distributors and endusers. A very rough indication of the relative shares of the subject imports and the domestic like productaccounted for by plumbing and commercial tube is provided by the fact that sales to distributors may beconcentrated in plumbing tube, whereas sales to OEMs may generally reflect sales of commercial tube. Over the period of investigation, shipments of the domestic like product ranged between 60 and 64percent to distributors and between 36 and 40 percent to OEMs. Subject imports from China rangedbetween 7 and 14 percent to distributors and between 86 and 93 percent to OEMs. Subject imports fromMexico, on the other hand, ranged between *** percent and *** percent to distributors and between ***and *** percent to OEMs.90 Accordingly, imports from each subject source appear to overlap in channelsof distribution more with the domestic like product than with each other but, nevertheless, there issufficient overlap between the subject imports from China and Mexico to support cumulation.
Simultaneous Presence. Official import statistics show that subject imports from China andthose from Mexico have each been present in the U.S. market in each month of the period ofinvestigation.91
Conclusion. Although it appears that there may be some limits on fungibility as betweenplumbing and commercial tube, channel of distribution data indicate that both plumbing and commercialtube were included among the shipments of domestic tube, subject imports from China, and subjectimports from Mexico. We find that the tube-type and channel of distribution overlaps between thesubject imports from China and Mexico are sufficient to support cumulation, particularly given theabsence, on this limited preliminary phase record, of more direct and specific information on fungibilityand actual plumbing to commercial tube ratios. Accordingly, on these bases, and because there isgeographic overlap and simultaneous presence, we find that there is a reasonable overlap of competitionbetween subject imports from China and Mexico and between subject imports and the domestic likeproduct. Therefore, we cumulatively assess the volume and effects of subject imports from China andMexico for purposes of determining whether there is reasonable indication that the domestic industry ismaterially injured by reason of the subject imports. In any final phase of these investigations, we willsolicit further information on the extent to which subject imports from China and Mexico are fungiblewith each other and the extent to which they are sold in the same channels of distribution. VI. REASONABLE INDICATION OF MATERIAL INJURY BY REASON OF SUBJECT
IMPORTS92
A. Legal Standard
In the preliminary phase of antidumping or countervailing duty investigations, the Commissiondetermines whether there is a reasonable indication that an industry in the United States is materiallyinjured or threatened with material injury by reason of the imports under investigation.93 In making thisdetermination, the Commission must consider the volume of subject imports, their effect on prices for thedomestic like product, and their impact on domestic producers of the domestic like product, but only in
90 CR/PR at Table II-1. 91 CR/PR at Table IV-6. 92 Negligibility under 19 U.S.C. § 1677(24) is not an issue in these investigations. Subject imports from eachsubject country far exceeded the negligibility threshold during the period September 2008 to August 2009, the mostrecent 12-month period preceding the filing of the petition for which data are available. Specifically, by quantity,subject imports from China accounted for 44.7 percent, and subject imports from Mexico for 29.3 percent, of totalimports of SRC pipe and tube in that period. CR/PR at IV-12. 93 19 U.S.C. §§ 1671b(a), 1673b(a).
15

the context of U.S. production operations.94 The statute defines “material injury” as “harm which is notinconsequential, immaterial, or unimportant.”95 In assessing whether there is a reasonable indication thatthe domestic industry is materially injured by reason of subject imports, we consider all relevanteconomic factors that bear on the state of the industry in the United States.96 No single factor isdispositive, and all relevant factors are considered “within the context of the business cycle andconditions of competition that are distinctive to the affected industry.”97
Although the statute requires the Commission to determine whether there is a reasonableindication that the domestic industry is “materially injured by reason of” unfairly traded imports,98 it doesnot define the phrase “by reason of,” indicating that this aspect of the injury analysis is left to theCommission’s reasonable exercise of its discretion.99 In identifying a causal link, if any, between subjectimports and material injury to the domestic industry, the Commission examines the facts of record thatrelate to the significance of the volume and price effects of the subject imports and any impact of thoseimports on the condition of the domestic industry. This evaluation under the “by reason of” standardmust ensure that subject imports are more than a minimal or tangential cause of injury and that there is asufficient causal, not merely a temporal, nexus between subject imports and material injury.100
In many investigations, there are other economic factors at work, some or all of which may alsobe having adverse effects on the domestic industry. Such economic factors might include nonsubjectimports; changes in technology, demand, or consumer tastes; competition among domestic producers; ormanagement decisions by domestic producers. The legislative history explains that the Commission mustexamine factors other than subject imports to ensure that it is not attributing injury from other factors tothe subject imports, thereby inflating an otherwise tangential cause of injury into one that satisfies thestatutory material injury threshold.101 In performing its examination, however, the Commission need not
94 19 U.S.C. § 1677(7)(B)( i). The Commission “may consider such other economic factors as are relevant to thedetermination” but shall “identify each {such} factor ... {a}nd explain in full its relevance to the determination.” 19 U.S.C. § 1677(7)(B). 95 19 U.S.C. § 1677(7)(A). 96 19 U.S.C. § 1677(7)(C)(iii). 97 19 U.S.C. § 1677(7)(C)(iii). 98 19 U.S.C. §§ 1671b(a), 1673b(a). 99 Angus Chemical Co. v. United States, 140 F.3d 1478, 1484-85 (Fed. Cir. 1998) (“{T}he statute does not‘compel the commissioners’ to employ {a particular methodology}.”), aff’g 944 F. Supp. 943, 951 (Ct. Int’l Trade1996). 100 The Federal Circuit, in addressing the causation standard of the statute, observed that “{a}s long as its effectsare not merely incidental, tangential, or trivial, the foreign product sold at less than fair value meets the causationrequirement.” Nippon Steel Corp. v. USITC, 345 F.3d 1379, 1384 (Fed. Cir. 2003). This was further ratified inMittal Steel Point Lisas Ltd. v. United States, 542 F.3d 867, 873 (Fed. Cir. 2008), where the Federal Circuit, quotingGerald Metals, Inc. v. United States, 132 F.3d 716, 722 (Fed. Cir. 1997), stated that “this court requires evidence inthe record ‘to show that the harm occurred “by reason of” the LTFV imports, not by reason of a minimal ortangential contribution to material harm caused by LTFV goods.’” See also Nippon Steel Corp. v. United States, 458F.3d 1345, 1357 (Fed. Cir. 2006); Taiwan Semiconductor Industry Ass’n v. USITC, 266 F.3d 1339, 1345 (Fed. Cir.2001). 101 Statement of Administrative Action (“SAA”) on Uruguay Round Agreements Act (“URAA”), H.R. Rep. 103-316, Vol. I at 851-52 (1994) (“{T}he Commission must examine other factors to ensure that it is not attributinginjury from other sources to the subject imports.”); S. Rep. 96-249 at 75 (1979) (the Commission “will considerinformation which indicates that harm is caused by factors other than less-than-fair-value imports.”); H.R. Rep. 96-317 at 47 (1979) (“in examining the overall injury being experienced by a domestic industry, the ITC will take intoaccount evidence presented to it which demonstrates that the harm attributed by the petitioner to the subsidized ordumped imports is attributable to such other factors;” those factors include “the volume and prices of nonsubsidizedimports or imports sold at fair value, contraction in demand or changes in patterns of consumption, trade restrictivepractices of and competition between the foreign and domestic producers, developments in technology and the
(continued...)
16

isolate the injury caused by other factors from injury caused by unfairly traded imports.102 Nor does the“by reason of” standard require that unfairly traded imports be the “principal” cause of injury orcontemplate that injury from unfairly traded imports be weighed against other factors, such as nonsubjectimports, which may be contributing to overall injury to an industry.103 It is clear that the existence ofinjury caused by other factors does not compel a negative determination.104
Assessment of whether material injury to the domestic industry is “by reason of” subject imports“does not require the Commission to address the causation issue in any particular way” as long as “theinjury to the domestic industry can reasonably be attributed to the subject imports” and the Commission“ensure{s} that it is not attributing injury from other sources to the subject imports.”105 106 Indeed, the
101 (...continued)export performance and productivity of the domestic industry”); accord Mittal Steel, 542 F.3d at 877. 102 SAA at 851-52 (“{T}he Commission need not isolate the injury caused by other factors from injury caused byunfair imports.”); Taiwan Semiconductor Industry Ass’n v. USITC, 266 F.3d 1339, 1345 (Fed. Cir. 2001) (“{T}heCommission need not isolate the injury caused by other factors from injury caused by unfair imports ... . Rather, theCommission must examine other factors to ensure that it is not attributing injury from other sources to the subjectimports.” (emphasis in original)); Asociacion de Productores de Salmon y Trucha de Chile AG v. United States, 180F. Supp. 2d 1360, 1375 (Ct. Int’l Trade 2002) (“{t}he Commission is not required to isolate the effects of subjectimports from other factors contributing to injury” or make “bright-line distinctions” between the effects of subjectimports and other causes.); see also Softwood Lumber from Canada, Inv. Nos. 701-TA-414 and 731-TA-928(Remand), USITC Pub. 3658 at 100-01 (Dec. 2003) (Commission recognized that “{i}f an alleged other factor isfound not to have or threaten to have injurious effects to the domestic industry, i.e., it is not an ‘other causal factor,’then there is nothing to further examine regarding attribution to injury”), citing Gerald Metals, Inc. v. United States,132 F.3d 716, 722 (Fed. Cir. 1997) (the statute “does not suggest that an importer of LTFV goods can escapecountervailing duties by finding some tangential or minor cause unrelated to the LTFV goods that contributed to theharmful effects on domestic market prices.”). 103 S. Rep. 96-249 at 74-75; H.R. Rep. 96-317 at 47. 104 See Nippon Steel Corp., 345 F.3d at 1381 (“an affirmative material-injury determination under the statuterequires no more than a substantial-factor showing. That is, the ‘dumping’ need not be the sole or principal cause ofinjury.”). 105 Mittal Steel, 542 F.3d at 877-78; see also id. at 873 (“While the Commission may not enter an affirmativedetermination unless it finds that a domestic industry is materially injured ‘by reason of’ subject imports, theCommission is not required to follow a single methodology for making that determination ... . {and has} broaddiscretion with respect to its choice of methodology.”) citing United States Steel Group v. United States, 96 F.3d1352, 1362 (Fed. Cir. 1996) and S. Rep. 96-249 at 75. 106 Commissioner Pinkert does not join this paragraph or the following four paragraphs. He points out that theFederal Circuit, in Bratsk, 444 F.3d 1369, and Mittal, held that the Commission is required, in certain circumstanceswhen considering present material injury, to undertake a particular kind of analysis of nonsubject imports. Mittalexplains as follows:
What Bratsk held is that “where commodity products are at issue and fairly traded, price-competitive,nonsubject imports are in the market,” the Commission would not fulfill its obligation to consider animportant aspect of the problem if it failed to consider whether nonsubject or non-LTFV imports wouldhave replaced LTFV subject imports during the period of investigation without a continuing benefit to thedomestic industry. 444 F.3d at 1369. Under those circumstances, Bratsk requires the Commission toconsider whether replacement of the LTFV subject imports might have occurred during the period ofinvestigation, and it requires the Commission to provide an explanation of its conclusion with respect tothat factor.
542 F.3d at 878.
17

Federal Circuit has examined and affirmed various Commission methodologies and has disavowed “rigidadherence to a specific formula.”107
The Federal Circuit’s decisions in Gerald Metals, Bratsk, and Mittal Steel all involved caseswhere the relevant “other factor” was the presence in the market of significant volumes of price-competitive nonsubject imports. The Commission interpreted the Federal Circuit’s guidance in Bratsk asrequiring it to apply a particular additional methodology following its finding of material injury in casesinvolving commodity products and a significant market presence of price-competitive nonsubjectimports.108 The additional “replacement/benefit” test looked at whether nonsubject imports might havereplaced subject imports without any benefit to the U.S. industry. The Commission applied that specificadditional test in subsequent cases, including the Carbon and Certain Alloy Steel Wire Rod from Trinidadand Tobago determination that underlies the Mittal Steel litigation.
Mittal Steel clarifies that the Commission’s interpretation of Bratsk was too rigid and makes clearthat the Federal Circuit does not require the Commission to apply an additional test nor any one specificmethodology; instead, the court requires the Commission to have “evidence in the record ‘to show thatthe harm occurred ‘by reason of’ the LTFV imports,’” and requires that the Commission not attributeinjury from nonsubject imports or other factors to subject imports.109 Accordingly, we do not considerourselves required to apply the replacement/benefit test that was included in Commission opinionssubsequent to Bratsk.
The progression of Gerald Metals, Bratsk, and Mittal Steel clarifies that, in cases involvingcommodity products where price-competitive nonsubject imports are a significant factor in the U.S.market, the Court will require the Commission to give full consideration, with adequate explanation, tonon-attribution issues when it performs its causation analysis.110 111
The question of whether the material injury threshold for subject imports is satisfiednotwithstanding any injury from other factors is factual, subject to review under the substantial evidencestandard. Congress has delegated this factual finding to the Commission because of the agency’sinstitutional expertise in resolving injury issues.112
107 Nucor Corp. v. United States, 414 F.3d 1331, 1336, 1341 (Fed. Cir. 2005); see also Mittal Steel, 542 F.3d at879 (“Bratsk did not read into the antidumping statute a Procrustean formula for determining whether a domesticinjury was ‘by reason’ of subject imports.”). 108 Mittal Steel, 542 F.3d at 875-79. 109 Mittal Steel, 542 F.3d at 873 (quoting from Gerald Metals, 132 F.3d at 722), 875-79 & n.2 (recognizing theCommission’s alternative interpretation of Bratsk as a reminder to conduct a non-attribution analysis). 110 Commissioner Lane also refers to her dissenting views in Polyethylene Terephthalate Film, Sheet, and Stripfrom Brazil, China, Thailand, and the United Arab Emirates, Inv. Nos. 731-TA-1131-1134 (Final), USITC Pub.4040 (Oct. 2008), for further discussion of Mittal Steel. 111 To that end, after the Federal Circuit issued its decision in Bratsk, the Commission began to present publishedinformation or send out information requests in final phase investigations to producers in nonsubject countries thataccounted for substantial shares of U.S. imports of subject merchandise (if, in fact, there were large nonsubjectimport suppliers). In order to provide a more complete record for the Commission’s causation analysis, theserequests typically seek information on capacity, production, and shipments of the product under investigation in themajor source countries that export to the United States. The Commission plans to continue utilizing published orrequested information in final phase investigations in which there are substantial levels of nonsubject imports. 112 Mittal Steel, 542 F.3d at 873; Nippon Steel Corp., 458 F.3d at 1350, citing U.S. Steel Group, 96 F.3d at 1357;S. Rep. 96-249 at 75 (“The determination of the ITC with respect to causation is ... complex and difficult, and is amatter for the judgment of the ITC.”).
18
B. Conditions of Competition and the Business Cycle
The following conditions of competition inform our analysis of whether there is a reasonableindication of material injury by reason of subject imports.
1. Demand Conditions
SRC pipe and tube is principally used in plumbing, refrigeration, and air conditioning systems. Demand for SRC pipe and tube, therefore, is largly derived from residential construction, commercialconstruction, and the market for air conditioning and refrigeration units. The parties agree that demandfor SRC pipe and tube declined over the period examined owing to the recession, the reduction inresidential and commercial construction, and the credit crisis. They also note that demand declined withincreased substitution of plastic (known as PVC and PEX) and aluminium pipe and tube in the place ofSRC pipe and tube.113 Petitioners argue that substitution of plastic tube for copper tube in residentialplumbing increased through 2006, but leveled off thereafter.114
When measured by apparent domestic consumption, U.S. demand declined over the period ofinvestigation, as Petitioners and respondents agree, from 1.13 billion pounds in 2006 to 867.8 millionpounds in 2008, a 23.5 percent decline, and was 23.7 percent lower in interim 2009, at 370.2 millionpounds, than in interim 2008, at 485.4 million pounds.115
2. Supply Conditions
The domestic industry is the largest source of supply in the U.S. market. Domestic producers’market share was 77.0 percent in 2006, 76.0 percent in 2007, and 71.5 percent in 2008. The domesticindustry’s market share was 72.0 percent in interim 2009 compared with 71.8 percent in interim 2008.116 U.S. producers’ production capacity exceeds domestic demand.117 Twelve domestic producers accountedfor 95 percent of U.S. SRC pipe and tube production in 2008.118 The record indicates that some domesticproducers manufacture only plumbing tube, some manufacture only commercial tube, and somemanufacture both plumbing and commercial tube.119 Mueller, Cerro, and Kobe Wieland are the largestdomestic producers, accounting for, respectively, *** percent, *** percent, and *** percent of reporteddomestic production.120
113 Petitioners Postconference Brief at 23. 114 Petitioners Postconference Brief at 23, IUSA/Nacobre Postconference Brief at 12-19, Hailiang PostconferenceBrief at 7-12, Golden Dragon Postconference Brief at 9-18, Importer Respondents Postconference Brief at 4-13. Petitioners also explain that, in 2006, the air conditioning industry migrated to a higher Seasonal Energy EfficiencyRatio (“SEER”) standard, from SEER 10 to SEER 13, which increased demand for SRC pipe and tubes with higherthermal conductivity per pound; i.e., tubes with inner grooves and thinner walled smooth-bore tubes. Petitionersstate that this migration resulted in an increase in total feet of SRC pipe and tube sold, although they estimate thattotal pounds sold was probably unchanged because of decreases in the wall thicknesses of that pipe and tube. Petitioners Postconference Brief at 23. 115 CR/PR at Tables IV-8, C-1. 116 CR/PR at Tables IV-8, C-1. 117 CR/PR at III-2. Domestic producers’ capacity was 1.2 billion pounds in 2006, 1.2 billion pounds in 2007 and1.1 billion pounds in 2008 and 545.6 million pounds in interim 2008 and 526.9 million pounds in interim 2009. CR/PR at Table III-2. 118 CR/PR at Table III-1, id. at n.1 . 119 E.g., Petitioners Postconference Brief at 13, Mexican Respondents Postconference Brief at 5-7. 120 CR/PR at Table III-1.
19

The market share of subject imports increased from 15.1 percent in 2006 to 21.0 percent in 2008and was 21.8 percent in interim 2009 compared with 21.5 percent in interim 2008.121 The record indicatesthat the majority of subject imports from China are commercial tube and the majority of subject importsfrom Mexico are plumbing tube.122 *** and *** were the largest reporting U.S. importers of subject SRCpipe and tube, accounting for, respectively, *** percent and *** percent of reported subject imports.123
The market share of nonsubject imports was relatively constant over the period of investigation,at 7.9 percent in 2006, 7.4 percent in 2007, 7.4 percent in 2008, and 6.2 percent in interim 2009 comparedwith 6.7 percent in interim 2008.124
3. Interchangeability
There is a high degree of substitutability between the domestic like product and subject importswhen they are produced to the same specifications. As noted above, market participants perceivedomestic SRC pipe and tube and subject imports to be interchangeable. A majority of reporting domesticproducers and importers reported that the domestic product is always or frequently interchangeable withthe subject imports from each subject source and that the Chinese and Mexican SRC pipe and tube areinterchangeable with each other.125 We note, however, as discussed above, that the interchangeabilitybetween plumbing and commercial tube appears to be somewhat limited with respect to finished productcharacteristics, channels of distribution, and the manner in which they are priced. Regarding price, asexplained above, plumbing tube is sold at a discount off published price lists while commercial tube issold at the prevailing COMEX price of copper plus a fabrication charge.126
C. Volume of Subject Imports
Section 771(7)(C)(i) of the Act provides that the “Commission shall consider whether the volumeof imports of the merchandise, or any increase in that volume, either in absolute terms or relative toproduction or consumption in the United States, is significant.”127
Notwithstanding the decline in apparent U.S. consumption over the period of investigation,cumulated subject imports increased irregularly from 2006 to 2008. They decreased from 170.9 millionpounds in 2006 to 165.8 million pounds in 2007 before increasing to 182.5 million pounds in 2008, for a6.7 percent overall absolute increase from 2006 to 2008. The cumulated subject imports were 80.7million pounds in interim 2009, or 22.8 percent lower than in interim 2008, when they were 104.5 millionpounds.128 Subject imports as a share of domestic consumption increased from 15.1 percent in 2006 to16.6 percent in 2007 and 21.0 percent in 2008; they were 21.5 percent in interim 2008 and 21.8 percent ininterim 2009.129
121 CR/PR at Tables IV-5, C-1. 122 Petitioners Postconference Brief at 25-29, Hailiang Postconference Brief at 2-7; Mexican Respondent’sPostconference Brief at 38. 123 CR/PR at Table IV-1. ***. Id. 124 CR/PR at Tables IV-5, C-1. 125 CR/PR at Table II-2. 126 Mexican Respondents Postconference Brief at 7, Luvata Postconference Brief at 13-14. 127 19 U.S.C. § 1677(7)(C)(i). 128 CR/PR at Tables IV-2, C-1. 129 CR/PR at Table IV-8. The ratio of cumulated subject imports to U.S. production followed a similar trend,increasing from 19.3 percent in 2006 to 21.1 percent in 2007 and 28.3 percent in 2008, and it was 29.8 percent ininterim 2009 compared with 29.0 percent in interim 2008. CR/PR at Table IV-9.
20
For purposes of the preliminary phase of these investigations, we find that volume of subjectimports is significant, both in absolute terms and relative to consumption in the United States.
D. Price Effects of the Subject Imports
Section 771(C)(ii) of the Act provides that, in evaluating the price effects of subject imports, the Commission shall consider whether – (I) there has been significant price undersellingby the imported merchandise as compared with the price of domestic like products of theUnited States, and (II) the effect of imports of such merchandise otherwise depressesprices to a significant degree or prevents price increases, which otherwise would haveoccurred, to a significant degree.130
As addressed above, the record indicates that there is a high degree of substitutability betweensubject imports and the domestic like product when they are produced to the same specifications, and thatprice is an important consideration in SRC pipe and tube purchasing decisions.131
The Commission collected quarterly pricing data for four SRC pipe and tube products.132 Usablepricing data were provided by eight domestic producers, accounting for 9 percent of domestic producers’shipments during the period examined, and 19 importers, accounting for 82 percent of shipments ofsubject imports from China and 7 percent of shipments of subject imports from Mexico during the periodexamined.133 Subject imports undersold the domestic product in 56 of 80 comparisons, at marginsranging from 0.3 to 46.0 percent.134 Accordingly, we find that underselling was significant during theperiod examined.
Prices for both the domestically produced product and the subject imports fluctuated during theperiod examined. Weighted-average sales prices for U.S.-produced products 1, 2, and 4 declined by 1.8to 15.2 percent, while prices of product 3 increased by 13.9 percent. Weighted average sales prices ofproducts 1, 3, and 4 imported from China decreased by 0.8 to 44.7 percent and prices of product 2increased by 23.2 percent. Weighted average sales prices of products 1 and 2 imported from Mexicodecreased by 6.0 and 15.3 percent respectively and prices of product 3 and 4 increased by 10.5 and 15.1percent.135
We find some evidence that subject import competition suppressed domestic like product pricesduring the period examined. Although domestic producers were able to increase prices to some extent inthe 2006 to 2008 period, they were not able to increase them sufficiently to cover increased COGS, andthe COGS/sales ratio increased in this period.136 The domestic industry’s unit COGS increased by $0.60 from 2006 to 2008, while domestic producers’ unit net sales value increased by only $0.55 which wasinsufficient to offset the increase in COGS. Thus, the COGS to net sales ratio steadily increased from89.0 percent in 2006, to 90.7 percent in 2007, and 91.5 percent in 2008. Unit COGS was $2.50 in interim2009, 38.8 percent lower than in interim 2008, but net sales value was 53.1 percent lower in interim 2009
130 19 U.S.C. § 1677(7)(C)(ii). 131 CR/PR at Tables II-2, II-3. 132 CR at V-4. 133 CR at V-4. 134 CR at V-13. Subject imports from China undersold the domestic product in 25 of 41 comparisons, at marginsranging from 1.5 to 35.2 percent, and subject imports from Mexico undersold the domestic like product in 31 of 39comparisons, at margins ranging from 0.3 to 46.0 percent. Id. 135 CR at V-4. 136 CR/PR at Table VI-1, C-1.
21

than in interim 2008, which resulted in a continued deterioration of the COGS/sales ratio. The ratio was92.7 percent in interim 2008 and 93.2 percent in interim 2009.137
We note, moreover, the record indicates that the domestic industry lost sales and revenues tosubject imports. Twelve of 18 responding purchasers named in lost sales and lost revenue allegationsindicated that they had switched purchases of SRC pipe and tube from U.S. producers to suppliers of SRCpipe and tube from China and Mexico during the period of investigation. Five of those 12 purchasersindicated that the lower price of the subject imports was the reason for their shift. Of the sevenpurchasers that indicated that price was not the reason for the shift, three purchasers indicated thatdomestic producers were not able to supply enough product, one purchaser indicated that both availabilityand pricing were reasons for the switch, and one purchaser indicated that their “switch was caused by abetter incentive from our buying group.” Four of 12 responding purchasers named in lost sales and lostrevenue allegations indicated that U.S. producers reduced their prices of SRC pipe and tube in order tocompete with prices of SRC pipe and tube from China or Mexico since January 2006.138
As significant volumes of subject imports entered the U.S. market and consistently undersold thedomestic like product, the domestic industry experienced downward pricing pressure, evidenced by asteadily deteriorating COGS/sales ratio, and lost sales. We find that the significant volume of subjectimports during the period examined had significant adverse price effects on domestic producers’ prices.
E. Impact of the Subject Imports139
Section 771(7)(C)(iii) of the Act provides that the Commission, in examining the impact of thesubject imports on the domestic industry, “shall evaluate all relevant economic factors which have abearing on the state of the industry.”140 These factors include output, sales, inventories, capacityutilization, market share, employment, wages, productivity, profits, cash flow, return on investment,ability to raise capital, research and development, and factors affecting domestic prices. No single factoris dispositive and all relevant factors are considered “within the context of the business cycle andconditions of competition that are distinctive to the affected industry.”141
Based on the record of these preliminary phase investigations, we find that, according to mostmeasures, the domestic industry’s performance declined over the period examined as subject importvolume rose. Domestic industry production declined 27.2 percent between 2006 and 2008, from 884.9
137 CR/PR at Tables VI-1, C-1. Unit COGS was $3.31 in 2006, $3.69 in 2007, $3.91 in 2008, and $2.50 ininterim 2009 compared with $4.09 in interim 2008. Id. Unit net sales value was $3.72 in 2006, $4.07 in 2007, $4.27in 2008, and $4.41 in interim 2008 and $2.69 in interim 2009. CR/PR at Table C-1. The difference between unitCOGS in interim 2008 and interim 2009 was partly attributable to an increase in factory overhead as well as rawmaterial costs. CR/PR at Table VI-1. Raw material costs accounted for approximately 85 percent of the total cost ofgoods sold for U.S. producers during 2006 to 2008. Copper is the main raw material used to produce SRC pipe andtube. The COMEX price of copper has fluctuated since 2006 ranging from $1.39 per pound to $3.94 per pound. CRat V-1. 138 CR at V-14, V-18. 139 Commerce initiated antidumping duty investigations based on estimated dumping margins of 60.5 percent advalorem for SRC pipe and tube from China and dumping margins ranging from 76.5 to 85.7 ad valorem for SRCpipe and tube from Mexico. Seamless Refined Copper Pipe and Tube from the People’s Republic of China andMexico: Initiation of Antidumping Duty Investigation, 74 Fed. Reg. 55194, 55198 (Oct. 27, 2009). 140 19 U.S.C. § 1677(7)(C)(iii); see also SAA at 851 and 885 (“In material injury determinations, the Commissionconsiders, in addition to imports, other factors that may be contributing to overall injury. While these factors, insome cases, may account for the injury to the domestic industry, they also may demonstrate that an industry is facingdifficulties from a variety of sources and is vulnerable to dumped or subsidized imports.”) 141 19 U.S.C. § 1677(7)(C)(iii); see also SAA at 851, 885; Live Cattle from Canada and Mexico, Inv. Nos. 701-TA-386, 731-TA-812-813 (Prelim.), USITC Pub. 3155 at 25 n.148 (Feb. 1999).
22

million pounds in 2006 to 644.0 million pounds in 2008, and was 24.8 percent lower in interim 2009, at271.2 million pounds, than in interim 2008, at 360.5 million pounds.142 Domestic capacity decreased 10.6percent between 2006 and 2008, from 1.22 billion pounds to 1.09 billion pounds in 2008. Capacity was545.6 million pounds in interim 2008 and 526.9 million pounds in interim 2009.143 The domesticindustry’s rate of capacity utilization decreased from 72.5 percent in 2006 to 59.0 percent in 2008, adecline of 13.5 percentage points, and was 14.6 percentage points lower in interim 2009, at 51.5 percent,than in interim 2008, at 66.1 percent.144
The domestic industry’s net sales decreased from 902.1 million pounds in 2006 to 652.1 millionpounds in 2008, a decline of 27.7 percent, and were 23.0 percent lower in interim 2009, at 278.6 millionpounds, than in interim 2008, at 361.9 million pounds.145 The domestic industry’s U.S. shipments of SRCpipe and tube followed a similar trend, decreasing from 873.5 million pounds in 2006 to 620.9 millionpounds in 2008, a decrease of 28.9 percent, and were 23.5 percent lower in interim 2009, at 266.5 millionpounds, than in interim 2008, at 348.4 million pounds.146 The domestic industry’s share of apparent U.S.consumption decreased from 77.0 percent in 2006 to 71.5 percent in 2008, and was slightly higher ininterim 2009, at 72.0 percent, than in interim 2008, at 71.8 percent.147
Domestic industry employment declined 19.1 percent, from 3,913 workers in 2006 to 3,166workers in 2008. Employment was 16.8 percent lower in interim 2009, at 2,730 workers, than in interim2008, at 3,280 workers.148
Domestic producers’ net sales value declined from $3.35 billion in 2006 to $2.79 billion in 2008,a 16.9 percent decline. Net sales value was 53.1 percent lower in interim 2009, at $748.7 million, than ininterim 2008, at $1.60 billion.149 As previously discussed, as unit COGS increased from 2006 to 2008,average sales values increased less rapidly due to price competition by the subject imports. As a result,operating income exhibited a slow steady decline while the ratio of COGS to net sales rose. The domesticindustry’s operating income declined from $290.2 million, or 8.7 percent of sales, in 2006 to $171.4million, or 6.1 percent of sales, in 2008. The disparity between changes in unit COGS and average salesvalue continued in the interim period. Although unit COGS was $1.59 lower in interim 2009 than ininterim 2008, average sales value was $1.72 lower. The domestic industry’s operating
142 CR/PR at Tables III-2, C-1. 143 CR/PR at Tables III-2, C-1. We note that some domestic plants producing SRC pipe and tube closed duringthe period examined. ***. CR/PR at Table III-3. Luvata Grenda, ***, shut down its SRC pipe and tube operationsthat year. CR at III-4. National Copper closed its SRC pipe and tube plant in Dowagiac, Michigan, with a capacityof *** pounds, in November 2008. Id. (Linderme Tube Co. closed a plant in September 2008, but its assets andcustomers were acquired by S.T. Products). We intend in any final phase investigations to look further into anyplant closures during the period examined to determine the reason for those closures and to assure that we are notattributing to subject imports capacity reductions that are attributable to other causes. 144 CR/PR at Table III-2, C-1. 145 CR/PR at Tables VI-1, C-1. 146 CR/PR at Tables III-5, C-1. Producers’ inventories declined on an absolute basis, but rose on a relative basis,from 2006 to 2008. Inventories were lower on an absolute basis but higher on a relative basis in interim 2009 than ininterim 2008. CR/PR at Table III-6. 147 CR/PR at Tables IV-4-5, C-1. 148 CR/PR at Table III-8. Hours worked declined from 8.0 million in 2006 to 6.6 million in 2008, and were 3.5million in interim 2008 and 2.7 million in interim 2009. Id. Labor productivity in terms of pounds per hour declinedfrom 108.4 pounds in 2006 to 96.2 pounds in 2008, a decline of 11.3 percent. CR/PR at Tables III-8, C-1. Productivity was 3.4 percent lower in interim 2009, at 98.5 pounds, than in interim 2008, at 102.0 pounds. Id. 149 CR/PR at Tables VI-1, C-1.
23

income was lower in interim 2009, at $22.0 million, or 2.9 percent of sales, than in interim 2008, at $84.1million, or 5.3 percent of sales.150
The domestic industry’s capital expenditures increased from $30.7 million in 2006 to $***million in 2008, a level *** percent higher than that in 2006. Its capital expenditures, however, were ***percent lower in interim 2009, at $*** million, than in interim 2008, at $*** million.151 Its return oninvestment declined from 22.0 percent in 2006 to 17.3 percent in 2008.152
For purposes of these preliminary phase investigations, we find that there is a causal nexusbetween the subject imports and the deteriorating condition of the domestic industry. Subject importsincreased their market share in 2007 and 2008 at the expense of domestic producers. Subject importsundersold the domestic like product and contributed to the price suppression experienced by domesticproducers over the period examined. Thus, we conclude that, for purposes of the preliminary phase ofthese investigations, the subject imports have had a significant adverse impact on the domestic industry.
We have considered whether there are other factors that may have had an adverse impact on thedomestic industry during the period examined. We recognize that the significant decline in apparent U.S.consumption over the period examined may have had a role in the domestic industry’s deterioratingperformance during the period examined.153 In any final phase of these investigations, we intend toexplore further the role that any changes in demand played in the performance of the domestic industry inorder to ensure that we do not attribute to subject imports the effects of any adverse demand conditions.154
We have also concluded that nonsubject imports do not break the causal link between subjectimports and the material injury suffered by the domestic industry. Unlike the subject imports, nonsubjectimports maintained a fairly constant market share over the period examined, at 7.9 percent in 2006, 7.4percent in 2007, and 7.4 percent in 2008. The market share of nonsubject imports was 6.7 percent ininterim 2008 and 6.2 percent in interim 2009.155 Moreover, the limited information on the recordregarding prices for nonsubject imports indicate that nonsubject imports were priced higher than thedomestic like product in the majority of comparisons and therefore did not undersell the domestic likeproduct to the same extent as did subject imports, which undersold the domestic product in the majorityof comparisions.156 Thus, any material injury we have found from subject imports cannot be attributed tononsubject imports.
Consequently, we conclude for purposes of these preliminary phase investigations that there is acausal nexus between the subject imports and the adverse condition of the domestic industry, which
150 CR/PR at Tables VI-1, C-1. 151 CR/PR at Tables VI-4, C-1. Research and development expenses increased from $735,000 in 2006 to $2.1million in 2008, and were higher in interim 2009, at $1.1 million, than in interim 2008, at $924,000. CR/PR at TableVI-4. 152 CR/PR at Tables VI-5, C-1. 153 We note that, contrary to respondents’ claim, the volume of subject imports did not simply follow demandtrends. This is evidenced most notably by increased shipments of subject imports in 2007 and 2008 when apparentU.S. consumption declined and by the increase in subject imports’ market share at the expense of the domesticindustry. See CR/PR at Table C-1. 154 Commissioner Pinkert finds it unlikely that SRC pipe and tube is a commodity product for Bratsk purposes. He points out in this regard that there are significant limitations on the interchangeability of plumbing andcommercial subject product. On the other hand, he finds it likely that nonsubject imports were a significant factor inthe U.S. market during the period – they held a market share of 7.9 percent in 2006 (which declined to 6.2 percent ininterim 2009). Because, based on the preliminary phase record, he finds that one of the triggering factors underBratsk is unlikely to have been satisfied, he does not consider whether nonsubject imports would have replaced thesubject imports without benefit to the domestic industry had the subject imports exited the market during the period. 155 CR/PR at Table IV-2. 156 CR/PR at Appendix E.
24

demonstrates a reasonable indication that the domestic industry is materially injured by reason of thesubject imports.
CONCLUSION
For the foregoing reasons, and based on the record in the preliminary phase of theseinvestigations, we find that there is a reasonable indication that an industry in the United States ismaterially injured by reason of subject imports of SRC pipe and tube from China and Mexico that areallegedly sold in the United States at less than fair value.
25


SEPARATE VIEWS OF CHAIRMAN SHARA L. ARANOFF, VICE CHAIRMAN DANIEL R. PEARSON, AND
COMMISSIONER DEANNA TANNER OKUN
Based on the record in the preliminary phase of these investigations, we find a reasonableindication that an industry in the United States is threatened with material injury by reason of imports ofseamless refined copper (SRC) pipe and tube from China and Mexico that are allegedly sold in the UnitedStates at less than fair value.1
I. SUMMARY
There is a reasonable indication that the domestic SRC pipe and tube industry is threatened withmaterial injury by reason of subject imports. The volume of subject imports increased both absolutelyand relatively during a period of declining demand. Since 2006, subject imports have captured a growingshare of the U.S. market at prices that consistently undersold domestic prices. Subject imports are likelyto continue to increase substantially relative to domestic consumption and production.
Responding producers in China and Mexico have ample excess capacity and the Mexicanindustry is adding considerable capacity. These producers are export oriented and, as their home marketshipments have declined, they have become increasingly reliant on export markets. Given that price is animportant factor in purchasing decisions and that SRC pipe and tube from China and Mexico issubstitutable with the domestic product, it is likely that future purchases in this somewhat depressedmarket will be of subject copper pipe and tube. These factors indicate the likelihood of substantiallyincreased imports from China and Mexico unless orders are issued.
II. CUMULATION
For purposes of determining if a threat of material injury exists, cumulation is discretionary. Under section 771(7)(H) of the Tariff Act, the Commission may “to the extent practicable” cumulativelyassess the volume and price effects of subject imports from all countries as to which petitions were filedon the same day if the requirements for cumulation are satisfied.2 In addition to considering the fourcumulation factors described above, the Commission has considered other factors such as the similarity ofthe volume trends and pricing data of subject imports from countries under investigation.3
In reaching our decisions in the preliminary phase of these investigations, we adopt and concurwith the majority’s discussion of reasonable overlap of competition, although we will further investigatedifferences in product mix and distribution channels, and reconsider the weight of any such differences inany final phase of these investigations.
Respondents IUSA and Nacional Cobre argue that subject imports from Mexico must be assessedindependently of those from China in a threat analysis. They argue that a reasonable overlap ofcompetition is lacking because of product mix differences and also note differences in volume trends. The volume of subject imports from Mexico declined between 2006 and 2008, while the volume of
1 We join in and adopt as our own sections I.-VI.B. of the majority opinion. 2 19 U.S.C. § 1677(7)(H). 3 See Torrington Co. v. United States, 790 F.Supp. at 1172 (affirming Commission’s determination not tocumulate for purposes of threat analysis when pricing and volume trends among subject countries were not uniformand import penetration was extremely low for most of the subject countries); Metallverken Nederland B.V. v. UnitedStates, 728 F.Supp. 730, 741-42 (Ct. Int’l Trade 1989); Associacion Colombiana de Exportadores de Flores v.United States, 704 F.Supp. 1068, 1072 (Ct. Int’l Trade 1988).
27
imports from China rose. The disparities, respondents argue, are even more pronounced if market share isconsidered, as the market share of imports from Mexico remained stable over the POI while the marketshare of subject imports from China rose.4
Having found a reasonable overlap of competition, we consider other factors. The volume ofsubject imports from Mexico declined between 2006 and 2008, by 10.6 percent, while the volume ofsubject imports from China increased by 22.0 percent. In market share terms, subject imports fromMexico were not stable, as argued by respondents, but increased somewhat from 7.0 percent in 2006 to8.2 percent in 2008. Market share of subject imports from China also increased, though moresignificantly, from 8.0 percent in 2006 to 12.8 percent in 2008. Even though the total volume of subjectimports from Mexico declined between 2006 and 2008, the decline in volume was less significant thanthe overall decline in apparent U.S. consumption, and market share rose as a result. Availableinformation on the interim period suggests greater convergence in the response of subject imports. Thevolume of subject imports from Mexico in interim 2009 was 21.9 percent lower than the volume reportedin interim 2008. For subject imports from China, import volume for interim 2009 was 23.4 percent lowerthan the volume entering in interim 2008. 5
Turning to pricing data, we note that imports from Mexico undersold the domestic like productsomewhat more frequently than did subject imports from China. Subject imports from Mexico undersoldthe domestic like product in 31 of 39 quarterly comparisons, or 79.5 percent, while subject imports fromChina undersold in 27 of 41 instances, or 65.9 percent.6
The industry in Mexico is significantly smaller than the industry in China, but the industry inMexico is expected to undergo significant expansion in the very near future, while respondents in Chinareport that capacity will contract. Both industries rely on export markets to absorb a significant share ofshipments. The industry in Mexico is closely intertwined with both the U.S. industry and that in China. All of the reported capacity expansions will be undertaken by producers with related parties in the U.S.(Luvata, IUSA, Wolverine) or in China (Golden Dragon).7
Based on the record gathered in the preliminary phase of these investigations, we find sufficientevidence to justify considering the impact of subject imports cumulatively in our threat analysis. However, as with our finding that the record indicates a reasonable overlap of competition, we willinvestigate and reconsider these matters in any final phase.
III. REASONABLE INDICATION OF THREAT OF MATERIAL INJURY BY REASON OFSUBJECT IMPORTS
Section 771(7)(F) of the Tariff Act directs the Commission to determine whether the U.S.industry is threatened with material injury by reason of the subject imports by analyzing whether “furtherdumped or subsidized imports are imminent and whether material injury by reason of imports wouldoccur unless an order is issued or a suspension agreement is accepted.”8 The Commission may not make
4 IUSA postconference brief at 37-43. 5 CR/PR at Table C-2. 6 Price data tables V-1 to V-4 excluding domestic shipments for Wolverine provided by staff on November 12,2009. 7 Vice Chairman Pearson does not exclude Wolverine from the domestic industry. He has reached hisconclusions by relying on volume data as represented in Table C-1 of the staff report and pricing data as shown inTables V-1-V-5. CR/PR at Tables V-1-V-5 and C-1. Including Wolverine in the domestic industry does not affectsubject import market share or volume trends but somewhat affects the incidence of underselling. Trends and theirmagnitude are very similar regardless of whether Wolverine is included or excluded and Vice Chairman Pearsonjoins in the conclusions drawn here. 8 19 U.S.C. § 1677(7)(F)(ii).
28

such a determination “on the basis of mere conjecture or supposition,” and considers the threat factors “asa whole” in making its determination whether dumped or subsidized imports are imminent and whethermaterial injury by reason of subject imports would occur unless an order is issued.9 In making ourdetermination, we consider all statutory threat factors that are relevant to these investigations.10
A. Likely Volume of the Subject Imports
We consider the likely future volume of subject imports both in absolute terms and relative todomestic consumption and production. For the reasons stated below, we find that, although the absolutevolume of subject imports may not increase over current levels, subject imports are likely to continue toincrease substantially relative to domestic consumption and production.
Our analysis begins with the trends observed over the period of investigation. In absolute terms,the volume of subject imports increased from 170.930 million pounds in 2006 to 182.453 million poundsin 2008, an increase of 6.7 percent. In interim 2009, subject import volume was 80.728 million pounds,22.8 percent below interim 2008, when cumulated subject import volume was 104.549 million pounds.11
The increase in absolute import volume between 2006 and 2008 occurred at a time when apparentU.S. consumption was dropping significantly. As we have noted, demand for SRC is closely tied to newconstruction and to spending on the repair or replacement of plumbing, heating/ventilation/airconditioning or refrigeration equipment. The period of investigation was marked by significant
9 19 U.S.C. § 1677(7)(F)(ii). 10 These factors are as follows:
(I) if a countervailable subsidy is involved, such information as may be presented to it by the administeringauthority as to the nature of the subsidy (particularly as to whether the countervailable subsidy is a subsidydescribed in Article 3 or 6.1 of the Subsidies Agreement) and whether imports of the subject merchandiseare likely to increase,(II) any existing unused production capacity or imminent, substantial increase in production capacity in theexporting country indicating the likelihood of substantially increased imports of the subject merchandiseinto the United States, taking into account the availability of other export markets to absorb any additionalexports,(III) a significant rate of increase of the volume or market penetration of imports of the subject merchandiseindicating the likelihood of substantially increased imports,(IV) whether imports of the subject merchandise are entering at prices that are likely to have a significantdepressing or suppressing effect on domestic prices and are likely to increase demand for further imports,(V) inventories of the subject merchandise,(VI) the potential for product-shifting if production facilities in the foreign country, which can be used toproduce the subject merchandise, are currently being used to produce other products,
* * *(IX) any other demonstrable adverse trends that indicate the probability that there is likely to be materialinjury by reason of imports (or sale for importation) of the subject merchandise (whether or not it is actuallybeing imported at the time).
19 U.S.C. § 1677(7)(F)(i). To organize our analysis, we discuss the applicable statutory threat factors using thesame volume/price/impact framework that applies to our material injury analysis. Statutory threat factors (II), (III),(V), and (VI) are discussed in the analysis of subject import volume. Statutory threat factor (IV) is discussed in theprice effects analysis, and statutory threat factor (IX) is discussed in the impact analysis. Statutory threat factor(VII) is inapplicable, as no imports of agricultural products are involved in these investigations. No party has arguedthat the domestic industry is currently engaging or will imminently engage in any efforts to develop a derivative ormore advanced version of the domestic like product, which would implicate statutory threat factor (VIII). 11 CR/PR at Table C-2.
29

contractions in demand for new construction, and the ensuing general recession has further weakeneddemand for the product. Apparent U.S. consumption in 2008 was 23.5 percent below the 2006 level. Apparent U.S. consumption in the interim 2009 period was 370.226 million pounds, 23.7 percent lowerthan the interim 2008 level.12
The combination of rising absolute import volumes and declining total apparent U.S.consumption translated into market share gains for the cumulated subject imports. In 2006, subjectimports accounted for 15.1 percent of apparent U.S. consumption. By 2008, subject imports accountedfor 21.0 percent of apparent U.S. consumption.13 14
The increased volume of subject imports contributed to a sharp increase in inventories held byimporters. The volume of end-of-period inventories of subject imports rose from *** million pounds in2006, equivalent to *** percent of U.S. shipments of imports, to *** million pounds, or *** percent ofshipments. By the end of interim 2009, importer inventories of subject imports were *** million pounds,or *** percent of shipments. Inventories at the end of the POI were *** percent higher than at the end of2006, despite persistent and significant declines in apparent U.S. consumption.15 Furthermore, importersreport over *** of subject imports planned for delivery to the U.S. market after June 30, 2009.16
Respondents have argued that this increase in volume was not significant because the decline inshipments mirrored the decline in apparent U.S. consumption,17 because subject imports just replacednonsubject imports,18 and because subject imports supply different markets.19 The decline in subjectimports did not mirror the decline in overall demand for most of the period of investigation, as theabsolute volume of subject imports rose from 2006 to 2008 as apparent U.S. consumption declined bymore than 20 percent. The absolute decline in nonsubject import volume somewhat exceeded the increasein absolute subject import volume, but nonsubject imports’ market share was little changed over theperiod of investigation.20
Based on the preliminary record, and without purchaser questionnaire responses, it is difficult toevaluate respondents’ arguments regarding differences in product mix, channels of distribution, andquality. The record suggests that subject imports are concentrated in somewhat different portions of themarket.21 But the record also suggests that the domestic industry participates actively in both segments ofthe market, shipping significant volumes into all channels of distribution.22 Imports from China includesome plumbing products and imports from Mexico include commercial products.23 A production
12 CR/PR at Table C-2. 13 CR/PR at Table C-2. 14 Vice Chairman Pearson does not exclude Wolverine from the domestic industry. He has reached hisconclusions by relying on volume data as represented in Table C-1 of the staff report. CR/PR at Table C-1. Including Wolverine in the domestic industry increases the domestic industry’s market share but does not affect themarket share or volume of subject imports. With Wolverine included in the domestic industry, the domesticindustry’s share of apparent U.S. consumption declined from 77.0 percent in 2006 to 71.5 percent in 2008, as theshare of consumption held by subject imports rose from 15.1 percent to 21.0 percent. Id. Vice Chairman Pearsonotherwise joins in the conclusions drawn here. 15 CR/PR at Table VII-5. 16 CR at VII-11, PR at VII-7. 17 Dayco postconference brief at 15-18. 18 Dayco postconference brief at 18-19, Shanghai Hailiang postconference brief at 15-16. 19 Shanghai Hailiang postconference brief at 11-12. 20 CR/PR at Table C-2. 21 We note that the record indicates that one of the planned new mills in Mexico will produce commercial SRCpipe and tube, suggesting that product mix concentrations may be more similar in the imminent future. CR at VII-8,PR at VII-5. 22 CR/PR at Table II-1. 23 CR/PR at Table II-1.
30

line currently under construction in Mexico will increase the capacity for producing commercial products;the closure of another facility in Mexico is projected to increase production in the United States.24 Therecord also suggests that market participants find subject imports and the domestic like product to be goodsubstitutes. We intend to pursue all of these issues in any final phase of these investigations. However,the record in this preliminary phase suggests that the increased market presence of subject imports wassignificant.
In addition to examining the past trends, we have analyzed the likely future volume of subjectimports in the context of demand for SRC pipe and tube in the U.S. market in the imminent future. Asnoted, apparent U.S. consumption declined throughout the POI. The decline appeared to continue, andperhaps sharpen, in the latter part of the period. Nothing on the record indicates that demand will recoverin the imminent future, and the record also indicates that the SRC pipe and tube market, regardless ofdemand level, will continue to face pressure from increasingly attractive substitute products.
We have considered the likely volume of cumulated subject imports. The SRC pipe and tubeindustries in China and Mexico have a large combined capacity of over one billion pounds.25 Theindustry in Mexico is expanding, with new plants and additions to capacity at existing facilities. Two ofthese projects are being carried out by companies that currently produce SRC pipe and tube in China,Golden Dragon and Luvata Tube (Zhongshan) Ltd.26 Because of their relatively low rates of capacityutilization, subject producers have ample excess capacity.27 Producers in China and Mexico are highlyexport-oriented and, as their home market shipments have declined, their exports to the U.S. market havebecome an increasingly important segment of their shipments. In addition, responding producers’inventories are significant relative to total shipments to the United States.28
The Commission received questionnaire responses from 10 SRC pipe and tube producers inChina, estimated to account for virtually all exports to the United States in 2008 but only about 40 percentof the estimated 1.7 billion pounds of production.29 Responding producers increased capacity moderatelybetween 2006 and 2008 but report declining capacity for 2009 and 2010. Responding producers sawproduction decline over the POI, but capacity utilization declined even faster, falling from 78.0 percent in2006 to 66.9 percent in 2008 and was only 56.2 percent in interim 2009. Responding producers projectsignificant improvements in capacity utilization in 2009 and 2010, but the improvements will be achievedprimarily through reducing capacity.30
Respondents have argued that volume from China is unlikely to be significant in the imminentfuture because ***31 and that the industry in China is focused mainly on the domestic market.32 As wehave noted, the absolute volume of imports to the United States from China increased from 2006 to 2008,and market share rose or held steady throughout the period of investigation. The record indicates that,although the market for SRC pipe and tube in China might be growing, shipments by respondingproducers to the home market did not rise, either absolutely or relatively. Shipments to the Chinese homemarket by responding producers fell from 456.964 million pounds, or 61.1 percent of shipments, in
24 CR at VII-8, PR at VII-5. 25 CR/PR at Tables VII-1 and VII-3. 26 CR at VII-3-VII-4 and VII-8, PR at VII-2-3 and VII-5. 27 Responding producers in China and Mexico reported capacity utilization rates of 66.9 and *** percent in 2008and of 56.2 and *** percent, respectively, in the first half of 2006. CR/PR at Tables VII-1 and VII-3. 28 In 2008, cumulated end-of-period inventories were *** percent of reported exports to the United States. ByJanuary-June 2009, cumulated end-of-period inventories were *** percent of reported exports to the United States. CR/PR at Tables VII-1 and VII-3. 29 CR/PR at VII-3 and Table VII-1. 30 CR/PR at Table VII-1. 31 Golden Dragon postconference brief at 36-38. 32 Shanghai Hailiang postconference brief at 25-28.
31
2006, to 369.469 million, or 52.1 percent, in 2008. In interim 2009, shipments to the domestic marketwere just 45.4 percent of shipments. Exports, on the other hand, rose from 37.0 percent of shipments in2006 to 45.9 percent in 2008. Exports to all markets, including the U.S. market, accounted for 51.5percent of all Chinese shipments in interim 2009. As exports became more important to the Chineseproducers, the U.S. market became more important as well. Shipments to the U.S. market rose from 11.1percent of all shipments in 2006 to 15.3 percent in 2008; shipments to the U.S. market were 17.3 percentof all shipments in interim 2009. The record does not suggest that these persistent trends of increasedexport reliance by Chinese producers, in particular reliance on exports to the U.S. market, and declininghome-market shipments would change in the imminent future.
Responding Chinese producers report planned reductions in capacity.33 These reportedreductions are difficult to understand if the domestic market in China is as strong and growing as reportedby respondents. However, even with these reported reductions in capacity, the industry will haveupwards of 200 million pounds of unused capacity in the immediate future, and the increased reliance onexports suggest that a significant portion of any additional production would be directed to exportmarkets in general and to the U.S. market in particular.34
The Commission received questionnaire responses from four producers in Mexico, estimated toaccount for *** percent of exports to the U.S. market over the period of investigation. RespondingMexican producers reported a negligible increase in capacity between 2006 and 2008, but significantcapacity increases are planned for the imminent future. Production capacity in 2010 is forecast at ***, a*** percent increase over 2008 capacity. Production in 2010 is projected at ***, a significant increaseover 2008 and projected 2009 levels, but even this increase will leave significant unused capacity. Capacity utilization for 2010 is estimated at *** percent, down from *** percent in 2006 and *** percentin 2008. Based on these projections, the industry in Mexico will have *** of unused capacity in 2009 and*** of unused capacity in 2010.35
Capacity in Mexico is slated to increase significantly, but questionnaire data do not suggest theseincreases are being spurred by rising home market demand.36 Shipments to the Mexican home marketdeclined both absolutely and relatively between 2006 and 2008, falling from *** and *** percent ofshipments in 2006 to *** and *** percent in 2008. At the same time the importance of the export marketrose. Total exports were *** percent of shipments in 2006 and *** percent of shipments in 2008. TheU.S. market was easily the most important export market for Mexican producers, accounting for ***percent of all shipments and *** percent of all exports in 2006, rising to *** percent of all shipments and*** percent of all exports in 2008. The U.S. market remained the leading export market for MexicanSRC pipe and tube late in the POI, and respondents’ own projections forecast 2010 shipments to the U.S.market as exceeding shipment volume in any other year of the POI.37
Respondents have argued that subject imports from Mexico are not likely to be significant in theimminent future because import volume declined between 2006 and 2008; because IUSA’s productionhas been shifted to the U.S. market; and although three new mills are slated to open in 2010, none of thesenew mills will compete for “major” U.S. contracts. Luvata’s new mill is intended to replace its
33 We note that *** producers in China report capacity expansions for 2010. ***. CR at VII-5, PR at VII-3. 34 CR/PR at Table VII-1. 35 CR/PR at Table VII-3. 36 The industry in Mexico is dominated by producers related to producers in other major markets. GD Affiliatesis related to Golden Dragon, a producer in China; IUSA is related to Cambridge-Lee, a U.S. producer; and LuvataMonterrey is related to an SRC pipe and tube producer in China as well as a U.S. producer of non-subject weldedcopper pipe. 37 CR/PR at Table VII-3.
32

U.S. production of welded pipe and Golden Dragon’s new facility is intended to reduce the volume of itsexports from China to the U.S.38
Exports to the U.S. market declined between 2006 and 2008, but the decline in apparent U.S.consumption was steeper, and the share of the U.S. market held by subject imports from Mexico rose,rather than remaining stable, over the POI. Golden Dragon’s shifting of production to Mexico to replaceits China exports does not suggest that the volume of exports from Mexico would decline in the imminentfuture, just as Luvata’s shifting from U.S. non-subject production to Mexican production of subjectmaterial also does not suggest a decline in exports.
We will explore these issues, including the reported shift of IUSA production to a U.S. facility,the potential for exports shifting from China to Mexico, and the importance of any product mixdifferences, in any final phase of these investigations. Available record data, however suggest that theU.S. market is an extremely important market for producers in Mexico, that it will continue to be so, andthat producers in Mexico will have significant additional production capacity to fill in the near future.
For the foregoing reasons, we find, for purposes of the preliminary phase of these investigations,that the volume of cumulated subject imports is likely to be significant within the imminent future,particularly when considered relative to consumption and production in the United States.
B. Likely Price Effects of the Subject Imports
In assessing the likely price effects of subject imports, we consider pricing developments duringthe period examined and likely developments in the imminent future in light of key conditions ofcompetition in the U.S. market. The record indicates that there is at least a fair degree of substitutabilitybetween domestically produced SRC pipe and tube and subject imports. In particular, plumbing SRCpipe and tube is produced to industry-wide standards. A majority of both domestic producers andimporters reported the domestic like product as being always or frequently interchangeable with subjectimports from both China and Mexico, and a majority of responding domestic producers and importersalso reported subject imports from China and Mexico as being always or frequently interchangeable,despite alleged product mix differences.39
The Commission collected quarterly pricing data for four SRC pipe and tube products. Theseproducts covered a relatively modest share of the domestic like product and imports from Mexico but asubstantial majority of imports from China.40 Prices for all four products remained fairly stable or roseearlier in the POI, despite falling demand, but dropped off in 2008 and beyond. Prices for sales ofdomestically produced product 1 peaked in the third quarter of 2006, but were still close to that peak in2007 and 2008; in 2009, however, prices for the domestic like product had fallen below early 2006 levels. A similar pattern was seen in product 2 sales. Prices peaked in 2008 for products 3 and 4 but then fell offsharply.41
38 IUSA postconference brief at 3, 49-50. 39 CR/PR at Table II-2. 40 CR at V-4, PR at V-3 and price data tables V-1 to V-4 excluding domestic shipments for Wolverine providedby staff on November 12, 2009. 41 Price data tables V-1 to V-4 excluding domestic shipments for Wolverine provided by staff on November 12,2009.
33

Underselling by subject imports was consistent. Subject imports undersold the domestic likeproduct in 58 of 80 quarterly comparisons.42 43
The domestic industry provided lost sales allegations involving $155 million and 44 millionpounds, along with lost revenue allegations totaling $1 million and 17 million pounds of pipe.44 Purchaser responses to these allegations were mixed. At least ***. Purchasers were mixed in theirrecollection as to whether domestic producers lowered prices in response to import prices, as well asregarding complaints about domestic industry quality, availability, and product mix.45
We are mindful of product differences in the market, that the two types of SRC pipe and tube aresold to different customers under different pricing methods, and that raw material prices do not playprecisely the same role in these pricing schemes. We are also mindful that the SRC pipe and tube marketwill face pressure both from declining demand and increasingly competitive substitute products. Weintend to seek additional information on all these factors in any final phase of these investigations.
Nonetheless, based on the record as whole, we find that subject imports are entering at priceslikely to have significant adverse effects on U.S. prices and at prices likely to increase demand for subjectimports relative to domestic consumption and production. All respondents agree that SRC pipe and tubefrom all three sources are at least frequently interchangeable for each other. Underselling by subjectimports was common throughout the POI, and subject import volume increased both absolutely andrelatively during a period of declining demand. The domestic industry was relatively successful inmaintaining prices during the POI despite declining demand and high, volatile copper prices. It was onlylater in the period, as subject imports continued to gain market share in a declining market, that pricesbegan to weaken. Apparent U.S. consumption is likely to continue to decline, or at best to remain atcurrent depressed levels. With fewer sales available in the market in the imminent future, the significantvolume of subject imports at low prices is likely to place downward pressure on domestic prices. Accordingly, we find adverse price effects to be likely in the imminent future, given the likely significantvolume of subject imports.
C. Likely Impact of the Subject Imports
Apparent U.S. consumption of SRC pipe and tube declined throughout the period ofinvestigation. Apparent U.S. consumption was 1.000 billion pounds in 2007, down 11.8 percent from2006. In 2008, apparent consumption declined another 13.3 percent, to 867.776 million pounds. Thedeclines seen from 2006 to 2008 continued and apparently accelerated late in the POI. Apparent U.S.consumption in interim 2009 was 370.226 million pounds, compared to 485.415 million pounds ininterim 2008.46 Given that SRC pipe and tube demand is closely tied to construction and to repair orupgrading of existing structures, the weakness seen in the POI is not surprising. Nor is the market likelyto rebound in the imminent future.
42 Price data tables V-1 to V-4 excluding domestic shipments for Wolverine provided by staff on November 12,2009. 43 Vice Chairman Pearson does not exclude Wolverine from the domestic industry. He has reached hisconclusions by relying on pricing data as shown in Tables V-1-V-6. CR/PR at Tables V-1-V-6. IncludingWolverine in the domestic industry somewhat affects the incidence of underselling. Trends and their magnitude arevery similar regardless of whether Wolverine is included or excluded and Vice Chairman Pearson joins in theconclusions drawn here. 44 CR at V-14, PR at V-7. 45 CR at V-14-V-26 and Tables V-7 and V-8; PR at V-7-V-11 and Tables V-7 and V-8. 46 CR/PR at Table C-2.
34

Shipments of SRC pipe and tube by the domestic industry declined throughout the POI as well. Domestic shipments in 2007 were 641.821 million pounds, down 12.5 percent from 2006. Shipments in2008 were 567.414 million pounds, down 11.6 percent from the preceding year.47
In light of these persistent declines in domestic shipments, it is not surprising to see similardeclines in many of the industry’s indicators. Capacity was unchanged between 2006 and 2008. Production declined by 20.5 percent, and capacity utilization slipped from 72.9 percent in 2006 to 57.9percent in 2008. Inventories declined absolutely, but rose from 6.9 percent of shipments in 2006 to 7.9percent in 2008. The number of production workers declined by 12.9 percent between 2006 and 2008and the number of hours worked declined by 10.7 percent. Net sales value declined by 10.0 percentbetween 2006 and 2008, and operating income declined by 38.9 percent.48 Several production orproduction-related facilities closed, and two producers, National and Linderme, closed.49
The industry had to cope with rising costs as well. Between 2006 and 2008, the unit cost ofgoods sold increased by 18.2 percent.50 Cost increases were driven almost entirely by increases in thecost of copper. The COMEX price of copper rose from just over $2.00 in early 2006 to a peak of nearly$4.00 in 2008, and the industry’s per-unit raw material cost rose by *** percent between 2006 and 2008.51
A combination of declining demand and rising raw material costs would suggest poor financialperformance, but the SRC pipe and tube industry’s performance was relatively strong between 2006 and2008. Operating income as a percentage of sales was 9.9 percent in 2006, 7.9 in 2007, and 6.7 percent in2008. This represents a fairly steady erosion, but modest compared to the significant decline in apparentU.S. consumption or domestic shipments. The industry was also able to undertake significant capitalexpenditures. Indeed, capital expenditures in 2008 were 42.3 percent higher than in 2006.52 ***.53 Theindustry’s return on investment declined between 2006 and 2008 but remained high throughout.54 Takenas a whole, the industry’s financial performance during 2006-2008 suggests that it is reasonably well-positioned to absorb significant fluctuations in both demand and raw materials costs.55
However, the record also indicates that subject import volume continued to increase relative todeclining consumption and production throughout the period of investigation, and while the domesticindustry retained a majority of the market, it lost market share to subject imports after 2007. Prices forSRC pipe and tube weakened in the latter portion of the POI as subject imports increased both absolutelyand relatively. By the end of the POI, the domestic industry was still earning an operating profit, but itwas significantly lower than it had been as recently as 2008.56 The deterioration in the industry’sperformance late in the period of investigation suggests that the adverse effects of increases in subjectimport volume and adverse effects from import pricing had begun to affect the domestic industry.
47 CR/PR at Table C-2. 48 CR/PR at Table C-2. 49 CR at III-4 and Table III-3, PR at III-3 and Table III-3. 50 CR/PR at Table C-2. 51 CR/PR at V-1 and Table VI-1A. 52 CR/PR at Table C-2. 53 CR at VI-3, PR at VI-1. 54 Email from Elizabeth Haines, 11/20/2009. 55 Vice Chairman Pearson does not exclude Wolverine from the domestic industry. He has reached hisconclusions by relying on industry performance data as represented in Tables VI-1-VI-5 and C-1 of the staff report. CR/PR at Tables VI-1-VI-5 and C-1. Including Wolverine in the domestic industry shows the industry asexperiencing ***. Trends and their magnitude are very similar regardless of whether Wolverine is included orexcluded and Vice Chairman Pearson joins in the conclusions drawn here. 56 CR/PR at Table C-2.
35
Nothing in the record suggests that these conditions will improve in the imminent future. Asnoted above, producers in China and Mexico have significant unused capacity, declining shipments tohome markets, and increasing reliance on exports, particularly to the U.S. market. Capacity in Mexico isexpected to rise, and unused capacity in China is significant relative to the declining U.S. market. Subjectimports undersold the domestic like product throughout the period of investigation, and the record doesnot indicate changes in pricing or underselling in the imminent future.
We have considered whether there are other factors, including declining demand and nonsubjectimports, that will likely have an imminent impact on the domestic industry. As discussed above, therecord during the period of investigation suggests that the domestic industry has positioned itself toabsorb significant fluctuations in demand. In addition, nonsubject imports have held a relatively constantmarket share. In any final phase of these investigations, we intend to explore further the role thatnonsubject imports and any changes in demand play in the performance of the domestic industry in orderto ensure that we do not attribute to subject imports the effects of any other adverse factors.
Therefore, we conclude, for purposes of the preliminary phase of these investigations, that thereis a likely causal nexus between the subject imports and an imminent adverse impact on the domesticindustry, which demonstrates a reasonable indication that the domestic industry is threatened withmaterial injury by reason of subject imports.
CONCLUSION
For the reasons stated above, and based on the record in the preliminary phase of theseinvestigations, we find that there is a reasonable indication that the domestic industry producing SRC pipeand tube is threatened with material injury by reason of subject imports from China and Mexico that areallegedly sold in the United States at less than fair value.
36

PART I: INTRODUCTION
BACKGROUND
These investigations result from a petition filed on September 30, 2009, with the U.S. Departmentof Commerce (“Commerce”) and the U.S. International Trade Commission (“USITC” or “Commission”)by Cerro Flow Products, Inc. (“Cerro”) St. Louis, MO; Kobe Wieland Copper Products, LLC (“KobeWieland”), Pine Hall, NC; Mueller Copper Tube Products, Inc. and Mueller Copper Tube Company, Inc.(“Mueller”), Memphis, TN. The petition alleges that an industry in the United States is materially injuredand threatened with material injury by reason of less-than-fair-value (“LTFV”) imports of seamlessrefined copper pipe and tube (“SRC pipe and tube”)1 from China and Mexico. Information relating to thebackground of the investigations is provided below.2
Effective date Action
September 30, 2009 Petition filed with Commerce and the Commission; institution of Commissioninvestigations (74 FR 51318, October 6, 2009)
October 21, 2009 Commission’s conference1
October 27, 2009 Commerce’s notice of initiation of antidumping duty investigations (74 FR 55194)
November 13, 2009 Commission’s vote
November 16, 2009 Commission determinations transmitted to Commerce
November 23, 2009 Commission views transmitted to Commerce
1 A list of witnesses appearing at the conference is presented in app. B.
STATUTORY CRITERIA AND ORGANIZATION OF THE REPORT
Statutory Criteria
Section 771(7)(B) of the Tariff Act of 1930 (the “Act”) (19 U.S.C. § 1677(7)(B)) provides that in
making its determinations of injury to an industry in the United States, the Commission--
shall consider (I) the volume of imports of the subject merchandise, (II)the effect of imports of that merchandise on prices in the United Statesfor domestic like products, and (III) the impact of imports of suchmerchandise on domestic producers of domestic like products, but onlyin the context of production operations within the United States; and. . .may consider such other economic factors as are relevant to thedetermination regarding whether there is material injury by reason ofimports.
1 See the section entitled “The Subject Merchandise” in Part I of this report for a complete description of themerchandise subject to these investigations. 2 Federal Register notices cited in the tabulation are presented in appendix A.
I-1

Section 771(7)(C) of the Act (19 U.S.C. § 1677(7)(C)) further provides that--
In evaluating the volume of imports of merchandise, the Commissionshall consider whether the volume of imports of the merchandise, or anyincrease in that volume, either in absolute terms or relative to productionor consumption in the United States is significant.. . .In evaluating the effect of imports of such merchandise on prices, theCommission shall consider whether . . . (I) there has been significantprice underselling by the imported merchandise as compared with theprice of domestic like products of the United States, and (II) the effect ofimports of such merchandise otherwise depresses prices to a significantdegree or prevents price increases, which otherwise would haveoccurred, to a significant degree.. . .In examining the impact required to be considered under subparagraph(B)(i)(III), the Commission shall evaluate (within the context of thebusiness cycle and conditions of competition that are distinctive to theaffected industry) all relevant economic factors which have a bearing onthe state of the industry in the United States, including, but not limited to. . . (I) actual and potential declines in output, sales, market share, profits,productivity, return on investments, and utilization of capacity, (II)factors affecting domestic prices, (III) actual and potential negativeeffects on cash flow, inventories, employment, wages, growth, ability toraise capital, and investment, (IV) actual and potential negative effectson the existing development and production efforts of the domesticindustry, including efforts to develop a derivative or more advancedversion of the domestic like product, and (V) in {an antidumpinginvestigation}, the magnitude of the margin of dumping.
Organization of the Report
Part I of this report presents information on the subject merchandise, alleged dumping margins,and domestic like product. Part II of this report presents information on conditions of competition andother relevant economic factors. Part III presents information on the condition of the U.S. industry,including data on capacity, production, shipments, inventories, and employment. Part IV presents thevolume of imports of the subject merchandise. Part V presents the pricing of U.S.-produced andimported subject products. Part VI presents information on the financial experience of U.S. producers. Part VII presents the statutory requirements and information obtained for use in the Commission’sconsideration of the question of threat of material injury, as well as information regarding nonsubjectcountries.
U.S. MARKET SUMMARY
SRC pipe and tube generally involve fluids under pressure, either for conveyance or closed-loopthermal transfer applications. The leading U.S. producers of SRC pipe and tube are Mueller and Cerro,while leading producers of SRC pipe and tube outside the United States include Golden Dragon PreciseCopper Tube (“Golden Dragon”) and Shanghai Hailiang Copper (“Hailiang”) of China and IUSA and
I-2

Nacional de Cobre of Mexico. The leading U.S. importer of SRC pipe and tube from China is WolverineTube Inc. (“Wolverine”), while the leading importer of SRC pipe and tube from Mexico is Cambridge-Lee Industries (“Cambridge-Lee”). Leading importers of SRC pipe and tube from nonsubject countriesinclude CMC and Nordyne.
Apparent U.S. consumption of SRC pipe and tube totaled approximately 868 million pounds($3.6 billion) in 2008. Currently, 12 firms are known to produce SRC pipe and tube in the United States. U.S. producers’ U.S. shipments of SRC pipe and tube totaled 621 million pounds ($2.6 billion) in 2008,and accounted for 71.5 percent of apparent U.S. consumption by quantity and 72.5 percent by value. U.S. imports from subject sources totaled 182 million pounds ($728 million) in 2008 and accounted for21.0 percent of apparent U.S. consumption by quantity and 20.1 percent by value. U.S. imports fromnonsubject sources totaled 64 million pounds ($268 million) in 2008 and accounted for 7.4 percent ofapparent U.S. consumption by quantity and 7.4 percent by value.
SUMMARY DATA AND DATA SOURCES
A summary of data collected in the investigations is presented in appendix C, table C-1. Exceptas noted, U.S. industry data are based on questionnaire responses of 12 firms that accounted for 95percent of U.S. production of SRC pipe and tube during 2008. U.S. imports from China and Mexico arebased on official import statistics of Commerce. Data regarding the Chinese industry are based on tenforeign producer questionnaire responses, data regarding the Mexican industry are based on four foreignproducer questionnaire responses, while information with respect to other foreign industries is drawnfrom questionnaire responses and public sources.
PREVIOUS AND RELATED TITLE VII INVESTIGATIONS
SRC pipe and tube has not been the subject of any prior countervailing or antidumping dutyinvestigations in the United States.
NATURE AND EXTENT OF ALLEGED SALES AT LTFV
Alleged Sales at LTFV
On October 27, 2009, Commerce published a notice in the Federal Register of the initiation of itsantidumping duty investigations on SRC pipe and tube from China3 and Mexico.4 Commerce hasinitiated antidumping duty investigations based on estimated dumping margins of 60.5 percent for SRCpipe and tube from China and 76.5 percent to 85.7 percent for SRC pipe and tube from Mexico.
3 Seamless Refined Copper Pipe and Tube from the People’s Republic of China and Mexico: Initiation ofAntidumping Duty Investigations, 74 FR 55194, October 27, 2009. 4 Ibid.
I-3
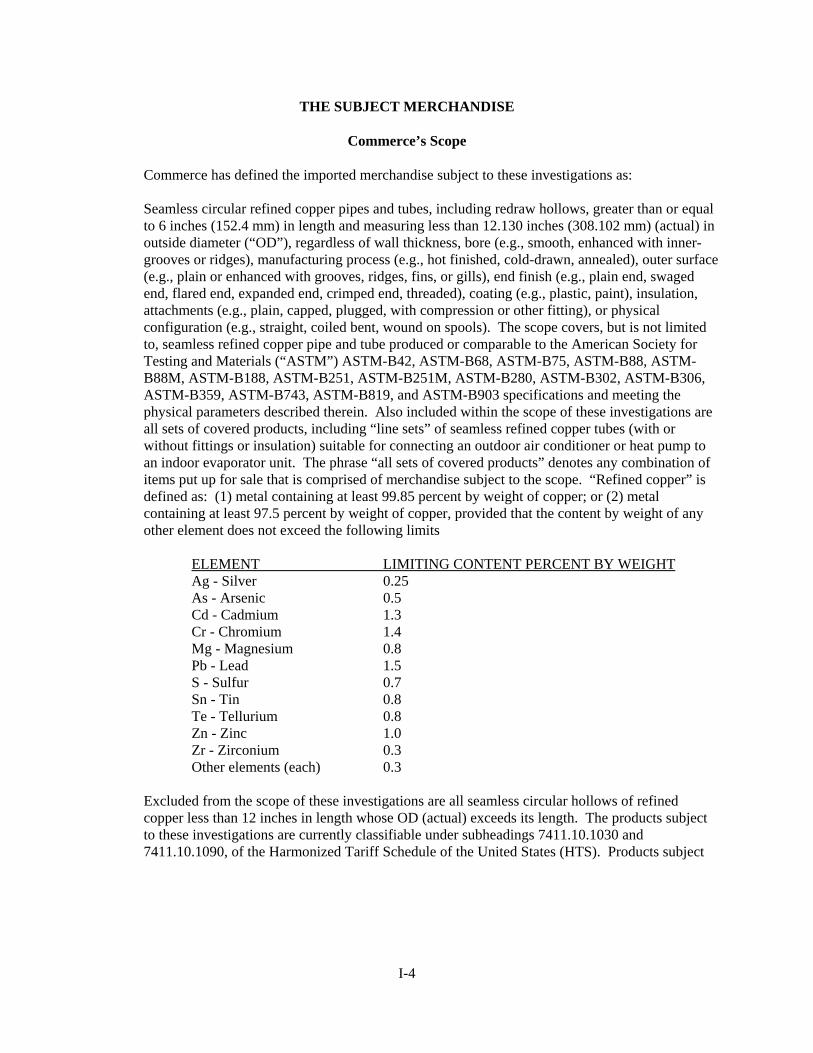
THE SUBJECT MERCHANDISE
Commerce’s Scope
Commerce has defined the imported merchandise subject to these investigations as:
Seamless circular refined copper pipes and tubes, including redraw hollows, greater than or equalto 6 inches (152.4 mm) in length and measuring less than 12.130 inches (308.102 mm) (actual) inoutside diameter (“OD”), regardless of wall thickness, bore (e.g., smooth, enhanced with inner-grooves or ridges), manufacturing process (e.g., hot finished, cold-drawn, annealed), outer surface(e.g., plain or enhanced with grooves, ridges, fins, or gills), end finish (e.g., plain end, swagedend, flared end, expanded end, crimped end, threaded), coating (e.g., plastic, paint), insulation,attachments (e.g., plain, capped, plugged, with compression or other fitting), or physicalconfiguration (e.g., straight, coiled bent, wound on spools). The scope covers, but is not limitedto, seamless refined copper pipe and tube produced or comparable to the American Society forTesting and Materials (“ASTM”) ASTM-B42, ASTM-B68, ASTM-B75, ASTM-B88, ASTM-B88M, ASTM-B188, ASTM-B251, ASTM-B251M, ASTM-B280, ASTM-B302, ASTM-B306,ASTM-B359, ASTM-B743, ASTM-B819, and ASTM-B903 specifications and meeting thephysical parameters described therein. Also included within the scope of these investigations areall sets of covered products, including “line sets” of seamless refined copper tubes (with orwithout fittings or insulation) suitable for connecting an outdoor air conditioner or heat pump toan indoor evaporator unit. The phrase “all sets of covered products” denotes any combination ofitems put up for sale that is comprised of merchandise subject to the scope. “Refined copper” isdefined as: (1) metal containing at least 99.85 percent by weight of copper; or (2) metalcontaining at least 97.5 percent by weight of copper, provided that the content by weight of anyother element does not exceed the following limits
ELEMENT LIMITING CONTENT PERCENT BY WEIGHTAg - Silver 0.25As - Arsenic 0.5Cd - Cadmium 1.3Cr - Chromium 1.4Mg - Magnesium 0.8Pb - Lead 1.5S - Sulfur 0.7Sn - Tin 0.8Te - Tellurium 0.8Zn - Zinc 1.0Zr - Zirconium 0.3Other elements (each) 0.3
Excluded from the scope of these investigations are all seamless circular hollows of refinedcopper less than 12 inches in length whose OD (actual) exceeds its length. The products subjectto these investigations are currently classifiable under subheadings 7411.10.1030 and7411.10.1090, of the Harmonized Tariff Schedule of the United States (HTS). Products subject
I-4

to these investigations may also enter under HTSUS subheadings 7407.10.1500, 7419.99.5050,8415.90.8065, and 8415.90.8085.5
Tariff Treatment
SRC pipe and tube is classifiable in the Harmonized Tariff Schedule of the United States(HTSUS) under statistical reporting numbers 7411.10.1030 and 7411.10.1090. SRC pipe and tube mayalso enter under HTS statistical reporting numbers 7407.10.1500 (refined copper hollow profiles),7419.99.5050 (which also contains various other products of refined copper and copper alloys),8415.90.8065 (which also contains parts other than SRC pipe and tube, for heat pumps), and8415.90.8085 (which also contains parts other than SRC pipe and tube, including those of other airconditioning machinery). Current tariff rates for SRC pipe and tube are presented in appendix D. Imports of SRC pipe and tube from countries that qualify for normal trade relations (including China)enter the United States at general duty rates of 1.5 percent under HTS subheading 7411.10.10, 3.0 percentunder HTS subheading 7407.10.15, or 1.4 percent under HTS subheading 8415.90.80; whereas suchimports under HTS subheading 7419.99.50 enter the United States free of duty. Imports of SRC pipe andtube from Mexico are eligible to enter the United States under these HTS subheadings at the “free”special-duty rate, as Mexico is a signatory of the North American Free Trade Agreement.
THE PRODUCT
Description and Applications
SRC pipe and tube are fabricated products6 of high-purity copper,7 distinguished by a circularcross section of varying nominal sizes (typically 0.04"–12")8 and wall thicknesses.9 The inner and outertubing surfaces are either smooth or enhanced (e.g., with grooves, ridges, fins, or grills).10 Dependingupon the requirements of industry standards or customers' specifications, additional characteristics caninclude: outer surface coatings (e.g., paint, plastics, other materials) for corrosion protection orinsulation; marking with paint or plastic color coding for product identification; cleaning, pressurizingwith nitrogen gas, and capping of each end to assure interior cleanliness; end finishes (e.g., plain, swaged,flared, expanded, crimped, or threaded); and attachments (e.g., plain, capped, or plugged).11 SRC pipeand tube is available in straight lengths, bent to shape, coiled without spools (“pancake coils”),
5 Seamless Refined Copper Pipe and Tube from the People’s Republic of China and Mexico: Initiation ofAntidumping Duty Investigations, 74 FR 55194, October 27, 2009. 6 SRC pipe and tube producers distinguish between “tubes” with smooth ends and joined together by soldering orbrazing, versus “pipes” that are threaded. Almost all products considered in these investigations are tubes ratherthan pipes. Conference transcript, p. 63 (Hansen). 7 “Refined copper” contains either (1) at least 99.85 percent by weight of copper or (2) at least 97.5 percent byweight of copper with the content of other elements not exceeding specific percentage weight limits listed in Note1(a) to Chapter 74 Copper and Related Articles, HTS (2009 Rev. 1), XV 74-1. Amendments to petition (October 13,2009), exhibit D. 8 Capillary tube is available with actual outside diameters (“ODs”) less than 0.04". The nominal size of 12" isequivalent to an OD of 12.130" (the upper with limit in the petition scope), or more specifically an actual OD of12.125" with a tolerance of ± 0.005". Counsel for petitioners, e-mail correspondence with Commission staff,November 3, 2009; and amendments to petition (October 16, 2009), exhibit 51. 9 Petition, p. 12. 10 Petition, p. 10. 11 Petition, pp. 10, and 12-13.
I-5

or coiled onto spools.12 “Line sets” consist of two different sizes of SRC pipe and tube, a smaller-diameter liquid line (commonly with end finishes) and a larger-diameter suction line (commonlyinsulated), usually to connect outdoor air conditioners and heat pumps with indoor evaporator units.13
End-use applications for SRC pipe and tube take advantage of copper’s strength, malleability andductility (i.e., readily bent or formed), thermal conductivity, resistance to corrosion and fouling, andchemical (e.g., lead-free) purity.14 SRC pipe and tube applications generally involve fluids underpressure, either for conveyance or closed-loop thermal transfer. Conveyance applications includeresidential, commercial, institutional, industrial, and municipal water systems, as well as distributionsystems for other liquids and gasses. Thermal transfer applications include residential, commercial,institutional, and industrial heating systems; commercial refrigeration systems (e.g., refrigerated displaycases for frozen food in grocery stores); and combined or split-unit air-conditioning systems.15
“Plumbing” (or “standard”) tubing is commonly produced to various standards of the AmericanSociety for Testing and Materials (“ASTM”). The ASTM designations specify the chemical composition,outside diameter, wall thickness, strength, hardness, cleanliness, roundness, marking, and otherrequirements for SRC pipe and tube, based on end-use applications.16
“Commercial” (or “industrial”) tubing is produced to either industry standard (e.g., ASTM)specifications or customer (including original equipment manufacturer (“OEM”)) nonstandardspecifications, including any surface enhancements (e.g., grooves, ridges, fins, or grills) designed toenhance thermal transfer capabilities. Common applications for commercial SRC pipe and tube includerefrigeration and heating units; split-system central, room and window, central, and vehicle airconditioners; and chillers and freezers.17
Applicable ASTM designations for SRC pipe and tube and specific end-use applications are listedin table I-1. Common pipe and tube designations, relevant ASTM standards, and end-use applications arepresented in table I-2.
12 Petition, pp. 10 and 12. 13 Petition, p. 10; and amendments to petition (October 13, 2009), p. 4. 14 Amendments to petition (October 13, 2009), p. 5. 15 Petition, p. 11. 16 Petition, pp. 11-12. 17 Petition, p. 12.
I-6
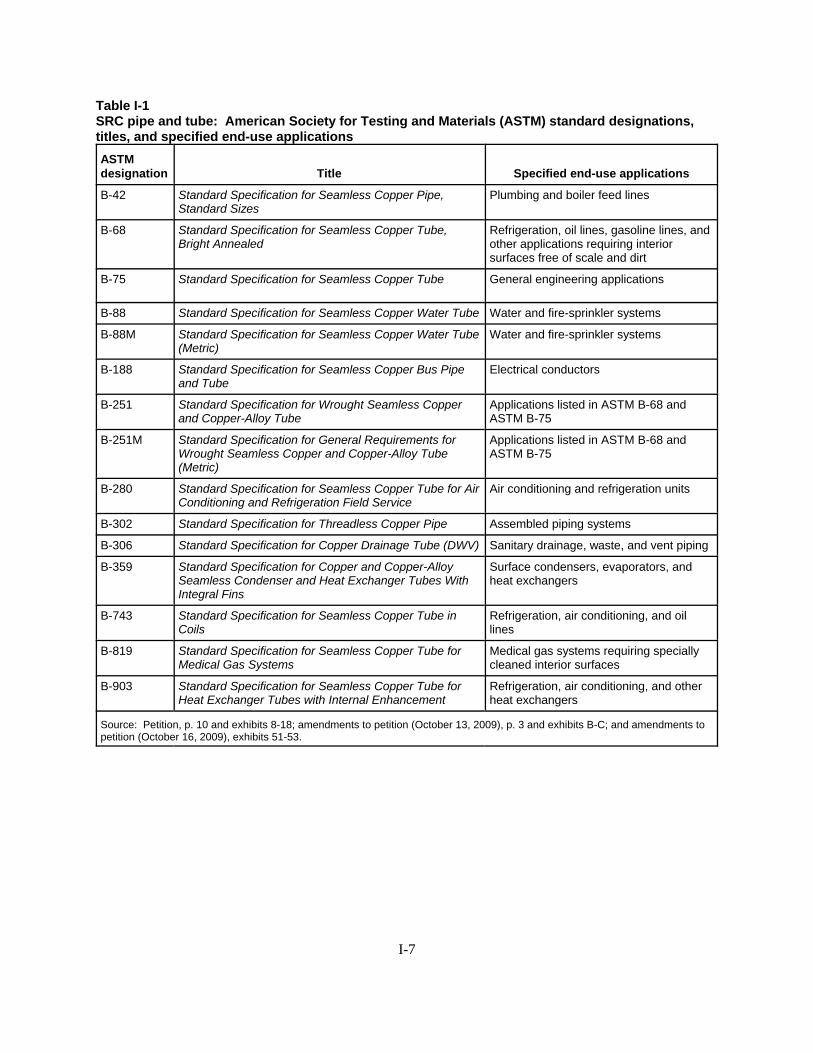
Table I-1SRC pipe and tube: American Society for Testing and Materials (ASTM) standard designations,titles, and specified end-use applications
ASTMdesignation Title Specified end-use applications
B-42 Standard Specification for Seamless Copper Pipe,Standard Sizes
Plumbing and boiler feed lines
B-68 Standard Specification for Seamless Copper Tube,Bright Annealed
Refrigeration, oil lines, gasoline lines, andother applications requiring interiorsurfaces free of scale and dirt
B-75 Standard Specification for Seamless Copper Tube General engineering applications
B-88 Standard Specification for Seamless Copper Water Tube Water and fire-sprinkler systems
B-88M Standard Specification for Seamless Copper Water Tube(Metric)
Water and fire-sprinkler systems
B-188 Standard Specification for Seamless Copper Bus Pipeand Tube
Electrical conductors
B-251 Standard Specification for Wrought Seamless Copperand Copper-Alloy Tube
Applications listed in ASTM B-68 andASTM B-75
B-251M Standard Specification for General Requirements forWrought Seamless Copper and Copper-Alloy Tube(Metric)
Applications listed in ASTM B-68 andASTM B-75
B-280 Standard Specification for Seamless Copper Tube for AirConditioning and Refrigeration Field Service
Air conditioning and refrigeration units
B-302 Standard Specification for Threadless Copper Pipe Assembled piping systems
B-306 Standard Specification for Copper Drainage Tube (DWV) Sanitary drainage, waste, and vent piping
B-359 Standard Specification for Copper and Copper-AlloySeamless Condenser and Heat Exchanger Tubes WithIntegral Fins
Surface condensers, evaporators, andheat exchangers
B-743 Standard Specification for Seamless Copper Tube inCoils
Refrigeration, air conditioning, and oillines
B-819 Standard Specification for Seamless Copper Tube forMedical Gas Systems
Medical gas systems requiring speciallycleaned interior surfaces
B-903 Standard Specification for Seamless Copper Tube forHeat Exchanger Tubes with Internal Enhancement
Refrigeration, air conditioning, and otherheat exchangers
Source: Petition, p. 10 and exhibits 8-18; amendments to petition (October 13, 2009), p. 3 and exhibits B-C; and amendments topetition (October 16, 2009), exhibits 51-53.
I-7
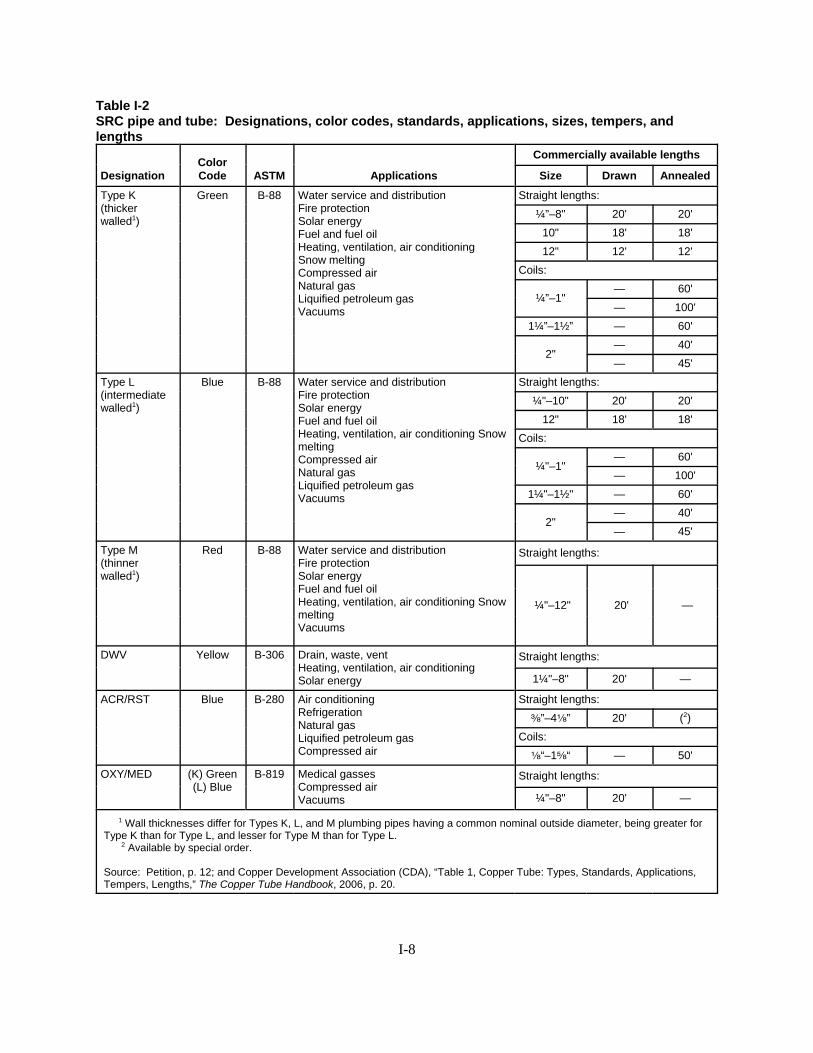
Table I-2SRC pipe and tube: Designations, color codes, standards, applications, sizes, tempers, andlengths
DesignationColorCode ASTM Applications
Commercially available lengths
Size Drawn Annealed
Type K(thickerwalled1)
Green B-88 Water service and distributionFire protectionSolar energyFuel and fuel oilHeating, ventilation, air conditioningSnow meltingCompressed airNatural gasLiquified petroleum gasVacuums
Straight lengths:
¼”–8" 20' 20'
10" 18' 18'
12" 12' 12'
Coils:
¼”–1"— 60'
— 100'
1¼”–1½” — 60'
2"— 40'
— 45'
Type L(intermediatewalled1)
Blue B-88 Water service and distributionFire protectionSolar energyFuel and fuel oilHeating, ventilation, air conditioning SnowmeltingCompressed airNatural gasLiquified petroleum gasVacuums
Straight lengths:
¼"–10" 20' 20'
12" 18' 18'
Coils:
¼"–1"— 60'
— 100'
1¼"–1½" — 60'
2"— 40'
— 45'
Type M(thinnerwalled1)
Red B-88 Water service and distributionFire protectionSolar energyFuel and fuel oilHeating, ventilation, air conditioning SnowmeltingVacuums
Straight lengths:
¼"–12" 20' —
DWV Yellow B-306 Drain, waste, ventHeating, ventilation, air conditioningSolar energy
Straight lengths:
1¼"–8" 20' —
ACR/RST Blue B-280 Air conditioningRefrigerationNatural gasLiquified petroleum gasCompressed air
Straight lengths:
d”–4c” 20' (2)
Coils:
c“–1e“ — 50'
OXY/MED (K) Green(L) Blue
B-819 Medical gassesCompressed airVacuums
Straight lengths:
¼"–8" 20' —
1 Wall thicknesses differ for Types K, L, and M plumbing pipes having a common nominal outside diameter, being greater forType K than for Type L, and lesser for Type M than for Type L. 2 Available by special order.
Source: Petition, p. 12; and Copper Development Association (CDA), “Table 1, Copper Tube: Types, Standards, Applications,Tempers, Lengths,” The Copper Tube Handbook, 2006, p. 20.
I-8

Manufacturing Processes18
Production steps for SRC pipe and tube can be segmented into three processing stages: (1)prefabricating, which includes melting, casting, and either extrusion or rolling of rough tubing; (2)intermediate fabrication, consisting of cold drawing of unfinished tubing; and (3) finishing of the SRCpipe and tube.19 The starting material is metallic copper in the form of refined cathodes (“primarycopper”), scrap (“secondary copper”), or ingots. The exact input mix depends on both the cost andavailability of the various forms of copper and on the technical capabilities of the melting furnace. Primary copper is purchased from copper producers that electrolytically refine blister copper fromsmelting furnaces into plate-shaped copper cathodes of at least 99.95 percent purity. Secondary copper isa mix of recycled (“old”) scrap bales consisting of copper wire and tubing recovered from demolished orrenovated structures and “home” or “runaround” (“new”) scrap returned from downstream productionsteps within the SRC pipe and tube mill. Brick-shaped copper ingots, cast from melted-down cathodesand scrap, are more commonly consumed by SRC pipe and tube mills with smaller-scale melting furnaceswith doors that cannot accommodate cathodes and baled scrap.
Prefabricating
The production process begins with melting and refining of copper in a furnace to produce moltencopper. A shaft furnace is adequate to melt high-purity cathodes, new scrap, and ingots into moltencopper that does not need further refining. Alternatively, inclusion of less-pure old scrap in the initialfurnace charge requires a reverberatory or other hearth-type furnace that allows for further refining of themolten copper. The copper charge is melted at temperatures between 2,300" to 2,400" F (above themelting point of copper at 1,981" F) and fire-refined by exposure to oxygen. Most impurities areconverted into oxides that are trapped in the surface slag, whereas less-readily oxidized impurities(especially tin and nickel) must be removed by reaction with a special slag compound. The moltencopper is stirred with greenwood poles (“poling”), which burn and vaporize to create a stirring action thatdrives the conversions to completion. The molten copper is sampled periodically to monitor the progressof refining. After the surface slag is skimmed off, the fire-refined melt exceeds 99.9 percent pure copper,similar to fire-refined primary copper smelted from ore. Phosphorous is added to deoxidize the moltencopper to produce “phosphorous-deoxidized, high residual phosphorus copper” (“DHP,” with standarddesignation UNS C12200).20
In the casting step, the molten copper is transferred from the melting/refining furnace to either aholding furnace or tundish (reservoir dam) that is heated to maintain the molten copper at constanttemperature for casting. The surface of the molten copper is protected from oxidation by a layer ofpulverized graphite. The SRC pipe and tube industry relies on three different technologies to cast moltencopper into unfabricated forms. “Continuous casting” and “semi-continuous casting” are both well-
18 This section is compiled from the petition, pp. 13-19; conference, petitioners’ exhibits 5-7; staff field trip notes,October 14, 2009; Rainer Hergemoeller, “Modern Production Methods for High Volume Copper TubeManufacturing,” TubeNet; and e-mail correspondence of Commission staff with counsel for petitioners, November 2and 3, 2009. 19 Conference, petitioners’ exhibits 5-7. 20 The Unified Numbering System (UNS) for Metals and Alloys is the standard designation and identificationsystem in North America. The “C” indicates “copper” and the following five digits identify the specific pure oralloyed copper. UNS C12200 is the standard designation for DHP that contains a minimum of 99.9 percent copper(including silver) and 0.015–0.040 phosphorous. Copper Development Association (CDA), “CDA UNS StandardDesignations for Wrought and Cast Copper and Copper Alloys: Introduction,” 2009.
I-9

established technologies for producing large-diameter solid “logs” or thick-walled hollow “tube rounds.” In the continuous casting process, molten metal flows into vertical graphite-lined cylindrical steel molds,that are water-cooled to quickly solidify the copper, which is gripped and withdrawn from the bottom asmore molten copper is poured into the tops of the molds. Some mills utilize casting molds fitted withwater-cooled central cores to produce tube rounds. A moving saw cuts the withdrawn log or tube roundinto billets, approximately two- to four-feet long, to fit the downstream extrusion or rolling equipment. Inthe semi-continuous casting process, a water-cooled floor of the mold cavity seals the vertical mold untilthe molten copper solidifies. More molten copper is poured into the top of the mold at the same rate asthe floor is lowered. When the log or tube round reaches the depth of the pit beneath the mold, the moldis (and central core are) raised to allow the log or tube round to be removed from the pit for sawing intoshorter billets.
A billet is preheated (to approximately 1,535" F) before being placed in an horizontal extrusionpress. The press includes a ram fitted with a dummy block (that is smaller in diameter than the billet),and a rod slightly smaller in diameter than that of the die opening, if the billet was either cast hollow oralready pierced (or alternatively a piercing mandrel, if the billet is still solid).21 The ram forces the heatedcopper over the rod (or mandrel) and through the die to form a long rough tube. The material (referred toas a “shell”) that accumulates over the dummy block is removed for remelting. The extruded rough tubeis carried along a run-out table to maintain its straightness until it is cool enough to be cleaned anddescaled. The ends are removed, and the length is subsequently coiled in preparation for drawing.
A more recent innovation is the “continuous horizontal cast and roll” (“cast and roll”) process22
that combines horizontal casting and milling, followed by planetary rolling,23 and is capable of producingrough tubing directly from molten copper.24 Molten copper flows into a graphite-lined mold fitted with agraphite-coated mandrel inside and emerges as a hollow shell. The hollow shell is cut by a saw into 30-to 60-feet long “shells.” The shell does not need to be reheated, but is fitted with a mandrel, before beingfed into a high-reduction rolling mill with a series of rolling heads to reduce both the outside diameter andwall thickness of the shell to the final dimensions.
Petitioners’ witnesses claim that there are no differences in the resulting product from either theextrusion or the cast and roll processes,25 although producing larger diameters still requires the extrusionmethod.26 27 By contrast, a domestic purchaser (through counsel) characterized foreign-origin cast-and-rolled inner groove SRC pipe and tube as “...produced directly from copper’s molten state, thereby
21 If the reheated billet is solid, it is pierced lengthwise with a mandrel (pointed rod) to form a hole through itscenter, that will eventually become the inner wall of the resulting tubing. Solid billets can be pierced either prior toor concurrent with extrusion. However, according to counsel for petitioners, billet piercing is no longer prevalentamong major global producers. Counsel for petitioners, e-mail correspondence with Commission staff, November 2,2009. 22 Page-Fura PC, on behalf of Johnson Controls, Inc., written submission to the Commission, October 26, 2009,p. 3. 23 Conference, petitioners’ exhibit 5. 24 Page-Fura PC, on behalf of Johnson Controls, Inc., written submission to the Commission, October 26, 2009,p. 3. 25 Conference transcript, p. 52 (Arndt, Hansen, and Sigloch). 26 Conference transcript, p. 52 (Sigloch). 27 Wolverine was the first U.S. producer to adopt the cast and roll technology, but its Roxboro, NC, mill wasclosed prior to the current period of investigation. Cerro established a cast and roll production line in its Cedar City,UT, mill, around 2002, which currently has a production capacity of *** pounds per annum. KobeWieland was themost recent to install cast and roll lines (commissioned after June 2009) in its Pine Hill, NC, mill. Counsel forpetitioners, e-mail correspondence with Commission staff, November 2, 2009.
I-10

resulting in a seamless product unlikely to fail in its chosen applications.”28 According to counsel for thispurchaser, this technology was first introduced in China, and cast-and-rolled SRC pipe and tubehistorically has been available from China and more recently from Mexico, but not from U.S. producers. The purchaser also reported being unable to obtain pricing and other information from a domesticproducer about its cast-and-rolled inner-groove SRC pipe and tube.29
Intermediate fabrication
The rough tube or shell resulting from the prefabrication stage is successively cold drawn througha series of steel dies to reduce diameter and wall thickness (by approximately 35 percent per draw) tofinal dimensions. Before the tube is drawn, a tapered plug mandrel is inserted into one end and that end iscrimped to fit through the die and is gripped by the jaws of the drawing machine. As the tube is drawn,the die and mandrel reduce the outer diameter and wall thickness, respectively. The mandrel also impartseither a smooth or enhanced (grooved) surface to the inside of the tube.30 After drawing, tubing to befinished as straight lengths is passed through a series of straightening rolls that bend the tubing less ateach successive roll station so that the tubing emerges straight and can be subsequently cut to length. Tubing to be finished as coils is passed through rolls that impart a bend of the coil radius as the tubingemerges from the coiler.
Finishing
Finishing steps depend on the specific type of SRC pipe and tube being produced: (1) Straight-length tubing may be either cut to final lengths or re-coiled (e.g., into pancake coils). (2) Likewise, coiledtubing may be either re-coiled (e.g., into pancake coils), level wound, or straightened and cut to finallength. (3) Tubing for thermal transfer applications is prepared by annealing (heat softening) beforebeing passed through a series of rollers and over a mandrel to impart enhancements (i.e., fins, ridges,grooves, gills, etc.) to the inner surface. Similar enhancements can also be imparted to the outer surfaceby additional operations. For some types of SRC pipe and tube, the ends also can be finished by swaging,flaring, expanding, crimping, or threading. The tubing is tested for conformity with industry standards orcustomer specifications prior to annealing, marking and color coding, and cleaning.
SRC pipe and tube is sold either as-drawn (“hard”) or annealed (“soft”) after cutting to length, re-coiling, . SRC pipe and tube (either in straight lengths or coils) to be annealed is passed through either acontinuous (long, heated box) furnace or an in-line induction (short, electric-powered) furnace, at 1,300o
F in a non-reactive gas atmosphere to prevent oxidation of the copper. Some mills utilize bell furnacesfor batch annealing in which coils are stacked beneath the bell and heated in a non-reactive atmosphere. Soft (annealed) SRC pipe and tube can be distinguished from hard (as-drawn) by the matte surface finishand lesser stiffness of annealed tubing. Otherwise, annealed and non-annealed SRC pipe and tube are ofthe same product quality and exhibit the same performance characteristics when in contact with fluids.
28 ***, purchases cast-and-rolled inner-groove SRC pipe and tube from ***. Specific product qualitycharacteristics reported by the purchaser were the tubing's even and compact structure, precise dimensions, fewresiduals present on inner surfaces, unique groove shape, increased inner surface area, and greater heat transfercapability. Page-Fura PC, on behalf of ***, written submission to the Commission, October 26, 2009, p. 2. 29 According to counsel for ***. Ibid., p. 3. 30 Inner and outer enhancements can be imparted to the tube during the finishing stage.
I-11

Tubing surfaces are cleaned to remove any remaining drawing lubricants or other debris, which isparticularly critical for SRC pipe and tube designed to carry medical gases and cooling refrigerants. Outer surfaces can be coated for corrosion protection or insulation, marked or color coded for productidentification, and attachments added to the ends, depending upon the requirements of industry standardsor customer specifications.
DOMESTIC LIKE PRODUCT ISSUES
No domestic like product issues have been raised in these investigations, although certain othertypes of metallic and nonmetallic tubing can substitute for SRC pipe and tube.31 Petitioners propose asingle domestic like product – all forms of SRC pipe and tube – coextensive with the scope.32 Accordingto petitioners, SRC pipe and tube producers consider all SRC pipe and tube as a continuum of products,but OEMs often require nonstandard specifications to meet their particular end-use applications.33 Respondents claim two distinctly different types of34 and market segments for35 SRC pipe and tube –plumbing versus industrial – but did not contest petitioners’ proposal for the preliminary phase of theseinvestigations.36
31 See the section entitled “Substitutability Issues” in Part II of this report. 32 Conference transcript, pp. 16 and 187-188 (Levy); and petitioners’ postconference brief, p. 9. 33 Amendments to petition (October 13, 2009), p. 5. 34 Respondents’ postconference brief (IUSA and Nacobre), pp. 5-7. 35 Conference transcript, p. 126 (O’Brien); and respondents’ postconference briefs, (Golden Dragon) pp. 5-8l; and(Hailian) pp. 3 and 8. 36 Conference transcript, p. 126 (O’Brien); and respondents’ postconference brief (IUSA and Nacobre), p. 7. Other respondents did not state their position regarding domestic like product issues in their postconference briefs.
I-12

1 Petitioners’ postconference brief, p. 20, Conference transcript, p. 25 (J. Hansen), p. 97 (Weil).
II-1
PART II: CONDITIONS OF COMPETITION IN THE U.S. MARKET
U.S. MARKET CHARACTERISTICS
All 11 responding U.S. producers and 12 of 34 responding importers reported selling SRC pipeand tube nationally. Twelve of the remaining responding importers reported selling to the southeast, 10reported selling to the southwest, nine reported selling to the Pacific coast, eight reported selling to thenortheast and/or Midwest, and three importers reported selling to the mountain region.
CHANNELS OF DISTRIBUTION
Plumbing tube is sold to wholesalers, retailers, and distributors who in turn sell it to different endusers while industrial tube is generally sold to OEMs such as Carrier, Trane, and York.1
A majority of U.S.-produced and Mexican imports of SRC pipe and tube are sold to distributorswhile a majority of imports from all sources except for Mexico are sold directly to end users. As shownin table II-1, in each full-year period, 59.9 to 62.7 percent of shipments of U.S.-produced SRC pipe andtube were to distributors, with the rest of the shipments to end users. The share of reported U.S.shipments of U.S. imports from Mexico made to end users decreased from *** percent in 2006 to *** in2008. The share of reported U.S. shipments of U.S. imports from China made to end users decreasedfrom 95.0 percent in 2006 to 88.1 percent in 2008, while the share of reported U.S. shipments of U.S.imports from countries other than China and Mexico made to end users decreased from 90.4 percent in2006 to 83.7 percent in 2008.
SUPPLY AND DEMAND CONSIDERATIONS
Supply
U.S. Supply
Based on available information, U.S. SRC pipe and tube producers have the ability to respond tochanges in demand with large changes in the quantity of shipments of U.S.-produced SRC pipe and tubeto the U.S. market. The main contributing factors to the high degree of responsiveness of supply are theavailability of unused capacity and the ability to produce alternate products; supply responsiveness isconstrained somewhat by a limited ability to ship to alternate markets and the somewhat limited ability touse inventories to increase shipments.
Industry capacity
U.S. producers’ capacity utilization decreased from 72.5 percent in 2006 to 59.0 percent in 2008.This level of capacity utilization indicates that U.S. producers have unused capacity with which theycould increase production of SRC pipe and tube in the event of a price change.
Alternative markets
Exports by the U.S. producers, as a share of total shipments, increased from 3.6 percent in 2006to 4.5 percent in 2008. These data indicate that U.S. producers have somewhat limited ability to divertshipments to or from alternative markets in response to changes in the price of SRC pipe and tube.

II-2
Table II-1SRC pipe and tube: U.S. producers’ and importers’ U.S. shipments of SRC pipe and tube, bysources and channels of distribution, 2006-08, and January-June 2009
Item
Period
2006 2007 2008Jan.-June
2009
Share of reported shipments (percent)
Domestic producers’ U.S. shipments of SRC pipe and tube to:
Distributors 62.7 61.8 59.9 63.9
End users 37.3 38.2 40.1 36.1
U.S. importers’ U.S. shipments of SRC pipe and tube from China:
Distributors 8.2 7.1 11.9 14.1
End users 91.8 92.9 88.1 85.9
U.S. importers’ U.S. shipments of SRC pipe and tube from Mexico:
Distributors *** *** *** ***
End users *** *** *** ***
U.S. importers’ U.S. shipments of SRC pipe and tube from all other countries to:
Distributors 9.6 13.3 16.3 38.4
End users 90.4 86.7 83.7 61.6
Note.–Data for domestic producers include only U.S. commercial shipments.
Source: Compiled from data submitted in response to Commission questionnaires.
Inventory levels
The ratio of end-of-period inventories to total shipments for the U.S. producers increased from6.1 percent in 2006 to 7.4 percent in 2008. These data indicate that U.S. producers are somewhat limitedin their ability to use inventories as a means of increasing shipments of SRC pipe and tube to the U.S.market.
Production alternatives
Five of twelve responding U.S. producers indicated that they produce products other than SRCpipe and tube on the equipment and machinery that is used to produce SRC pipe and tube. Producersindicated that they can produce products such as ***.
Supply constraints
Three of 11 responding U.S. producers indicated that they had refused, declined, or been unableto supply SRC pipe and tube since January 2006. *** indicated that in the spring of 2006 and spring of2008 it had declined new customers because of unusual demand as a result of the spike in commodity

2 Nine Chinese producers responded to the foreign producers’ questionnaire. Their exports to the United Statesrepresented 98 percent of total reported U.S. imports from China.
II-3
prices. *** indicated that it had declined opportunities due to capacity restraints brought about by ***.*** indicated that in January 2006, there was a change in HVAC standards designed to improve energyefficiency that caused a short-term spike in demand for products meeting these specifications, whichcaused extended delivery times in the industry. It also indicated that during periods of high seasonaldemand, delivery times may be extended.
Subject Imports from China
Based on available information, Chinese producers have the ability to respond to changes indemand with large changes in the quantity of shipments of SRC pipe and tube to the U.S. market.2 Themain contributing factors to the high degree of responsiveness of supply are the availability of unusedcapacity, the existence of alternate markets, and some ability to produce alternate products; supplyresponsiveness is constrained by the somewhat limited ability to use inventories.
Industry capacity
Chinese producers’ capacity utilization decreased from 78.0 percent in 2006 to 66.9 percent in2008. This level of capacity utilization indicates that Chinese producers have unused capacity with whichthey could increase production of SRC pipe and tube in the event of a price change.
Alternative markets
Shipments of SRC pipe and tube from China to markets other than the United States (both exportsto alternative markets and shipments to the home market) decreased from approximately 88.9 percent oftotal shipments in 2006 to 84.7 percent in 2008. Thus, available data indicate that subject producers inChina have the ability to divert shipments to or from their home market and alternative markets inresponse to changes in the price of SRC pipe and tube.
Inventory levels
The ratio of end-of-period inventories to total shipments for the Chinese producers decreasedfrom 7.1 percent in 2006 to 2.9 percent in 2008. These data indicate that Chinese producers have asomewhat limited ability to use inventories as a means of increasing shipments of SRC pipe and tube tothe U.S. market.
Production alternatives
Two of nine responding Chinese producers indicated that they produce products other than SRCpipe and tube on the equipment and machinery that is used to produce SRC pipe and tube. ***. ***.
Supply constraints
Importer *** indicated that it has refused, declined, or been unable to supply SRC pipe and tubebecause it can not compete with pricing by domestic mills.

3 Four Mexican producers responded to the foreign producers’ questionnaire. Their exports to the United Statesrepresented *** percent of total reported U.S. imports from Mexico.
II-4
Subject Imports from Mexico
Based on available information, Mexican producers have the ability to respond to changes indemand with large changes in the quantity of shipments of SRC pipe and tube to the U.S. market.3 Themain contributing factors to the high degree of responsiveness of supply are the availability of unusedcapacity, the existence of alternate markets, and some ability to produce alternate products; supplyresponsiveness is constrained by the somewhat limited ability to use inventories.
Industry capacity
Mexican producers’ capacity utilization decreased from *** percent in 2006 to *** percent in2008. This level of capacity utilization indicates that Mexican producers have unused capacity withwhich it could increase production of SRC pipe and tube in the event of a price change.
Alternative markets
Shipments of SRC pipe and tube from Mexico to markets other than the United States (bothexports to alternative markets and shipments to the home market) decreased from approximately ***percent of total shipments in 2006 to *** percent in 2008. Thus, available data indicate that Mexicanproducers have the ability to divert shipments to or from its home market and alternative markets inresponse to changes in the price of SRC pipe and tube.
Inventory levels
The ratio of end-of-period inventories to total shipments for Mexican producers decreased from*** percent in 2006 to *** percent in 2008. These data indicate that Mexican producers have a limitedability to use inventories as a means of increasing shipments of SRC pipe and tube to the U.S. market.
Production alternatives
One of four Mexican producers indicated that they produce products other than SRC pipe andtube on the equipment and machinery that is used to produce SRC pipe and tube. ***.
Supply constraints
Importer *** indicated that it has refused, declined, or been unable to supply SRC pipe and tubebecause it can not compete with pricing by domestic mills. Importer *** indicated that it refused manyorders due to its inability to compete with pricing by U.S. producers and due to a lack of supply availablein their Mexican inventories.
Demand
Based on available information, it is likely that any change in the price level of SRC pipe andtube will result in a moderate change in the quantity of SRC pipe and tube demanded. The maincontributing factors are substitute products and the small cost share of SRC pipe and tube in its end-useproducts.

4 Petition, p. 11. 5 Ibid. 6 Petition, pp. 11-12. 7 Petition, p. 38. PEX is a cross-linked polyethylene tubing that is sold in straight lengths or coils. Conferencetranscript, p. 141 (M. Hansen). 8 Conference transcript, pp. 52-53 (J. Hansen). 9 Conference transcript, pp. 53-54 (Sigloch). 10 Conference transcript, pp. 146-147 (Kerins). 11 Conference transcript, p. 147 (M. Hansen). 12 Conference transcript, pp. 147-149 (Weil). 13 Respondent Hailiang’s postconference brief, p. 8.
II-5
Demand Characteristics
As described in more detail in Part I, SRC pipe and tube is generally used for fluids underpressure, either for conveyance or in a closed loop for thermal transfer.4 Conveyance applications includewater applications, as well as distribution systems for other liquids and gases while thermal transferapplications include heating systems, commercial refrigeration systems (such as grocery store refrigeratedcases), and combined or split-unit air conditioning systems of all sizes.5
SRC pipe and tube is typically sold either as plumbing tube or commercial tube. “Plumbingtube” is typically manufactured according to ASTM standards with specifications for chemistry, outsidediameter, wall thickness, strength, hardness, cleanliness, and roundness. Applications include domesticwater service and distribution; fire protection; solar; fuel/fuel oil; HVAC; snow melting; compressed air;natural gas; liquified petroleum gas; and vacuum. “Commercial tube” may be similarly produced toindustry standard specifications or may be produced to OEM specifications, including tubes with grooves,ridges, fins, or gills designed to enhance the efficiency of thermal transfer. Common applications forcommercial tube include refrigeration units (mobile refrigeration), heating units, split-system central airconditioners, room and window air conditioners, central air conditioners, vehicle air conditioners, chillers,and freezers.6
U.S. demand for SRC pipe and tube depends on demand for construction, air conditioning andrefrigeration, and industrial manufacturing and the price of substitute goods such as PEX tubing.7 U.S.producer Mueller indicates that new home construction plays an important role in demand for bothplumbing and commercial SRC pipe and tube and that much of the demand for plumbing tube is derivedfrom nonresidential construction rather than residential construction.8 KobeWeiland also notes that thewarmer the weather is early in the year, the better the air conditioning season will be; thus increasingdemand in the replacement market, which they estimate makes up about 35 to 65 percent of the market.9 U.S. producer and importer Cambridge-Lee indicated that it is difficult to estimate demand for SRC pipeand tube from housing starts because of the substitution of plastic in the residential construction, butnonresidential construction is a more reliable indicator of changes in demand because SRC pipe and tubeis typically used.10 Importer JMF indicated that the relatively cool summers over the last two or threeyears has decreased demand for SRC pipe and tube.11 Importer Golden Dragon estimated thatreplacement units make up 60 to 70 percent of the market for air conditioning units, which use SRC pipeand tube and no plastic tubing.12
Respondent Hailiang indicated that demand for both the plumbing and commercial pipe segmentsrely on commercial and residential construction.13 Respondents Dayco, Homewerks, JMF, and Marubeniindicated that the retail segments of the plumbing market have been impacted by the recession less than

14 Respondents Dayco, Homewerks, JMF, and Marubeni’s postconference brief, p. 5. 15 Ibid, p. 6. 16 Conference transcript, pp. 54-55 (M. Hansen).
II-6
the wholesale segment because many homeowners chose to remodel instead of purchasing new homes.14 They also stated that sales of SRC pipe and tube for HVAC in the industrial market for nonresidentialbuildings has fared better than sales of copper tubing for HVAC for residential buildings.15
The real value of total construction decreased by 26 percent between January 2006 andSeptember 2009 (see figure II-1). The real value of residential construction decreased by 63 percentbetween January 2006 and August 2009 while the real value of nonresidential construction increased by22 percent between January 2006 and August 2009. Also, seasonally adjusted housing starts decreasedby 74 percent between January 2006 and September 2009.
All 11 responding U.S. producers and 23 of 30 responding importers indicated that demand forSRC pipe and tube in the United States has decreased since 2006. Six importers indicated that demandhad fluctuated and the remaining responding importer indicated that demand had not changed during thatperiod.
Three of five responding producers and four of 12 responding importers indicated that demandfor SRC pipe and tube decreased outside the U.S. since 2006. Two importers reported the demandoutside the U.S. increased and two importers reported that demand increased for commercial tube, butdecreased for plumbing tube. One producer and two importers indicated that demand outside of theUnited States fluctuated and the remaining one producer and two importers indicated that there was nochange in demand. Several responding firms attributed decreases in demand to the global economicdownturn and several firms attributed increases in demand to increased demand in China and developingcountries. Importer *** indicated that the primary market for copper plumbing tube outside the U.S. isEurope, where the market has exhibited increased use of PVC tube and a decline in construction and thatthe primary market for commercial tube outside the U.S. is China and other developing nations.
Business Cycles
Nine of 11 responding producers and 18 of 29 responding importers indicated that the SRC pipeand tube market is subject to distinctive business cycles or conditions of competition. Several producersand importers indicated that the SRC pipe and tube market is subject to both seasonal and business cyclesand that the business cycle is influenced by the construction market. Importer *** indicated thatconstruction tends to taper off in fall and pick back up in spring, with the summer being the busiest time.U.S. producer Muller indicated that residential construction typically peaks in the spring and earlysummer months, and, to a lesser extent, so does commercial construction because of the winter weatherdiscourages construction starts in the northern tier of states.16
Seven of nine responding producers and 15 of 16 responding importers indicated that thesedistinctive business cycles or conditions of competition for SRC pipe and tube have changed sinceJanuary 2006. Importers *** indicated that the increase in government energy efficiency standardsincreased demand above the typical business cycle in 2006 and 2007 and altered the anticipatedseasonality.

17 Platt's Metal Week and USGS. 18 Conference transcript, pp. 97-98 (Weil). 19 Conference transcript, p. 99 (Weil). 20 Conference transcript, pp. 99-100 (Weil).
II-7
Figure II-1Construction spending and housing starts: Total, residential, and nonresidential constructionspending in the United States, seasonally adjusted annual rate, deflated by the producer priceindex and seasonally adjusted housing starts monthly, January 2006-September 2009
Note: Expenditures on private residential improvements to rental, vacant, and seasonal properties are not included in theconstruction spending data. Expenditures are deflated by the producer price index for intermediate goods (seasonally adjusted).
Source: U.S. Census Bureau, Manufacturing, Mining and Construction Statistics, Construction Spending. http://www.census.gov/const/www/c30index.html#. and Bureau of Labor Statistics (retrieved November 9, 2009).
Substitute Products
Both petitioners and respondents indicate that demand for SRC pipe and tube has decreasedbecause of substitution of other types of tubing. Generally this has been attributed to the increase in theprice of copper relative to other materials such as plastic and aluminum. The COMEX price of copperfluctuated since 2006, increasing by 80 percent between January 2006 and April 2008.17
Importer Golden Dragon believes that the main reason that substitutes for tube have developed isthat the price of copper has increased dramatically in recent years.18 It indicated that although the switchto aluminum requires certain tradeoffs for air conditioning manufacturers, such as heat transfer efficiency,OEMs have been willing to substitute aluminum tubing given the high price of copper.19 It also noted thatplastic tube has been used in indoor plumbing applications because there is no concern of heat transfercomplications and because PEX tube installation is less expensive since it does not require the sametechnical skill as copper tube installation.20 Purchaser Johnson Controls indicated that, given the
21 Johnson Controls, written submission to the Commission, October 26, 2009 , p. 5. 22 Petitioners’ postconference brief, exhibit 14, response to question 9. 23 Respondents Dayco, Homewerks, JMF, and Marubeni’s postconference brief, p. 5. 24 Conference transcript, p. 56 (J. Hansen). 25 Petitioner’s postconference brief, exhibit 14, response to question 8 and conference transcript, p. 56 (Hansen)and p. 55 (Sigloch). 26 Petitioner’s postconference brief, exhibit 14, response to question 8. 27 Conference transcript, p. 135 (Weil).
II-8
application of inner grove tube in its “Building Efficiency” products, it is not able to substitute othermaterials such as plastic or steel.21
Petitioners indicate that because investment in nonresidential structures and custom builtresidential structures has held up better than for corporate-built single-family residential structures (suchas by Ryan Homes) and because the substitution of plastic tube for SRC pipe and tube in corporate-builtsingle-family residential structures had largely occurred by the end of 2006, increased substitution ofplastic tube was not an issue during the POI.22 Respondents Dayco, Homewerks, JMF, and Marubeniindicate that the share of new housing starts using copper tube for their water distribution system fell from*** percent in 2006 to *** percent in 2008 for single-family detached homes and from *** percent in2006 to *** percent in 2008 for multifamily homes, while the share of housing starts using PEX tubeincreased for both single-family and multifamily homes.23
Seven of nine responding producers and 17 of 24 responding importers indicated that there aresubstitutes for SRC pipe and tube. The most frequently cited substitutes were plastic tube (such as PEXor PVC), aluminum tube, and stainless steel tube.
Cost Share
SRC pipe and tube generally makes up a very small share of the final cost of construction that itis used in, although it may be a larger share of the plumbing system that it is used in.24 Petitionersindicated that copper plumbing represents a few hundred dollars out of the total cost of a $100,000 houseand that there was considerable variation in the amount of copper tube in a large chiller unit as comparedto a small air conditioner.25 Petitioners estimated the cost share of SRC pipe and tube to be in a range ofHVAC applications ranges from *** to *** percent.26 Importer Golden Dragon indicated that in aresidential air conditioner, the cost share of SRC pipe and tube will be on the low side and be larger forlarge chillers.27
SUBSTITUTABILITY ISSUES
The degree of substitution between domestic and imported SRC pipe and tube depends upon suchfactors as relative prices, quality (e.g., grade standards, reliability of supply, defect rates, etc.), andconditions of sale (e.g., price discounts/rebates, lead times between order and delivery dates, paymentterms, product services, etc.). Based on available data, staff believes that there is a high degree ofsubstitutability between domestically produced SRC pipe and tube and SRC pipe and tube imported fromChina and Mexico.
Factors Affecting Purchasing Decisions
Petitioners indicated that SRC pipe and tube producers compete primarily on the basis of pricebecause SRC pipe and tube produced to a given specification is highly interchangeable whether it is

28 Conference transcript, pp. 9, 16 (Levy). 29 Conference transcript, pp. 80-81 (Altman). 30 Conference transcript, pp. 168-169 (Hansen). 31 Johnson Controls, written submission to the Commission, October 26, 2009, p. 2. 32 Ibid, p. 2. 33 Conference transcript, p. 52 (Arndt, J. Hansen, Sigloch). KobeWieland indicated that some sizes cannot beproduced with cast and roll methods, but that for all sizes that can be produced with both methods, there is nodifference. Ibid. (Sigloch). 34 Conference transcript, pp. 114-115 (Kelly). 35 Conference transcript, pp. 161 (Kelly).
II-9
manufactured in the United States, Mexico, or China.28 Importer Homewerks indicates that it competeson the basis of a superior product range and services and not necessarily lower price, offering over 80different copper tube items to retail customer, smaller case pack sizes than domestic manufacturers use,and being the first to offer security tagging and consumer friendly labeling and packaging.29 ImporterJMF indicated that it cannot compete on the basis of price with domestic producers, so it attempts toout-service the copper tube mills by usually shipping its SRC pipe and tube in one day and within twodays 98 percent of the time.30 Purchaser Johnson Controls indicated it does not base its decisions on pricebut, rather on the performance parameters and capability of the materials and products that it purchases.31 It purchases product that is made from a cast and roll process and has not found SRC pipe and tubeproduced using other methods to be of the same quality and reliability.32 Petitioners indicated that there isno difference between SRC pipe and tube produced from the cast and roll and extrusion processes.33
Comparison of U.S.-Produced and Imported SRC Pipe and Tube
In order to determine whether U.S.-produced SRC pipe and tube can generally be used in thesame applications as imports from China and Mexico, U.S. producers and U.S. importers were askedwhether the products can “always,” “frequently,” “sometimes,” or “never” be used interchangeably. Asshown from table II-2, at least 70 percent of responding producers and between 31 and 33 percent ofresponding importers indicated that SRC pipe and tube produced in the United States and imported fromChina and Mexico are “always” used interchangeably and all or all but one responding producer andbetween 63 and 67 percent of responding importers reported that they are at least “frequently” usedinterchangeably.
Importer *** indicated plumbing tube produced in Mexico is interchangeable with U.S.-producedplumbing tube, but that Mexico does not currently export a significant amount of interchangeablecommercial tube products to the U.S. importer *** indicates that, generally, imported copper tube productis better quality (higher copper content) and has more consistent wall thicknesses. Importer Copper andBrass indicated that the products that it produces in Mexico and supplies to the U.S. market includemilitary specification tube for ship building, heat exchanges for petrochemical applications, sugar tubesfor producing sugar, wave guide tubes for cellular communications, and heavy wall copper tubes oftenused in heat exchange applications and electronic applications.34 They indicate that these products areprobably a fraction of the one to two percent of the scope that Copper and Brass imports into the U.S.market.35 Importer *** indicated that its SRC pipe and tube is generally perceived as being of higherquality than that of U.S. producers.
Importer *** indicates that commercial and industrial buyers prefer cast and roll-producedproduct because of higher copper content (cathode only) and tighter specifications. Purchaser Johnson

36 Johnson Controls, written submission to the Commission, October 26, 2009, p. 3. Johnson Controls indicatesthat only one of the petitioners (KobeWeiland) has recently introduced cast and roll products to the market and that ithas been unable to obtain any pricing or related information to confirm the domestic product will be as reliable,efficient and competitive as existing sources.
II-10
Table II-2SRC pipe and tube: Perceived interchangeability between SRC pipe and tube produced in theUnited States and in other countries, by country pairs
Country pairNumber of U.S. producers
reportingNumber of U.S. importers
reporting
A F S N A F S N
U.S. vs. subject countries: U.S. vs. China 7 2 1 0 9 9 9 0
U.S. vs. Mexico 6 2 0 0 5 5 6 0
U.S. vs. nonsubject countries: U.S. vs. Canada 5 0 2 0 6 2 6 0
U.S. vs. Malaysia 4 0 0 0 5 3 4 0
U.S. vs. other nonsubject 1 0 1 0 5 3 1 0
Subject countries comparisons: China vs. Mexico 6 0 0 0 4 5 2 0
Nonsubject countries comparisons: China vs. Canada 5 0 0 0 5 2 3 0
China vs. Malaysia 4 0 0 0 5 3 3 0
China vs. other nonsubject 1 0 0 0 4 2 0 0
Mexico vs. Canada 5 0 0 0 5 2 3 0
Mexico vs. Malaysia 4 0 0 0 5 2 2 0
Mexico vs. other nonsubject 1 0 0 0 5 2 0 0
Canada vs. Malaysia 4 0 0 0 4 2 2 0
Canada vs. other nonsubject 0 0 0 0 4 2 0 0
Malaysia vs. other nonsubject 1 0 0 0 4 2 0 0
Note.--A = Always, F = Frequently, S = Sometimes, N = Never.Source: Compiled from data submitted in response to Commission questionnaires.
Controls indicated that inner groove tube produced from a continuous horizontal cast and roll process hashistorically only been available from Chinese sources and more recently Mexican sources.36
At least one-half of responding producers and 40 percent of responding importers reported thatSRC pipe and tube produced in the United States and imported from nonsubject countries are “always”used interchangeably. All responding producers and at least 36 percent of importers reported that SRCpipe and tube imports from Canada, China, Malaysia, and Mexico compared to imports from each otherand other countries are “always” used interchangeably.
As indicated in table II-3, all responding U.S. producers and 48 percent of responding importersindicated that differences other than price between SRC pipe and tube produced in the United States andimported from China and Mexico were at most “sometimes” a significant factor in their sales. Allresponding U.S. producers and at least one-half of responding importers indicated that differences other

II-11
Table II-3SRC pipe and tube: Perceived differences other than price between SRC pipe and tube producedin the United States and in other countries, by country pairs
Country pairNumber of U.S. producers
reportingNumber of U.S. importers
reporting
A F S N A F S N
U.S. vs. subject countries: U.S. vs. China 0 0 6 4 7 6 7 5
U.S. vs. Mexico 0 0 3 4 2 4 4 4
U.S. vs. nonsubject countries: U.S. vs. Canada 0 0 5 2 1 1 3 5
U.S. vs. Malaysia 0 0 3 0 3 2 3 2
U.S. vs. other nonsubject 0 0 2 0 0 2 4 3
Subject countries comparisons: China vs. Mexico 0 0 0 4 1 1 3 2
Nonsubject countries comparisons: China vs. Canada 0 0 2 1 0 2 2 3
China vs. Malaysia 0 0 2 0 1 1 4 1
China vs. other nonsubject 0 0 0 0 0 1 2 2
Mexico vs. Canada 0 0 3 1 0 1 2 3
Mexico vs. Malaysia 0 0 2 0 1 1 2 1
Mexico vs. other nonsubject 0 0 0 0 0 1 2 3
Canada vs. Malaysia 0 0 2 0 1 0 2 1
Canada vs. other nonsubject 0 0 0 0 0 0 2 2
Malaysia vs. other nonsubject 0 0 0 0 0 0 2 2
Note.--A = Always, F = Frequently, S = Sometimes, N = Never.Source: Compiled from data submitted in response to Commission questionnaires.
than price between SRC pipe and tube produced in the United States and imported from nonsubjectcountries were at most “sometimes” a significant factor in their sales. All responding U.S. producers andat least 60 percent of responding importers indicated that differences other than price between SRC pipeand tube produced in the United States and imported from nonsubject countries were at most “sometimes”a significant factor in their sales.


PART III: U.S. PRODUCERS’ PRODUCTION, SHIPMENTS, ANDEMPLOYMENT
The Commission analyzes a number of factors in making injury determinations (see 19 U.S.C. §§1677(7)(B) and 1677(7)(C)). Information on the alleged margins of dumping was presented earlier in thisreport and information on the volume of imports of the subject merchandise is presented in Part IV. Information on the pricing of U.S. and imported subject products is presented in Part V. Information onthe other factors specified is presented in this section and/or Part VI and (except as noted) is based on thequestionnaire responses of 12 firms that accounted for 95 percent of U.S. production of SRC pipe andtube during 2008.
U.S. PRODUCERS
The Commission sent producer questionnaires to 35 firms identified as U.S. producers of SRCpipe and tube by the petitioners.1 Twelve firms submitted questionnaire responses.2 Presented in tableIII-1 is a list of current domestic producers of SRC pipe and tube and each company’s position on thepetition, production location(s), related and/or affiliated firms, and share of reported domestic productionof SRC pipe and tube in 2008. Two firms, *** and ***, accounted for *** percent of reported 2008domestic production of SRC pipe and tube.
Five U.S. producers are related to foreign producers of the subject merchandise and one is relatedto U.S. importers of the subject merchandise. In addition, as discussed later in this section, five U.S.producers directly import ***.
1 Converters (redraw mills and independent line set fabricators) comprise approximately *** percent of total U.S.production. Petitioners’ postconference brief, Exh. 14. 2 ***.
III-1
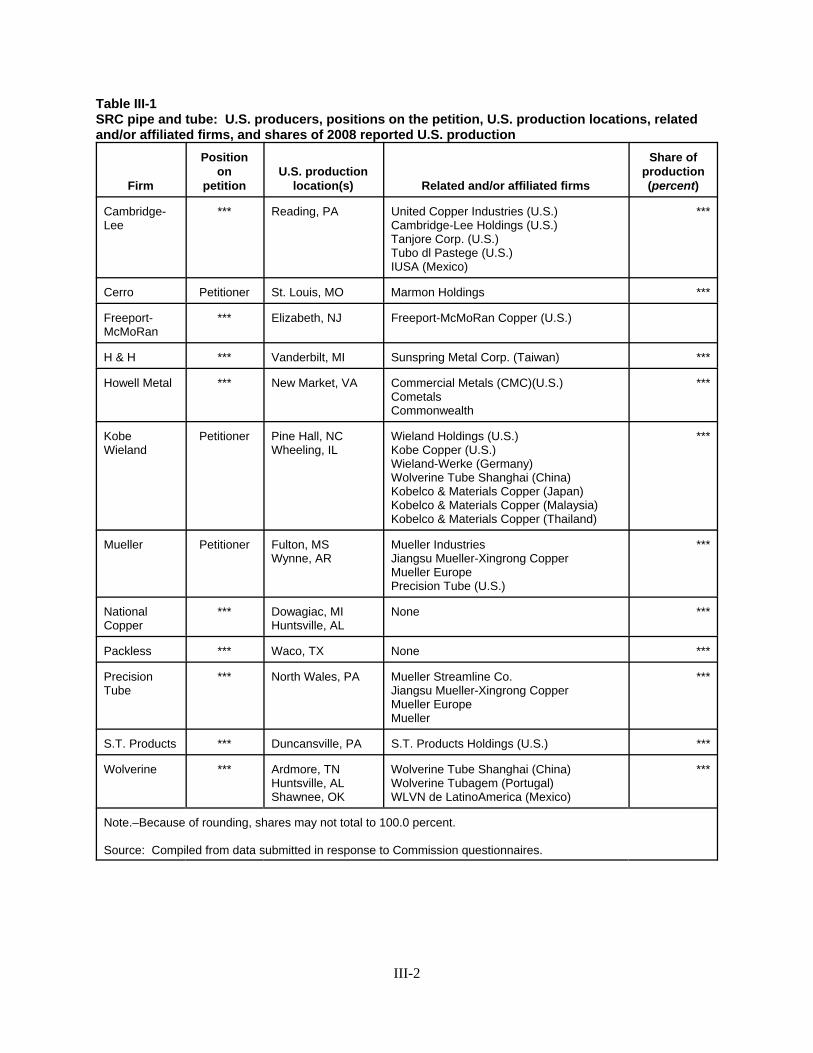
Table III-1SRC pipe and tube: U.S. producers, positions on the petition, U.S. production locations, relatedand/or affiliated firms, and shares of 2008 reported U.S. production
Firm
Positionon
petitionU.S. production
location(s) Related and/or affiliated firms
Share ofproduction(percent)
Cambridge-Lee
*** Reading, PA United Copper Industries (U.S.)Cambridge-Lee Holdings (U.S.)Tanjore Corp. (U.S.)Tubo dl Pastege (U.S.)IUSA (Mexico)
***
Cerro Petitioner St. Louis, MO Marmon Holdings ***
Freeport-McMoRan
*** Elizabeth, NJ Freeport-McMoRan Copper (U.S.)
H & H *** Vanderbilt, MI Sunspring Metal Corp. (Taiwan) ***
Howell Metal *** New Market, VA Commercial Metals (CMC)(U.S.)CometalsCommonwealth
***
KobeWieland
Petitioner Pine Hall, NCWheeling, IL
Wieland Holdings (U.S.)Kobe Copper (U.S.)Wieland-Werke (Germany)Wolverine Tube Shanghai (China)Kobelco & Materials Copper (Japan)Kobelco & Materials Copper (Malaysia)Kobelco & Materials Copper (Thailand)
***
Mueller Petitioner Fulton, MSWynne, AR
Mueller IndustriesJiangsu Mueller-Xingrong CopperMueller EuropePrecision Tube (U.S.)
***
NationalCopper
*** Dowagiac, MIHuntsville, AL
None ***
Packless *** Waco, TX None ***
PrecisionTube
*** North Wales, PA Mueller Streamline Co.Jiangsu Mueller-Xingrong CopperMueller EuropeMueller
***
S.T. Products *** Duncansville, PA S.T. Products Holdings (U.S.) ***
Wolverine *** Ardmore, TNHuntsville, ALShawnee, OK
Wolverine Tube Shanghai (China)Wolverine Tubagem (Portugal)WLVN de LatinoAmerica (Mexico)
***
Note.–Because of rounding, shares may not total to 100.0 percent.
Source: Compiled from data submitted in response to Commission questionnaires.
III-2
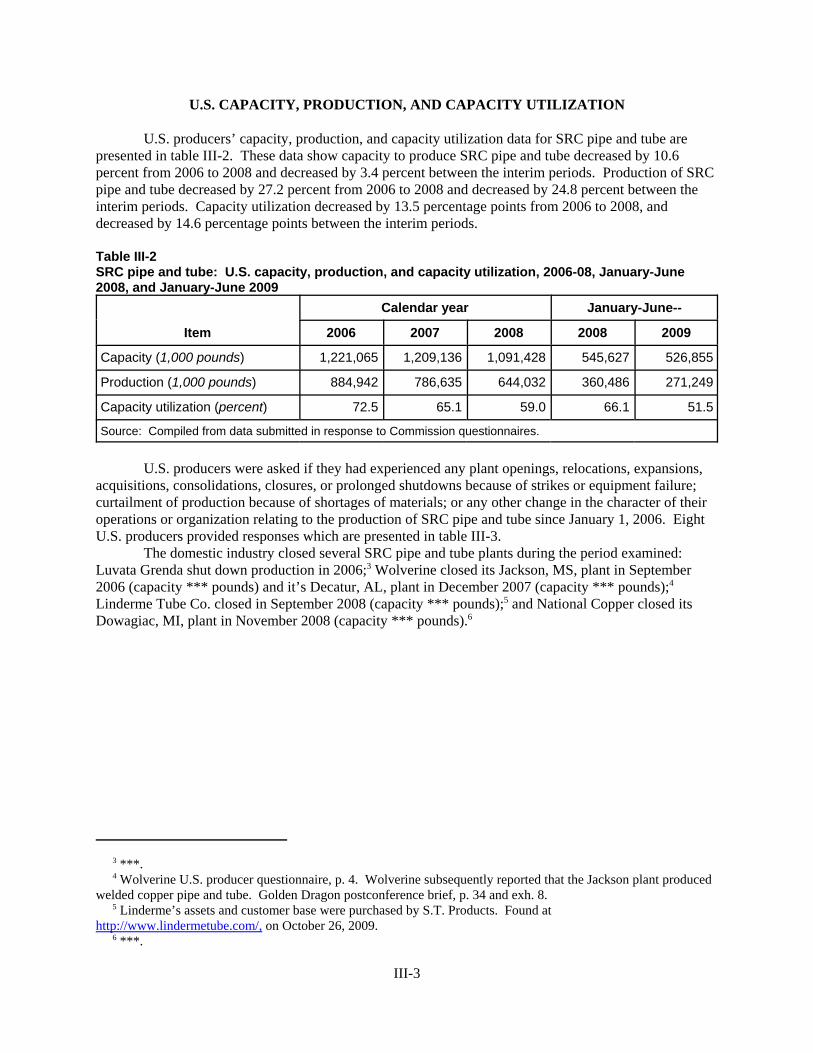
U.S. CAPACITY, PRODUCTION, AND CAPACITY UTILIZATION
U.S. producers’ capacity, production, and capacity utilization data for SRC pipe and tube arepresented in table III-2. These data show capacity to produce SRC pipe and tube decreased by 10.6percent from 2006 to 2008 and decreased by 3.4 percent between the interim periods. Production of SRCpipe and tube decreased by 27.2 percent from 2006 to 2008 and decreased by 24.8 percent between theinterim periods. Capacity utilization decreased by 13.5 percentage points from 2006 to 2008, anddecreased by 14.6 percentage points between the interim periods.
Table III-2SRC pipe and tube: U.S. capacity, production, and capacity utilization, 2006-08, January-June2008, and January-June 2009
Item
Calendar year January-June--
2006 2007 2008 2008 2009
Capacity (1,000 pounds) 1,221,065 1,209,136 1,091,428 545,627 526,855
Production (1,000 pounds) 884,942 786,635 644,032 360,486 271,249
Capacity utilization (percent) 72.5 65.1 59.0 66.1 51.5
Source: Compiled from data submitted in response to Commission questionnaires.
U.S. producers were asked if they had experienced any plant openings, relocations, expansions,acquisitions, consolidations, closures, or prolonged shutdowns because of strikes or equipment failure;curtailment of production because of shortages of materials; or any other change in the character of theiroperations or organization relating to the production of SRC pipe and tube since January 1, 2006. EightU.S. producers provided responses which are presented in table III-3.
The domestic industry closed several SRC pipe and tube plants during the period examined:Luvata Grenda shut down production in 2006;3 Wolverine closed its Jackson, MS, plant in September2006 (capacity *** pounds) and it’s Decatur, AL, plant in December 2007 (capacity *** pounds);4
Linderme Tube Co. closed in September 2008 (capacity *** pounds);5 and National Copper closed itsDowagiac, MI, plant in November 2008 (capacity *** pounds).6
3 ***. 4 Wolverine U.S. producer questionnaire, p. 4. Wolverine subsequently reported that the Jackson plant producedwelded copper pipe and tube. Golden Dragon postconference brief, p. 34 and exh. 8. 5 Linderme’s assets and customer base were purchased by S.T. Products. Found athttp://www.lindermetube.com/, on October 26, 2009. 6 ***.
III-3

Table III-3SRC pipe and tube: Changes in U.S. producers’ production operations
* * * * * * *
Five U.S. producers reported the production of other products on the same equipment andmachinery and using the same production and related workers employed in the production of SRC pipeand tube, as presented in table III-4.
Table III-4SRC pipe and tube: Production of other products on the same equipment and machinery
* * * * * * *
U.S. PRODUCERS’ SHIPMENTS
Data on domestic producers’ shipments of SRC pipe and tube are presented in table III-5. U.S.shipments accounted for 95.5 percent of U.S. producers’ total shipments of SRC pipe and tube in 2008,and 95.6 percent in interim 2009. U.S. producers reported no internal consumption. Transfers to relatedfirms accounted for *** percent of U.S. producers’ total shipments of SRC pipe and tube in 2008 and ***percent interim 2009.7 U.S. shipments decreased by 28.9 percent from 2006 to 2008, and decreased by23.5 percent between the interim periods. The unit value of U.S. shipments increased by 11.5 percentfrom 2006 to 2008, and decreased by 39.1 percent in the interim periods. Exports of SRC pipe and tubewere reported by nine firms.8 These exports decreased by 9.6 percent from 2006 to 2008, and decreasedby 27.1 percent between the interim periods. Exports accounted for 4.5 percent of U.S. producers’ totalshipments during 2008, and 4.4 percent in interim 2009. The export markets listed included ***.
7 ***. 8 ***.
III-4

Table III-5SRC pipe and tube: U.S. producers’ shipments, by types, 2006-08, January-June 2008, andJanuary-June 2009
Item
Calendar year January-June--
2006 2007 2008 2008 2009
Quantity (1,000 pounds)
Commercial shipments *** *** *** *** ***
Transfers to related firms *** *** *** *** ***
U.S. shipments 873,514 760,389 620,882 348,389 266,537
Export shipments 32,331 31,064 29,239 16,746 12,212
Total shipments 905,845 791,453 650,121 365,135 278,749
Value (1,000 dollars)
Commercial shipments *** *** *** *** ***
Transfers to related firms *** *** *** *** ***
U.S. shipments 3,320,204 3,113,613 2,632,047 1,539,732 717,598
Export shipments 121,983 126,476 125,222 74,030 32,906
Total shipments 3,442,187 3,240,089 2,757,269 1,613,762 750,504
Unit value (per pound)
Commercial shipments *** *** *** *** ***
Transfers to related firms *** *** *** *** ***
U.S. shipments 3.80 4.09 4.24 4.42 2.69
Export shipments 3.77 4.07 4.28 4.42 2.69
Total shipments 3.80 4.09 4.24 4.42 2.69
Share of quantity (percent)
Commercial shipments *** *** *** *** ***
Transfers to related firms *** *** *** *** ***
U.S. shipments 96.4 96.1 95.5 95.4 95.6
Export shipments 3.6 3.9 4.5 4.6 4.4
Total shipments 100.0 100.0 100.0 100.0 100.0
Note.–Because of rounding, figures may not add to the totals shown.
Source: Compiled from data submitted in response to Commission questionnaires.
III-5
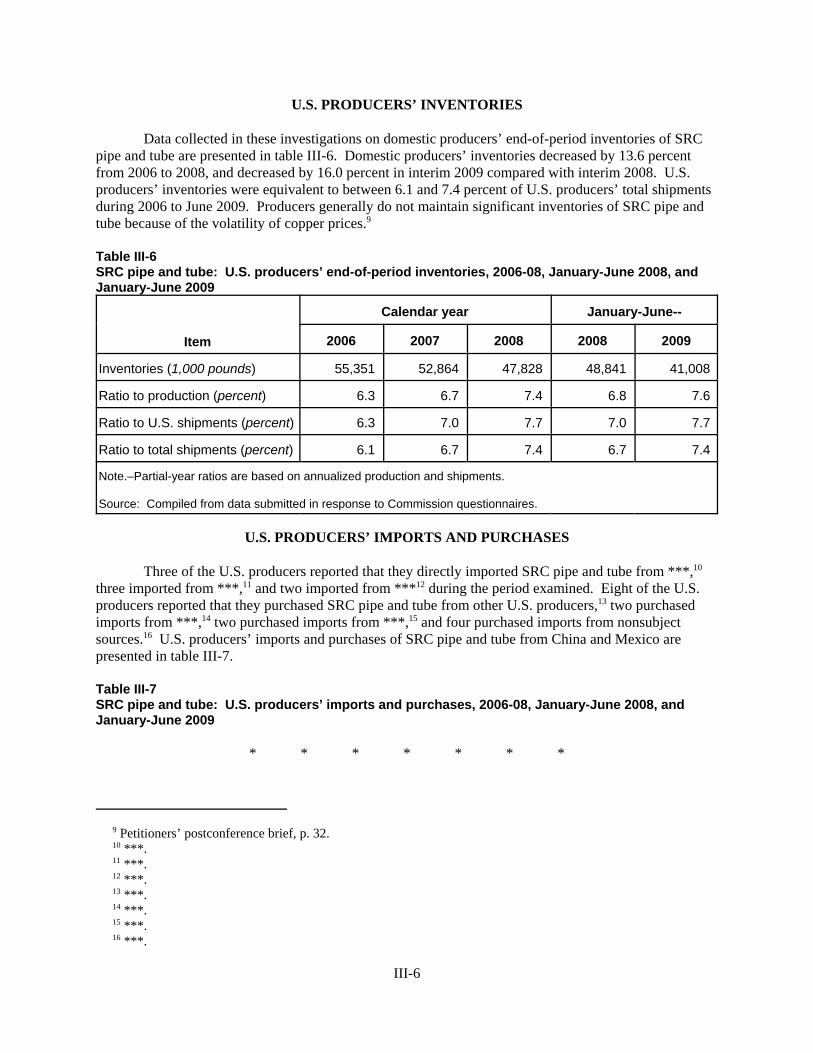
U.S. PRODUCERS’ INVENTORIES
Data collected in these investigations on domestic producers’ end-of-period inventories of SRCpipe and tube are presented in table III-6. Domestic producers’ inventories decreased by 13.6 percentfrom 2006 to 2008, and decreased by 16.0 percent in interim 2009 compared with interim 2008. U.S.producers’ inventories were equivalent to between 6.1 and 7.4 percent of U.S. producers’ total shipmentsduring 2006 to June 2009. Producers generally do not maintain significant inventories of SRC pipe andtube because of the volatility of copper prices.9
Table III-6SRC pipe and tube: U.S. producers’ end-of-period inventories, 2006-08, January-June 2008, andJanuary-June 2009
Item
Calendar year January-June--
2006 2007 2008 2008 2009
Inventories (1,000 pounds) 55,351 52,864 47,828 48,841 41,008
Ratio to production (percent) 6.3 6.7 7.4 6.8 7.6
Ratio to U.S. shipments (percent) 6.3 7.0 7.7 7.0 7.7
Ratio to total shipments (percent) 6.1 6.7 7.4 6.7 7.4
Note.–Partial-year ratios are based on annualized production and shipments.
Source: Compiled from data submitted in response to Commission questionnaires.
U.S. PRODUCERS’ IMPORTS AND PURCHASES
Three of the U.S. producers reported that they directly imported SRC pipe and tube from ***,10
three imported from ***,11 and two imported from ***12 during the period examined. Eight of the U.S.producers reported that they purchased SRC pipe and tube from other U.S. producers,13 two purchasedimports from ***,14 two purchased imports from ***,15 and four purchased imports from nonsubjectsources.16 U.S. producers’ imports and purchases of SRC pipe and tube from China and Mexico arepresented in table III-7.
Table III-7SRC pipe and tube: U.S. producers’ imports and purchases, 2006-08, January-June 2008, andJanuary-June 2009
* * * * * * *
9 Petitioners’ postconference brief, p. 32. 10 ***. 11 ***. 12 ***. 13 ***. 14 ***. 15 ***. 16 ***.
III-6

U.S. EMPLOYMENT, WAGES, AND PRODUCTIVITY
U.S. producers’ aggregate employment data for SRC pipe and tube are presented in table III-8.17 In the aggregate, U.S. SRC pipe and tube producers reported a 19.1 percent decrease in the number ofproduction and related workers employed in the manufacture of SRC pipe and tube from 2006 to 2008,and a 16.8 percent decrease in interim 2009 compared with interim 2008. *** accounted for the majorshare of the decrease in number of employees from 2006 to 2008, and *** accounted for the majority ofthe decrease in interim 2009. Productivity decreased 11.3 percent from 2006 to 2008, and by 3.4 percentin interim 2009 compared with interim 2008.
Table III-8SRC pipe and tube: U.S. producers’ employment-related data, 2006-08, January-June 2008, andJanuary-June 2009
Item
Calendar year January-June--
2006 2007 2008 2008 2009
Production and related workers (PRWs) 3,913 3,628 3,166 3,280 2,730
Hours worked by PRWs (1,000 hours) 8,034 7,565 6,571 3,473 2,718
Wages paid to PRWs (1,000 dollars) 148,451 148,136 129,242 69,495 54,963
Hourly wages $18.48 $19.58 $19.67 $20.01 $20.22
Productivity (pounds produced per 1,000 hours) 108.4 102.2 96.2 102.0 98.5
Unit labor costs (per 1,000 pounds) $0.17 $0.19 $0.20 $0.20 $0.21
Source: Compiled from data submitted in response to Commission questionnaires.
17 ***.
III-7


PART IV: U.S. IMPORTS, APPARENT CONSUMPTION, ANDMARKET SHARES
U.S. IMPORTERS
Importer questionnaires were sent to 78 firms believed to be importers of subject SRC pipe andtube, as well as to all U.S. producers of SRC pipe and tube.1 Usable questionnaire responses werereceived from 42 companies,2 representing 91 percent of total imports from China, 100 percent of totalimports from Mexico, and 44 percent of total imports from all other sources. Table IV-1 lists allresponding U.S. importers of SRC pipe and tube from China, Mexico, and other sources, their locations,and their shares of U.S. imports in 2008. In 2008, the largest importer of SRC pipe and tube from Chinawas ***, the largest importer of SRC pipe and tube from Mexico was ***, and the largest importer ofSRC pipe and tube from other sources was ***.
1 The Commission sent questionnaires to those firms identified in the petition, along with firms that, based on areview of data provided by U.S. Customs and Border Protection (“Customs”), may have imported greater than onepercent of total imports under HTS subheadings 7411.10.1030 or 7411.10.1090 in any one year since 2006. 2 The Commission received questionnaire responses from 11 firms that reported that they did not import SRCpipe and tube during the period examined. Those firms are: ***.
IV-1
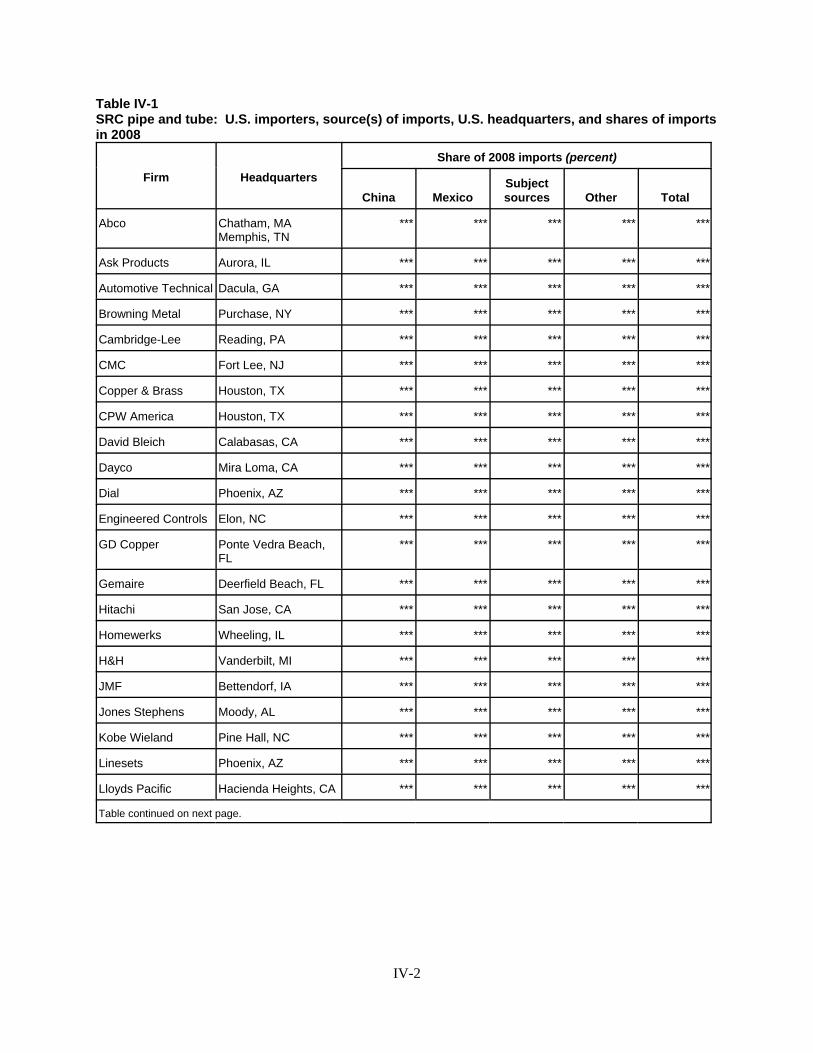
Table IV-1SRC pipe and tube: U.S. importers, source(s) of imports, U.S. headquarters, and shares of importsin 2008
Firm Headquarters
Share of 2008 imports (percent)
China MexicoSubjectsources Other Total
Abco Chatham, MAMemphis, TN
*** *** *** *** ***
Ask Products Aurora, IL *** *** *** *** ***
Automotive Technical Dacula, GA *** *** *** *** ***
Browning Metal Purchase, NY *** *** *** *** ***
Cambridge-Lee Reading, PA *** *** *** *** ***
CMC Fort Lee, NJ *** *** *** *** ***
Copper & Brass Houston, TX *** *** *** *** ***
CPW America Houston, TX *** *** *** *** ***
David Bleich Calabasas, CA *** *** *** *** ***
Dayco Mira Loma, CA *** *** *** *** ***
Dial Phoenix, AZ *** *** *** *** ***
Engineered Controls Elon, NC *** *** *** *** ***
GD Copper Ponte Vedra Beach,FL
*** *** *** *** ***
Gemaire Deerfield Beach, FL *** *** *** *** ***
Hitachi San Jose, CA *** *** *** *** ***
Homewerks Wheeling, IL *** *** *** *** ***
H&H Vanderbilt, MI *** *** *** *** ***
JMF Bettendorf, IA *** *** *** *** ***
Jones Stephens Moody, AL *** *** *** *** ***
Kobe Wieland Pine Hall, NC *** *** *** *** ***
Linesets Phoenix, AZ *** *** *** *** ***
Lloyds Pacific Hacienda Heights, CA *** *** *** *** ***
Table continued on next page.
IV-2

Table IV-1--ContinuedSRC pipe and tube: U.S. importers, source(s) of imports, U.S. headquarters, and shares of imports in 2008
Firm Headquarters
Share of 2008 imports (percent)
China MexicoSubjectsources Other Total
Luvata Franklin Franklin, KY *** *** *** *** ***
Luvata Grenada Grenada, MS *** *** *** *** ***
Marubeni New York, NY *** *** *** *** ***
MGM Las Vegas, NV *** *** *** *** ***
Modine Racine, WI *** *** *** *** ***
NWI Oceanside, CA *** *** *** *** ***
National Bronze &Metals
Houston, TX *** *** *** *** ***
National Coil Longview, TX *** *** *** *** ***
New Pacific Wilmington, CA *** *** *** *** ***
Nordyne O’Fallon, MO *** *** *** *** ***
Packless Waco, TX *** *** *** *** ***
Panduit Tinley Park, IL *** *** *** *** ***
Pepco Irving, TX *** *** *** *** ***
Refricenter Miami, FL *** *** *** *** ***
S.T. Products Duncansville, PA *** *** *** *** ***
Toyota Georgetown, KY *** *** *** *** ***
Wells Plumbing Chicago, IL *** *** *** *** ***
Wieland Metal Wheeling, IL *** *** *** *** ***
Wolverine Huntsville, ALArdmore, TNShawnee, OKCarrollton, TX
*** *** *** *** ***
Zhajiang Hailiang Zhejiang, China *** *** *** *** ***
Total 100.0 100.0 100.0 100.0 100.0
Note.–Because of rounding, figures may not add to the totals shown.
Source: Compiled from data submitted in response to Commission questionnaires.
IV-3

U.S. IMPORTS
U.S. imports are based on official import statistics of Commerce.3 Table IV-2 presents data forU.S. imports of SRC pipe and tube from China, Mexico, and all other sources. China is the largestforeign supplier of SRC pipe and tube to the United States, accounting for 45.0 percent of the quantity oftotal imports in 2008, and 44.8 percent of the value. Mexico is the second-largest foreign supplier of SRCpipe and tube to the United States, accounting for 28.9 percent of the quantity of total imports in 2008 and28.3 percent of the value.
From 2006 to 2008, the quantity and value of imports of SRC pipe and tube from China increasedby 22.0 percent and 44.0 percent, respectively, then decreased by 23.4 percent and 57.2 percent,respectively, in interim 2009 compared with interim 2008. The unit value of imports of SRC pipe andtube from China increased by 18.1 percent from 2006 to 2008, and decreased by 44.2 percent in interim2009 compared with interim 2008. From 2006 to 2008, the quantity of imports of SRC pipe and tubefrom Mexico decreased by 10.6 percent and the value increased by 0.9 percent; they decreased by 21.9percent and 51.1 percent, respectively, in interim 2009 compared with interim 2008. The unit value ofimports of SRC pipe and tube from Mexico increased by 12.9 percent from 2006 to 2008, and decreasedby 37.4 percent in interim 2009 compared with interim 2008. The quantity and value of imports fromnonsubject countries decreased by 28.5 percent and by 14.7 percent, respectively, from 2006 to 2008, andby 29.3 percent and 57.9 percent, respectively, in interim 2009 compared with interim 2008. The unitvalue of imports of SRC pipe and tube from nonsubject sources increased by 19.3 percent from 2006 to2008, and decreased by 40.4 percent in interim 2009 compared with interim 2008.
Nonsubject imports of SRC pipe and tube are presented in table IV-3. Canada and Malaysia arethe largest nonsubject foreign suppliers of SRC pipe and tube to the United States.4
3 SRC pipe and tube is classifiable in the Harmonized Tariff Schedule of the United States (“HTS”) undersubheadings 7411.10.1030 or 7411.10.1090. 4 Other major nonsubject suppliers include Korea, Japan, Germany, and Chile.
IV-4

Table IV-2SRC pipe and tube: U.S. imports, by sources, 2006-08, January-June 2008, and January-June 2009
Source
Calendar year January-June
2006 2007 2008 2008 2009
Quantity (1,000 pounds)
China 91,113 90,624 111,126 64,439 49,388
Mexico 79,817 75,199 71,327 40,110 31,340
Subtotal 170,930 165,823 182,453 104,549 80,728
Nonsubject 90,088 74,226 64,441 32,477 22,961
Total 261,018 240,049 246,894 137,026 103,689
Value (1,000 dollars)1
China 309,873 348,772 446,282 259,591 110,981
Mexico 279,361 284,287 281,957 162,388 79,376
Subtotal 589,234 633,059 728,239 421,979 190,357
Nonsubject 314,358 292,345 268,218 136,025 57,314
Total 903,592 925,404 996,457 558,004 247,671
Unit value (per pound)1
China $3.40 $3.85 $4.02 $4.03 $2.25
Mexico 3.50 3.78 3.95 4.05 2.53
Subtotal 3.45 3.82 3.99 4.04 2.36
Nonsubject 3.49 3.94 4.16 4.19 2.50
Average 3.46 3.86 4.04 4.07 2.39
Share of quantity (percent)
China 34.9 37.8 45.0 47.0 47.6
Mexico 30.6 31.3 28.9 29.3 30.2
Subtotal 65.5 69.1 73.9 76.3 77.9
Nonsubject 34.5 30.9 26.1 23.7 22.1
Total 100.0 100.0 100.0 100.0 100.0
Share of value (percent)
China 34.3 37.7 44.8 46.5 44.8
Mexico 30.9 30.7 28.3 29.1 32.0
Subtotal 65.2 68.4 73.1 75.6 76.9
Nonsubject 34.8 31.6 26.9 24.4 23.1
Total 100.0 100.0 100.0 100.0 100.0
1 Landed, U.S. port of entry, duty-paid.
Source: Compiled from official Commerce statistics.
IV-5

Table IV-3SRC pipe and tube: U.S. imports from nonsubject countries, by sources, 2006-08, January-June 2008, andJanuary-June 2009
Source
Calendar year January-June
2006 2007 2008 2008 2009
Quantity (1,000 pounds)
Canada 25,375 17,557 20,016 9,957 8,638
Malaysia 20,853 23,039 15,633 4,998 6,565
Korea 8,871 8,550 8,816 6,265 3,119
Japan 14,148 10,864 4,726 3,297 195
Germany 4,134 3,936 3,930 2,279 1,810
Chile 4,000 2,458 3,688 1,976 666
United Kingdom 3,995 3,651 2,805 1,627 981
Greece 7,138 2,603 2,486 952 543
All other 1,575 1,569 2,341 1,125 443
Total 90,088 74,226 64,441 32,477 22,961
Value (1,000 dollars)1
Canada 86,739 65,556 80,748 42,678 20,721
Malaysia 77,483 89,966 64,082 19,039 15,386
Korea 29,218 32,981 36,266 25,821 7,416
Japan 49,027 42,197 20,908 14,292 627
Germany 15,344 19,134 20,151 11,438 6,006
Chile 13,652 9,433 14,509 7,782 1,603
United Kingdom 12,441 15,080 11,922 7,151 2,491
Greece 24,148 9,958 10,282 3,881 1,736
All other 6,307 8,040 9,349 3,944 1,328
Total 314,358 292,345 268,218 136,025 57,314
Unit value (per pound)1
Canada $3.42 $3.73 $4.03 $4.29 $2.40
Malaysia 3.72 3.90 4.10 3.81 2.34
Korea 3.29 3.86 4.11 4.12 2.38
Japan 3.47 3.88 4.42 4.34 3.21
Germany 3.71 4.86 5.13 5.02 3.32
Chile 3.41 3.84 3.93 3.94 2.41
United Kingdom 3.11 4.13 4.25 4.39 2.54
Greece 3.38 3.83 4.14 4.08 3.20
All other 4.00 5.12 3.99 3.50 3.00
Total 3.49 3.94 4.16 4.19 2.50
1 Landed, U.S. port of entry, duty-paid.
Source: Compiled from official Commerce statistics.
IV-6

CUMULATION CONSIDERATIONS
In assessing whether subject imports are likely to compete with each other and with the domestic like product with respect to cumulation, the Commission generally has considered the following fourfactors: (1) the degree of fungibility, including specific customer requirements and other quality-relatedquestions; (2) presence of sales or offers to sell in the same geographic markets; (3) common channels ofdistribution; and (4) simultaneous presence in the market. Channels of distribution and fungibility(interchangeability) are discussed in Part II of this report.
Geographic Markets
Table IV-4 presents imports from China by Customs districts from 2006 to 2008, while table IV-5 presents imports from Mexico by Customs districts for the same period. Houston-Galveston, TX,was the largest district of entry for imports from China, accounting for 48.7 percent of total subjectimports during 2008. New Orleans, LA, was the second largest port, with 11.1 percent of imports fromChina. Laredo, TX, was the largest district of entry for imports from Mexico, accounting for 89.0 percentof total subject imports during 2008. El Paso, TX, was the second largest port, with 9.0 percent of subjectimports.
IV-7

Table IV-4SRC pipe and tube: U.S. imports from China, by Customs district, 2006-08
Customs district
Calendar yearShare of 2008
(percent)2006 2007 2008
Quantity (1,000 pounds)
Baltimore, MD 237 430 0 0.0
Boston, MA 597 1,062 1,241 1.1
Buffalo, NY 260 603 562 0.5
Charleston, SC 2 0 90 0.1
Charlotte, NC 387 244 237 0.2
Chicago, IL 2,426 2,025 5,875 5.3
Cleveland, OH 240 35 486 0.4
Dallas-Fort Worth, TX 9,435 7,886 6,871 6.2
Detroit, MI 646 753 459 0.4
Great Falls, MT 0 2 139 0.1
Honolulu, HI 0 0 7 0.0
Houston-Galveston, TX 50,999 47,814 54,124 48.7
Laredo, TX 2 43 17 0.0
Los Angeles, CA 5,701 8,337 5,743 5.2
Miami, FL 5,049 2,724 2,169 2.0
Minneapolis, MN 389 193 1,054 0.9
Mobile, AL 917 623 3,563 3.2
New Orleans, LA 2,599 8,913 12,371 11.1
New York, NY 581 1,051 728 0.7
Nogales, AZ 102 146 2 0.0
Norfolk, VA 245 434 331 0.3
Ogdensburg, NY 46 30 17 0.0
Philadelphia, PA 29 0 13 0.0
San Francisco, CA 225 95 51 0.0
San Juan, PR 90 139 176 0.2
Savannah, GA 6,825 5,736 11,845 10.7
Seattle, WA 276 127 132 0.1
St. Albans, VT 35 5 0 0.0
St. Louis, MO 4 353 2,509 2.3
Tampa, FL 2,768 819 312 0.3
Washington, DC 1 0 0 0.0
Total 91,113 90,624 111,126 100.0
Source: Compiled from official Commerce statistics.
IV-8

Table IV-5SRC pipe and tube: U.S. imports from Mexico, by Customs district, 2006-08
Customs district
Calendar yearShare of 2008
(percent)2006 2007 2008
Quantity (1,000 pounds)
Chicago, IL 0 0 1 0.0
Cleveland, OH 3 0 0 0.0
El Paso, TX 11,855 6,038 6,446 9.0
Laredo, TX 66,411 68,623 63,480 89.0
Miami, FL 432 184 580 0.8
San Diego, CA 13 1 1 0.0
San Juan, PR 1,102 353 820 1.1
Total 79,817 75,199 71,327 100.0
Source: Compiled from official Commerce statistics.
Simultaneous Presence in the Market
SRC pipe and tube produced in China and Mexico was present throughout the period for whichdata were collected. Table IV-6 presents monthly import entries into the United States by sources.
IV-9

IV-10
Table IV-6SRC: U.S. imports, monthly entries into the United States, by sources, 2006-08, and January-August 2009
Source Jan. Feb. Mar. Apr. May June July Aug. Sept. Oct. Nov. Dec. Total
2006:
China 6,026 5,474 7,197 8,298 7,615 9,417 9,253 8,678 9,054 8,857 6,042 5,202 91,113
Mexico 6,660 6,093 8,670 6,651 9,046 11,676 8,070 6,944 3,515 3,348 4,089 5,054 79,817
Subtotal 12,686 11,567 15,866 14,949 16,661 21,094 17,323 15,622 12,569 12,205 10,131 10,256 170,930
All other 8,200 8,011 7,547 7,277 8,084 8,389 8,346 8,919 6,444 6,579 6,145 6,148 90,088
Total 20,886 19,579 23,413 22,226 24,745 29,482 25,669 24,541 19,012 18,784 16,276 16,404 261,018
2007:
China 6,095 5,879 8,884 6,882 8,146 11,180 11,256 8,448 6,275 7,715 5,659 4,205 90,624
Mexico 6,623 5,171 8,243 6,858 9,594 6,082 5,811 7,160 5,722 4,651 4,642 4,642 75,199
Subtotal 12,718 11,049 17,127 13,740 17,741 17,262 17,067 15,608 11,998 12,365 10,301 8,847 165,823
All other 5,964 5,964 6,518 5,966 6,077 6,433 7,521 5,698 5,609 5,960 6,500 6,017 74,226
Total 18,681 17,013 23,645 19,707 23,817 23,695 24,588 21,307 17,606 18,325 16,801 14,863 240,049
2008:
China 8,957 7,570 11,533 13,683 13,328 9,368 13,332 12,307 6,553 6,473 4,942 3,079 111,126
Mexico 5,942 6,583 8,855 7,484 5,675 5,570 6,761 6,489 6,129 5,306 2,823 3,710 71,327
Subtotal 14,900 14,152 20,389 21,168 19,003 14,938 20,093 18,795 12,682 11,779 7,765 6,789 182,453
All other 5,009 5,557 6,258 5,794 4,728 5,131 7,460 5,193 5,715 4,275 5,258 4,064 64,441
Total 19,908 19,710 26,646 26,962 23,731 20,069 27,553 23,989 18,396 16,054 13,023 10,853 246,894
2009
China 6,012 6,834 9,989 7,611 8,836 10,107 8,661 8,387 (1) (1) (1) (1) 66,436
Mexico 5,679 4,864 5,575 5,735 5,771 3,717 4,843 3,234 (1) (1) (1) (1) 39,418
Subtotal 11,690 11,698 15,564 13,346 14,607 13,823 13,504 11,622 (1) (1) (1) (1) 105,854
All other 3,981 3,481 3,913 3,179 4,075 4,331 4,015 4,365 (1) (1) (1) (1) 31,341
Total 15,672 15,179 19,477 16,525 18,681 18,155 17,519 15,987 (1) (1) (1) (1) 137,195
1 Not available.Source: Compiled from official statistics of Commerce.

NEGLIGIBILITY
The statute requires that an investigation be terminated without an injury determination if importsof the subject merchandise are found to be negligible.5 Negligible imports are generally defined in theTariff Act of 1930, as amended, as imports from a country of merchandise corresponding to a domesticlike product where such imports account for less than 3 percent of the volume of all such merchandiseimported into the United States in the most recent 12-month period for which data are available thatprecedes the filing of the petition or the initiation of the investigation. However, if there are imports ofsuch merchandise from a number of countries subject to investigations initiated on the same day thatindividually account for less than 3 percent of the total volume of the subject merchandise, and if theimports from those countries collectively account for more than 7 percent of the volume of all suchmerchandise imported into the United States during the applicable 12-month period, then imports fromsuch countries are deemed not to be negligible.6 Imports from China accounted for 44.7 percent of totalimports of SRC pipe and tube by quantity during September 2008 - August 2009. Imports from Mexicoaccounted for 29.3 percent of total imports of SRC pipe and tube by quantity during September 2008 -August 2009.
5 Sections 703(a)(1), 705(b)(1), 733(a)(1), and 735(b)(1) of the Act (19 U.S.C. §§ 1671b(a)(1), 1671d(b)(1),1673b(a)(1), and 1673d(b)(1)). 6 Section 771(24) of the Act (19 U.S.C. § 1677(24)).
IV-11

APPARENT U.S. CONSUMPTION
Data concerning apparent U.S. consumption of SRC pipe and tube during the period shown intable IV-7 and figure IV-1 are based on questionnaire responses for U.S. shipments and officialCommerce statistics import data. The quantity of apparent U.S. consumption decreased by 23.5 percentfrom 2006 to 2008, and then decreased by 23.7 percent in interim 2009 compared with interim 2008. U.S. demand for SRC pipe and tube is primarily from new residential construction, new commercialconstruction, and the replacement market for air conditioning and refrigeration units.7
Table IV-7SRC pipe and tube: U.S. shipments of domestic product, U.S. shipments of imports, and apparentU.S. consumption, 2006-08, January-June 2008, and January-June 2009
Item
Calendar year January-June
2006 2007 2008 2008 2009
Quantity (1,000 pounds)
U.S. producers’ U.S. shipments 873,514 760,389 620,882 348,389 266,537
U.S. shipments of imports from–
China 91,113 90,624 111,126 64,439 49,388
Mexico 79,817 75,199 71,327 40,110 31,340
Subtotal 170,930 165,823 182,453 104,549 80,728
Nonsubject countries 90,088 74,226 64,441 32,477 22,961
Total U.S. import shipments 261,018 240,049 246,894 137,026 103,689
Apparent U.S. consumption 1,134,532 1,000,438 867,776 485,415 370,226
Value (1,000 dollars)
U.S. producers’ U.S. shipments 3,320,204 3,113,613 2,632,047 1,539,732 717,598
U.S. shipments of imports from--
China 309,873 348,772 446,282 259,591 110,981
Mexico 279,361 284,287 281,957 162,388 79,376
Subtotal 589,233 633,059 728,238 421,979 190,357
Nonsubject countries 314,358 292,345 268,218 136,025 57,314
Total U.S. import shipments 903,592 925,404 996,456 558,004 247,671
Apparent U.S. consumption 4,223,796 4,039,017 3,628,503 2,097,736 965,269
Note.–Because of rounding, figures may not add to the totals shown.
Source: Compiled from official Commerce statistics.
7 Petitioners’ postconference brief, p. 23.
IV-12
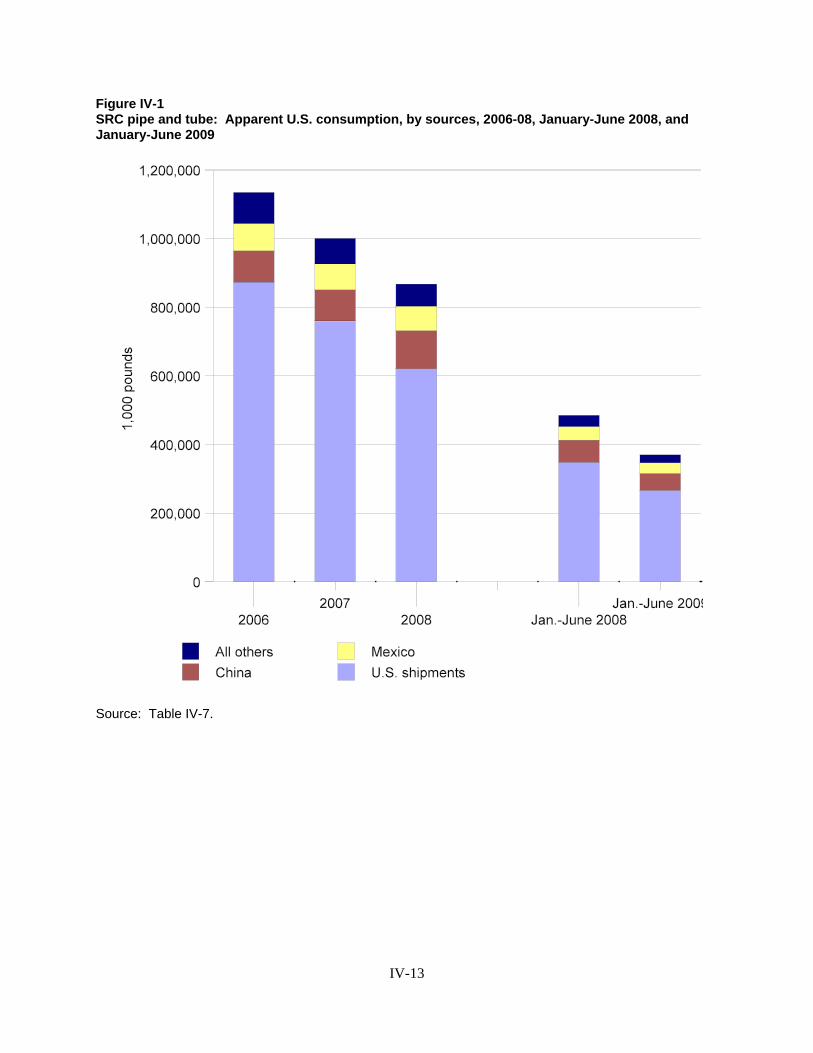
Figure IV-1SRC pipe and tube: Apparent U.S. consumption, by sources, 2006-08, January-June 2008, andJanuary-June 2009
Source: Table IV-7.
IV-13
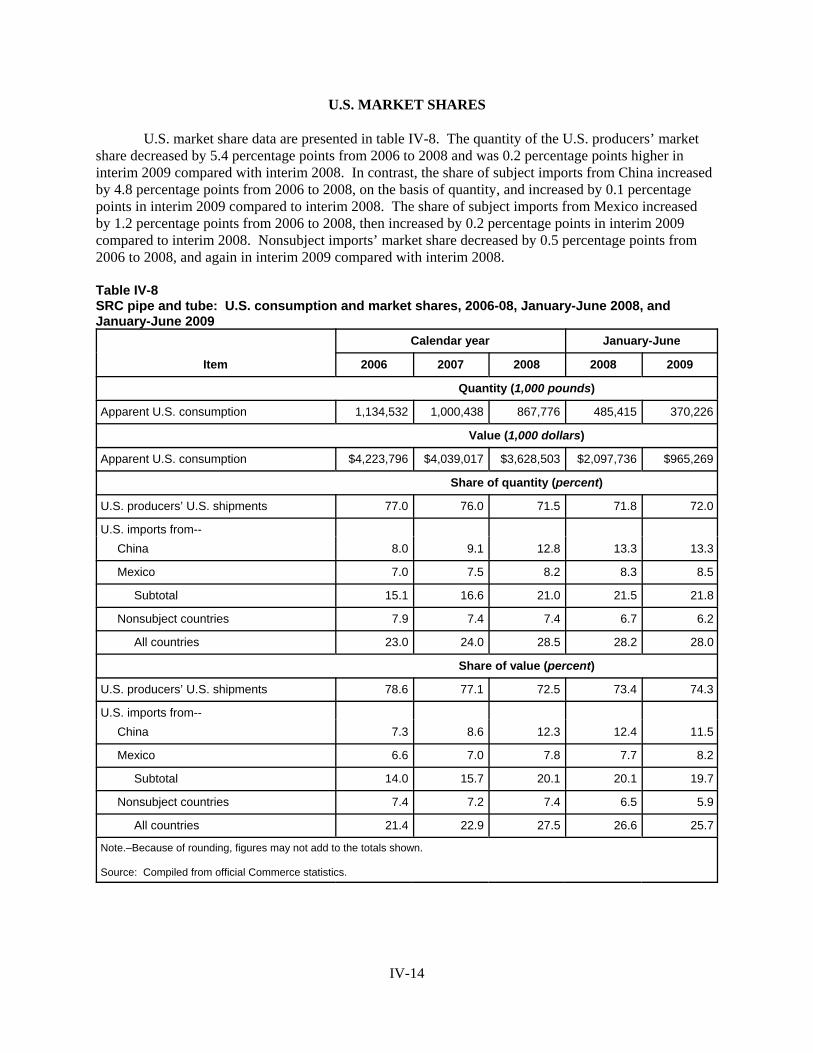
U.S. MARKET SHARES
U.S. market share data are presented in table IV-8. The quantity of the U.S. producers’ marketshare decreased by 5.4 percentage points from 2006 to 2008 and was 0.2 percentage points higher ininterim 2009 compared with interim 2008. In contrast, the share of subject imports from China increasedby 4.8 percentage points from 2006 to 2008, on the basis of quantity, and increased by 0.1 percentagepoints in interim 2009 compared to interim 2008. The share of subject imports from Mexico increased by 1.2 percentage points from 2006 to 2008, then increased by 0.2 percentage points in interim 2009compared to interim 2008. Nonsubject imports’ market share decreased by 0.5 percentage points from2006 to 2008, and again in interim 2009 compared with interim 2008.
Table IV-8SRC pipe and tube: U.S. consumption and market shares, 2006-08, January-June 2008, andJanuary-June 2009
Item
Calendar year January-June
2006 2007 2008 2008 2009
Quantity (1,000 pounds)
Apparent U.S. consumption 1,134,532 1,000,438 867,776 485,415 370,226
Value (1,000 dollars)
Apparent U.S. consumption $4,223,796 $4,039,017 $3,628,503 $2,097,736 $965,269
Share of quantity (percent)
U.S. producers’ U.S. shipments 77.0 76.0 71.5 71.8 72.0
U.S. imports from--
China 8.0 9.1 12.8 13.3 13.3
Mexico 7.0 7.5 8.2 8.3 8.5
Subtotal 15.1 16.6 21.0 21.5 21.8
Nonsubject countries 7.9 7.4 7.4 6.7 6.2
All countries 23.0 24.0 28.5 28.2 28.0
Share of value (percent)
U.S. producers’ U.S. shipments 78.6 77.1 72.5 73.4 74.3
U.S. imports from--
China 7.3 8.6 12.3 12.4 11.5
Mexico 6.6 7.0 7.8 7.7 8.2
Subtotal 14.0 15.7 20.1 20.1 19.7
Nonsubject countries 7.4 7.2 7.4 6.5 5.9
All countries 21.4 22.9 27.5 26.6 25.7
Note.–Because of rounding, figures may not add to the totals shown.
Source: Compiled from official Commerce statistics.
IV-14
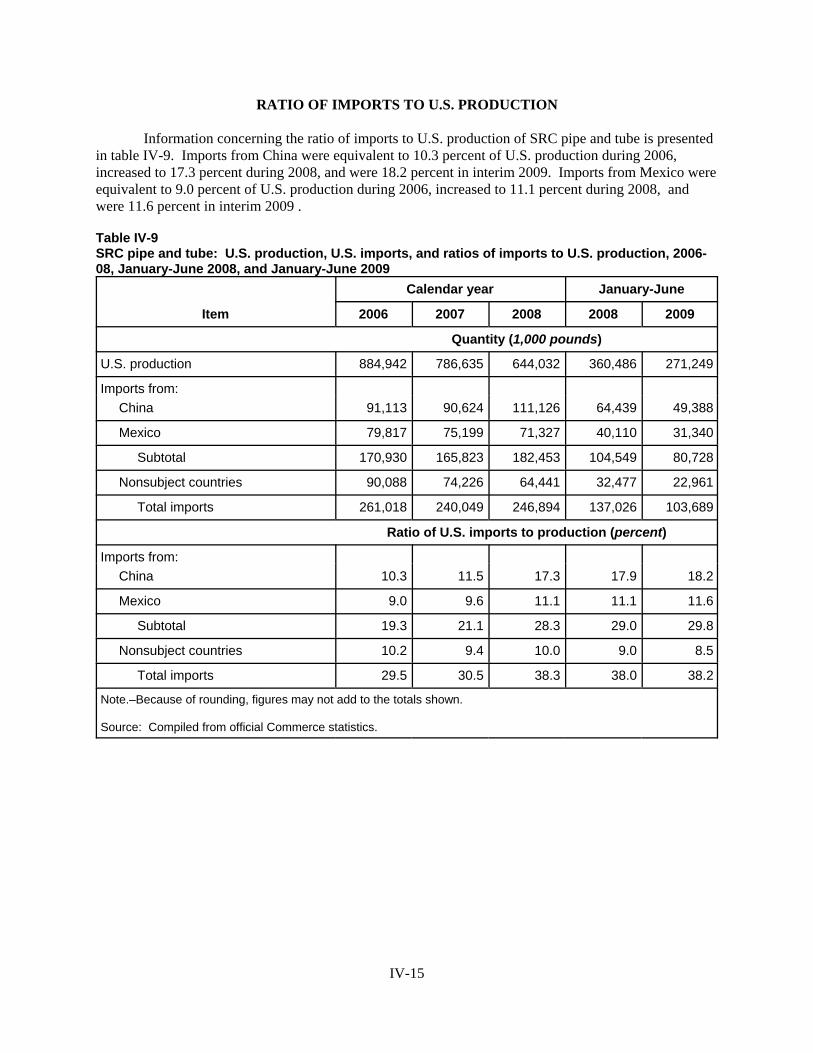
RATIO OF IMPORTS TO U.S. PRODUCTION
Information concerning the ratio of imports to U.S. production of SRC pipe and tube is presentedin table IV-9. Imports from China were equivalent to 10.3 percent of U.S. production during 2006,increased to 17.3 percent during 2008, and were 18.2 percent in interim 2009. Imports from Mexico wereequivalent to 9.0 percent of U.S. production during 2006, increased to 11.1 percent during 2008, andwere 11.6 percent in interim 2009 .
Table IV-9SRC pipe and tube: U.S. production, U.S. imports, and ratios of imports to U.S. production, 2006-08, January-June 2008, and January-June 2009
Item
Calendar year January-June
2006 2007 2008 2008 2009
Quantity (1,000 pounds)
U.S. production 884,942 786,635 644,032 360,486 271,249
Imports from:
China 91,113 90,624 111,126 64,439 49,388
Mexico 79,817 75,199 71,327 40,110 31,340
Subtotal 170,930 165,823 182,453 104,549 80,728
Nonsubject countries 90,088 74,226 64,441 32,477 22,961
Total imports 261,018 240,049 246,894 137,026 103,689
Ratio of U.S. imports to production (percent)
Imports from:
China 10.3 11.5 17.3 17.9 18.2
Mexico 9.0 9.6 11.1 11.1 11.6
Subtotal 19.3 21.1 28.3 29.0 29.8
Nonsubject countries 10.2 9.4 10.0 9.0 8.5
Total imports 29.5 30.5 38.3 38.0 38.2
Note.–Because of rounding, figures may not add to the totals shown.
Source: Compiled from official Commerce statistics.
IV-15


1 Petition, p. 38. 2 Petition, p. 39.
V-1
PART V: PRICING AND RELATED INFORMATION
FACTORS AFFECTING PRICES
Raw Material Costs
Raw material costs accounted for approximately 85 percent of the total cost of goods sold forU.S. producers during 2006 to 2008. Per-unit raw material costs increased by 17 percent between 2006and 2008 from $2.85 per pound in 2006 to $3.33 per pound in 2008. Copper is the main raw materialused to produce SRC pipe and tube. The COMEX price of copper has fluctuated since 2006 ranging from$1.39 per pound to $3.94 per pound (see figure V-1).
U.S. Inland Transportation Costs
Transportation costs for U.S. inland shipments of SRC pipe and tube generally account for asmall-to-moderate share of the delivered price of these products. U.S. producers reported that the costsranged up to 3 percent of the delivered price for SRC pipe and tube, while most U.S. importers reportedthat the costs ranged from 1 to 3.5 percent of the delivered price for SRC pipe and tube.
PRICING PRACTICES
Pricing Methods
Pricing methods for sales of SRC pipe and tube to the plumbing and industrial markets differ. Petitioners indicate that plumbing tube products are typically sold on a spot basis using a price list and amultiplier that applies equally to all list prices on a given price sheet. They note that a supplier may bidfor a total volume without knowing which products from its price list the customer will decide to take.1 Petitioners indicated that SRC pipe and tube sold to industrial end-users is typically sold using annualcontracts with prices quoted on the basis of the COMEX copper price, plus a per-pound fabricationcharge. They note that under these annual contracts SRC pipe and tube producers generally competebased on the quoted fabrication charge with the understanding that the COMEX price will adjustdepending upon the date(s) of shipment.2
All producers reported using transaction-by-transaction negotiations for some of their sales ofSRC pipe and tube, with five of eleven producers also reporting using a price list and four producers alsoreporting using contracts. Twenty-four of 34 responding importers reported that the prices they chargefor at least some of their sales are determined using transaction-by-transaction negotiations. Thirteenimporters reported using contracts and eight importers reported using price lists for at least some of theirsales. Five of 11 responding producers and 17 of 28 responding importers reported making their sales ona delivered basis only. Five producers and eight importers reported making their sales on an f.o.b. basisonly and the remaining responding producers and importers reported making their sales on both f.o.b. anddelivered bases. Six of 12 responding producers and 16 of 30 importers reported that at least 90 percentof their sales of SRC pipe and tube are made to order. Three of 12 responding producers and 11 of 30importers reported that at least 90 percent of their sales are from inventory.
Seven of 11 responding producers and 12 of 25 responding importers reported making at least 99percent of their sales on a spot basis and two producers and three importers reported making at least 65percent of their sales on a spot basis. Five importers reported making at least 90 percent of their sales on

V-2
Figure V-1SRC pipe and tube: Monthly average COMEX high-grade copper, first position prices, by month,January 2006-September 2009
Source: Platt’s Metal Week and USGS.
a short term contract basis, which typically run from 4 months to a year. Two importers (*** reportedmaking at least 60 percent of their sales on a long-term contact basis, although *** defined long-termcontacts as “one year and longer” in length. One producer, (***) reported making 45 percent of its saleson a short-term contract basis, 35 percent of its sales on a spot basis, and 20 percent of its sales on a long-term (two to three years) contract basis. *** reported making 60 percent of its sales on a short-termcontract basis and 35 percent of its sales on a long-term (two years) contract basis.
Lead Times
U.S. producers reported lead times from inventory of up to two weeks and lead times for sales ofproduct-to-order of two to six weeks. Lead times for delivery for all but two responding U.S. importersranged up to two weeks on sales from inventory and most importers reported lead times on sales ofproduct produced-to-order ranging from 2 to 16 weeks. Seven of 10 responding producers and 25 of 32responding importers reported that they generally arrange for the transportation to their customers’locations. Eight of 11 responding U.S. producers and seven of 29 responding importers reported makingat least 60 percent of their sales within 101 to 1,000 miles of their storage or production facilities. Sevenresponding importers reported making at least 79 percent of their sales over 1,000 miles from theirstorage or production facilities and 10 responding importers reported making at least 60 percent of theirsales within 1,000 miles of their storage or production facilities.
Sales Terms and Discounts
Eight producers and 11 importers reported the use of quantity discounts, five producers and threeimporters reported using annual volume discounts, and two producers and 16 importers reported havingno discount policy.

V-3
PRICE DATA
The Commission requested U.S. producers and importers of SRC pipe and tube to providequarterly data for the total quantity and f.o.b. value of SRC pipe and tube that was shipped to unrelatedcustomers in the U.S. market during January 2006-June 2009. The products for which pricing data wererequested are as follows:
Product 1.– Seamless refined copper pipe and tube, ½" Type L, hard temper, 20' lengths
Product 2.– Seamless refined copper pipe and tube, 3/8" OD, ACR/RST coil, 50'-100' lengths
Product 3.– Seamless refined copper pipe and tube, 3/8" OD, inner-grooved LWC, 0.0115"-0.0180" bottom wall thickness
Product 4.– Seamless refined copper pipe and tube, 3/8" OD, smooth bore LWC, 0.0115"-0.0180" bottom wall thickness
Eight U.S. producers, 15 importers of SRC pipe and tube from China, and four importers of SRCpipe and tube from Mexico provided usable pricing data for sales of the requested products, although notall firms reported pricing for all products for all quarters. Pricing data reported by these firms accountedfor approximately 9 percent of U.S. producers’ shipments of SRC pipe and tube, 82 percent of U.S.shipments of subject imports from China, and 7 percent of U.S. shipments of subject imports fromMexico in 2008.
Price Trends
Price data are shown in tables V-1 to V-4 and figure V-2. Nonsubject price data are presented inappendix E. Price trend summary data are presented in table V-5. Weighted-average sales prices forU.S.-produced products 1, 2, and 4 declined by 1.8 to 15.2 percent, while prices of product 3 increased13.9 percent. Weighted average sales prices of products 1, 3, and 4 imported from China decreased by 0.8 to 44.7 percent and prices of product 2 increased by 23.2 percent. Weighted average sales prices ofproducts 1 and 2 imported from Mexico decreased by 6.0 and 15.3 percent respectively and prices ofproduct 3 and 4 increased by 10.5 and 15.1 percent.

V-4
Table V-1SRC pipe and tube: Weighted-average f.o.b. prices and quantities of domestic and importedproduct 11 and margins of underselling/(overselling), by quarters, January 2006-June 2009
Period
United States China Mexico
Price (per
pound)Quantity(pounds)
Price (per
pound)Quantity(pounds)
Margin(percent)
Price (per
pound)Quantity(pounds)
Margin(percent)
2006: Jan.-Mar. $2.74 7,394,358 $*** *** *** $*** *** ***
Apr.-June 4.13 8,226,689 -- 0 -- *** *** ***
July-Sept. 4.83 3,277,929 *** *** *** *** *** ***
Oct.-Dec. 3.77 3,914,621 *** *** *** *** *** ***
2007: Jan.-Mar. 3.31 5,860,450 -- 0 -- *** *** ***
Apr.-June 4.26 6,360,921 *** *** *** *** *** ***
July-Sept. 4.36 3,476,189 *** *** *** *** *** ***
Oct.-Dec. 4.05 4,402,591 *** *** *** *** *** ***
2008: Jan.-Mar. 4.29 5,635,891 *** *** *** *** *** ***
Apr.-June 4.44 3,947,024 *** *** *** *** *** ***
July-Sept. 4.10 4,066,436 *** *** *** *** *** ***
Oct.-Dec. 2.87 3,422,527 -- 0 -- *** *** ***
2009: Jan.-Mar. 2.21 3,761,046 *** *** *** *** *** ***
Apr.-June 2.53 3,899,545 *** *** *** *** *** ***
1 Product 1: Seamless refined copper pipe and tube, ½" Type L, hard temper, 20' lengths.
Source: Compiled from data submitted in response to Commission questionnaires.

V-5
Table V-2SRC pipe and tube: Weighted-average f.o.b. prices and quantities of domestic and importedproducts 21 and margins of underselling/(overselling), by quarters, January 2006-June 2009
Period
United States China Mexico
Price (per
pound)Quantity(pounds)
Price (per
pound)Quantity(pounds)
Margin(percent)
Price (per
pound)Quantity(pounds)
Margin(percent)
2006: Jan.-Mar. $3.23 3,495,395 $*** *** *** $*** *** ***
Apr.-June 5.03 3,849,574 *** *** *** *** *** ***
July-Sept. 5.56 2,380,202 *** *** *** *** *** ***
Oct.-Dec. 4.41 1,773,052 *** *** *** *** *** ***
2007: Jan.-Mar. 3.52 2,704,227 *** *** *** *** *** ***
Apr.-June 4.61 3,603,277 *** *** *** *** *** ***
July-Sept. 4.60 2,399,608 *** *** *** *** *** ***
Oct.-Dec. 4.38 2,146,543 *** *** *** *** *** ***
2008: Jan.-Mar. 4.32 2,377,640 *** *** *** *** *** ***
Apr.-June 4.79 2,523,517 *** *** *** *** *** ***
July-Sept. 4.25 2,272,923 *** *** *** *** *** ***
Oct.-Dec. 3.41 1,511,707 *** *** *** *** *** ***
2009: Jan.-Mar. 2.48 1,735,800 *** *** *** *** *** ***
Apr.-June 2.74 1,720,584 *** *** *** *** *** ***
1 Product 2: Seamless refined copper pipe and tube, 3/8" OD, ACR/RST coil, 50'-100' lengths. Source: Compiled from data submitted in response to Commission questionnaires.
Table V-3SRC pipe and tube: Weighted-average f.o.b. prices and quantities of domestic and importedproducts 31 and margins of underselling/(overselling), by quarters, January 2006-June 2009
* * * * * * *
Table V-4SRC pipe and tube: Weighted-average f.o.b. prices and quantities of domestic and importedproducts 41 and margins of underselling/(overselling), by quarters, January 2006-June 2009
* * * * * * *
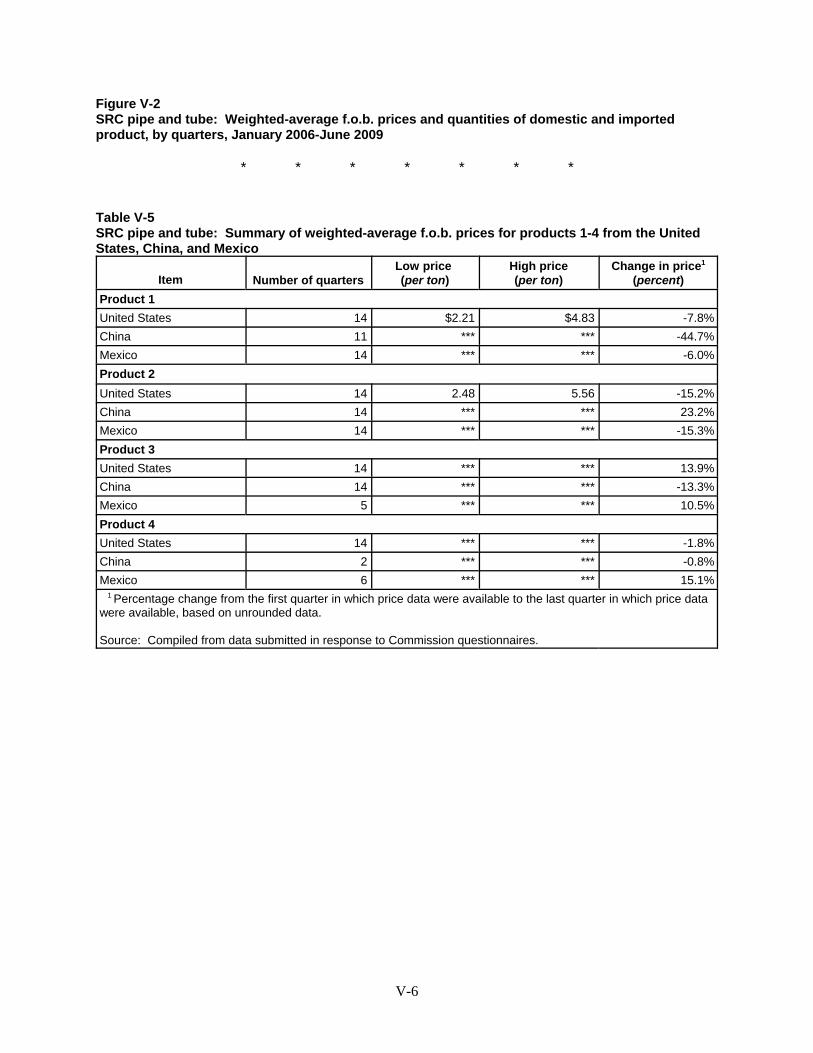
V-6
Figure V-2SRC pipe and tube: Weighted-average f.o.b. prices and quantities of domestic and importedproduct, by quarters, January 2006-June 2009
* * * * * * *
Table V-5SRC pipe and tube: Summary of weighted-average f.o.b. prices for products 1-4 from the UnitedStates, China, and Mexico
Item Number of quartersLow price (per ton)
High price(per ton)
Change in price1
(percent)Product 1 United States 14 $2.21 $4.83 -7.8%China 11 *** *** -44.7%Mexico 14 *** *** -6.0%Product 2 United States 14 2.48 5.56 -15.2%China 14 *** *** 23.2%Mexico 14 *** *** -15.3%Product 3 United States 14 *** *** 13.9%China 14 *** *** -13.3%Mexico 5 *** *** 10.5%Product 4 United States 14 *** *** -1.8%China 2 *** *** -0.8%Mexico 6 *** *** 15.1% 1 Percentage change from the first quarter in which price data were available to the last quarter in which price datawere available, based on unrounded data.
Source: Compiled from data submitted in response to Commission questionnaires.

3 ***.Petitioners indicated that ***.
V-7
Price Comparisons
Margins of underselling and overselling for the period are presented in table V-6. As can beseen from the table, prices for SRC pipe and tube imported from China were below those for U.S.-produced SRC pipe and tube in 25 of 41 instances; margins of underselling ranged from 1.5 to 35.2 percent. In the remaining 16 instances, prices for SRC pipe and tube imported from China were abovethose for U.S.-produced SRC pipe and tube; margins of overselling ranged from 1.2 to 38.1 percent.Prices for SRC pipe and tube imported from Mexico were below those for U.S.-produced SRC pipe andtube in 31 of 39 instances; margins of underselling ranged from 0.3 to 46.0 percent. In the remainingeight instances, prices for SRC pipe and tube imported from Mexico were above those for U.S.-producedSRC pipe and tube; margins of overselling ranged from 1.2 to 42.2 percent. 3
Table V-6SRC pipe and tube: Instances of underselling/overselling and the range and average of margins,January 2006-June 2009
Source
Underselling Overselling
Number ofinstances
Range(percent)
Averagemargin
(percent)Number ofinstances
Range(percent)
Averagemargin
(percent)
China 25 1.5 to 35.2 11.4 16 1.2 to 38.1 13.1
Mexico 31 0.3 to 46.0 8.7 8 1.2 to 42.2 14.7
Total 56 0.3 to 46.0 9.9 24 1.2 to 42.2 13.6
Source: Compiled from data submitted in response to Commission questionnaires.
LOST SALES AND LOST REVENUES
The Commission requested U.S. producers of SRC pipe and tube to report any instances of lostsales or revenues they experienced due to competition from imports of SRC pipe and tube from Chinaand/or Mexico since January 2006. Petitioners provided both allegations of lost sales and revenues in thepetition. Of the seven responding non-petitioning U.S. producers, two reported that they had to eitherreduce prices or roll back announced price increases and two producers indicated that they had lost salesof SRC pipe and tube to imports from China and Mexico. One of these producers provided additional lostsales allegations. The 38 lost sales allegations made by producers totaled $155 million and involved 44million pounds of SRC pipe and tube and the 15 lost revenues allegations totaled $1 million and involved17 million pounds of SRC pipe and tube. Staff contacted 38 purchasers, and a summary of theinformation obtained follows (tables V-7 and V-8).
Twelve of 18 responding purchasers named in lost sales and lost revenue allegations indicatedthat they switched purchases of SRC pipe and tube from U.S. producers to suppliers of SRC pipe and tubefrom China and Mexico since January 2006. Five of these 12 purchasers indicated that price was thereason for the shift. Of the seven purchasers that indicated that price was not the reason for the shift,three purchasers (***) indicated that domestic producers were not able to supply enough product, onepurchaser (***) indicated that both

V-8
Table V-7SRC pipe and tube: U.S. producers’ lost sales allegations
* * * * * * *
Table V-8SRC pipe and tube: U.S. producers’ lost revenue allegations
* * * * * * *
availability and pricing were reasons for the switch, one purchaser (***) indicated that their “switch wascaused by a better incentive from our buying group,” one purchaser (***) noted a quality, service, andlead-time reduction, and one purchaser (***) noted product quality and performance. Four of 12responding purchasers (***) named in lost sales and lost revenue allegations indicated that U.S. producersreduced their prices of SRC pipe and tube in order to compete with prices of SRC pipe and tube fromChina or Mexico since January 2006. Three purchasers indicated that they were not certain if U.S.producers lowered their prices during this time period to compete with price of SRC pipe and tube fromChina or Mexico.
*** disagreed with the *** lost sales allegations made against his company. *** indicated thatthe accepted quote for the imported product was not lower than the rejected quote for U.S. product. Heindicated that the metal price was not a factor and that fabrication costs and duties above base metal costswere higher than the costs of U.S. product. *** also indicated that the U.S. supplier which had been hiscompany’s ***. Prior to ***, he indicated that his company was satisfied with its U.S. vendor. ***indicated that while his firm had switched purchases of SRC pipe and tube from U.S. producers tosuppliers of SRC pipe and tube from China or Mexico since January 2006, price was not the reason forthe shift. He indicated that his U.S. supplier was not able to supply material and forced it to find a secondsupplier, and that now his company is committed to maintain at least two suppliers. He also noted that tothe best of his recollection, U.S. producers did not reduce their prices of SRC pipe and tube to competewith prices of SRC pipe and tube from China or Mexico.
*** of *** agreed with the lost sales allegation made by ***. He indicated that the acceptedquote for imported product was $***/lb (same as the domestic quoted price) for the metal and $*** forfabrication and freight for a total value of $***. *** indicated that *** uses both domestic and importedcopper tube. He noted that ***’s SRC pipe and tube is highly engineered to *** and to date onlydomestic producer *** and a Chinese supplier have qualified to provide the raw copper tube that meettheir quality specifications and tolerances. *** indicated that qualified SRC pipe and tube must meetspecifications regarding ***. He notes that *** attempted to qualify one additional source from the U.S.,but the supplier was unable to provide a qualifying product. *** claimed that while his firm had switchedpurchases of SRC pipe and tube from U.S. producers to suppliers of SRC pipe and tube from China andMexico since January 2006 and that price was a reason, it was not the only reason for the shift. Heindicated that the industry has been particularly hard hit in the economic downturn because of the strongcorrelation between plumbing product demand and the strength or weakness of the housing market. ***indicated that sales of ***’s product are down for 2009 and that it accepted the U.S. producer’s quote, butordered less volume than the *** lbs. offered. He also noted that historically ***’s purchases of SRCpipe and tube shifts between qualified suppliers based both on price and quality offered. *** alsoindicated that while U.S. producers reduced their prices in order to compete with prices of SRC pipe andtube from China or Mexico, that there have only been limited reductions since 2006 and no reductions in2008 or 2009.
*** disagreed with the lost sales allegation made by ***. *** indicated that his company wasplanning on purchasing this order from *** and then selling to a customer, but the purchase was not madesince the customer decided not to purchase the product, although his firm did however secure an order for
4 Staff telephone interview with ***, October 16, 2009.
V-9
this job (with different quantities) at a later date.4 He indicates that the customer said he was going towait on the market and buy as needed in hope for better pricing. *** indicated that he had no idea whathis competition’s price was to customer and that his firm purchased the majority of its copper pipe from***.
*** of *** disagreed with the lost sales allegation made by ***. *** indicated that the materialpurchased from their supplier was the same whether *** firm used domestic or foreign copper. While*** indicated that *** firm switched purchases of SRC pipe and tube from U.S. producers to suppliers ofSRC pipe and tube from China or Mexico, *** noted that, in January 2008 her firm switched to materialfrom China because the U.S. supplier did not have adequate capacity to cover their needs. *** alsoindicated that since January 2006, U.S. producers did not reduce their prices in order to compete withprices of SRC pipe and tube from China or Mexico.
*** of *** disagreed with the lost sales allegation made by ***. He indicated that the supplier*** told him they could not keep up with their demand. *** noted that he pays $***/lb. plus duties forimported copper tube and that the U.S. supplier *** indicated that they would not be able to supply hisfirm’s needs. In regard to all of his purchases since January 2006, he indicated that while his firmswitched purchases of SRC pipe and tube from U.S. producers to suppliers of SRC pipe and tube fromChina or Mexico, price was not the reason for the switch; rather the U.S. supplier *** could not supplyhis firm’s requirements. *** also indicated that since January 2006 U.S. producers had raised their pricesof SRC pipe and tube.
*** of *** agreed with the lost revenue allegation by ***. He indicated that since January 2006his firm has not switched purchases of SRC pipe and tube from U.S. producers to suppliers of SRC pipeand tube from China or Mexico, but that U.S. producers have reduced their prices of SRC pipe and tubein order to compete with prices of SRC pipe and tube imported from China or Mexico and that “it is stillgoing on.”
*** of *** agreed with the lost sales allegation made by ***. He indicated that the allegationincluded product provided under two jobs. *** indicated that the *** went to Mexico and the *** wentto China. He indicated that since January 2006, his firm switched purchases of SRC pipe and tube fromU.S. producers to suppliers of SRC pipe and tube from China or Mexico and that price was the reason forthe switch. *** also reported that U.S. producers reduced their prices of SRC pipe and tube in order tocompete with prices of SRC pipe and tube imported from China or Mexico. *** indicated that in severalcases, the cost of the imported “finished product” was less than the raw material cost based on theCOMEX price at the time of the closing bid. *** of *** disagreed with the lost sales allegation made by ***. He indicated that he is familiarwith the quote from *** and indicates that his firm sent out the inquiry in line with the contract they hadin place. *** noted that the number of short tons in the quote would represent about *** percent of ***total requirements so “capacity constraints are obvious.” While agreeing with the rejected quote numbers,he indicated that his firm did not pay the amount provided and that the amount noted in the “acceptedquote” was not possible given the market price of metal at that time. *** indicated that *** was their solesupplier for several years prior to being replaced by U.S. producer *** due to major quality problems andthat his firm incurred major production disruptions in 2004 due to lack of capacity in the U.S. market. *** indicated that his company went on the open market and purchased some material in 2004 from ***as well as from other U.S. and foreign suppliers due to capacity constraints in the United States). Heclaimed that the material his firm purchased from *** exhibited many of the same quality problems aswhen they were the primary supplier to ***. He noted that his firm moved away from ***. *** claimsthat ***, as well as all but one U.S. manufacturer of copper tube, does not have the ability to produce***. He also indicated that since January 2006 his firm has not switched purchases of SRC pipe and tubefrom U.S. producers to suppliers of SRC pipe and tube from China or Mexico. *** also noted that hecannot speak as to whether U.S. producers reduced their prices of SRC pipe and tube in order to compete
5 Email from ***, November 6, 2009. 6 Email from ***, October 13, 2009.
V-10
with prices of SRC pipe and tube imported from China or Mexico since he has been under contract since2005.
*** of *** disagreed with the lost revenue allegation made by ***. He indicated that ***rejected the U.S. producer’s quote for all 112 items in the proposal due to their attempt to change thehistorical method of calculating the copper cathode premium charge. Mr. Burlew indicated that when thequote was revised to use the ***, only the price of the first item (which was for ***) was adjusteddownward and that *** accepted this quotation with no other reductions. He also noted that the first itemwas awarded *** due to continued quality problems and tube weight issues and that *** material whichthey did not have with the material from the Chinese supplier. While *** indicated that since January2006 his firm switched purchases of SRC pipe and tube from U.S. producers to suppliers of SRC pipe andtube from China or Mexico, he indicated that his firm switched to imported material because of quality,service, and reduced lead times since the Chinese suppliers have U.S. representatives who warehousefinished goods for his firm. He also noted that he is not certain why *** lowered their price on the oneitem mentioned, but believes it was related to improvements in efficiencies as a result of production ***.
*** of *** agrees with the lost sales allegation made by ***. He indicated that since January2006 his firm switched purchases of SRC pipe and tube from U.S. producers to suppliers of SRC pipe andtube from China or Mexico and that price was the reason for the switch. *** also indicated that U.S.producers reduced their prices of SRC pipe and tube in order to compete with prices of SRC pipe and tubeimported from China or Mexico.
*** of *** in indicated that in 2007 (the allegation was in March 2007) *** company onlyobtained the product described in the allegation from domestic sources of supply. *** indicated that sinceJanuary 2006 *** firm had switched purchases of SRC pipe and tube from U.S. producers to suppliers ofSRC pipe and tube from China or Mexico, but that any sourcing decisions were driven by product qualityand performance and not pricing. *** reported that U.S. producers have not reduced their prices of SRCpipe and tube in order to compete with prices of SRC pipe and tube from China or Mexico and that anychanges in U.S. producer pricing that may have occurred were of no influence to ***’s sourcingdecisions. *** indicated that during August 2007, *** switched from purchasing from U.S. producer ***to Chinese producer ***. *** indicated that until 2009, ***.5
*** of *** agreed with the lost revenue allegations made by ***. *** indicated that ***. Henoted that the manufacturer had to lower its price to his firm because its wholesale customers would havepurchased imported product if it could not meet competitive conditions.6 He indicated that since January2006 his firm has not switched purchases of SRC pipe and tube from U.S. producers to suppliers of SRCpipe and tube from China or Mexico, but that U.S. producers reduced their prices of SRC pipe and tube inorder to compete with prices of SRC pipe and tube imported from China or Mexico.
In response to the lost revenue allegation made by ***, *** of *** indicated that his companydoes not purchase or have sources to purchase imported copper tube from. He stated that his purchasesfor *** were from domestic producers. *** indicated that he paid 5 percent more than the *** multipliernet stated as the rejected quote for the U.S. product and that the U.S. producer did not lower its price. Heresponded that since January 2006, his firm has not switched purchases of SRC pipe and tube from U.S.producers to suppliers of SRC pipe and tube from China or Mexico. *** added that although it ispossible, he is not certain whether U.S. producers reduced their prices of SRC pipe and tube in order tocompete with prices of SRC pipe and tube imported from China or Mexico.
*** of *** disagreed with the lost sale allegation made by ***. He indicated that this supplierwas the highest bidder of all, including two other U.S. sources who would have gotten an order beforethis supplier with the pricing referenced here. *** noted that the two items in the allegation had beenpurchased from *** for over 10 years and when that source ***, the Mexican source agreed to continuethe supply at the same price. He indicated that the U.S. source referenced above was quoted in September

V-11
2009, and it was told that it was not competitive although there are other U.S. suppliers with pricing thatis competitive with Mexico and China. While *** indicated that since January 2006, his firm did switchpurchases of SRC pipe and tube from U.S. producers to suppliers of SRC pipe and tube from China orMexico, he indicated that this switch was due to the availability of certain alloys in addition to pricing. *** also indicated that since January 2006, U.S. producers have not raised their prices of SRC pipe andtube.
*** of *** agreed with the lost sales allegation made by ***. He indicated that his firm didswitch purchases of SRC pipe and tube from U.S. producers to suppliers of SRC pipe and tube fromChina or Mexico and that price was the reason for the switch. *** also indicated that U.S. producersreduced their prices of SRC pipe and tube in order to compete with prices of SRC pipe and tube importedfrom China or Mexico.
*** of *** disagreed with the two lost sales allegations and one lost revenue allegation made by*** but agreed with one lost sales allegation made by ***. *** indicated that the *** pound allegationmade by *** was awarded to a domestic supplier. He noted that the *** pound allegation was anunsolicited quote and that business for this product was already contractually committed for 2009. ***indicated that the lost revenue allegation was a quote from a U.S. producer for a price increase, and due toa sharp decrease in sales, *** was not accepting price increases. With regard to the lost sales allegationthat he agreed with, he noted that *** awarded this requirement to a Chinese producer, as well as adomestic producer, both of which quoted a lower price than this quote. He indicated that his firmswitched purchases of SRC pipe and tube from U.S. producers to suppliers of SRC pipe and tube fromChina or Mexico and that price was the reason for the switch. *** noted that *** still purchasessignificant quantities from U.S. producers but that it is important to have multiple supply sources. Healso indicated that the HVAC industry has suffered a sharp decrease in sales, and that a reduction inprices could be the result of lower demand generally, and increased competition from domestic andforeign producers.
The representative for *** did not respond to the specific lost sales allegation. However, he didindicate that since January 2006, the firm switched purchases of SRC pipe and tube from U.S. producersto suppliers of SRC pipe and tube from China or Mexico and that price was the reason for the switch. Healso reported that U.S. producers did not reduce their prices of SRC pipe and tube in order to competewith prices of SRC pipe and tube imported from China or Mexico.
*** of *** agreed with the lost sales allegation made by ***. He indicated that the fabricationcost of the imported quote was $***/lb., plus a $***/lb. premium. *** also indicated that sales were lostto imports from both China and Mexico (only Mexico was named in the allegation). He indicated thatsince January 2006, his firm switched purchases of SRC pipe and tube from U.S. producers to suppliersof SRC pipe and tube from China or Mexico and that price was the reason for the switch. However, ***stated that U.S. producers had not reduced their prices of SRC pipe and tube in order to compete withprices of SRC pipe and tube imported from China or Mexico.
*** of *** did not specifically agree or disagree with the lost revenue allegation made by ***. *** indicated that his company places a premium on the use of domestic material and doesn’t activelysolicit information on imported copper. He responded that since January 2006, his firm has not switchedpurchases of SRC pipe and tube from U.S. producers to suppliers of SRC pipe and tube from China orMexico and that U.S. producers had not reduced their prices of SRC pipe and tube in order to competewith prices of SRC pipe and tube imported from China or Mexico.
*** of *** disagreed with the lost sales allegation made by ***. He indicated that he did notrecall the quote. *** reported that since January 2006, his firm switched purchases of SRC pipe and tubefrom U.S. producers to suppliers of SRC pipe and tube from China or Mexico, but that price was not thereason for the switch, rather that ***. He also indicated that U.S. producers had not reduced their pricesof SRC pipe and tube in order to compete with prices of SRC pipe and tube imported from China orMexico.

1 The U.S. producers are ***. 2 Full year financial data for all U.S. producers cover fiscal years 2006 to 2008.
VI-1
PART VI: FINANCIAL EXPERIENCE OF THE U.S. PRODUCERS
Introduction
Eleven U.S. firms provided usable financial data on their operations on SRC pipe and tube.1 These data are believed to account for the large majority of U.S. operations on SRC pipe and tube. Nofirms reported internal consumption, and *** reported transfers to related firms. Transfers accounted foronly *** percent of total net sales value in 2008. Accordingly, data for such operations are not presentedseparately in this section of the report. All firms reported a fiscal year end on or near December 31 ***.2
Operations on SRC Pipe and Tube
Income-and-loss data for U.S. firms on their operations on SRC pipe and tube are presented intable VI-1, while selected financial data, by firm, are presented in table VI-2. The domestic industryexperienced a continuous decline in net sales (quantity and value) and operating income from 2006 to2008, as well as between the comparable interim periods. The per-pound net sales value increased from2006 to 2008, then declined in January-June 2009 as compared to January-June 2008. From 2006 to2008, the per-pound cost of goods sold (“COGS”) and selling, general, and administrative (“SG&A”)expenses, combined, increased more than revenue, thus leading to a decline in profits. Between thecomparable interim periods, per-pound revenue decreased more than operating costs and expenses, whichled to a continued decline in profitability in January-June 2009 as compared to January-June 2008. Similarly, COGS as a ratio to net sales modestly increased throughout the period for which data werecollected, which indicates that such costs were increasing at a somewhat greater rate (2006 to 2008) ordecreasing at a somewhat lower rate (January-June 2008 to January-June 2009) as compared to revenue.
Raw material costs are the primary component of total COGS, accounting for 85 percent of totalCOGS during the period for which data were collected. While all components of COGS generallyincreased on a per-pound basis from 2006 to 2008, the most significant increase occurred in raw materialcosts (copper cathode, ingot, and/or scrap), which increased by $0.48, or 17 percent, from 2006 to 2008. Between the comparable interim periods, per-pound raw material costs declined by $1.66, or 46 percent,while direct labor and other factory costs moderately increased. Thus, the overall decline in per-poundCOGS between the comparable interim periods is the result of the decline in raw material costs.

VI-2
Table VI-1SRC pipe and tube: Results of operations of U.S. producers, 2006-08, January-June 2008, and January-June2009
ItemFiscal year January-June
2006 2007 2008 2008 2009Quantity (1,000 pounds)
Total net sales 902,149 778,614 652,123 361,851 278,630Value ($1,000)
Total net sales 3,352,765 3,172,202 2,787,044 1,596,519 748,672COGS 2,984,580 2,876,789 2,549,697 1,480,169 697,925Gross profit 368,185 295,413 237,347 116,350 50,747SG&A expenses 77,987 71,597 65,984 32,260 28,727Operating income 290,198 223,816 171,363 84,090 22,020Interest expense 14,196 12,966 11,920 5,721 2,843Other income/(expense) (5,975) (786) (827) (2,696) (437)Net income 270,027 210,064 158,616 75,673 18,740Depreciation 38,760 37,400 35,885 17,323 18,567Cash flow 308,787 247,464 194,501 92,996 37,307
Ratio to net sales (percent) COGS: Raw materials 76.6 77.8 78.0 80.9 71.1 Direct labor 3.2 3.1 3.3 3.0 5.1 Other factory costs 9.2 9.8 10.2 8.9 17.0 Total COGS 89.0 90.7 91.5 92.7 93.2Gross profit 11.0 9.3 8.5 7.3 6.8SG&A expenses 2.3 2.3 2.4 2.0 3.8Operating income 8.7 7.1 6.1 5.3 2.9Net income 8.1 6.6 5.7 4.7 2.5
Unit value (per pound)Total net sales $3.72 $4.07 $4.27 $4.41 $2.69 COGS: Raw materials 2.85 3.17 3.33 3.57 1.91 Direct labor 0.12 0.13 0.14 0.13 0.14 Other factory costs 0.34 0.40 0.44 0.39 0.46 Total COGS 3.31 3.69 3.91 4.09 2.50Gross profit 0.41 0.38 0.36 0.32 0.18SG&A expenses 0.09 0.09 0.10 0.09 0.10Operating income 0.32 0.29 0.26 0.23 0.08Net income 0.30 0.27 0.24 0.21 0.07
Number of firms reportingOperating losses 1 1 3 1 4Data 10 10 11 11 11Source: Compiled from data submitted in response to Commission questionnaires.

3 The other U.S. producers to report an operating loss during interim 2009 were ***, which reported muchsmaller levels of sales as compared to ***, and reported operating losses ***. In addition, three firms (***) reportedsmall operating losses in 2008. 4 Petitioners’ postconference brief, exh. 14. 5 SG&A expenses represent only 2.6 percent of total operating costs during the period for which data werecollected, and are not a major factor behind the industry’s reported financial performance. 6 At the conference, the petitioners were asked to discuss the level of profitability each firm believes they wouldhave achieved absent the effects of subject imports from China and Mexico, and when they last achieved suchprofitability. In response to this question, the petitioners stated in their postconference brief that, “...***. SinceCerro, KobeWieland and Mueller have each embarked on significant expansion and modernization projects in thelast ten years, each companies’ payback targets were expected to be met at the time of the approvals.” Petitioners’postconference brief, exh. 14. 7 A variance analysis is calculated in three parts; sales variance, cost of sales variance, and SG&A expensevariance. Each part consists of a price variance (in the case of the sales variance) or a cost variance (in the case ofthe cost of sales and SG&A expense variance) and a volume variance. The sales or cost variance is calculated as thechange in unit price times the new volume, while the volume variance is calculated as the change in volume timesthe old unit price. Summarized at the bottom of the table, the price variance is from sales; the cost/expense varianceis the sum of those items from COGS and SG&A variances, respectively; and the volume variance is the sum of thelines under price and cost/expense variance. The net volume component is generally the smallest component.
VI-3
Table VI-2SRC pipe and tube: Results of operations of U.S. producers, by firm, 2006-08, January-June 2008, andJanuary-June 2009
* * * * * * *
While the overall industry, as well as ***, reported a decline in profitability during the period forwhich data were requested, *** in January-June 2009.3 According to petitioners, ***. Further,petitioners’ stated that per-pound selling expenses are lower for sales to OEMs as compared to sales ofstandard products to distributors and retailers.4 5 6
Variance Analysis
A variance analysis is presented in table VI-3. The information for the variance analysis isderived from table VI-1. The analysis shows that the decline in operating income from 2006 to 2008 isprimarily attributable to an unfavorable net cost/expense variance that more than offset a favorable pricevariance (that is, costs and expenses rose more than prices). Between the comparable interim periods, thedecline in operating income is primarily attributable to an unfavorable price variance that more than offseta favorable net cost/expense variance (that is, prices declined more than costs/expenses).7
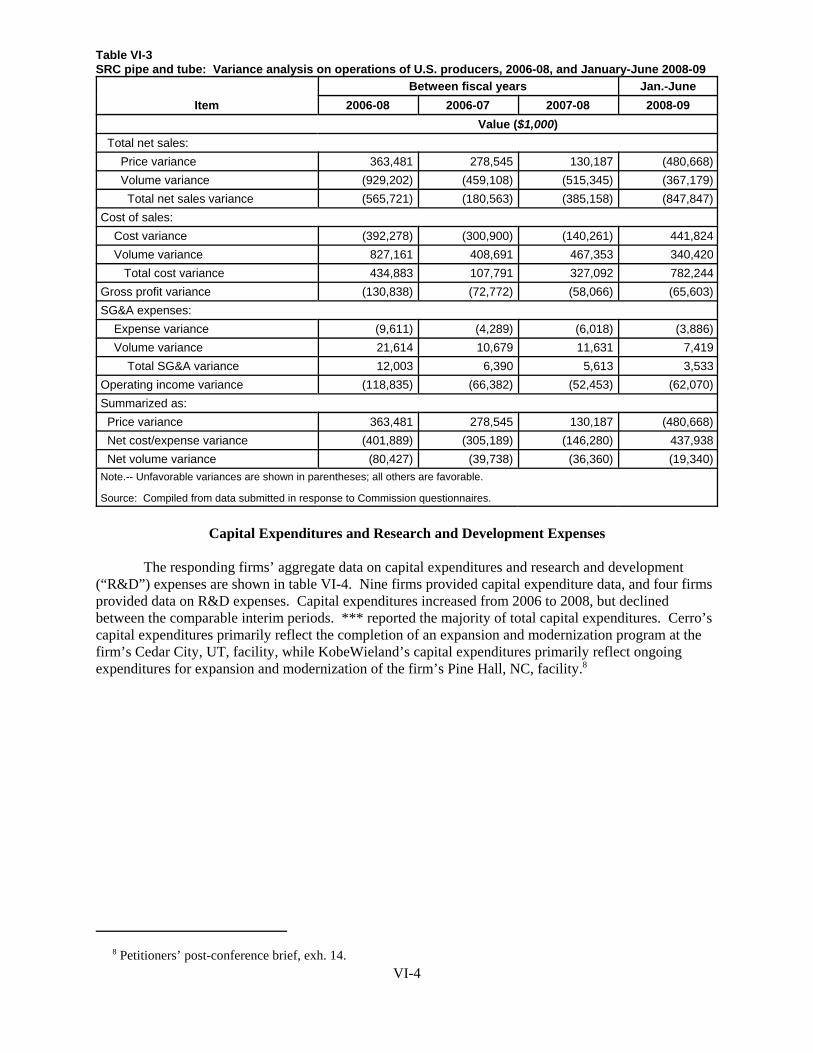
8 Petitioners’ post-conference brief, exh. 14.VI-4
Table VI-3SRC pipe and tube: Variance analysis on operations of U.S. producers, 2006-08, and January-June 2008-09
ItemBetween fiscal years Jan.-June
2006-08 2006-07 2007-08 2008-09Value ($1,000)
Total net sales: Price variance 363,481 278,545 130,187 (480,668) Volume variance (929,202) (459,108) (515,345) (367,179) Total net sales variance (565,721) (180,563) (385,158) (847,847)Cost of sales: Cost variance (392,278) (300,900) (140,261) 441,824 Volume variance 827,161 408,691 467,353 340,420 Total cost variance 434,883 107,791 327,092 782,244Gross profit variance (130,838) (72,772) (58,066) (65,603)SG&A expenses: Expense variance (9,611) (4,289) (6,018) (3,886) Volume variance 21,614 10,679 11,631 7,419 Total SG&A variance 12,003 6,390 5,613 3,533Operating income variance (118,835) (66,382) (52,453) (62,070)Summarized as: Price variance 363,481 278,545 130,187 (480,668) Net cost/expense variance (401,889) (305,189) (146,280) 437,938 Net volume variance (80,427) (39,738) (36,360) (19,340)Note.-- Unfavorable variances are shown in parentheses; all others are favorable.
Source: Compiled from data submitted in response to Commission questionnaires.
Capital Expenditures and Research and Development Expenses
The responding firms’ aggregate data on capital expenditures and research and development(“R&D”) expenses are shown in table VI-4. Nine firms provided capital expenditure data, and four firmsprovided data on R&D expenses. Capital expenditures increased from 2006 to 2008, but declinedbetween the comparable interim periods. *** reported the majority of total capital expenditures. Cerro’scapital expenditures primarily reflect the completion of an expansion and modernization program at thefirm’s Cedar City, UT, facility, while KobeWieland’s capital expenditures primarily reflect ongoingexpenditures for expansion and modernization of the firm’s Pine Hall, NC, facility.8

VI-5
Table VI-4SRC pipe and tube: Capital expenditures and research and development expenses of U.S. producers, 2006-08, January-June 2008, and January-June 2009
ItemFiscal year January-June
2006 2007 2008 2008 2009Value ($1,000)
Capital expenditures: Total 30,744 40,816 *** *** ***R&D expenses: Total 735 1,865 2,137 924 1,115Source: Compiled from data submitted in response to Commission questionnaires.
Assets and Return on Investment
The Commission’s questionnaire requested data on assets used in the production, warehousing,and sale of SRC pipe and tube to compute return on investment (“ROI”). Data on the U.S. producers’total assets and their ROI are presented in table VI-5. From 2006 to 2008, the total assets for SRC pipeand tube decreased from $1.3 billion in 2006 to $992 million in 2008, and the ROI declined from 22.0percent in 2006 to 17.3 percent in 2008.
CAPITAL AND INVESTMENT
The Commission requested U.S. producers of SRC pipe and tube to describe any actual orpotential negative effects of imports of SRC pipe and tube from China and Mexico on their firms’ growth,investment, ability to raise capital, development and production efforts, or the scale of capitalinvestments. Their responses are next.
Actual Negative Effects
* * * * * * *
Anticipated Negative Effects
* * * * * * *

VI-6
Table VI-5SRC pipe and tube: Asset values and return on investment of U.S. producers, 2006-08
ItemFiscal year
2006 2007 2008Value of assets: Value ($1,000)Current assets: Cash and equivalents 78,214 130,337 99,479 Accounts receivable, net 327,419 312,999 221,858 Inventories 435,236 347,095 210,618 Other 58,767 83,148 71,478 Total current assets 899,636 873,579 603,433Property, plant and equipment:Original cost 831,874 771,065 834,629Less: accumulated depreciation 492,067 479,740 526,405Equals: book value 339,807 291,325 308,224Other non-current assets 80,244 79,649 80,326 Total assets 1,319,687 1,244,553 991,983
Operating income or (loss) 290,198 223,816 171,363Share (percent)
Return on investment 22.0 18.0 17.3
Source: Compiled from data submitted in response to Commission questionnaires.
PART VII: THREAT CONSIDERATIONS AND INFORMATION ONNONSUBJECT COUNTRIES
Section 771(7)(F)(i) of the Act (19 U.S.C. § 1677(7)(F)(i)) provides that--
In determining whether an industry in the United States is threatenedwith material injury by reason of imports (or sales for importation) of thesubject merchandise, the Commission shall consider, among otherrelevant economic factors1--
(I) if a countervailable subsidy is involved, such information as may bepresented to it by the administering authority as to the nature of thesubsidy (particularly as to whether the countervailable subsidy is asubsidy described in Article 3 or 6.1 of the Subsidies Agreement), andwhether imports of the subject merchandise are likely to increase,
(II) any existing unused production capacity or imminent, substantialincrease in production capacity in the exporting country indicating thelikelihood of substantially increased imports of the subject merchandiseinto the United States, taking into account the availability of other exportmarkets to absorb any additional exports,
(III) a significant rate of increase of the volume or market penetration ofimports of the subject merchandise indicating the likelihood ofsubstantially increased imports,
(IV) whether imports of the subject merchandise are entering at pricesthat are likely to have a significant depressing or suppressing effect ondomestic prices, and are likely to increase demand for further imports,
(V) inventories of the subject merchandise,
(VI) the potential for product-shifting if production facilities in theforeign country, which can be used to produce the subject merchandise,are currently being used to produce other products,
(VII) in any investigation under this title which involves imports of botha raw agricultural product (within the meaning of paragraph (4)(E)(iv))and any product processed from such raw agricultural product, thelikelihood that there will be increased imports, by reason of productshifting, if there is an affirmative determination by the Commission
1 Section 771(7)(F)(ii) of the Act (19 U.S.C. § 1677(7)(F)(ii)) provides that “The Commission shall consider *** .. . as a whole in making a determination of whether further dumped or subsidized imports are imminent and whethermaterial injury by reason of imports would occur unless an order is issued or a suspension agreement is acceptedunder this title. The presence or absence of any factor which the Commission is required to consider . . . shall notnecessarily give decisive guidance with respect to the determination. Such a determination may not be made on thebasis of mere conjecture or supposition.”
VII-1

under section 705(b)(1) or 735(b)(1) with respect to either the rawagricultural product or the processed agricultural product (but not both),
(VIII) the actual and potential negative effects on the existingdevelopment and production efforts of the domestic industry, includingefforts to develop a derivative or more advanced version of the domesticlike product, and
(IX) any other demonstrable adverse trends that indicate the probabilitythat there is likely to be material injury by reason of imports (or sale forimportation) of the subject merchandise (whether or not it is actuallybeing imported at the time).2
Information on the volume and pricing of imports of the subject merchandise is presented in PartsIV and V; and information on the effects of imports of the subject merchandise on U.S. producers’existing development and production efforts is presented in Part VI. Information on inventories of thesubject merchandise; foreign producers’ operations, including the potential for “product-shifting;” anyother threat indicators, if applicable; and any dumping in third-country markets, follows. Also presentedin this section of the report is information obtained for consideration by the Commission on nonsubjectcountries and the global market.
THE INDUSTRY IN CHINA
The Chinese SRC pipe and tube industry has experienced significant recent expansion in responseto the country’s rapid growth in demand by downstream industry sectors driven by China’s rapid overalleconomic development. However, according to the 2009 U.S. Geological Survey, although Chinesesmelter and refinery capacity has expanded in recent years, its mine and refinery production are insufficient to meet growing domestic consumption needs for refined copper,3 so China is a leading globalimporter of copper in the forms of refined metal and scrap.4
The Commission requested data from the 14 firms that were listed in the petition as producingSRC pipe and tube in China during the period of the investigation. The Commission received a responsefrom 10 firms,5 and data regarding the Chinese industry are based on the 10 foreign producerquestionnaires received. These responses are believed to account for approximately 97.9 percent ofChinese export shipments to the United States in 2008. In addition to the responding Chinese producersof SRC pipe and tube, U.S. importers identified the following producers/exporters as other Chinesesources for their imports of SRC pipe and tube: ***. Chinese respondents estimate the total production of
2 Section 771(7)(F)(iii) of the Act (19 U.S.C. § 1677(7)(F)(iii)) further provides that, in antidumpinginvestigations, “. . . the Commission shall consider whether dumping in the markets of foreign countries (asevidenced by dumping findings or antidumping remedies in other WTO member markets against the same class orkind of merchandise manufactured or exported by the same party as under investigation) suggests a threat of materialinjury to the domestic industry.” 3 Pui Kwan Tse, “The Mineral Industry of China,” 2007 Mineral Yearbook (advanced release), U.S. GeologicalSurvey, February 2009, pp. 9.5 – 9.6. 4 Ibid., pp. 9.3 and 9.23. 5 Producers in China that submitted foreign producer questionnaires were: ***. ***.
VII-2

SRC pipe and tube in China at 1.7 billion in 2008 and the Chinese industry’s capacity utilization is 80percent.6 7
Table VII-1 presents information on the Chinese industry’s SRC pipe and tube operations. Chinese capacity increased 9.8 percent from 2006 to 2008, and decreased 4.1 percent between the interimperiods, and were projected to increase in 2009 and 2010. Chinese production increased in 2007, thendecreased in 2008 for an overall decline of 5.7 percent from 2006 to 2008. Chinese production alsodecreased by 27.8 percent in interim 2009 compared to interim 2008. Chinese capacity utilizationdecreased steadily from 2006 to 2008, then decreased in interim 2009 compared with interim 2008. Chinese producers projected an increase in capacity utilization in 2009 and 2010. The share of Chineseshipments sold to its home market decreased from 61.1 percent to 52.1 percent during 2006 to 2008. Themajority of Chinese producer export shipments was to countries other than the United States.8 Chinesetotal exports as a share of its total shipments increased from 37.0 percent to 45.9 percent during 2006 to2008. ***.
Table VII-2 presents the Chinese producers’ share of their total sales represented by sales of SRCpipe and tube, and the other products produced on the same equipment and machinery used to produceSRC pipe and tube.
6 Hailiang’s postconference brief, p. 26. The China Nonferrous Metals Industry Association reported that in2007, China’s copper tube production capacity (including nonsubject products) was *** pounds and its productionwas *** pounds. Hailiang submission, November 2, 2009, exh. 2. 7 Petitioners reported that in 2009, there were reportedly 18 major SRC pipe and tube producers in China with acombined capacity of approximately 2 billion pounds (operating at 35 percent capacity). Petitioners’ postconferencebrief, p. 4. 8 These other export markets include: ***.
VII-3

Table VII-1SRC pipe and tube: Chinese production capacity, production, shipments, and inventories, 2006-08, January-June 2008, January-June 2009, and projected 2009-10
Item
Actual experience Projections
2006 2007 2008
January-June
2009 20102008 2009
Quantity (1,000 pounds)
Capacity 936,341 990,960 1,028,166 549,838 527,194 838,124 846,722
Production 730,175 740,864 688,328 410,268 296,343 613,548 632,782
End of period inventories 52,710 39,067 20,845 25,693 16,183 15,424 16,480
Shipments Internal consumption/ transfers 13,890 13,709 14,062 7,524 10,368 19,569 23,978
Home market 456,964 439,876 369,469 214,456 135,426 316,224 343,513
Exports to--The United States 82,655 78,710 108,801 70,550 51,558 90,335 65,426
All other markets 193,838 224,491 217,128 131,388 100,954 195,425 205,159
Total exports 276,493 303,201 325,929 201,938 152,512 285,760 270,585
Total shipments 747,347 756,786 709,461 423,919 298,306 621,553 638,076
Ratios and shares (percent)
Capacity utilization 78.0 74.8 66.9 74.6 56.2 73.2 74.7
Inventories to production 7.2 5.3 3.0 3.1 2.7 2.5 2.6
Inventories to total shipments 7.1 5.2 2.9 3.0 2.7 2.5 2.6
Share of total quantity of shipments: Internal consumption/ transfers 1.9 1.8 2.0 1.8 3.5 3.1 3.8
Home market 61.1 58.1 52.1 50.6 45.4 50.9 53.8
Exports to--The United States 11.1 10.4 15.3 16.6 17.3 14.5 10.3
All other markets 25.9 29.7 30.6 31.0 33.8 31.4 32.2
All export markets 37.0 40.1 45.9 47.6 51.1 46.0 42.4
Note – Because of rounding, figures may not add to the totals shown.
Source: Compiled from data submitted in response to Commission questionnaires.
VII-4

Table VII-2SRC pipe and tube: Share of Chinese producers’ total sales, other products produced on thesame equipment and machinery
* * * * * * *
THE INDUSTRY IN MEXICO
The Commission requested data from six firms that were listed in the petition as possibleproducers of SRC pipe and tube in Mexico during the period of the investigation. The Commissionreceived responses from four firms, which accounted for *** percent of Mexican exports during theperiod of investigation.9
Table VII-3 presents information on the Mexican industry’s operations in Mexico.10 Mexicanproducers’ capacity decreased from 2006 to 2007, then increased in 2008, and during January-June 2009and is projected to increase in 2010. Mexican production of SRC pipe and tube decreased by *** percentfrom 2006 to 2008 and decreased by *** percent between the interim periods. Mexican capacityutilization *** percent in 2006 to *** percent in 2008. Capacity utilization in 2009 is projected to be ***percent.
The volume of Mexican producers’ shipments to its home market ranged from *** percent in2008 to *** percent in 2006. The *** of Mexican producers’ exports was exported to the United States,and ranged from *** percent to *** percent of total shipments.11 Table VII-4 presents the Mexicanproducers’ share of their total sales represented by sales of SRC pipe and tube, and the other productsproduced on the same equipment and machinery used to produce SRC pipe and tube.
One Mexican producer, Luvata Monterrey, began production in 2009, ***.12 Another Mexicanproducer, GD Affiliates is adding new capacity (*** pounds) to begin production in 2010. IUSAreported that ***.13 IUSA has commissioned a new plant, Pasteje, to produce commercial SRC pipe andtube.14 Wolverine has a SRC pipe and tube plant in Mexico where copper pipe and tube produced atWolverine’s Shawnee, OK plant is further fabricated.15
Table VII-3SRC pipe and tube: Mexican production capacity, production, shipments, and inventories, 2006-08, January-June 2008, January-June 2009, and projected 2009-10
* * * * * * *
Table VII-4SRC pipe and tube: Share of Mexican producers’ total sales, other products produced on thesame equipment and machinery
* * * * * * *
9 Producers in Mexico that submitted foreign producer questionnaires were: ***. 10 The Mexican SRC pipe and tube industry relies upon both domestic and foreign sources of copper imports. 11 The other export markets are ***. 12 Luvata Monterrey foreign producer questionnaire, p. 5. 13 IUSA foreign producer questionnaire, p. 5. 14 IUSA and Nacional de Cobre’s postconference brief, p. 49. 15 ***.
VII-5
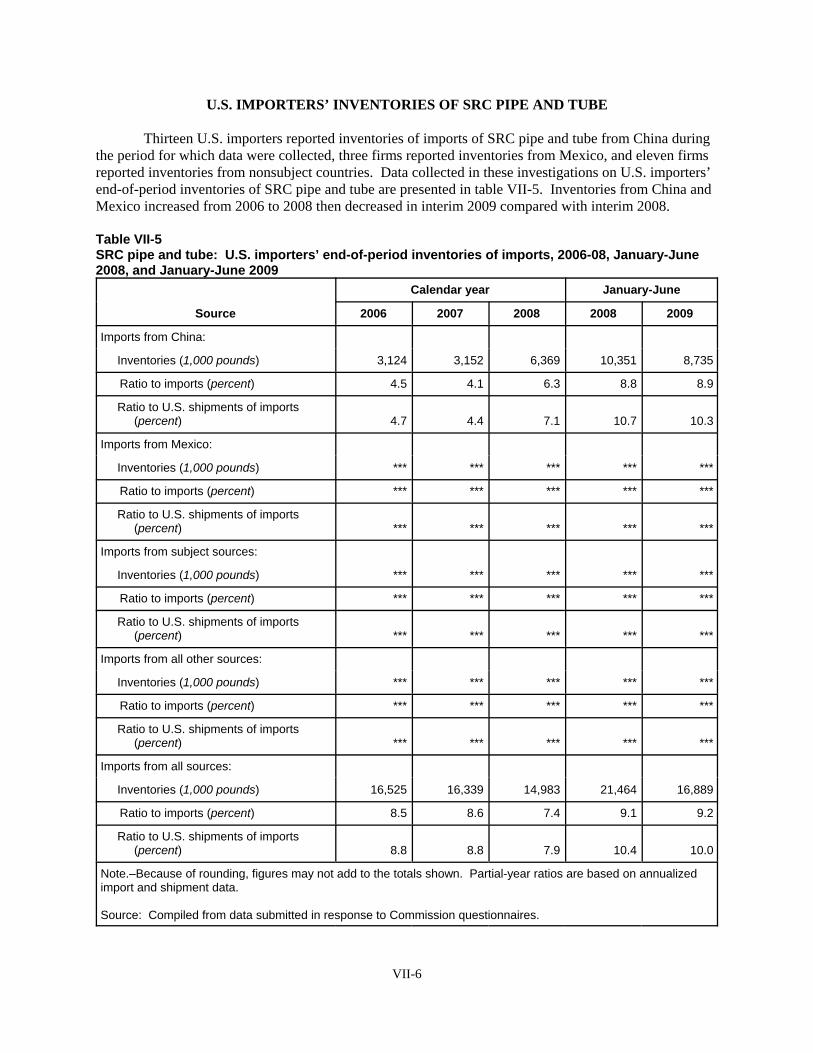
U.S. IMPORTERS’ INVENTORIES OF SRC PIPE AND TUBE
Thirteen U.S. importers reported inventories of imports of SRC pipe and tube from China duringthe period for which data were collected, three firms reported inventories from Mexico, and eleven firmsreported inventories from nonsubject countries. Data collected in these investigations on U.S. importers’end-of-period inventories of SRC pipe and tube are presented in table VII-5. Inventories from China andMexico increased from 2006 to 2008 then decreased in interim 2009 compared with interim 2008.
Table VII-5SRC pipe and tube: U.S. importers’ end-of-period inventories of imports, 2006-08, January-June2008, and January-June 2009
Source
Calendar year January-June
2006 2007 2008 2008 2009
Imports from China:
Inventories (1,000 pounds) 3,124 3,152 6,369 10,351 8,735
Ratio to imports (percent) 4.5 4.1 6.3 8.8 8.9
Ratio to U.S. shipments of imports (percent) 4.7 4.4 7.1 10.7 10.3
Imports from Mexico:
Inventories (1,000 pounds) *** *** *** *** ***
Ratio to imports (percent) *** *** *** *** ***
Ratio to U.S. shipments of imports (percent) *** *** *** *** ***
Imports from subject sources:
Inventories (1,000 pounds) *** *** *** *** ***
Ratio to imports (percent) *** *** *** *** ***
Ratio to U.S. shipments of imports (percent) *** *** *** *** ***
Imports from all other sources:
Inventories (1,000 pounds) *** *** *** *** ***
Ratio to imports (percent) *** *** *** *** ***
Ratio to U.S. shipments of imports (percent) *** *** *** *** ***
Imports from all sources:
Inventories (1,000 pounds) 16,525 16,339 14,983 21,464 16,889
Ratio to imports (percent) 8.5 8.6 7.4 9.1 9.2
Ratio to U.S. shipments of imports (percent) 8.8 8.8 7.9 10.4 10.0
Note.–Because of rounding, figures may not add to the totals shown. Partial-year ratios are based on annualizedimport and shipment data.
Source: Compiled from data submitted in response to Commission questionnaires.
VII-6

U.S. IMPORTERS’ CURRENT ORDERS
Twenty-three U.S. importers reported imports or the arrangement of imports of SRC pipe andtube of *** pounds from China, and twelve importers reported imports of *** pounds from Mexico afterJune 30, 2009.16
ANTIDUMPING AND COUNTERVAILING DUTY INVESTIGATIONSIN THIRD-COUNTRY MARKETS
SRC pipe and tube have not been subject to any import injury investigations in third countrymarkets.
INFORMATION ON PRODUCERS IN NONSUBJECT COUNTRIES
In assessing whether the domestic industry is materially injured or threatened with material injury“by reason of subject imports,” the legislative history states “that the Commission must examine allrelevant evidence, including any known factors, other than the dumped or subsidized imports, that may beinjuring the domestic industry, and that the Commission must examine those other factors (includingnonsubject imports) ‘to ensure that it is not attributing injury from other sources to the subject imports.’”17
Canada and Malaysia are leading nonsubject sources for U.S. imports of SRC pipe and tube (see table IV-3).
Canada
Wolverine Tube (Canada) Inc. (Wolverine Canada) is a major producer of SRC pipe and tube inCanada.18 As part of its plans to exit the North American residential plumbing tube market, parent-company Wolverine announced, in July 2008, the sell-off of Wolverine Canada’s residential plumbingtube operations, to focus on heat-transfer tubing, fabricated assemblies, and metal-joining products.19 Subsequently, Wolverine Canada’s product line was expanded beyond uncoated SRC pipe and tubethrough acquisition of Kamco Products (Kamco) in November 2008, a leading Canadian and NorthAmerican producer of coated SRC pipe and tube.20 Kamco’s plastic-coated SRC pipe and tube is encasedin polyethylene for corrosion resistance in conveyance of fuel oil, natural gas and liquified petroleum gas,and potable water in industrial and municipal service sectors.21 Further information was not readilyavailable about Wolverine Canada’s annual production capacity.
16 Those firms are ***. 17 Mittal Steel Point Lisas Ltd. V. United States, Slip Op. 2007-1552 at 17 (Fed. Cir. Sept. 18, 2008), quotingfrom Statement of Administrative Action on Uruguay round Agreements Act, H.R. Rep. 103-316, Vol. 1 at 851-52;see also Bratsk Aluminum Smelter v. United States, 444 F.3d 1369 (Fed. Cir. 32006). 18 Petition, p. 25. 19 Wolverine, “Wolverine Tube Sells Canadian Plumbing Tube Unit for $42 Million,” press release, July 8, 2008. 20 Wolverine-Canada, Kamco Div., “Wolverine Tube (Canada) Inc. Acquires the Assets of Kamco Products, aDivision of Granby Steel Tanks,” November 1, 2008. 21 Kamco, “Profile;” and “Products.”
VII-7

Malaysia
MetTube Sdn Bhd (MetTube) is the first integrated mill in Malaysia that produces SRC pipe andtube from melting, casting, extruding, and drawing of refined copper.22 Both smooth and inner-grooveSRC pipe and tube are produced by MetTube for the air conditioning and refrigeration industries. MetTube’s tubing is available either unannealed or with varying degrees of annealing, and in spooledcoils, pancake coils, and straight lengths.23 MetTube’s tubing is produced to several different foreign-market specifications, including ASTM B-75, the U.S. specification for seamless copper tube for generalengineering applications.24 Total annual production capacity at MetTube’s facility in Selangor state isnearly 26,500 short tons per annum.25 MetTube claims to be shipping to customers and partners in 31countries worldwide.26
Outokumpu Copper Products (Malaysia) Sdn. Bhd. (Outokumpu-Malaysia) is a producer of SRCpipe and tube for air conditioning and refrigeration (ACR), along with copper profiles and sections,27 as amember of Luvata (formerly Outokumpu Copper Products before May 2006) since 1998.28 ***29***30. Further information was not readily available about these Malaysian producers' annual productioncapacities or product lines.
22 MetTube was established in 1991 as a joint venture between Metdist Ltd. (United Kingdom) and MitsubishiMaterials Corp. (Japan). MetTube, “MetTube & You– Chairman Statement;” and MetTube, “Virtual Tour–MetTube Today.” 23 MetTube, “MetTube & You– Product Range.” 24 MetTube, “MetTube & You– Product Specifications.” 25 Total annual production capacity originally reported as 24,000 metric tons. MetTube, “MetTube & You–MetTube Today.” 26 Ibid.; and MetTube, “Tube & You– Global Market.” 27 E-Directory.com.my, Malaysia Manufacturers Directory, “Outokumpu Copper Products (Malaysia) Sdn Bhd(417125-K). 28 Luvata, “About Luvata, Our History,” 2009. 29 ***. 30 ***.
VII-8
A-1
APPENDIX A
FEDERAL REGISTER NOTICES


51318 Federal Register / Vol. 74, No. 192 / Tuesday, October 6, 2009 / Notices
burden of the proposed collection of information; (c) enhance the quality, usefulness, and clarity of the information to be collected; and (d) minimize the burden on the respondents, including the use of automated collection techniques or other forms of information technology.
Agencies must also estimate the non- hour paperwork cost burdens to respondents or recordkeepers resulting from the collection of information. Therefore, if you have costs to generate, maintain, and disclose this information, you should comment and provide your total capital and startup cost components or annual operation, maintenance, and purchase of service components. You should describe the methods you use to estimate major cost factors, including system and technology acquisition, expected useful life of capital equipment, discount rate(s), and the period over which you incur costs. Capital and startup costs include, among other items, computers and software you purchase to prepare for collecting information, monitoring, and record storage facilities. You should not include estimates for equipment or services purchased: (i) Before October 1, 1995; (ii) to comply with requirements not associated with the information collection; (iii) for reasons other than to provide information or keep records for the Government; or (iv) as part of customary and usual business or private practices.
We will summarize written responses to this notice and address them in our submission for OMB approval. As a result of your comments, we will make any necessary adjustments to the burden in our submission to OMB.
Public Comment Procedures: Before including your address, phone number, e-mail address, or other personal identifying information in your comment, you should be aware that your entire comment–including your personal identifying information–may be made publicly available at any time. While you can ask us in your comment to withhold your personal identifying information from public review, we cannot guarantee that we will be able to do so.
MMS Information Collection Clearance Officer: Arlene Bajusz (202) 208–7744.
Dated: September 25, 2009.
E.P. Danenberger, Chief, Office of Offshore Regulatory Programs. [FR Doc. E9–24094 Filed 10–5–09; 8:45 am]
BILLING CODE 4310–MR–P
INTERNATIONAL TRADE COMMISSION
[Investigation Nos. 731–TA–1174–1175 (Preliminary)]
Seamless Refined Copper Pipe and Tube From China and Mexico
AGENCY: United States International Trade Commission. ACTION: Institution of antidumping investigations and scheduling of preliminary phase investigations.
SUMMARY: The Commission hereby gives notice of the institution of investigations and commencement of preliminary phase antidumping investigation Nos. 731–TA–1174–1175 (Preliminary) under section 733(a) of the Tariff Act of 1930 (19 U.S.C. 1673b(a)) (the Act) to determine whether there is a reasonable indication that an industry in the United States is materially injured or threatened with material injury, or the establishment of an industry in the United States is materially retarded, by reason of imports from China and Mexico of seamless refined copper pipe and tube, provided for in subheadings 7411.10.10, and 8415.90.80 of the Harmonized Tariff Schedule of the United States, that are alleged to be sold in the United States at less than fair value. Unless the Department of Commerce extends the time for initiation pursuant to section 732(c)(1)(B) of the Act (19 U.S.C. 1673a(c)(1)(B)), the Commission must reach a preliminary determination in antidumping investigations in 45 days, or in this case by November 16, 2009. The Commission’s views are due at Commerce within five business days thereafter, or by November 23, 2009.
For further information concerning the conduct of these investigations and rules of general application, consult the Commission’s Rules of Practice and Procedure, part 201, subparts A through E (19 CFR part 201), and part 207, subparts A and B (19 CFR part 207). DATES: Effective Date: September 30, 2009.
FOR FURTHER INFORMATION CONTACT: Elizabeth Haines (202–205–3200), Office of Investigations, U.S. International Trade Commission, 500 E Street, SW., Washington, DC 20436. Hearing- impaired persons can obtain information on this matter by contacting the Commission’s TDD terminal on 202– 205–1810. Persons with mobility impairments who will need special assistance in gaining access to the Commission should contact the Office of the Secretary at 202–205–2000. General information concerning the
Commission may also be obtained by accessing its internet server (http:// www.usitc.gov). The public record for these investigations may be viewed on the Commission’s electronic docket (EDIS) at http://edis.usitc.gov. SUPPLEMENTARY INFORMATION: Background. These investigations are being instituted in response to a petition filed on September 30, 2009, by Cerro Flow Products, Inc., St. Louis, MO; Kobe Wieland Copper Products, LLC, Pine Hall, NC; Mueller Copper Tube Products, Inc., and Mueller Copper Tube Company, Inc., Memphis, TN.
Participation in the investigations and public service list. Persons (other than petitioners) wishing to participate in the investigations as parties must file an entry of appearance with the Secretary to the Commission, as provided in sections 201.11 and 207.10 of the Commission’s rules, not later than seven days after publication of this notice in the Federal Register. Industrial users and (if the merchandise under investigation is sold at the retail level) representative consumer organizations have the right to appear as parties in Commission antidumping investigations. The Secretary will prepare a public service list containing the names and addresses of all persons, or their representatives, who are parties to these investigations upon the expiration of the period for filing entries of appearance.
Limited disclosure of business proprietary information (BPI) under an administrative protective order (APO) and BPI service list. Pursuant to section 207.7(a) of the Commission’s rules, the Secretary will make BPI gathered in these investigations available to authorized applicants representing interested parties (as defined in 19 U.S.C. 1677(9)) who are parties to the investigations under the APO issued in the investigations, provided that the application is made not later than seven days after the publication of this notice in the Federal Register. A separate service list will be maintained by the Secretary for those parties authorized to receive BPI under the APO.
Conference. The Commission’s Director of Investigations has scheduled a conference in connection with these investigations for 9:30 a.m. on October 21, 2009, at the U.S. International Trade Commission Building, 500 E Street, SW., Washington, DC. Parties wishing to participate in the conference should contact Elizabeth Haines (202–205– 3200) not later than October 16, 2009, to arrange for their appearance. Parties in support of the imposition of antidumping duties in these
VerDate Nov<24>2008 16:15 Oct 05, 2009 Jkt 220001 PO 00000 Frm 00066 Fmt 4703 Sfmt 4703 E:\FR\FM\06OCN1.SGM 06OCN1jlent
ini o
n D
SK
J8S
OY
B1P
RO
D w
ith N
OT
ICE
S

51319 Federal Register / Vol. 74, No. 192 / Tuesday, October 6, 2009 / Notices
investigations and parties in opposition to the imposition of such duties will each be collectively allocated one hour within which to make an oral presentation at the conference. A nonparty who has testimony that may aid the Commission’s deliberations may request permission to present a short statement at the conference.
Written submissions. As provided in sections 201.8 and 207.15 of the Commission’s rules, any person may submit to the Commission on or before October 26, 2009, a written brief containing information and arguments pertinent to the subject matter of the investigations. Parties may file written testimony in connection with their presentation at the conference no later than three days before the conference. If briefs or written testimony contain BPI, they must conform with the requirements of sections 201.6, 207.3, and 207.7 of the Commission’s rules. The Commission’s rules do not authorize filing of submissions with the Secretary by facsimile or electronic means, except to the extent permitted by section 201.8 of the Commission’s rules, as amended, 67 FR 68036 (November 8, 2002). Even where electronic filing of a document is permitted, certain documents must also be filed in paper form, as specified in II (C) of the Commission’s Handbook on Electronic Filing Procedures, 67 FR 68168, 68173 (November 8, 2002).
In accordance with sections 201.16(c) and 207.3 of the rules, each document filed by a party to the investigations must be served on all other parties to the investigations (as identified by either the public or BPI service list), and a certificate of service must be timely filed. The Secretary will not accept a document for filing without a certificate of service.
Authority: These investigations are being conducted under authority of title VII of the Tariff Act of 1930; this notice is published pursuant to section 207.12 of the Commission’s rules.
Issued: September 30, 2009.
By order of the Commission.
Marilyn R. Abbott, Secretary to the Commission. [FR Doc. E9–23988 Filed 10–5–09; 8:45 am]
BILLING CODE 7020–02–P
INTERNATIONAL TRADE COMMISSION
[Investigation No. 337–TA–678]
In the Matter of Certain Energy Drink Products; Notice of Commission Decision Not To Review an Initial Determination Granting Motion To Amend the Complaint and the Notice of Investigation To Add Six Additional Respondents
AGENCY: U.S. International Trade Commission. ACTION: Notice.
SUMMARY: Notice is hereby given that the U.S. International Trade Commission has determined not to review an initial determination (‘‘ID’’) (Order No. 7) issued by the presiding administrative law judge (‘‘ALJ’’) in the above-captioned investigation granting a motion filed by complainants Red Bull GmbH and Red Bull North America, Inc. (collectively, ‘‘Red Bull’’) to amend the complaint and notice of investigation to add six new respondents. FOR FURTHER INFORMATION CONTACT: Paul M. Bartkowski, Office of the General Counsel, U.S. International Trade Commission, 500 E Street, SW., Washington, DC 20436, telephone (202) 708–5432. Copies of non-confidential documents filed in connection with this investigation are or will be available for inspection during official business hours (8:45 a.m. to 5:15 p.m.) in the Office of the Secretary, U.S. International Trade Commission, 500 E Street, SW., Washington, DC 20436, telephone (202) 205–2000. General information concerning the Commission may also be obtained by accessing its Internet server at http://www.usitc.gov. The public record for this investigation may be viewed on the Commission’s electronic docket (EDIS) at http:// edis.usitc.gov. Hearing-impaired persons are advised that information on this matter can be obtained by contacting the Commission’s TDD terminal on (202) 205–1810. SUPPLEMENTARY INFORMATION: The Commission instituted this investigation on June 17, 2009, based on a complaint filed by Red Bull GmbH and Red Bull North America, Inc. (‘‘Red Bull’’). 74 FR 28725 (June 17, 2009). The complaint as amended alleged violations of section 337 of the Tariff Act of 1930 (19 U.S.C. 1337) in the importation into the United States, the sale for importation, and the sale within the United States after importation of certain energy drink products by reason of infringement of U.S. Trademark Registration Nos. 3,092,197; 2,946,045; 2,994,429; and
3,479,607 and U.S. Copyright Registration No. VA0001410959. The complaint initially named six respondents: Chicago Import, Inc.; Lamont Dist., Inc. a/k/a Lamont Distributors Inc.; India Imports, Inc., a/k/a International Wholesale Club; Washington Food and Supply of DC, Inc., a/k/a Washington Cash & Carry; Vending Plus, Inc.; and Baltimore Beverage Co.
On September 8, 2009, the ALJ issued the subject ID, granting Red Bull’s motion to amend the complaint and notice of investigation to add six new respondents: Posh Nosh Imports; Greenwich, Inc.; Advantage Food Distributors, Ltd.; Wheeler Trading, Inc.; Avalon International General Trading, LLC; and Central Supply, Inc. No petitions for review were filed. The Commission has determined not to review the subject ID.
The authority for the Commission’s determination is contained in section 337 of the Tariff Act of 1930, as amended (19 U.S.C. 1337), and in sections 210.42 of the Commission’s Rules of Practice and Procedure (19 CFR 210.42).
Issued: September 30, 2009. By order of the Commission.
Marilyn R. Abbott, Secretary to the Commission. [FR Doc. E9–23989 Filed 10–5–09; 8:45 am] BILLING CODE 7020–02–P
INTERNATIONAL TRADE COMMISSION
[Investigation No. 701–TA–461 (Final)]
Ni-Resist Piston Inserts From Korea
AGENCY: United States International Trade Commission. ACTION: Termination of investigation.
SUMMARY: On September 21, 2009, the Department of Commerce published notice in the Federal Register of a negative final determination of subsidies in connection with the subject investigation (Ni-Resist Piston Inserts from the Republic of Korea: Final Negative Countervailing Duty Determination, 74 FR 48059, September 21, 2009). Accordingly, pursuant to section 207.40(a) of the Commission’s Rules of Practice and Procedure (19 CFR 207.40(a)), the countervailing duty investigation concerning Ni-resist piston inserts from Korea (investigation No. 701–TA–461 (Final)) is terminated.
DATES: Effective Date: September 21, 2009. FOR FURTHER INFORMATION CONTACT: Angela M. W. Newell (202–708–5409),
VerDate Nov<24>2008 16:15 Oct 05, 2009 Jkt 220001 PO 00000 Frm 00067 Fmt 4703 Sfmt 4703 E:\FR\FM\06OCN1.SGM 06OCN1jlent
ini o
n D
SK
J8S
OY
B1P
RO
D w
ith N
OT
ICE
S

55194 Federal Register / Vol. 74, No. 206 / Tuesday, October 27, 2009 / Notices
1 Final amendments regarding the Petition for the Imposition of Antidumping Duties: Seamless Refined Copper Pipe and Tube from the People’s Republic of China, and the Petition for the Imposition of Antidumping Duties: Seamless Refined Copper Pipe and Tube from Mexico, were filed on October 19, 2009 (collectively, ‘‘Third Supplement to the Petitions, dated October 19, 2009’’).
Dated: October 21, 2009. Ronald K. Lorentzen, Acting Assistant Secretary for Import Administration. [FR Doc. E9–25857 Filed 10–26–09; 8:45 am] BILLING CODE 3510–DS–S
DEPARTMENT OF COMMERCE
International Trade Administration
(A–570–964, A–201–838)
Seamless Refined Copper Pipe and Tube from the People’s Republic of China and Mexico: Initiation of Antidumping Duty Investigations
AGENCY: Import Administration, International Trade Administration, Department of Commerce. EFFECTIVE DATE: October 27, 2009. FOR FURTHER INFORMATION CONTACT: Maisha Cryor at (202) 482–5831 or Zhulieta Willbrand at (202) 482–3147 (the People’s Republic of China (the ‘‘PRC’’)), AD/CVD Operations, Office 4; George McMahon at (202) 482–1167 or James Terpstra at (202) 482–3965 (Mexico), AD/CVD Operations, Office 3, Import Administration, International Trade Administration, U.S. Department of Commerce, 14th Street and Constitution Avenue, NW, Washington, DC 20230. SUPPLEMENTARY INFORMATION:
The Petitions
On September 30, 2009, the Department of Commerce (the ‘‘Department’’) received petitions concerning imports of seamless refined copper pipe and tube (‘‘copper pipe and tube’’) from the PRC and Mexico filed in proper form by Cerro Flow Products, Inc., KobeWieland Copper Products, LLC, Mueller Copper Tube Products, Inc., and Mueller Copper Tube Company, Inc. (collectively, ‘‘Petitioners’’). See Petitions for the Imposition of Antidumping Duties on Seamless Refined Copper Pipe and Tube from the People’s Republic of China and Mexico, dated September 30, 2009 (the ‘‘Petitions’’). On October 5, 2009, October 8, 2009, October 14, 2009, and October 16, 2009, the Department issued a request for additional information and clarification of certain areas of the Petitions. On October 14, 2009, the Department contacted Petitioners by telephone seeking additional information and clarification regarding the PRC portion of the Petition. See Memo to the File from Maisha Cryor, ‘‘Seamless Refined Copper Pipe and Tube from the People’s Republic of China and Mexico: Margin Calculation,’’
dated October 15, 2009. On October 16, 2009, the Department contacted Petitioners by telephone seeking additional information and clarification regarding the scope of the Petition. See Memo to the File from Dana M. Griffies, Import Policy Analyst, ‘‘ Petition for the Imposition of Antidumping Duties Seamless Refined Copper Pipe and Tube from the People’s Republic of China and Mexico: Suggested Scope Changes,’’ dated October 16, 2009.
On October 19, 2009, the Department contacted Petitioners by telephone seeking additional information and clarification regarding industry support. See Memo to the File from Dana M. Griffies, Import Policy Analyst, ‘‘ Petition for the Imposition of Antidumping Duties Seamless Refined Copper Pipe and Tube from the People’s Republic of China and Mexico: Industry Support,’’ dated October 19, 2009. Based on the Department’s requests, Petitioners filed additional information on October 13, 2009 (hereinafter, ‘‘Supplement to the Petitions, dated October 13, 2009’’), October 15, 2009 (hereinafter, ‘‘Supplement to the PRC Petition, dated October 15, 2009’’), October 16, 2009 (hereinafter, ‘‘Second Supplement to the Petitions, dated October 16, 2009’’), October 19, 2009 (hereinafter, ‘‘Third Supplement to the Petitions1,’’), and October 20, 2009 (hereinafter, ‘‘Fourth Supplement to the Petitions’’). The period of investigation (‘‘POI’’) for the PRC is January 1, 2009, through June 30, 2009. The POI for Mexico is July 1, 2008, through June 30, 2009. See 19 CFR 351.204(b)(1).
In accordance with section 732(b) of the Tariff Act of 1930, as amended (the ‘‘Act’’), Petitioners allege that imports of copper pipe and tube from the PRC and Mexico are being, or are likely to be, sold in the United States at less than fair value, within the meaning of section 731 of the Act, and that such imports are materially injuring, or threatening material injury to, an industry in the United States.
The Department finds that Petitioners filed the Petitions on behalf of the domestic industry because Petitioners are interested parties as defined in section 771(9)(C) of the Act and have demonstrated sufficient industry support with respect to the antidumping duty investigations that Petitioners are
requesting that the Department initiate (see ‘‘Determination of Industry Support for the Petitions’’ section below).
Scope of Investigations The products covered by these
investigations are copper pipe and tube from the PRC and Mexico. For a full description of the scope of the investigations, please see the ‘‘Scope of the Investigations,’’ in Appendix I of this notice.
Comments on Scope of Investigations During our review of the Petitions, we
discussed the scope with Petitioners to ensure that it is an accurate reflection of the products for which the domestic industry is seeking relief. Moreover, as discussed in the preamble to the regulations (Antidumping Duties; Countervailing Duties; Final Rule, 62 FR 27296, 27323 (May 19, 1997)), we are setting aside a period for interested parties to raise issues regarding product coverage. The Department encourages all interested parties to submit such comments by November 9, 2009, twenty calendar days from the signature date of this notice. Comments should be addressed to Import Administration’s APO/Dockets Unit, Room 1870, U.S. Department of Commerce, 14th Street and Constitution Avenue, NW, Washington, DC 20230. The period of scope consultations is intended to provide the Department with ample opportunity to consider all comments and to consult with parties prior to the issuance of the preliminary determinations.
Comments on Product Characteristics for Antidumping Duty Questionnaires
We are requesting comments from interested parties regarding the appropriate physical characteristics of copper pipe and tube to be reported in response to the Department’s antidumping questionnaires. This information will be used to identify the key physical characteristics of the subject merchandise in order to more accurately report the relevant factors and costs of production, as well as to develop appropriate product comparison criteria.
Interested parties may provide any information or comments that they feel are relevant to the development of an accurate listing of physical characteristics. Specifically, they may provide comments as to which characteristics are appropriate to use as 1) general product characteristics and 2) the product comparison criteria. We note that it is not always appropriate to use all product characteristics as product comparison criteria. We base
VerDate Nov<24>2008 16:45 Oct 26, 2009 Jkt 220001 PO 00000 Frm 00014 Fmt 4703 Sfmt 4703 E:\FR\FM\27OCN1.SGM 27OCN1pwal
ker
on D
SK
8KY
BLC
1PR
OD
with
NO
TIC
ES
55195 Federal Register / Vol. 74, No. 206 / Tuesday, October 27, 2009 / Notices
product comparison criteria on meaningful commercial differences among products. In other words, while there may be some physical product characteristics utilized by manufacturers to describe copper pipe and tube, it may be that only a select few product characteristics take into account commercially meaningful physical characteristics. In addition, interested parties may comment on the order in which the physical characteristics should be used in product matching. Generally, the Department attempts to list the most important physical characteristics first and the least important characteristics last.
In order to consider the suggestions of interested parties in developing and issuing the antidumping duty questionnaires, we must receive comments at the above–referenced address by November 9, 2009. Additionally, rebuttal comments must be received by November 16, 2009.
Determination of Industry Support for the Petitions
Section 732(b)(1) of the Act requires that a petition be filed on behalf of the domestic industry. Section 732(c)(4)(A) of the Act provides that a petition meets this requirement if the domestic producers or workers who support the petition account for: (i) at least 25 percent of the total production of the domestic like product; and (ii) more than 50 percent of the production of the domestic like product produced by that portion of the industry expressing support for, or opposition to, the petition. Moreover, section 732(c)(4)(D) of the Act provides that, if the petition does not establish support of domestic producers or workers accounting for more than 50 percent of the total production of the domestic like product, the Department shall: (i) poll the industry or rely on other information in order to determine if there is support for the petition, as required by subparagraph (A); or (ii) determine industry support using a statistically valid sampling method.
Section 771(4)(A) of the Act defines the ‘‘industry’’ as the producers as a whole of a domestic like product. Thus, to determine whether a petition has the requisite industry support, the statute directs the Department to look to producers and workers who produce the domestic like product. The International Trade Commission (‘‘ITC’’), which is responsible for determining whether ‘‘the domestic industry’’ has been injured, must also determine what constitutes a domestic like product in order to define the industry. While both
the Department and the ITC must apply the same statutory definition regarding the domestic like product (see section 771(10) of the Act), they do so for different purposes and pursuant to a separate and distinct authority. In addition, the Department’s determination is subject to limitations of time and information. Although this may result in different definitions of the like product, such differences do not render the decision of either agency contrary to law. See USEC, Inc. v. United States, 132 F. Supp. 2d 1, 8 (Ct. Int’l Trade 2001), citing Algoma Steel Corp., Ltd. v. United States, 688 F. Supp. 639, 644 (Ct. Int’l Trade 1988), aff’d 865 F.2d 240 (Fed. Cir. 1989), cert. denied 492 U.S. 919 (1989).
Section 771(10) of the Act defines the domestic like product as ‘‘a product which is like, or in the absence of like, most similar in characteristics and uses with, the article subject to an investigation under this title.’’ Thus, the reference point from which the domestic like product analysis begins is ‘‘the article subject to an investigation’’ (i.e., the class or kind of merchandise to be investigated, which normally will be the scope as defined in the petition).
With regard to the domestic like product, Petitioners do not offer a definition of domestic like product distinct from the scope of the investigations. Based on our analysis of the information submitted on the record, we have determined that copper pipe and tube constitutes a single domestic like product and we have analyzed industry support in terms of that domestic like product. For a discussion of the domestic like product analysis in this case, see Antidumping Duty Investigation Initiation Checklist: Copper Pipe and Tube from the PRC (‘‘PRC Initiation Checklist’’) at Attachment II, and Antidumping Duty Investigation Initiation Checklist: Copper Pipe and Tube from Mexico (‘‘Mexico Initiation Checklist’’) at Attachment II, dated concurrently with this notice and on file in the Central Records Unit (‘‘CRU’’), Room 1117 of the main Department of Commerce building.
In determining whether Petitioners have standing under section 732(c)(4)(A) of the Act, we considered the industry support data contained in the Petitions with reference to the domestic like product as defined in the ‘‘Scope of the Investigations,’’ in Appendix I of this notice. To establish industry support, Petitioners provided their own 2008 shipments of the domestic like product, and compared this to the estimated total shipments of the domestic like product for the entire
domestic industry. See Petitions, at 2– 9, and Exhibits 1–7, Supplement to the Petitions, dated October 13, 2009, at 8– 10, and Exhibit G, Second Supplement to the Petitions, dated October 16, 2009, at 2–3, and Exhibit 54, and Fourth Supplement to the Petitions, dated October 20, 2009, at 7–8 and Exhibit 59. Petitioners argue that shipments are a reasonable proxy for production because most domestic production is sold on the merchant market. See Petitions, at 8 and Exhibits 4–7. Petitioners estimated total 2008 shipments of the domestic like product based on two industry–specific reports that publish shipment and production information, as well as two individuals who are knowledgeable of the U.S. industry. See Petitions, at 8 and Exhibits 2–3, Supplement to the Petitions, dated October 13, 2009, at 8– 10 and Exhibit G, and Second Supplement to the Petitions, dated October 16, 2009, at 2–3 and Exhibit 54, and Fourth Supplement to the Petitions, dated October 20, 2009, at 7–8 and Exhibit 59; see also PRC Initiation Checklist at Attachment II, and Mexico Initiation Checklist at Attachment II.
Our review of the data provided in the Petitions, supplemental submissions, and other information readily available to the Department indicates that Petitioners have established industry support. First, the Petitions established support from domestic producers (or workers) accounting for more than 50 percent of the total production of the domestic like product and, as such, the Department is not required to take further action in order to evaluate industry support (e.g., polling). See section 732(c)(4)(D) of the Act; see also PRC Initiation Checklist at Attachment II, and Mexico Initiation Checklist at Attachment II. Second, the domestic producers (or workers) have met the statutory criteria for industry support under section 732(c)(4)(A)(i) of the Act because the domestic producers (or workers) who support the Petitions account for at least 25 percent of the total production of the domestic like product. See PRC Initiation Checklist at Attachment II, and Mexico Initiation Checklist at Attachment II. Finally, the domestic producers (or workers) have met the statutory criteria for industry support under section 732(c)(4)(A)(ii) of the Act because the domestic producers (or workers) who support the Petitions account for more than 50 percent of the production of the domestic like product produced by that portion of the industry expressing support for, or opposition to, the Petitions. Accordingly, the Department determines that the Petitions were filed on behalf of the
VerDate Nov<24>2008 16:45 Oct 26, 2009 Jkt 220001 PO 00000 Frm 00015 Fmt 4703 Sfmt 4703 E:\FR\FM\27OCN1.SGM 27OCN1pwal
ker
on D
SK
8KY
BLC
1PR
OD
with
NO
TIC
ES

55196 Federal Register / Vol. 74, No. 206 / Tuesday, October 27, 2009 / Notices
domestic industry within the meaning of section 732(b)(1) of the Act. See id.
The Department finds that Petitioners filed the Petitions on behalf of the domestic industry because they are interested parties as defined in section 771(9)(C) of the Act and they have demonstrated sufficient industry support with respect to the antidumping duty investigations that they are requesting the Department initiate. See id.
Allegations and Evidence of Material Injury and Causation
Petitioners allege that the U.S. industry producing the domestic like product is being materially injured, or is threatened with material injury, by reason of the imports of the subject merchandise sold at less than normal value (‘‘NV’’). In addition, Petitioners allege that subject imports exceed the negligibility threshold provided for under section 771(24)(A) of the Act.
Petitioners contend that the industry’s injured condition is illustrated by reduced market share, lost sales and revenues, reduced production, reduced capacity utilization rate, underselling and price depression and suppression, reduced workforce, decline in financial performance, and an increase in import penetration. We have assessed the allegations and supporting evidence regarding material injury, threat of material injury, and causation, and we have determined that these allegations are properly supported by adequate evidence and meet the statutory requirements for initiation. See PRC Initiation Checklist at Attachment III and Mexico Initiation Checklist at Attachment III.
Allegations of Sales at Less Than Fair Value
The following is a description of the allegations of sales at less than fair value upon which the Department based its decision to initiate these investigations of imports of copper pipe and tube from the PRC and Mexico. The sources of data for the deductions and adjustments relating to the U.S. price, the factors of production (for the PRC) and cost of production (‘‘COP’’) (for Mexico) are also discussed in the country–specific initiation checklists. See PRC Initiation Checklist at 6–10 and Mexico Initiation Checklist at 6–10.
Export Price
The PRC For the PRC, Petitioners calculated
export price (‘‘EP’’) based on a price quote made during the POI for a copper pipe and tube product by a Chinese producer, sale term delivered. See PRC
Initiation Checklist at 6; see also Petitions, at 28–29, and Exhibit 20, and Supplement to the Petitions, dated October 13, 2009, at 12, and Exhibit G. Petitioners substantiated the U.S. price quote with an affidavit. See Petitions, at Exhibit 20. Petitioners made adjustments to EP for ocean freight, foreign inland freight, and a distributor commission. See PRC Initiation Checklist at 6–7; see also Petitions, at Exhibits 21 and 23, and Supplement to the Petitions, dated October 13, 2009, at 18–20, and Exhibit L. Petitioners made no other adjustments. See PRC Initiation Checklist for additional details.
Mexico
For Mexico, Petitioners based U.S. price on the invoice from an actual sale of Type K and Type L copper pipe and tube, produced by a Mexican manufacturer and sold to a U.S. customer in January 2009. See Mexico Initiation Checklist; see also Petitions, at 31 and Exhibit 20, and Supplement to the Petitions, dated October 13, 2009, at 21 and Exhibit N. Petitioners substantiated the U.S. prices used with an affidavit and a declaration from persons who obtained the information. See Supplement to the Petitions, at 21 and Exhibit N. Petitioners conservatively assumed the selling expenses to be zero in their calculation of the net U.S. price. Petitioners deducted ocean freight and foreign inland freight expenses but made no other adjustments. See Mexico Initiation Checklist at 7; see also Petition, at 32 and Exhibit 35, and Supplement to the Petitions, dated October 13, 2009, at 22, and Exhibit P. See the Mexico Initiation Checklist for additional details.
Normal Value
The PRC
Petitioners state that the PRC is a non–market economy (‘‘NME’’) country and no determination to the contrary has been made by the Department. See Petitions, at 29; see also Certain Kitchen Appliance Shelving and Racks from the People’s Republic of China: Amended Final Determination of Sales at Less Than Fair Value and Notice of Antidumping Duty Order, 74 FR 46971 (September 14, 2009); see also Certain Tow Behind Lawn Groomers and Certain Parts Thereof from the People’s Republic of China: Antidumping Duty Order, 74 FR 38395 (August 3, 2009).
In accordance with section 771(18)(C)(i) of the Act, the presumption of NME status remains in effect until revoked by the Department. The presumption of NME status for the PRC has not been revoked by the
Department and, therefore, remains in effect for purposes of the initiation of the PRC investigation. Accordingly, the NV of the product for the PRC investigation is appropriately based on factors of production valued in a surrogate market–economy country in accordance with section 773(c) of the Act. In the course of the PRC investigation, all parties, including the public, will have the opportunity to provide relevant information related to the issue of the PRC’s NME status and the granting of separate rates to individual exporters.
Citing section 773(c)(4) of the Act, Petitioners contend that India is the appropriate surrogate country for the PRC because: 1) it is at a level of economic development comparable to that of the PRC; and 2) it is a significant producer of copper pipe and tube. See Petitions, at 29–30, and Exhibits 26 and 27. Based on the information provided by Petitioners, we believe that it is appropriate to use India as a surrogate country for initiation purposes. After initiation of the investigation, interested parties will have the opportunity to submit comments regarding surrogate– country selection and, pursuant to 19 CFR 351.301(c)(3)(i), will be provided an opportunity to submit publicly available information to value factors of production within 40 days after the date of publication of the preliminary determination.
Petitioners calculated the NV and dumping margins for the U.S. price, discussed above, using the Department’s NME methodology as required by 19 CFR 351.202(b)(7)(i)(C) and 19 CFR 351.408. Petitioners calculated NV based on their own consumption rates for producing copper pipe and tube in 2009. See Petitions at 30, and Exhibits 28 and 34. In calculating NV, Petitioners based the quantity of each of the inputs used to manufacture and pack copper pipe and tube in the PRC based on their own production experience during the POI because they stated that the actual usage rates of the foreign manufacturers of copper pipe and tube were not reasonably available. See Petitions, at 30. However, Petitioners also stated that their production process and cost structure is representative of the PRC copper pipe and tube producers because the act of converting copper raw material into copper pipe and tube is ‘‘fundamentally the same for all producers.’’ See Supplement to the Petitions, dated October 13, 2009, at 18. Petitioners note that several methods to perform such a conversion exist in the marketplace indicating that no one method is superior to another for the production of copper pipe and tube. Id.
VerDate Nov<24>2008 16:45 Oct 26, 2009 Jkt 220001 PO 00000 Frm 00016 Fmt 4703 Sfmt 4703 E:\FR\FM\27OCN1.SGM 27OCN1pwal
ker
on D
SK
8KY
BLC
1PR
OD
with
NO
TIC
ES

55197 Federal Register / Vol. 74, No. 206 / Tuesday, October 27, 2009 / Notices
2 Petitioners excluded from these import statistics imports from countries previously determined by the Department to be NME countries, imports from Indonesia, the Republic of Korea, and Thailand as the Department has previously excluded prices from these countries because they maintain broadly available, non-industry-specific export subsidies, and imports labeled as being from ‘‘unspecified countries.’’
Given these facts, Petitioners assert that their experience ‘‘should be representative of other Chinese producers when allowance is made for different wage rates and energy costs.’’ Id.
Petitioners valued the factors of production based on reasonably available, public surrogate–country data, including Indian import statistics from the World Trade Atlas. See Petitions, at 30, and Exhibit 29. Petitioners excluded from these import statistics imports from countries previously determined by the Department to be NME countries, imports from Indonesia, the Republic of Korea, and Thailand as the Department has previously excluded prices from these countries because they maintain broadly available, non–industry-specific export subsidies, and imports labeled as being from ‘‘unspecified countries.’’ See Petitions, at Exhibit 29. In addition, Petitioners made currency conversions, where necessary, based on the POI– average rupee/U.S. dollar exchange rate, as reported on the Department’s website. See Petitions, at 31, and Exhibit 25. Petitioners determined labor costs using the labor consumption, in hours, derived from their own experience. See Petitions, at Exhibits 28 and 34. Petitioners valued labor costs using the Department’s NME Wage Rate for the PRC at http://ia.ita.doc.gov/wages/ 05wages/05wages–051608.html. See Petitions, at Exhibits 28 and 30. For purposes of initiation, the Department determines that the surrogate values used by Petitioners are reasonably available and, thus, acceptable for purposes of initiation.
Petitioners determined electricity costs using the electricity consumption, in kilowatt hours, derived from their own experience. See Petitions, at Exhibits 28 and 34. Petitioners valued electricity using the Indian electricity rate reported by the Central Electric Authority of the Government of India. See Petitions, at Exhibit 24 and, Supplement to the Petitions, dated October 13, 2009, at 17, and Exhibits I and J.
Petitioners determined natural gas costs using the natural gas consumption derived from their own experience. See Petitions, at Exhibits 28 and 34, and Supplement to the Petitions, dated October 13, 2009, at 17. Petitioners valued natural gas using the Indian rate reported by the Gas Authority of India, Ltd. See Petitions, at Exhibit 31.
Petitioners determined water costs using the water consumption derived from their own experience. See Petitions, at Exhibits 28 and 34. Petitioners valued water based on
information from the Maharastra Industrial Development Corporation, which is contemporaneous with the POI. See Petitions, at Exhibit 24.
Petitioners based factory overhead, selling, general and administrative (‘‘SG&A’’), and profit on data from Multimetals Limited (‘‘Multimetals’’), a copper pipe and tube producer, for the fiscal year April 2008 through March 2009. See Petitions, at 31, and Exhibits 32 and 33, and Supplement to the Petitions, dated October 13, 2009, at 17, and Exhibit K. Petitioners state that Multimetals was an Indian producer of copper pipe and tube products during the fiscal year 2008–2009. See Petitions, at 31, and Exhibits 32 and 33, and Supplement to the Petition, dated October 13, 2009, at 17 and Exhibit K. Therefore, for purposes of the initiation, the Department finds Petitioners’ use of Multimetals’ financial ratios appropriate.
Mexico
Petitioners calculated NV for copper pipe and tube based on a price quote for a Type L copper tube offer from March 2009. See Petitions, at 32, and Supplement to the Petitions, dated October 13, 2009, at 24; see also Mexico Initiation Checklist. Petitioners substantiated the home market price quote with an affidavit and a declaration from persons who obtained the information. See Petitions, at 32, and Exhibit 20, and Supplement to the Petitions, dated October 13, 2009, at Exhibit N; see also Mexico Initiation Checklist.
Sales–Below-Cost Allegation
Petitioners have provided information demonstrating reasonable grounds to believe or suspect that sales of copper pipe and tube in the Mexican market were made at prices below the fully absorbed COP, within the meaning of section 773(b) of the Act, and requested that the Department conduct a country– wide sales–below-cost investigation. The Statement of Administrative Action (‘‘SAA’’), submitted to Congress in connection with the interpretation and application of the URAA, states that an allegation of sales below COP need not be specific to individual exporters or producers. See SAA, H.R. Doc. No. 103– 316 at 833 (1994). The SAA, at 833, states that ‘‘Commerce will consider allegations of below–cost sales in the aggregate for a foreign country, just as Commerce currently considers allegations of sales at less than fair value on a country–wide basis for purposes of initiating an antidumping investigation.’’
Further, the SAA provides that section 773(b)(2)(A) of the Act retains the requirement that the Department have ‘‘reasonable grounds to believe or suspect’’ that below–cost sales have occurred before initiating such an investigation. Reasonable grounds exist when an interested party provides specific factual information on costs and prices, observed or constructed, indicating that sales in the foreign market in question are at below–cost prices. Id.
Cost of Production
Pursuant to section 773(b)(3) of the Act, COP consists of the cost of manufacturing (‘‘COM’’); SG&A expenses; financial expenses; and packing expenses. Petitioners calculated the quantity of each of the material inputs into COM based on the production experience of a U.S. producer of copper pipe and tube during the POI, multiplied by the value of inputs used to manufacture copper pipe and tube in Mexico using publicly available data. See Mexico Initiation Checklist at 8–9; see also Second Supplement to the Petitions, dated October 16, 2009, at 3–4 and Exhibits 55 and 56.2 Petitioners calculated labor, energy, overhead and packing costs based on their own experience adjusted for known differences between costs in the United States and costs in Mexico. Id. To calculate the SG&A and financial expense rates, Petitioners relied on the fiscal year 2008 financial statements of a Mexican producer of welded steel pipe, products in the same general category of merchandise as copper pipe and tube. Id. at 8. Petitioners indicated that they calculated surrogate financial ratios using the financial statements of the most comparable company in Mexico during the most recent period for which data were available. See Petitions at 33, footnote 35. Specifically, Petitioners stated that the data sourced from this Mexican producer’s financial statements was the best available surrogate for estimating the SG&A and financial expense rates because, in addition to producing and selling circular welded non–alloy pipe, this Mexican producer was also involved in the sale and distribution of seamless refined copper tube in the Mexican market. See Petitions at 33, footnote 35;
VerDate Nov<24>2008 16:45 Oct 26, 2009 Jkt 220001 PO 00000 Frm 00017 Fmt 4703 Sfmt 4703 E:\FR\FM\27OCN1.SGM 27OCN1pwal
ker
on D
SK
8KY
BLC
1PR
OD
with
NO
TIC
ES

55198 Federal Register / Vol. 74, No. 206 / Tuesday, October 27, 2009 / Notices
see also Supplement to the Petitions, dated October 13, 2009, at 29.
Based upon a comparison of the prices of the foreign like product in the home market to the calculated COP of the product, we find reasonable grounds to believe or suspect that sales of the foreign like product were made below the COP, within the meaning of section 773(b)(2)(A)(i) of the Act. Accordingly, the Department is initiating a country– wide cost investigation.
Normal Value Based on Constructed Value
Because it alleged sales below cost, pursuant to sections 773(a)(4), 773(b) and 773(e) of the Act, Petitioners calculated NV based on constructed value (‘‘CV’’). Petitioners calculated CV using the same COM, SG&A, financial expense and packing figures used to compute the COP. Petitioners then added a profit rate based on the fiscal year 2008 financial statements of a Mexican producer of welded steel pipe. Id.
Fair–Value Comparisons Based on the data provided by
Petitioners, there is reason to believe that imports of copper pipe and tube from the PRC and Mexico are being, or are likely to be, sold in the United States at less than fair value. Based on a comparison of EPs and NV calculated in accordance with section 773(c) of the Act, the estimated dumping margin for copper pipe and tube from the PRC is 60.5 percent. See PRC Initiation Checklist at 10; see also Supplement to the PRC Petition, dated October 15, 2009, at Exhibit W. Based on a comparison of EPs and CV calculated in accordance with section 773(a)(4) of the Act, the estimated dumping margins for copper pipe and tube from Mexico range from 76.5 percent to 85.7 percent. See Mexico Initiation Checklist at 10, Supplement to the Petitions, dated October 13, 2009, at 31 and Supplement to the Petitions, dated October 16, 2009 at 3–4, and Exhibits 55 and 56.
Initiation of Antidumping Investigations
Based upon the examination of the Petitions on copper pipe and tube from the PRC and Mexico, the Department finds that the Petitions meet the requirements of section 732 of the Act. Therefore, we are initiating antidumping duty investigations to determine whether imports of copper pipe and tube from the PRC and Mexico are being, or are likely to be, sold in the United States at less than fair value. In accordance with section 733(b)(1)(A) of the Act and 19 CFR 351.205(b)(1),
unless postponed, we will make our preliminary determinations no later than 140 days after the date of these initiations.
Targeted–Dumping Allegations
On December 10, 2008, the Department issued an interim final rule for the purpose of withdrawing 19 CFR 351.414(f) and (g), the regulatory provisions governing the targeted- dumping analysis in antidumping duty investigations, and the corresponding regulation governing the deadline for targeted–dumping allegations, 19 CFR 351.301(d)(5). See Withdrawal of the Regulatory Provisions Governing Targeted Dumping in Antidumping Duty Investigations, 73 FR 74930 (December 10, 2008). The Department stated that ‘‘{w}ithdrawal will allow the Department to exercise the discretion intended by the statute and, thereby, develop a practice that will allow interested parties to pursue all statutory avenues of relief in this area.’’ See id. at 74931.
In order to accomplish this objective, if any interested party wishes to make a targeted- dumping allegation in either of these investigations pursuant to section 777A(d)(1)(B) of the Act, such allegations are due no later than 45 days before the scheduled date of the country–specific preliminary determination.
Respondent Selection
The PRC
For this investigation, the Department will request quantity and value information from all known exporters and producers identified with complete contact information in the Petitions, and Supplement to the Petitions, dated October 13, 2009, at 13–15. The quantity and value data received from NME exporters/producers will be used as the basis to select the mandatory respondents.
The Department requires that the respondents submit a response to both the quantity and value questionnaire and the separate–rate application by the respective deadlines in order to receive consideration for separate–rate status. See Circular Welded Austenitic Stainless Pressure Pipe from the People’s Republic of China: Initiation of Antidumping Duty Investigation, 73 FR 10221, 10225 (February 26, 2008); Initiation of Antidumping Duty Investigation: Certain Artist Canvas From the People’s Republic of China, 70 FR 21996, 21999 (April 28, 2005). The Department will post the quantity and value questionnaire along with the filing instructions on the Import
Administration website at http:// ia.ita.doc.gov/ia–highlights-and– news.html and a response to the quantity and value questionnaire is due no later than November 10, 2009.
Mexico For this investigation, the Department
intends to select respondents based on U.S. Customs and Border Protection (‘‘CBP’’) data for U.S. imports under the Harmonized Tariff Schedule of the United States (‘‘HTSUS’’) numbers 7411.10.1030 and 7411.10.1090, the two HTSUS categories most specific to the subject merchandise, during the POI. We intend to release the CBP data under Administrative Protective Order (‘‘APO’’) to all parties with access to information protected by APO within five days of publication of this Federal Register notice and make our decision regarding respondent selection within 20 days of publication of this notice. The Department invites comments regarding the CBP data and respondent selection within ten days of publication of this Federal Register notice.
Interested parties must submit applications for disclosure under APO in accordance with 19 CFR 351.305. Instructions for filing such applications may be found on the Department’s website at http://ia.ita.doc.gov/apo.
Separate Rates In order to obtain separate–rate status
in NME investigations, exporters and producers must submit a separate–rate status application. See Policy Bulletin 05.1: Separate–Rates Practice and Application of Combination Rates in Antidumping Investigations involving Non–Market Economy Countries (April 5, 2005) (‘‘Separate Rates and Combination Rates Bulletin’’), available on the Department’s website at http:// ia.ita.doc.gov/policy/bull05–1.pdf. Based on our experience in processing the separate–rate applications in previous antidumping duty investigations, we have modified the application for this investigation to make it more administrable and easier for applicants to complete. See, e.g., Initiation of Antidumping Duty Investigation: Certain New Pneumatic Off–the-Road Tires From the People’s Republic of China, 72 FR 43591, 43594– 95 (August 6, 2007). The specific requirements for submitting the separate–rate application in this investigation are outlined in detail in the application itself, which will be available on the Department’s website at http://ia.ita.doc.gov/ia–highlights-and– news.html on the date of publication of this initiation notice in the Federal Register. The separate–rate application
VerDate Nov<24>2008 16:45 Oct 26, 2009 Jkt 220001 PO 00000 Frm 00018 Fmt 4703 Sfmt 4703 E:\FR\FM\27OCN1.SGM 27OCN1pwal
ker
on D
SK
8KY
BLC
1PR
OD
with
NO
TIC
ES

55199 Federal Register / Vol. 74, No. 206 / Tuesday, October 27, 2009 / Notices
will be due 60 days after publication of this initiation notice. For exporters and producers who submit a separate–rate status application and subsequently are selected as mandatory respondents, these exporters and producers will no longer be eligible for consideration for separate rate status unless they respond to all parts of the questionnaire as mandatory respondents. As noted in the ‘‘Respondent Selection’’ section above, the Department requires that respondents submit a response to both the quantity and value questionnaire and the separate–rate application by the respective deadlines in order to receive consideration for separate–rate status. The quantity and value questionnaire will be available on the Department’s website at http://ia.ita.doc.gov/ia– highlights-and–news.html on the date of the publication of this initiation notice in the Federal Register.
Use of Combination Rates in an NME Investigation
The Department will calculate combination rates for certain respondents that are eligible for a separate rate in this investigation. The Separate Rates and Combination Rates Bulletin states:
{w}hile continuing the practice of assigning separate rates only to exporters, all separate rates that the Department will now assign in its NME investigations will be specific to those producers that supplied the exporter during the period of investigation. Note, however, that one rate is calculated for the exporter and all of the producers which supplied subject merchandise to it during the period of investigation. This practice applies both to mandatory respondents receiving an individually calculated separate rate as well as the pool of non–investigated firms receiving the weighted–average of the individually calculated rates. This practice is referred to as the application of ‘‘combination rates’’ because such rates apply to specific combinations of exporters and one or more producers. The cash–deposit rate assigned to an exporter will apply only to merchandise both exported by the firm in question and produced by a firm that supplied the exporter during the period of investigation. See Separate Rates and Combination Rates Bulletin, at 6 (emphasis added).
Distribution of Copies of the Petitions In accordance with section
732(b)(3)(A) of the Act and 19 CFR 351.202(f), copies of the public versions of the Petitions have been provided to the representatives of the Governments of the PRC and Mexico. Because of the
large number of producers/exporters identified in the Petitions, the Department considers the service of the public version of the Petitions to the foreign producers/exporters satisfied by the delivery of the public versions of the Petitions to the Governments of the PRC and Mexico, consistent with 19 CFR 351.203(c)(2).
ITC Notification We have notified the ITC of our
initiations, as required by section 732(d) of the Act.
Preliminary Determinations by the ITC The ITC will preliminarily determine,
no later than November 16, 2009, whether there is a reasonable indication that imports of copper pipe and tube from the PRC and Mexico are materially injuring, or threatening material injury to a U.S. industry. A negative ITC determination with respect to any country will result in the investigation being terminated for that country; otherwise, these investigations will proceed according to statutory and regulatory time limits.
This notice is issued and published pursuant to section 777(i) of the Act.
Dated: October 20, 2009. Ronad K. Lorentzen, Acting Assistant Secretary for Import Administration.
Appendix I
Scope of the Investigations For the purpose of these
investigations, the products covered are all seamless circular refined copper pipes and tubes, including redraw hollows, greater than or equal to 6 inches (152.4 mm) in length and measuring less than 12.130 inches (308.102 mm) (actual) in outside diameter (‘‘OD’’), regardless of wall thickness, bore (e.g., smooth, enhanced with inner grooves or ridges), manufacturing process (e.g., hot finished, cold–drawn, annealed), outer surface (e.g., plain or enhanced with grooves, ridges, fins, or gills), end finish (e.g., plain end, swaged end, flared end, expanded end, crimped end, threaded), coating (e.g., plastic, paint), insulation, attachments (e.g., plain, capped, plugged, with compression or other fitting), or physical configuration (e.g., straight, coiled, bent, wound on spools).
The scope of these investigations covers, but is not limited to, seamless refined copper pipe and tube produced or comparable to the American Society for Testing and Materials (‘‘ASTM’’) ASTM–B42, ASTM–B68, ASTM–B75, ASTM–B88, ASTM–B88M, ASTM– B188, ASTM–B251, ASTM–B251M,
ASTM–B280, ASTM–B302, ASTM– B306, ASTM–359, ASTM–B743, ASTM– B819, and ASTM–B903 specifications and meeting the physical parameters described therein. Also included within the scope of these investigations are all sets of covered products, including ‘‘line sets’’ of seamless refined copper tubes (with or without fittings or insulation) suitable for connecting an outdoor air conditioner or heat pump to an indoor evaporator unit. The phrase ‘‘all sets of covered products’’ denotes any combination of items put up for sale that is comprised of merchandise subject to the scope.
‘‘Refined copper’’ is defined as: (1) metal containing at least 99.85 percent by weight of copper; or (2) metal containing at least 97.5 percent by weight of copper, provided that the content by weight of any other element does not exceed the following limits:
ELEMENT LIMITING CON-TENT PERCENT
BY WEIGHT
Ag - Silver ..................... 0.25 As - Arsenic .................. 0.5 Cd - Cadmium .............. 1.3 Cr - Chromium .............. 1.4 Mg - Magnesium ........... 0.8 Pb - Lead ...................... 1.5 S - Sulfur ...................... 0.7 Sn - Tin ......................... 0.8 Te - Tellurium ............... 0.8 Zn - Zinc ....................... 1.0 Zr - Zirconium ............... 0.3 Other elements (each) .. 0.3
Excluded from the scope of these investigations are all seamless circular hollows of refined copper less than 12 inches in length whose OD (actual) exceeds its length.
The products subject to these investigations are currently classifiable under subheadings 7411.10.1030 and 7411.10.1090 of the Harmonized Tariff Schedule of the United States (‘‘HTSUS’’). Products subject to these investigations may also enter under HTSUS subheadings 7407.10.1500, 7419.99.5050, 8415.90.8065, and 8415.90.8085. Although the HTSUS subheadings are provided for convenience and customs purposes, the written description of the scope of these investigations is dispositive. [FR Doc. E9–25855 Filed 10–26–09; 8:45 am]
BILLING CODE 3510–DS–S
VerDate Nov<24>2008 16:45 Oct 26, 2009 Jkt 220001 PO 00000 Frm 00019 Fmt 4703 Sfmt 4703 E:\FR\FM\27OCN1.SGM 27OCN1pwal
ker
on D
SK
8KY
BLC
1PR
OD
with
NO
TIC
ES
B-1
APPENDIX B
CONFERENCE WITNESSES


B-3
CALENDAR OF THE PUBLIC CONFERENCE
Those listed below appeared as witnesses at the United States International Trade Commission’sconference held in connection with the following investigations:
Subject: Seamless Refined Copper Pipe and Tube from China and Mexico Investigation Nos.: 731-TA-1174-1175 (Preliminary) Date and Time: October 21, 2009 - 9:30 am
The conference was held in Room 101 (Main Hearing Room) of the United States InternationalTrade Commission Building, 500 E Street, SW, Washington, DC.
In Support of the Imposition of Antidumping Duties: DLA Piper LLC
Washington, DCon behalf of
Cerro Flow Products, Inc.KobeWieland Copper Products, LLCMueller Copper Tube Products, Inc.Mueller Copper Tube Company, Inc.
Steffen Sigloch, CEO, KobeWieland Copper Products, LLCJohn Hansen, President-Manufacturing Operations, Mueller Industries, Inc.Bart Arndt, Vice President/Industrial Business Unit Manager, Cerro Flow Products, Inc.Dr. Richard Boyce, President, Econometrica International, Inc.
Jack Levy - OF COUNSEL
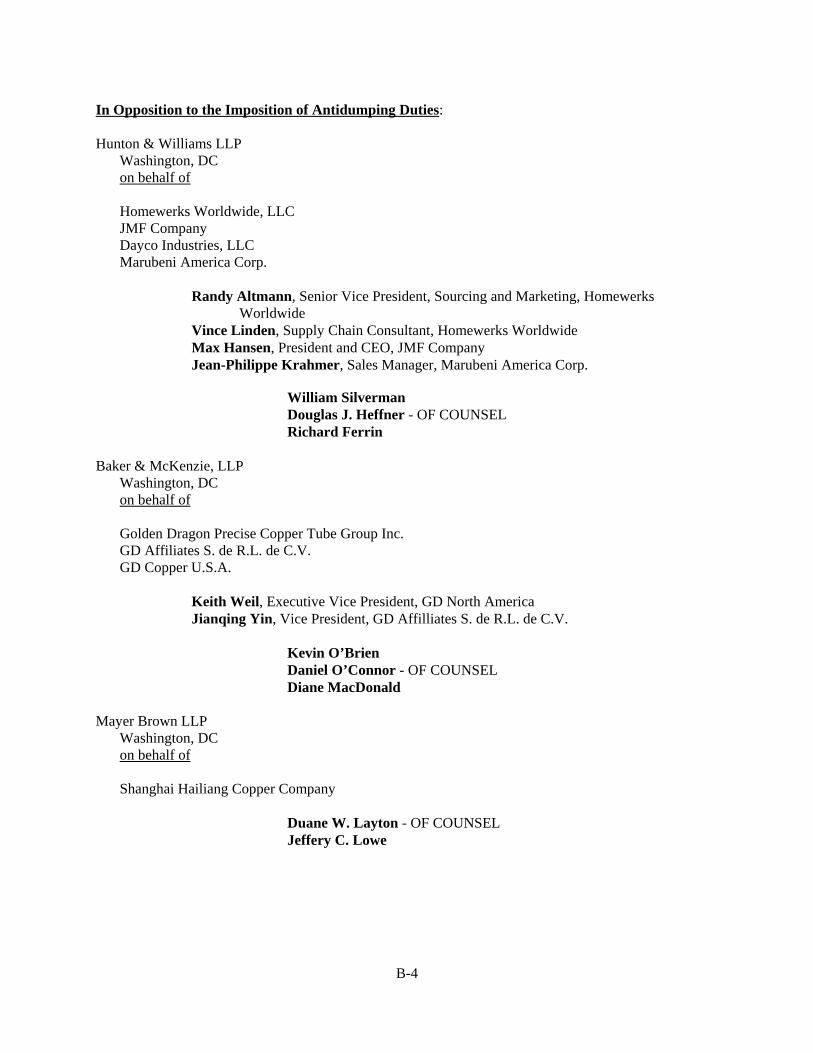
B-4
In Opposition to the Imposition of Antidumping Duties: Hunton & Williams LLP
Washington, DCon behalf of
Homewerks Worldwide, LLCJMF CompanyDayco Industries, LLCMarubeni America Corp.
Randy Altmann, Senior Vice President, Sourcing and Marketing, HomewerksWorldwide
Vince Linden, Supply Chain Consultant, Homewerks WorldwideMax Hansen, President and CEO, JMF CompanyJean-Philippe Krahmer, Sales Manager, Marubeni America Corp.
William SilvermanDouglas J. Heffner - OF COUNSELRichard Ferrin
Baker & McKenzie, LLPWashington, DCon behalf of
Golden Dragon Precise Copper Tube Group Inc. GD Affiliates S. de R.L. de C.V.GD Copper U.S.A.
Keith Weil, Executive Vice President, GD North AmericaJianqing Yin, Vice President, GD Affilliates S. de R.L. de C.V.
Kevin O’BrienDaniel O’Connor - OF COUNSELDiane MacDonald
Mayer Brown LLPWashington, DCon behalf of
Shanghai Hailiang Copper Company
Duane W. Layton - OF COUNSELJeffery C. Lowe

B-5
In Opposition to the Imposition of Antidumping Duties:–Continued
Weil, Gotshal & Manges, LLPWashington, DCon behalf of
IUSA, S.A, de C.V.Nacional de Cobre, S.A. de C.V.
Edward Kerins, Jr., Executive Vice President, Cambridge-Lee Industries LLCSteven Kelly, President, Copper & Brass International Corp.
John RyanJoseph M. Johnson - OF COUNSELMatthew Simpson


C-1
APPENDIX C
SUMMARY DATA


Contains Business Proprietary Information
Table C-1Copper pipe & tube: Summary data concerning the U.S. market, 2006-08, January-June 2008, and January-June 2009
(Quantity=1,000 pounds, value=1,000 dollars, unit values, unit labor costs, and unit expenses are per pound; period changes=percent, except where noted)Reported data Period changes
January-June Jan.-JuneItem 2006 2007 2008 2008 2009 2006-08 2006-07 2007-08 2008-09
U.S. consumption quantity: Amount . . . . . . . . . . . . . . . . . . . 1,134,532 1,000,438 867,776 485,415 370,226 -23.5 -11.8 -13.3 -23.7 Producers' share (1) . . . . . . . . . 77.0 76.0 71.5 71.8 72.0 -5.4 -1.0 -4.5 0.2 Importers' share (1): China . . . . . . . . . . . . . . . . . . . . 8.0 9.1 12.8 13.3 13.3 4.8 1.0 3.7 0.1 Mexico . . . . . . . . . . . . . . . . . . . 7.0 7.5 8.2 8.3 8.5 1.2 0.5 0.7 0.2 Subtotal . . . . . . . . . . . . . . . . . 15.1 16.6 21.0 21.5 21.8 6.0 1.5 4.5 0.3 Other sources . . . . . . . . . . . . . 7.9 7.4 7.4 6.7 6.2 -0.5 -0.5 0.0 -0.5 Total imports . . . . . . . . . . . . . 23.0 24.0 28.5 28.2 28.0 5.4 1.0 4.5 -0.2
U.S. consumption value: Amount . . . . . . . . . . . . . . . . . . . 4,223,796 4,039,017 3,628,503 2,097,736 965,269 -14.1 -4.4 -10.2 -54.0 Producers' share (1) . . . . . . . . . 78.6 77.1 72.5 73.4 74.3 -6.1 -1.5 -4.6 0.9 Importers' share (1): China . . . . . . . . . . . . . . . . . . . . 7.3 8.6 12.3 12.4 11.5 5.0 1.3 3.7 -0.9 Mexico . . . . . . . . . . . . . . . . . . . 6.6 7.0 7.8 7.7 8.2 1.2 0.4 0.7 0.5 Subtotal . . . . . . . . . . . . . . . . . 14.0 15.7 20.1 20.1 19.7 6.1 1.7 4.4 -0.4 Other sources . . . . . . . . . . . . . 7.4 7.2 7.4 6.5 5.9 -0.1 -0.2 0.2 -0.5 Total imports . . . . . . . . . . . . . 21.4 22.9 27.5 26.6 25.7 6.1 1.5 4.6 -0.9
U.S. imports from: China: Quantity . . . . . . . . . . . . . . . . . . 91,113 90,624 111,126 64,439 49,388 22.0 -0.5 22.6 -23.4 Value . . . . . . . . . . . . . . . . . . . . 309,873 348,772 446,282 259,591 110,981 44.0 12.6 28.0 -57.2 Unit value . . . . . . . . . . . . . . . . $3.40 $3.85 $4.02 $4.03 $2.25 18.1 13.2 4.4 -44.2 Ending inventory quantity . . . . 3,124 3,152 6,369 10,351 8,735 103.9 0.9 102.1 -15.6 Mexico: Quantity . . . . . . . . . . . . . . . . . . 79,817 75,199 71,327 40,110 31,340 -10.6 -5.8 -5.1 -21.9 Value . . . . . . . . . . . . . . . . . . . . 279,361 284,287 281,957 162,388 79,376 0.9 1.8 -0.8 -51.1 Unit value . . . . . . . . . . . . . . . . $3.50 $3.78 $3.95 $4.05 $2.53 12.9 8.0 4.6 -37.4 Ending inventory quantity . . . . 6,245 6,542 6,830 8,099 6,923 9.4 4.8 4.4 -14.5 Subtotal: Quantity . . . . . . . . . . . . . . . . . . 170,930 165,823 182,453 104,549 80,728 6.7 -3.0 10.0 -22.8 Value . . . . . . . . . . . . . . . . . . . . 589,233 633,059 728,238 421,979 190,357 23.6 7.4 15.0 -54.9 Unit value . . . . . . . . . . . . . . . . $3.45 $3.82 $3.99 $4.04 $2.36 15.8 10.7 4.5 -41.6 Ending inventory quantity . . . . 9,368 9,694 13,199 18,450 15,658 40.9 3.5 36.2 -15.1 All other sources: Quantity . . . . . . . . . . . . . . . . . . 90,088 74,226 64,441 32,477 22,961 -28.5 -17.6 -13.2 -29.3 Value . . . . . . . . . . . . . . . . . . . . 314,358 292,345 268,218 136,025 57,314 -14.7 -7.0 -8.3 -57.9 Unit value . . . . . . . . . . . . . . . . $3.49 $3.94 $4.16 $4.19 $2.50 19.3 12.9 5.7 -40.4 Ending inventory quantity . . . . 7,157 6,645 1,784 3,014 1,231 -75.1 -7.2 -73.2 -59.2 All sources: Quantity . . . . . . . . . . . . . . . . . . 261,018 240,049 246,894 137,026 103,689 -5.4 -8.0 2.9 -24.3 Value . . . . . . . . . . . . . . . . . . . . 903,592 925,404 996,456 558,004 247,671 10.3 2.4 7.7 -55.6 Unit value . . . . . . . . . . . . . . . . $3.46 $3.86 $4.04 $4.07 $2.39 16.6 11.4 4.7 -41.3 Ending inventory quantity . . . . 16,525 16,339 14,983 21,464 16,889 -9.3 -1.1 -8.3 -21.3
U.S. producers': Average capacity quantity . . . . . 1,221,065 1,209,136 1,091,428 545,627 526,855 -10.6 -1.0 -9.7 -3.4 Production quantity . . . . . . . . . . 884,942 786,635 644,032 360,486 271,249 -27.2 -11.1 -18.1 -24.8 Capacity utilization (1) . . . . . . . . 72.5 65.1 59.0 66.1 51.5 -13.5 -7.4 -6.0 -14.6 U.S. shipments: Quantity . . . . . . . . . . . . . . . . . . 873,514 760,389 620,882 348,389 266,537 -28.9 -13.0 -18.3 -23.5 Value . . . . . . . . . . . . . . . . . . . . 3,320,204 3,113,613 2,632,047 1,539,732 717,598 -20.7 -6.2 -15.5 -53.4 Unit value . . . . . . . . . . . . . . . . $3.80 $4.09 $4.24 $4.42 $2.69 11.5 7.7 3.5 -39.1 Export shipments: Quantity . . . . . . . . . . . . . . . . . . 32,331 31,064 29,239 16,746 12,212 -9.6 -3.9 -5.9 -27.1 Value . . . . . . . . . . . . . . . . . . . . 121,983 126,476 125,222 74,030 32,906 2.7 3.7 -1.0 -55.6 Unit value . . . . . . . . . . . . . . . . $3.77 $4.07 $4.28 $4.42 $2.69 13.5 7.9 5.2 -39.0 Ending inventory quantity . . . . . 55,351 52,864 47,828 48,841 41,008 -13.6 -4.5 -9.5 -16.0 Inventories/total shipments (1) . 6.1 6.7 7.4 6.7 7.4 1.2 0.6 0.7 0.7 Production workers . . . . . . . . . . 3,913 3,628 3,166 3,280 2,730 -19.1 -7.3 -12.7 -16.8 Hours worked (1,000s) . . . . . . . 8,034 7,565 6,571 3,473 2,718 -18.2 -5.8 -13.1 -21.7 Wages paid ($1,000s) . . . . . . . . 148,451 148,136 129,242 69,495 54,963 -12.9 -0.2 -12.8 -20.9 Hourly wages . . . . . . . . . . . . . . . $18.48 $19.58 $19.67 $20.01 $20.22 6.4 6.0 0.4 1.1 Productivity (pounds per hour) . 108.4 102.2 96.2 102.0 98.5 -11.3 -5.7 -6.0 -3.4 Unit labor costs . . . . . . . . . . . . . $0.17 $0.19 $0.20 $0.20 $0.21 20.0 12.4 6.8 4.6 Net sales: Quantity . . . . . . . . . . . . . . . . . . 902,149 778,614 652,123 361,851 278,630 -27.7 -13.7 -16.2 -23.0 Value . . . . . . . . . . . . . . . . . . . . 3,352,765 3,172,202 2,787,044 1,596,519 748,672 -16.9 -5.4 -12.1 -53.1 Unit value . . . . . . . . . . . . . . . . $3.72 $4.07 $4.27 $4.41 $2.69 15.0 9.6 4.9 -39.1 Cost of goods sold (COGS) . . . . 2,984,580 2,876,789 2,549,697 1,480,169 697,925 -14.6 -3.6 -11.4 -52.8 Gross profit or (loss) . . . . . . . . . 368,185 295,413 237,347 116,350 50,747 -35.5 -19.8 -19.7 -56.4 SG&A expenses . . . . . . . . . . . . 77,987 71,597 65,984 32,260 28,727 -15.4 -8.2 -7.8 -11.0 Operating income or (loss) . . . . 290,198 223,816 171,363 84,090 22,020 -40.9 -22.9 -23.4 -73.8 Capital expenditures . . . . . . . . . 30,744 40,816 43,361 20,500 17,099 41.0 32.8 6.2 -16.6 Unit COGS . . . . . . . . . . . . . . . . $3.31 $3.69 $3.91 $4.09 $2.50 18.2 11.7 5.8 -38.8 Unit SG&A expenses . . . . . . . . . $0.09 $0.09 $0.10 $0.09 $0.10 17.0 6.4 10.0 15.6 Unit operating income or (loss) . $0.32 $0.29 $0.26 $0.23 $0.08 -18.3 -10.6 -8.6 -66.0 COGS/sales (1) . . . . . . . . . . . . . 89.0 90.7 91.5 92.7 93.2 2.5 1.7 0.8 0.5 Operating income or (loss)/ sales (1) . . . . . . . . . . . . . . . . . 8.7 7.1 6.1 5.3 2.9 -2.5 -1.6 -0.9 -2.3
(1) "Reported data" are in percent and "period changes" are in percentage points.
Note.--Financial data are reported on a fiscal year basis and may not necessarily be comparable to data reported on a calendar year basis. Because of rounding,figures may not add to the totals shown. Unit values and shares are calculated from the unrounded figures.
Source: Compiled from data submitted in response to Commission questionnaires and from official Commerce statistics.
C-3

Table C-2Copper pipe and tube: Summary data concerning the U.S. market (excluding Wolverinefrom domestic industry), 2006-08, January-June 2008, and January-June 2009
* * * * * * *
C-4

D-1
APPENDIX D
TARIFF TREATMENT


Harmonized Tariff Schedule of the United States (2009) (Rev. 1)Annotated for Statistical Reporting Purposes
XV74-5
Heading/ Stat. Unit Rates of Duty Subheading Suf- Article Description of 1 2 fix Quantity General Special
7404.00 Copper waste and scrap:7404.00.30 Spent anodes; waste and scrap with a copper content
of less than 94 percent by weight . . . . . . . . . . . . . . . . . . . . . . . . . . . Free 6% 20 Of refined copper . . . . . . . . . . . . . . . . . . . . . . . . . . . kg
Of copper alloys: Of copper-zinc base alloys (brass): 45 Containing more than 0.3 percent of lead . . . kg 55 Other . . . . . . . . . . . . . . . . . . . . . . . . . . . . . . . kg 65 Of copper-tin base alloys (bronze) . . . . . . . . . . . kg 90 Other . . . . . . . . . . . . . . . . . . . . . . . . . . . . . . . . . . kg
7404.00.60 Other . . . . . . . . . . . . . . . . . . . . . . . . . . . . . . . . . . . . . . . . . . . . . . . . . Free 6% 20 Of refined copper . . . . . . . . . . . . . . . . . . . . . . . . . . . kg
Of copper alloys: Of copper-zinc base alloys (brass): 45 Containing more than 0.3 percent of lead . . . kg 55 Other . . . . . . . . . . . . . . . . . . . . . . . . . . . . . . . kg 65 Of copper-tin base alloys (bronze) . . . . . . . . . . . kg 90 Other . . . . . . . . . . . . . . . . . . . . . . . . . . . . . . . . . . kg
7405.00 Master alloys of copper:7405.00.10 00 Containing by weight 5 percent or more but not more
than 15 percent of phosphorus . . . . . . . . . . . . . . . . . . . . kg . . . . . . Free 12%
7405.00.60 Other . . . . . . . . . . . . . . . . . . . . . . . . . . . . . . . . . . . . . . . . . . . . . . . . . Free 28% 30 Beryllium copper master alloy . . . . . . . . . . . . . . . . . . kg 50 Other . . . . . . . . . . . . . . . . . . . . . . . . . . . . . . . . . . . . . kg
7406 Copper powders and flakes:7406.10.00 00 Powders of non-lamellar structure . . . . . . . . . . . . . . . . . kg . . . . . . Free 49%7406.20.00 00 Powders of lamellar structure; flakes . . . . . . . . . . . . . . . kg . . . . . . Free 12%
7407 Copper bars, rods and profiles:7407.10 Of refined copper:
Profiles:7407.10.15 00 Hollow profiles . . . . . . . . . . . . . . . . . . . . . . . . . . kg . . . . . . 3% Free (A,AU,BH,CA, 48%
CL,E,IL,J,JO,MA, MX,OM,P,PE,SG)
7407.10.30 00 Other . . . . . . . . . . . . . . . . . . . . . . . . . . . . . . . . . . kg . . . . . . 3% Free (A,AU,BH,CA, 48% CL,E,IL,J,JO,MA, MX,OM,P,PE,SG)
7407.10.50 Bars and rods . . . . . . . . . . . . . . . . . . . . . . . . . . . . . . . . . . . . . . . 1% Free (A,AU,BH,CA, 7% CL,E,IL,J,JO,MA, MX,OM,P,PE,SG)
10 Having a rectangular cross section . . . . . . . . . . . kg 50 Other . . . . . . . . . . . . . . . . . . . . . . . . . . . . . . . . . . kg
Of copper alloys:7407.21 Of copper-zinc base alloys (brass):
Profiles:7407.21.15 00 Hollow profiles . . . . . . . . . . . . . . . . . . . . . . . kg . . . . . . 2.2% Free (A,AU,BH,CA, 17%
CL,E,IL,J,JO,MA, MX,OM,P,PE,SG)
7407.21.30 00 Other . . . . . . . . . . . . . . . . . . . . . . . . . . . . . . . kg . . . . . . 2.2% Free (A,AU,BH,CA, 17% CL,E,IL,J,JO,MA, MX,OM,P,PE,SG)
Bars and rods:7407.21.50 00 Low fuming brazing rods . . . . . . . . . . . . . . . . kg . . . . . . 2.2% Free (A,AU,BH,CA, 9%
CL,E,IL,J,JO,MA, MX,OM,P,PE,SG)
Other:7407.21.70 00 Having a rectangular cross section . . . . kg . . . . . . 1.9% Free (A,AU,BH,CA, 9%
CL,E,IL,J,JO,MA, MX,OM,P,PE,SG)
7407.21.90 00 Other . . . . . . . . . . . . . . . . . . . . . . . . . . . . kg . . . . . . 2.2% Free (A*,AU,BH, 9% CA,CL,E,IL,J,JO, MA,MX,OM, P,PE,SG)
Harmonized Tariff Schedule of the United States (2009) (Rev. 1)Annotated for Statistical Reporting Purposes
XV74-10 Heading/ Stat. Unit Rates of Duty Subheading Suf- Article Description of 1 2 fix Quantity General Special
7410 Copper foil (whether or not printed or backed with paper, paperboard, plastics or similar backing materials) of a thickness (excluding any backing) not exceeding 0.15 mm:
Not backed:7410.11.00 00 Of refined copper . . . . . . . . . . . . . . . . . . . . . . . . . . . kg . . . . . . 1% Free (A,AU,BH,CA, 6.5%
CL,E,IL,J,JO,MA, MX,OM,P,PE,SG)
7410.12.00 Of copper alloys . . . . . . . . . . . . . . . . . . . . . . . . . . . . . . . . . . . . . 1% Free (A,AU,BH,CA, 6.5% CL,E,IL,J,JO,MA, MX,OM,P,PE,SG)
30 Of copper-zinc base alloys (brass) . . . . . . . . . . . kg 60 Other . . . . . . . . . . . . . . . . . . . . . . . . . . . . . . . . . . kg
Backed:7410.21 Of refined copper:7410.21.30 Copper clad laminates . . . . . . . . . . . . . . . . . . . . . . . . . . . . 3% Free (A,AU,BH,CA, 80%
CL,E,IL,J,JO,MA, MX,OM,P,PE,SG)
Having a base wholly of plasticsimpregnated glass:
20 Having copper on one side only . . . . . . . m2
kg 40 Having copper on both sides . . . . . . . . . m2
kg 60 Other . . . . . . . . . . . . . . . . . . . . . . . . . . . . . . . m2
kg7410.21.60 00 Other . . . . . . . . . . . . . . . . . . . . . . . . . . . . . . . . . . kg . . . . . . 1.5% Free (A,AU,BH,CA, 6%
CL,E,IL,J,JO,MA, MX,OM,P,PE,SG)
7410.22.00 00 Of copper alloys . . . . . . . . . . . . . . . . . . . . . . . . . . . . kg . . . . . . 1.5% Free (A,AU,BH,CA, 6% CL,E,IL,J,JO,MA, MX,OM,P,PE,SG)
7411 Copper tubes and pipes:7411.10 Of refined copper:7411.10.10 Seamless . . . . . . . . . . . . . . . . . . . . . . . . . . . . . . . . . . . . . . . . . . 1.5% Free (A,AU,BH,CA, 13%
CL,E,IL,J,JO,MA, MX,OM,P,PE,SG)
30 Having an outside diameter of 6 mm or more but not exceeding 16 mm, in coils on spools . . . kg
90 Other . . . . . . . . . . . . . . . . . . . . . . . . . . . . . . . . . . kg7411.10.50 00 Other . . . . . . . . . . . . . . . . . . . . . . . . . . . . . . . . . . . . . kg . . . . . . 3% Free (A,AU,BH,CA, 47%
CL,E,IL,J,JO,MA, MX,OM,P,PE,SG)
Of copper alloys:7411.21 Of copper-zinc base alloys (brass):7411.21.10 00 Seamless . . . . . . . . . . . . . . . . . . . . . . . . . . . . . . kg . . . . . . 1.4% Free (A,AU,BH,CA, 10%
CL,E,IL,J,JO,MA, MX,OM,P,PE,SG)
7411.21.50 00 Other . . . . . . . . . . . . . . . . . . . . . . . . . . . . . . . . . . kg . . . . . . 3% Free (A*,AU,BH, 49% CA,CL,E,IL,J,JO, MA,MX,OM, P,PE,SG)
7411.22.00 00 Of copper-nickel base alloys (cupro-nickel) or copper-nickel-zinc base alloys (nickel-silver) . . . . . . kg . . . . . . 3% Free (A,AU,BH,CA, 47%
CL,E,IL,J,JO,MA, MX,OM,P,PE,SG)
7411.29 Other:7411.29.10 00 Seamless . . . . . . . . . . . . . . . . . . . . . . . . . . . . . . kg . . . . . . 1.4% Free (A,AU,BH,CA, 10%
CL,E,IL,J,JO,MA, MX,OM,P,PE,SG)
7411.29.50 00 Other . . . . . . . . . . . . . . . . . . . . . . . . . . . . . . . . . . kg . . . . . . 3% Free (A,AU,BH,CA, 49% CL,E,IL,J,JO,MA, MX,OM,P,PE,SG)

Harmonized Tariff Schedule of the United States (2009) (Rev. 1)Annotated for Statistical Reporting Purposes
XV74-14 Heading/ Stat. Unit Rates of Duty Subheading Suf- Article Description of 1 2 fix Quantity General Special
7419 Other articles of copper:7419.10.00 00 Chain and parts thereof . . . . . . . . . . . . . . . . . . . . . . . . . . kg . . . . . . 3% Free (A,B,AU,BH, 45%
CA,CL,E,IL,J,JO, MA,MX,OM, P,PE,SG)
Other:7419.91.00 Cast, molded, stamped or forged, but not further
worked . . . . . . . . . . . . . . . . . . . . . . . . . . . . . . . . . . . . . . . . . . . . . Free 46% 10 Brass plumbing goods, not elsewhere specified
or included . . . . . . . . . . . . . . . . . . . . . . . . . . . . . kg 50 Other . . . . . . . . . . . . . . . . . . . . . . . . . . . . . . . . . . kg
7419.99 Other:Cloth (including endless bands), grill andnetting, of copper wire; expanded metal ofcopper:
Cloth:7419.99.03 00 Fourdrinier wires, seamed or not
seamed, suitable for use in paper-making machines, with 94 or morewires to the lineal centimeter . . . . . . . . . m2 . . . . . . Free 75%
kg7419.99.06 Other . . . . . . . . . . . . . . . . . . . . . . . . . . . . . . . . . . . . . 3% Free (A,AU,BH,CA, 43%
CL,E,IL,J,JO,MA, MX,OM,P,PE,SG)
60 Fourdrinier wires, seamed or notseamed, suitable for use in paper-making machines, with fewer than94 or more wires to the linealcentimeter . . . . . . . . . . . . . . . . . . . . m2
kg 80 Other . . . . . . . . . . . . . . . . . . . . . . . . m2
kg
7419.99.09 00 Other . . . . . . . . . . . . . . . . . . . . . . . . . . . . . . . kg . . . . . . 3% Free (A,AU,B,BH, 43% CA,CL,E,IL,J,JO, MA,MX,OM, P,PE,SG)
7419.99.15 00 Containers of a kind normally carried on the person, in the pocket or in the handbag . . . . . . . doz. . . . . 3% Free (AU,BH,CA,D, 110%
CL,E,IL,J,JO,MA, MX,OM,P,PE,SG)
7419.99.16 00 Copper springs . . . . . . . . . . . . . . . . . . . . . . . . . . kg . . . . . . 3% Free (A,AU,B,BH, 45% CA,CL,E,IL,J,JO, MA,MX,OM, P,PE,SG)
Other:7419.99.30 00 Coated or plated with precious metal . . . . . . kg . . . . . . 3% Free (A,AU,BH,CA, 65%
CL,E,IL,J,JO,MA, MX,OM,P,PE,SG)
7419.99.50 Other . . . . . . . . . . . . . . . . . . . . . . . . . . . . . . . . . . . . . . . . Free 46% 10 Brass plumbing goods not elsewhere
specified or included . . . . . . . . . . . . . . . . kg
50 Other . . . . . . . . . . . . . . . . . . . . . . . . . . . . kg

Harmonized Tariff Schedule of the United States (2009) (Rev. 1)Annotated for Statistical Reporting Purposes
XVI84-20 Heading/ Stat. Unit Rates of Duty Subheading Suf- Article Description of 1 2 fix Quantity General Special
8414 Air or vacuum pumps, air or other gas compressors and(con.) fans; ventilating or recycling hoods incorporating a fan,
whether or not fitted with filters; parts thereof (con.):8414.90 Parts:8414.90.10 Of fans (including blowers) and ventilating or
recycling hoods . . . . . . . . . . . . . . . . . . . . . . . . . . . . . . . . . . . . . . 4.7% Free (A,AU,B,BH, 35% C,CA,CL,E,IL,J, JO,MA,MX,OM,P, PE,SG)
40 Of fans of subheading 8414.51.00 . . . . . . . . . . . X 80 Other . . . . . . . . . . . . . . . . . . . . . . . . . . . . . . . . . . X
Of compressors:8414.90.30 00 Stators and rotors of goods of subheading
8414.30 . . . . . . . . . . . . . . . . . . . . . . . . . . . . . . . . No. . . . . . Free 35%
8414.90.41 Other . . . . . . . . . . . . . . . . . . . . . . . . . . . . . . . . . . . . . . . . . . . Free 35%Of refrigerating and air conditioning compressors:
20 Compressor housings . . . . . . . . . . . . . . . No. 40 Other . . . . . . . . . . . . . . . . . . . . . . . . . . . . X
Other:Of compressors of subheading 8414.40:
45 Compressor housings . . . . . . . . . . . No. 55 Other . . . . . . . . . . . . . . . . . . . . . . . . X
Other: 65 Compressor housings . . . . . . . . . . . No. 75 Other . . . . . . . . . . . . . . . . . . . . . . . . X
8414.90.90 Other . . . . . . . . . . . . . . . . . . . . . . . . . . . . . . . . . . . . . . . . . . . . . . Free 35% 40 Of vacuum pumps . . . . . . . . . . . . . . . . . . . . . . . . X 80 Other . . . . . . . . . . . . . . . . . . . . . . . . . . . . . . . . . . X
8415 Air conditioning machines, comprising a motor-driven fan and elements for changing the temperature and humidity, including those machines in which the humidity cannot be separately regulated; parts thereof:
8415.10 Window or wall types, self-contained or “split-system”:8415.10.30 Self-contained . . . . . . . . . . . . . . . . . . . . . . . . . . . . . . . . . . . . . . . Free 35%
40 Less than 2.93 kW per hour . . . . . . . . . . . . . . . . No. 60 2.93 kW per hour or greater but less
than 4.98 kW per hour . . . . . . . . . . . . . . . . . . . . No.
80 4.98 kW per hour or greater . . . . . . . . . . . . . . . . No.Other:
8415.10.60 00 Incorporating a refrigerating unit and a valve for reversal of the cooling/heat cycle (reversible heat pumps) . . . . . . . . . . . . . . . No. . . . . . 1% Free (A,AU,B,BH, 35%
C,CA,CL,E,IL,J, JO,MA,MX,OM,P, PE,SG)
8415.10.90 00 Other . . . . . . . . . . . . . . . . . . . . . . . . . . . . . . . . . . No. . . . . . 2.2% Free (A,AU,B,BH, 35% C,CA,CL,E,IL,J,
JO,MA,MX,OM,P, PE,SG)
8415.20.00 00 Of a kind used for persons, in motor vehicles . . . . . . . . . No. . . . . . 1.4% Free (A,AU,B,BH, 35% CA,CL,E,IL,J,JO, MA,MX,OM,P,PE, SG)

Harmonized Tariff Schedule of the United States (2009) (Rev. 1)Annotated for Statistical Reporting Purposes
XVI84-21
Heading/ Stat. Unit Rates of Duty Subheading Suf- Article Description of 1 2 fix Quantity General Special
8415 Air conditioning machines, comprising a motor-driven fan (con.) and elements for changing the temperature and humidity,
including those machines in which the humidity cannot be separately regulated; parts thereof (con.):
Other, except parts:8415.81.01 Incorporating a refrigerating unit and a
valve for reversal of the cooling/heat cycle (reversible heat pumps) . . . . . . . . . . . . . . . . . . . . . . . . . . . 1% Free (A,AU,B,BH, 35%
C,CA,CL,E,IL,J, JO,MA,MX,OM,P, PE,SG)
Self-contained: 10 Not exceeding 17.58 kW per hour . . . . . . . . No. 20 Exceeding 17.58 kW per hour . . . . . . . . . . . No. 30 Other . . . . . . . . . . . . . . . . . . . . . . . . . . . . . . . . . . No.
8415.82.01 Other, incorporating a refrigerating unit . . . . . . . . . . . . . . . . . . . 2.2% Free (A,AU,B,BH, 35% C,CA,CL,E,IL,J, JO,MA,MX,OM,P, PE,SG)
Self-contained machines and remotecondenser type air conditioners other than year-round units:
05 Not exceeding 17.58 kW per hour . . . . . . . . No. 10 Exceeding 17.58 kW per hour . . . . . . . . . . . No.
Year-round units (heating and cooling): 15 Not exceeding 17.58 kW per hour . . . . . . . . No. 20 Exceeding 17.58 kW per hour . . . . . . . . . . . No.
Room or central station air conditioning units for use with water chillers:
30 Room fan coil units . . . . . . . . . . . . . . . . . . . . No. 35 Central station air handlers . . . . . . . . . . . . . . No. 40 Other . . . . . . . . . . . . . . . . . . . . . . . . . . . . . . . No.
Dehumidifiers: 55 With a rated water removal capacity of
less than 35 liters over a 24 hour period . . . . No.
60 Other . . . . . . . . . . . . . . . . . . . . . . . . . . . . . . . No. 70 Other air conditioning machines incorporating
a refrigerating unit . . . . . . . . . . . . . . . . . . . . . . . . No.
8415.83.00 Not incorporating a refrigerating unit . . . . . . . . . . . . . . . . . . . . . . 1.4% Free (A,AU,B,BH, 35% C,CA,CL,E,IL,J, JO,MA,MX,OM,P, PE,SG)
Heat exchangers including condensing units:Condensing units:
50 Not exceeding 17.58 kW per hour . . . . . No. 60 Exceeding 17.58 kW per hour . . . . . . . . No. 70 Other . . . . . . . . . . . . . . . . . . . . . . . . . . . . . . . No. 90 Other air conditioning machines not
incorporating a refrigerating unit . . . . . . . . . . . . . No.
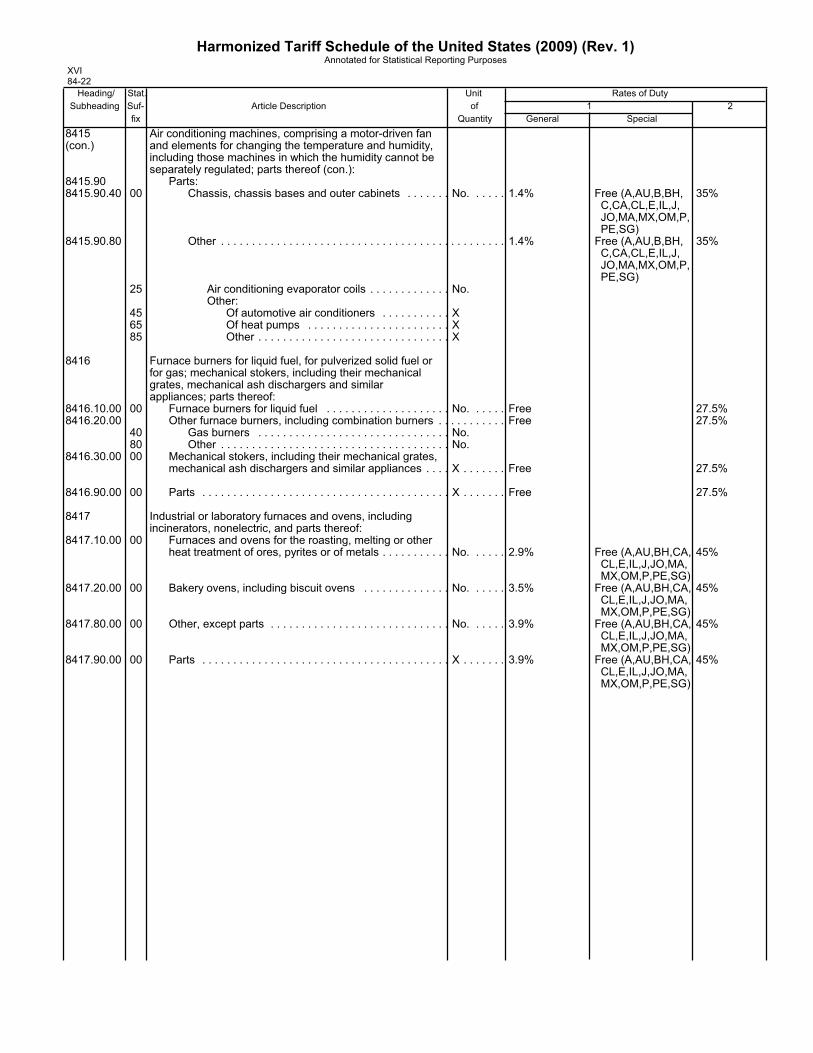
Harmonized Tariff Schedule of the United States (2009) (Rev. 1)Annotated for Statistical Reporting Purposes
XVI84-22 Heading/ Stat. Unit Rates of Duty Subheading Suf- Article Description of 1 2 fix Quantity General Special
8415 Air conditioning machines, comprising a motor-driven fan (con.) and elements for changing the temperature and humidity,
including those machines in which the humidity cannot be separately regulated; parts thereof (con.):
8415.90 Parts:8415.90.40 00 Chassis, chassis bases and outer cabinets . . . . . . . No. . . . . . 1.4% Free (A,AU,B,BH, 35%
C,CA,CL,E,IL,J, JO,MA,MX,OM,P, PE,SG)
8415.90.80 Other . . . . . . . . . . . . . . . . . . . . . . . . . . . . . . . . . . . . . . . . . . . . . . 1.4% Free (A,AU,B,BH, 35% C,CA,CL,E,IL,J, JO,MA,MX,OM,P, PE,SG)
25 Air conditioning evaporator coils . . . . . . . . . . . . . No.Other:
45 Of automotive air conditioners . . . . . . . . . . . X 65 Of heat pumps . . . . . . . . . . . . . . . . . . . . . . . X 85 Other . . . . . . . . . . . . . . . . . . . . . . . . . . . . . . . X
8416 Furnace burners for liquid fuel, for pulverized solid fuel or for gas; mechanical stokers, including their mechanical grates, mechanical ash dischargers and similar appliances; parts thereof:
8416.10.00 00 Furnace burners for liquid fuel . . . . . . . . . . . . . . . . . . . . No. . . . . . Free 27.5%8416.20.00 Other furnace burners, including combination burners . . . . . . . . . . . Free 27.5%
40 Gas burners . . . . . . . . . . . . . . . . . . . . . . . . . . . . . . . No. 80 Other . . . . . . . . . . . . . . . . . . . . . . . . . . . . . . . . . . . . . No.
8416.30.00 00 Mechanical stokers, including their mechanical grates, mechanical ash dischargers and similar appliances . . . . X . . . . . . . Free 27.5%
8416.90.00 00 Parts . . . . . . . . . . . . . . . . . . . . . . . . . . . . . . . . . . . . . . . . X . . . . . . . Free 27.5%
8417 Industrial or laboratory furnaces and ovens, including incinerators, nonelectric, and parts thereof:
8417.10.00 00 Furnaces and ovens for the roasting, melting or other heat treatment of ores, pyrites or of metals . . . . . . . . . . . No. . . . . . 2.9% Free (A,AU,BH,CA, 45%
CL,E,IL,J,JO,MA, MX,OM,P,PE,SG)
8417.20.00 00 Bakery ovens, including biscuit ovens . . . . . . . . . . . . . . No. . . . . . 3.5% Free (A,AU,BH,CA, 45% CL,E,IL,J,JO,MA, MX,OM,P,PE,SG)
8417.80.00 00 Other, except parts . . . . . . . . . . . . . . . . . . . . . . . . . . . . . No. . . . . . 3.9% Free (A,AU,BH,CA, 45% CL,E,IL,J,JO,MA, MX,OM,P,PE,SG)
8417.90.00 00 Parts . . . . . . . . . . . . . . . . . . . . . . . . . . . . . . . . . . . . . . . . X . . . . . . . 3.9% Free (A,AU,BH,CA, 45% CL,E,IL,J,JO,MA, MX,OM,P,PE,SG)
E-1
APPENDIX E
NONSUBJECT COUNTRY PRICE DATA

E-3
One importer (***) reported price data for nonsubject country Malaysia for product 3; no otherprice data for nonsubject countries was reported. In comparing nonsubject country pricing data with U.S.producer pricing data, prices for product imported from nonsubject countries were lower than prices forU.S. produced product in five instances and higher in seven instances. In comparing nonsubject countrypricing data with subject country pricing data, prices for product imported from nonsubject countries werelower than prices for product imported from subject countries in six instances and higher in 10 instances. Specifically, prices for product imported from nonsubject countries were lower than prices for productimported from China in five instances and higher in seven instances; and nonsubject prices were lowerthan prices for product imported from Mexico in one instance and higher in three instances. Price andquantity data for Malaysia as well as U.S. and subject sources are shown in figure E-1.
Figure D-1SRC pipe and tube: Weighted-average f.o.b. prices and quantities of domestic and importedproduct, by quarters, January 2006-June 2009
* * * * * * *