Embed Size (px)
Citation preview
1
QL+ Body Temperature Regulating Vest
Project 43.a.01
QL+ Challenger: Lisa Maddox
Faculty Advisor: Dr. Richard Savage
Team Members
Melissa Goss [email protected] BMED
Brittnee Cubero [email protected] BMED
Dillon Lynch [email protected] MATE
Greg Olsen [email protected] MATE
Julian Jazayeri [email protected] GENE
March, 2012
2
Statement of Disclaimer
This project is a result of a class assignment, and it has been graded and accepted as a
fulfillment of the course requirements. Acceptance does not imply technical accuracy or
reliability. Any use of information in this report is done at the risk of the user. These risks may
include catastrophic failure of the device or infringement of patent or copyright laws. California
Polytechnic State University at San Luis Obispo and its staff cannot be held liable for any use or
misuse of the project.
3
Table of Contents Abstract ........................................................................................................................................................ 6
Chapter 1: Introduction .............................................................................................................................. 7
Stakeholders/Target Audience ............................................................................................................. 7
Challenger background and needs...................................................................................................... 7
Purpose of the project ........................................................................................................................... 7
Project & Team Description .................................................................................................................. 7
Chapter 2: Background ............................................................................................................................. 8
Existing Products .................................................................................................................................... 8
Ice-Pack Vest ...................................................................................................................................... 8
Evaporative Cooling Vests ................................................................................................................ 8
Phase Change Vests ......................................................................................................................... 8
Fluid Cooling ....................................................................................................................................... 9
Air Cooling ........................................................................................................................................... 9
Studies of Interest .................................................................................................................................. 9
Thermoelectric Cooling ..................................................................................................................... 9
Evaporative Cooling ........................................................................................................................... 9
Codes and Standards ............................................................................................................................ 9
Chapter 3: Design Development ............................................................................................................ 11
Objectives .............................................................................................................................................. 11
Customer Requirements ................................................................................................................. 11
Project Requirements ...................................................................................................................... 11
Conceptual Models .............................................................................................................................. 14
Liquid Cooling Vest .......................................................................................................................... 14
Evaporative Cooling Vest .................................................................................................................... 14
Conductive Material Vest ................................................................................................................ 15
Concept Selection ................................................................................................................................ 15
Supporting Preliminary Analysis ........................................................................................................ 16
Chapter 4: Description of the Final Prototype Design ........................................................................ 22
Detailed Design Description ............................................................................................................... 23
Schematics ............................................................................................................................................ 23
Body to Vest Interface ..................................................................................................................... 25
4
Safety Considerations ......................................................................................................................... 29
Maintenance and Repair Considerations ......................................................................................... 29
Chapter 5: Product Realization .............................................................................................................. 30
Chapter 6: Design Verification Plan (Testing) ...................................................................................... 31
Test #1: Body to Vest Human Test while Exercising ...................................................................... 31
Test # 2: Body to Vest Human Test while Stationary ..................................................................... 32
Chapter 7: Conclusions & Recommendations ..................................................................................... 38
Chapter 8: Management Plan ................................................................................................................ 39
References ................................................................................................................................................ 41
Appendix A .............................................................................................................................................. 42
Appendix B .............................................................................................................................................. 44
Appendix C .............................................................................................................................................. 45
Appendix D .............................................................................................................................................. 46
Appendix E............................................................................................................................................... 53
Appendix F ............................................................................................................................................... 55
Appendix G ................................................................................................................................................ 57
Appendix H ................................................................................................................................................ 69
5
Figure 1. Liquid Cooling Vest Configuration. ....................................................................................... 14
Figure 2. Evaporative Cooling Vest Configuration. ............................................................................. 15
Figure 3. Conductive Material and Phase Change Cooling Vest. .................................................... 15
Figure 4. Seven Stages of Heat Transfer Thermal Bock Diagram. .................................................. 21
Figure 5. CAD Model of Thermal Vest. ................................................................................................. 22
Figure 6. Device System Block Diagram. ............................................................................................. 23
Figure 7. Body to Vest Interface Configuration. .................................................................................. 25
Figure 8. Internal Fabric Layer. .............................................................................................................. 25
Figure 9. Tubing Configuration ............................................................................................................... 26
Figure 10. External Layer Configuration. .............................................................................................. 27
Figure 11. Expanded View of Cooling Module. ................................................................................... 27
Figure 12. Expanded View of Cooling Reservoir. ............................................................................... 28
Figure 13. Heat Dissipation Assemblly. ................................................................................................ 29
Figure 14.. Body to Vest Exercising Test Data .................................................................................... 31
Figure 15. Static Vest Temperature Data ............................................................................................. 32
Figure 16. Body to Vest Insulative Layer Data .................................................................................... 33
Figure 17. Body to Vest Aluminum Container Model Setup .............................................................. 34
Figure 18. Heat Exchanger Inlet and Outlet Temperatures ............................................................... 34
Figure 19. Thermoelectric Performance Test Setup ........................................................................... 35
Figure 20. Thermoelectric Hot and Cold Plate Temperature Difference ......................................... 36
Figure 21. System Model Configuration. .............................................................................................. 37
Figure 22. System Reservoir and Core Body Temperatures ............................................................ 37

6
Abstract The purpose of this project is to design a thermal vest to be worn by individuals with spinal injuries to help regulate their core body temperature. Individuals with spinal injuries have impaired thermoregulation abilities which increase their susceptibility to succumbing to either heat stroke or hypothermia. This project focused on preventing heat stroke by inducing a cooling mechanism. To provide this cooling mechanism, a thermoelectric cooler was used to chill water in a reservoir. This water is then pumped through tubing sewn into the vest. The chilled water will absorb heat from the human body and return to the reservoir. At this point the water will then be re-chilled and recirculated. Testing regarding this method showed that 550 BTUs per hour of heat from the human body. This is almost half the amount of heat dissipated by the human body to maintain a core body temperature of 98.6⁰F. Further testing also verified that the chosen materials are biocompatible and capable of reducing body temperature.
7
Chapter 1: Introduction
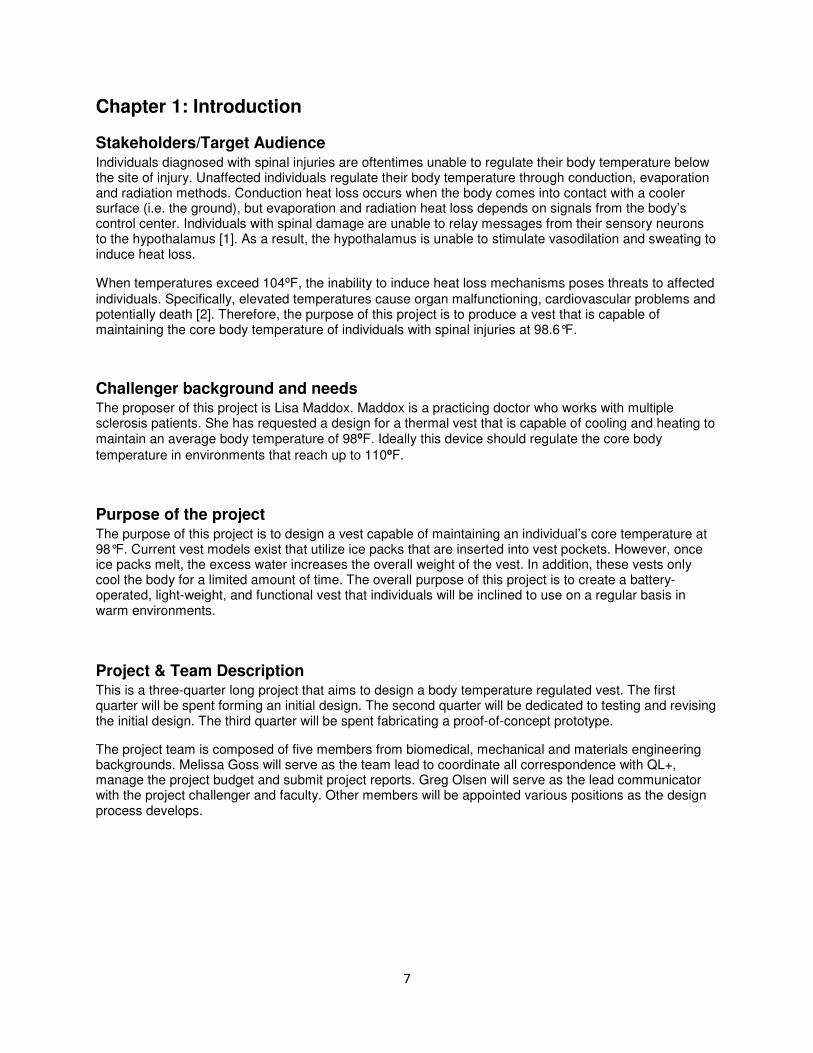
Stakeholders/Target Audience Individuals diagnosed with spinal injuries are oftentimes unable to regulate their body temperature below the site of injury. Unaffected individuals regulate their body temperature through conduction, evaporation and radiation methods. Conduction heat loss occurs when the body comes into contact with a cooler surface (i.e. the ground), but evaporation and radiation heat loss depends on signals from the body’s control center. Individuals with spinal damage are unable to relay messages from their sensory neurons to the hypothalamus [1]. As a result, the hypothalamus is unable to stimulate vasodilation and sweating to induce heat loss.
When temperatures exceed 104⁰F, the inability to induce heat loss mechanisms poses threats to affected individuals. Specifically, elevated temperatures cause organ malfunctioning, cardiovascular problems and potentially death [2]. Therefore, the purpose of this project is to produce a vest that is capable of maintaining the core body temperature of individuals with spinal injuries at 98.6°F.
Challenger background and needs The proposer of this project is Lisa Maddox. Maddox is a practicing doctor who works with multiple sclerosis patients. She has requested a design for a thermal vest that is capable of cooling and heating to maintain an average body temperature of 98⁰F. Ideally this device should regulate the core body temperature in environments that reach up to 110⁰F.
Purpose of the project The purpose of this project is to design a vest capable of maintaining an individual’s core temperature at 98°F. Current vest models exist that utilize ice packs that are inserted into vest pockets. However, once ice packs melt, the excess water increases the overall weight of the vest. In addition, these vests only cool the body for a limited amount of time. The overall purpose of this project is to create a battery-operated, light-weight, and functional vest that individuals will be inclined to use on a regular basis in warm environments.
Project & Team Description This is a three-quarter long project that aims to design a body temperature regulated vest. The first quarter will be spent forming an initial design. The second quarter will be dedicated to testing and revising the initial design. The third quarter will be spent fabricating a proof-of-concept prototype.
The project team is composed of five members from biomedical, mechanical and materials engineering backgrounds. Melissa Goss will serve as the team lead to coordinate all correspondence with QL+, manage the project budget and submit project reports. Greg Olsen will serve as the lead communicator with the project challenger and faculty. Other members will be appointed various positions as the design process develops.
8
Chapter 2: Background
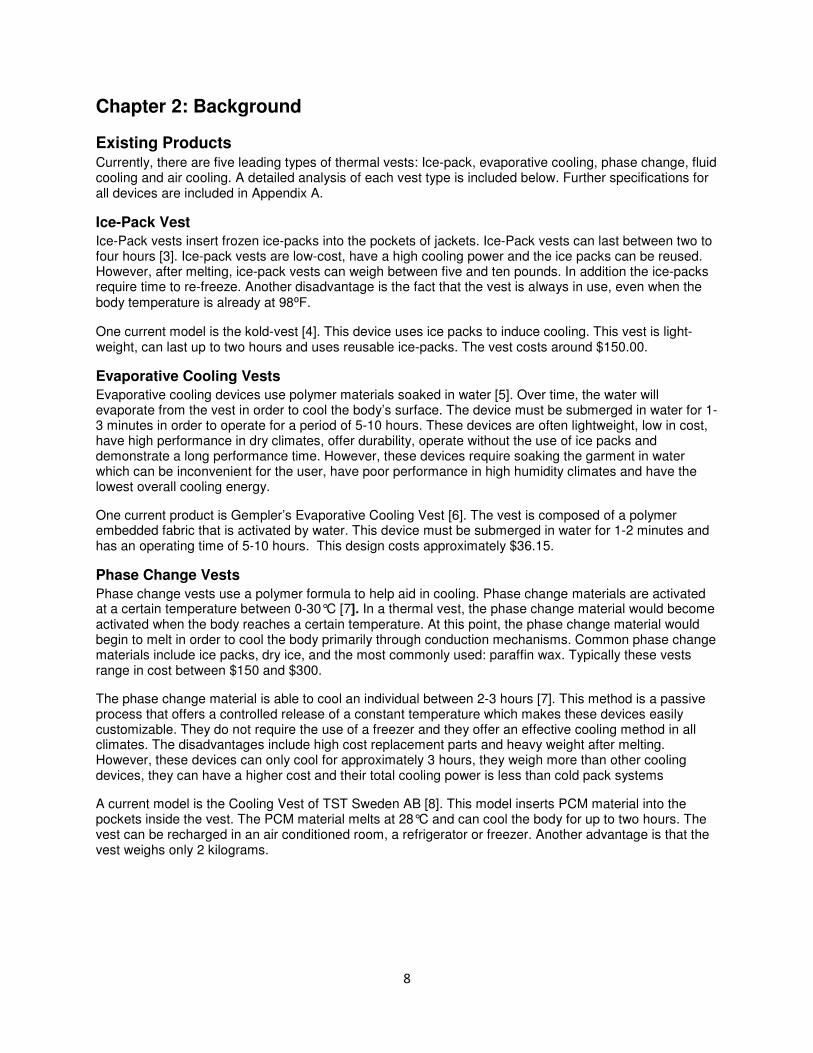
Existing Products Currently, there are five leading types of thermal vests: Ice-pack, evaporative cooling, phase change, fluid cooling and air cooling. A detailed analysis of each vest type is included below. Further specifications for all devices are included in Appendix A.
Ice-Pack Vest
Ice-Pack vests insert frozen ice-packs into the pockets of jackets. Ice-Pack vests can last between two to four hours [3]. Ice-pack vests are low-cost, have a high cooling power and the ice packs can be reused. However, after melting, ice-pack vests can weigh between five and ten pounds. In addition the ice-packs require time to re-freeze. Another disadvantage is the fact that the vest is always in use, even when the body temperature is already at 98⁰F.
One current model is the kold-vest [4]. This device uses ice packs to induce cooling. This vest is light-weight, can last up to two hours and uses reusable ice-packs. The vest costs around $150.00.
Evaporative Cooling Vests
Evaporative cooling devices use polymer materials soaked in water [5]. Over time, the water will evaporate from the vest in order to cool the body’s surface. The device must be submerged in water for 1-3 minutes in order to operate for a period of 5-10 hours. These devices are often lightweight, low in cost, have high performance in dry climates, offer durability, operate without the use of ice packs and demonstrate a long performance time. However, these devices require soaking the garment in water which can be inconvenient for the user, have poor performance in high humidity climates and have the lowest overall cooling energy.
One current product is Gempler’s Evaporative Cooling Vest [6]. The vest is composed of a polymer embedded fabric that is activated by water. This device must be submerged in water for 1-2 minutes and has an operating time of 5-10 hours. This design costs approximately $36.15.
Phase Change Vests
Phase change vests use a polymer formula to help aid in cooling. Phase change materials are activated at a certain temperature between 0-30°C [7]. In a thermal vest, the phase change material would become activated when the body reaches a certain temperature. At this point, the phase change material would begin to melt in order to cool the body primarily through conduction mechanisms. Common phase change materials include ice packs, dry ice, and the most commonly used: paraffin wax. Typically these vests range in cost between $150 and $300.
The phase change material is able to cool an individual between 2-3 hours [7]. This method is a passive process that offers a controlled release of a constant temperature which makes these devices easily customizable. They do not require the use of a freezer and they offer an effective cooling method in all climates. The disadvantages include high cost replacement parts and heavy weight after melting. However, these devices can only cool for approximately 3 hours, they weigh more than other cooling devices, they can have a higher cost and their total cooling power is less than cold pack systems
A current model is the Cooling Vest of TST Sweden AB [8]. This model inserts PCM material into the pockets inside the vest. The PCM material melts at 28°C and can cool the body for up to two hours. The vest can be recharged in an air conditioned room, a refrigerator or freezer. Another advantage is that the vest weighs only 2 kilograms.
9
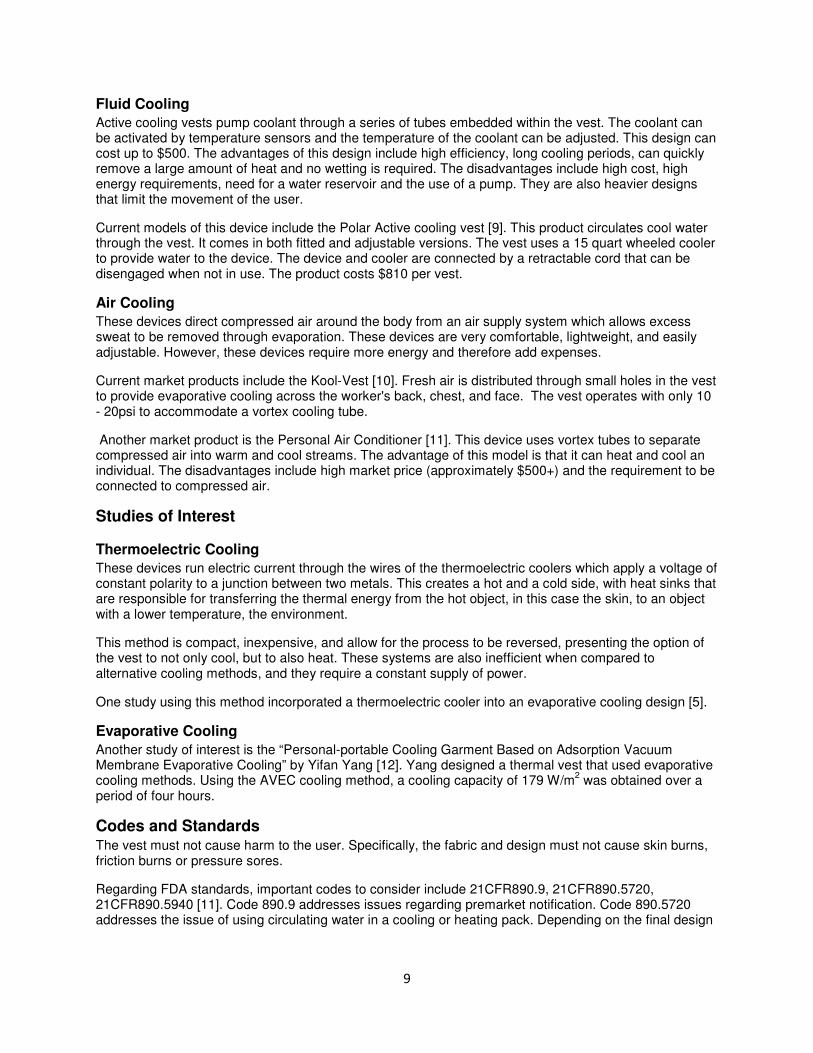
Fluid Cooling
Active cooling vests pump coolant through a series of tubes embedded within the vest. The coolant can be activated by temperature sensors and the temperature of the coolant can be adjusted. This design can cost up to $500. The advantages of this design include high efficiency, long cooling periods, can quickly remove a large amount of heat and no wetting is required. The disadvantages include high cost, high energy requirements, need for a water reservoir and the use of a pump. They are also heavier designs that limit the movement of the user.
Current models of this device include the Polar Active cooling vest [9]. This product circulates cool water through the vest. It comes in both fitted and adjustable versions. The vest uses a 15 quart wheeled cooler to provide water to the device. The device and cooler are connected by a retractable cord that can be disengaged when not in use. The product costs $810 per vest.
Air Cooling
These devices direct compressed air around the body from an air supply system which allows excess sweat to be removed through evaporation. These devices are very comfortable, lightweight, and easily adjustable. However, these devices require more energy and therefore add expenses.
Current market products include the Kool-Vest [10]. Fresh air is distributed through small holes in the vest to provide evaporative cooling across the worker's back, chest, and face. The vest operates with only 10 - 20psi to accommodate a vortex cooling tube.
Another market product is the Personal Air Conditioner [11]. This device uses vortex tubes to separate compressed air into warm and cool streams. The advantage of this model is that it can heat and cool an individual. The disadvantages include high market price (approximately $500+) and the requirement to be connected to compressed air.
Studies of Interest
Thermoelectric Cooling
These devices run electric current through the wires of the thermoelectric coolers which apply a voltage of constant polarity to a junction between two metals. This creates a hot and a cold side, with heat sinks that are responsible for transferring the thermal energy from the hot object, in this case the skin, to an object with a lower temperature, the environment.
This method is compact, inexpensive, and allow for the process to be reversed, presenting the option of the vest to not only cool, but to also heat. These systems are also inefficient when compared to alternative cooling methods, and they require a constant supply of power.
One study using this method incorporated a thermoelectric cooler into an evaporative cooling design [5].
Evaporative Cooling
Another study of interest is the “Personal-portable Cooling Garment Based on Adsorption Vacuum Membrane Evaporative Cooling” by Yifan Yang [12]. Yang designed a thermal vest that used evaporative cooling methods. Using the AVEC cooling method, a cooling capacity of 179 W/m2 was obtained over a period of four hours.
Codes and Standards The vest must not cause harm to the user. Specifically, the fabric and design must not cause skin burns, friction burns or pressure sores.
Regarding FDA standards, important codes to consider include 21CFR890.9, 21CFR890.5720, 21CFR890.5940 [11]. Code 890.9 addresses issues regarding premarket notification. Code 890.5720 addresses the issue of using circulating water in a cooling or heating pack. Depending on the final design

10
selection, additional FDA codes and standards may need to be considered. Specific FDA codes are included in Appendix B.
In regards to testing considerations, a model that accurately represents the conditions of an individual with a spinal cord injury is required. Other models used a torso replica that was capable of modeling evaporative, or sweating, cooling mechanisms [5]. In individuals with spinal injuries, sweating is often impaired below the site of injury. Therefore, a testing model with replicates this impairment should be used.

11
Chapter 3: Design Development
Objectives The overall goals of this project are to design a lightweight, non-bulky jacket that uses thermal sensors to regulate an individual’s core temperature.
Customer Requirements
The following list contains the proposed customer requirements. These requirements were chosen to create a user-friendly device that can be used on a regular basis.
• Durable
• Lightweight
• Non-insulating
• Functional for at least 8 hours
• Maintain core temperature of 98⁰F
• Moderated by a thermostat
• Can be worn under clothing
• Adjustable for different sizes
• No system failure
• User-friendly
• Reduced number of false alarms
• Lithium ion battery source
• Chemical based system
Project Requirements
Based on the proposed customer requirements, the following qualitative performance goals were proposed.
12
Performance Goals
Durability Must be able to with Light Weight Lightweight Non-Insulating Fabric must be breathable Long Lasting Use during a standard work day Maintain Core Temp Reduce temperature from 110 to 98 and regulate Thin and compact design Fit under a T-shirt Reliability Components must be durable and long-lasting User Friendly Comfortable and easy to use by individual Washable Must be water resistant Cost Must be inexpensive Adjustable Must be able to size from small to large shirt size Safety Must be able to operate without any impending danger to user
These qualitative performance goals were then transformed into quantitative functional goals.
The functional goals were then compared using a rank order comparison shown in Appendix C. Based on the rank order comparison the top four goals were determined to be maintaining core body temperature, safety, light-weight design and non-insulating materials. Detailed explanations for these goals are included below.
• Maintaining Core Body Temperature: Must expel 1000 BTUs/hour
o The main goal of this project is to regulate an individual’s body temperature at 98 degrees. If this standard is not met, then ultimately the design does not achieve its overall purpose. In order to maintain an individual’s body temperature, 1000 BTUs/hour must be expelled by the entire body. Assuming that half of the heat loss occurs from the torso then the vest must expel 500 BTUs/hour.
• Safety: All contact materials to be biocompatible
Functional Requirements
Durability Withstand drop from 8 ft Light Weight Less than 5 lbs Non-Insulating more than 170 gram/(hour meter^2) of water permissibility Long Lasting Self contained operation 8 hours Maintain Core Temp Must expel 500 BTUs/hour Thin and compact design Vest must protrude off the body by no more than 1/4 inch Reliability All components must last 10^6 cycles w/ 95% reliability User Friendly User fully Functional after 3 attempts Washable Must be able to function after being submerged in 5 PSI of water Cost Must cost less than $2000 to build and test Adjustable 30 inch chest to a 46 inch chest Safety All contact materials to be biocompatible
13
o This device must not be dangerous to use. In order to be FDA approved, certain standards must be met to ensure user safety. Furthermore, it is important that materials are selected that don’t cause skin lesions or burns.
• Light-weight: Less than 5 lbs
o In order to be used on a daily basis the design must be light-weight. This will ultimately increase the user’s satisfaction and increase the device usage.
• Non-insulating: more than 170 gram/(hour meter^2) of water permissibility o The material must be able to expel excess heat to prevent the user from overheating.
Other goals that ranked relatively high included a thin & compact design, reliability of device and long-lasting.
• Thin & Compact Design: Vest must protrude off the body by no more than 1/4 inch
This will allow the vest to lie below an individual’s clothing.
• Reliability: All components must last 10^6 cycles w/ 95% reliability
This device is responsible for regulating the body temperature in high temperature environments. It must be 95% reliable to ensure that the individual does not succumb to heat stroke.
• Durability: Withstand drop from 8 ft
Must be durable enough to withstand normal daily conditions. If the device can withstand an 8 foot drop, then it should be able to withstand daily activities.
• Long Lasting: Self contained operation 8 hours
This will allow the user to wear the vest during a standard eight hour work day.
The least important goals at this time are adjustability, washable and low-cost.
• User-Friendly: User fully Functional after 3 attempts Must not be a difficult device for the user to operate. They must be able to use the device with minimal instructions.
• Adjustability: 30 inch chest to a 46 inch chest
These are the dimensions of average female and male chest sizes.
• Washable: Must be able to function after being submerged in 5 PSI of water
If the user is using the device on a daily basis, it must be washable.
• Cost: Must cost less than $2000 to build and test
This is the cost for building and prototyping. Individual units may be more expensive than existing models. The rationale for a higher unit cost is dependent on the fact that this device will be used on a daily basis.
Conceptual Models Based on the design requirements outlined above and preliminary background research, three top conceptual models were designed: the liquid cooling vest, the evaporative cooling vest and the conductive material and phase change vest. Each model is discussed in detail below.
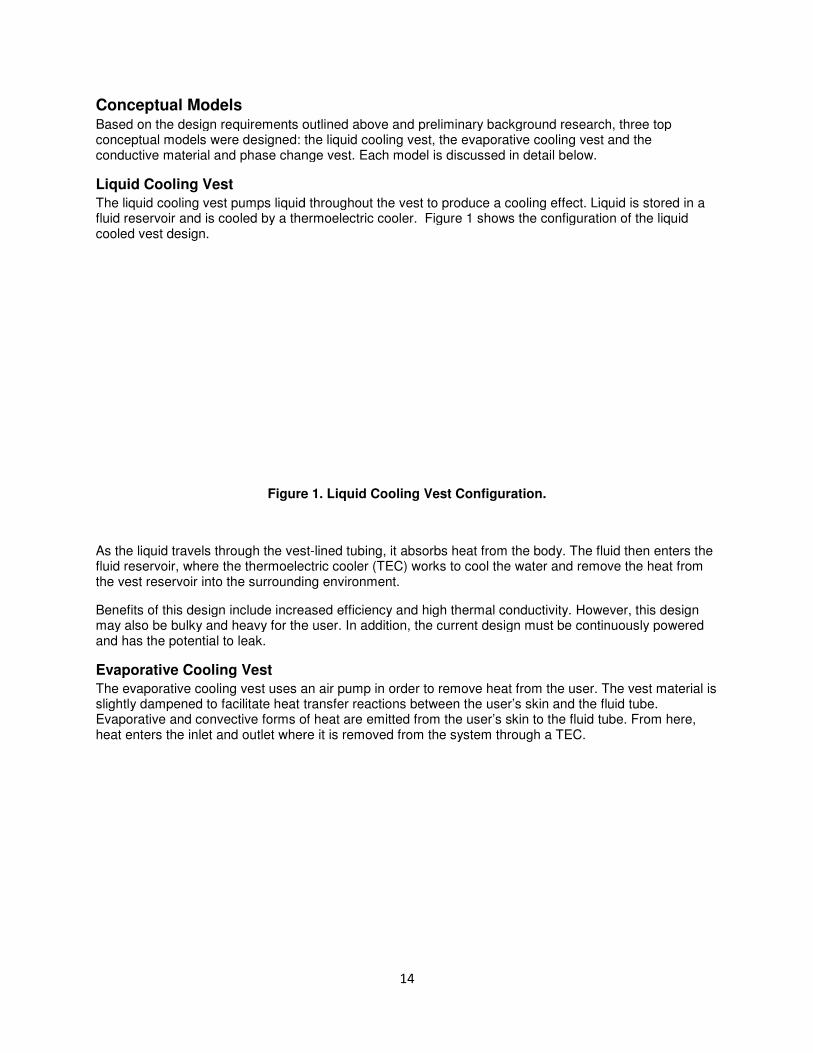
Liquid Cooling Vest
The liquid cooling vest pumps liquid throughout the vest to produce a cooling effect. Liquid is stored in a fluid reservoir and is cooled by a thermoelectric cooler. Figure 1 shocooled vest design.
Figure
As the liquid travels through the vestfluid reservoir, where the thermoelectric cooler (TEC) works to cool the water and remove the heat from the vest reservoir into the surrounding en
Benefits of this design include increased efficiency and high thermal conductivity. However, this design may also be bulky and heavy for the user. In addition, the current design must be continuously powered and has the potential to leak.
Evaporative Cooling Vest
The evaporative cooling vest uses an air pump in order to remove heat from the user. The vest material is slightly dampened to facilitate heat transfer reactions between the user’s skin and the fluid tube. Evaporative and convective forms of heat are emitted from the user’s skin to the fluid tube. From here, heat enters the inlet and outlet where it is removed from the system through a TEC.
14
Based on the design requirements outlined above and preliminary background research, three top conceptual models were designed: the liquid cooling vest, the evaporative cooling vest and the
e change vest. Each model is discussed in detail below.
The liquid cooling vest pumps liquid throughout the vest to produce a cooling effect. Liquid is stored in a fluid reservoir and is cooled by a thermoelectric cooler. Figure 1 shows the configuration of the liquid
Figure 1. Liquid Cooling Vest Configuration.
As the liquid travels through the vest-lined tubing, it absorbs heat from the body. The fluid then enters the fluid reservoir, where the thermoelectric cooler (TEC) works to cool the water and remove the heat from the vest reservoir into the surrounding environment.
Benefits of this design include increased efficiency and high thermal conductivity. However, this design may also be bulky and heavy for the user. In addition, the current design must be continuously powered
The evaporative cooling vest uses an air pump in order to remove heat from the user. The vest material is slightly dampened to facilitate heat transfer reactions between the user’s skin and the fluid tube.
rms of heat are emitted from the user’s skin to the fluid tube. From here, heat enters the inlet and outlet where it is removed from the system through a TEC.
Based on the design requirements outlined above and preliminary background research, three top conceptual models were designed: the liquid cooling vest, the evaporative cooling vest and the
The liquid cooling vest pumps liquid throughout the vest to produce a cooling effect. Liquid is stored in a ws the configuration of the liquid
lined tubing, it absorbs heat from the body. The fluid then enters the fluid reservoir, where the thermoelectric cooler (TEC) works to cool the water and remove the heat from
Benefits of this design include increased efficiency and high thermal conductivity. However, this design may also be bulky and heavy for the user. In addition, the current design must be continuously powered
The evaporative cooling vest uses an air pump in order to remove heat from the user. The vest material is slightly dampened to facilitate heat transfer reactions between the user’s skin and the fluid tube.
rms of heat are emitted from the user’s skin to the fluid tube. From here,
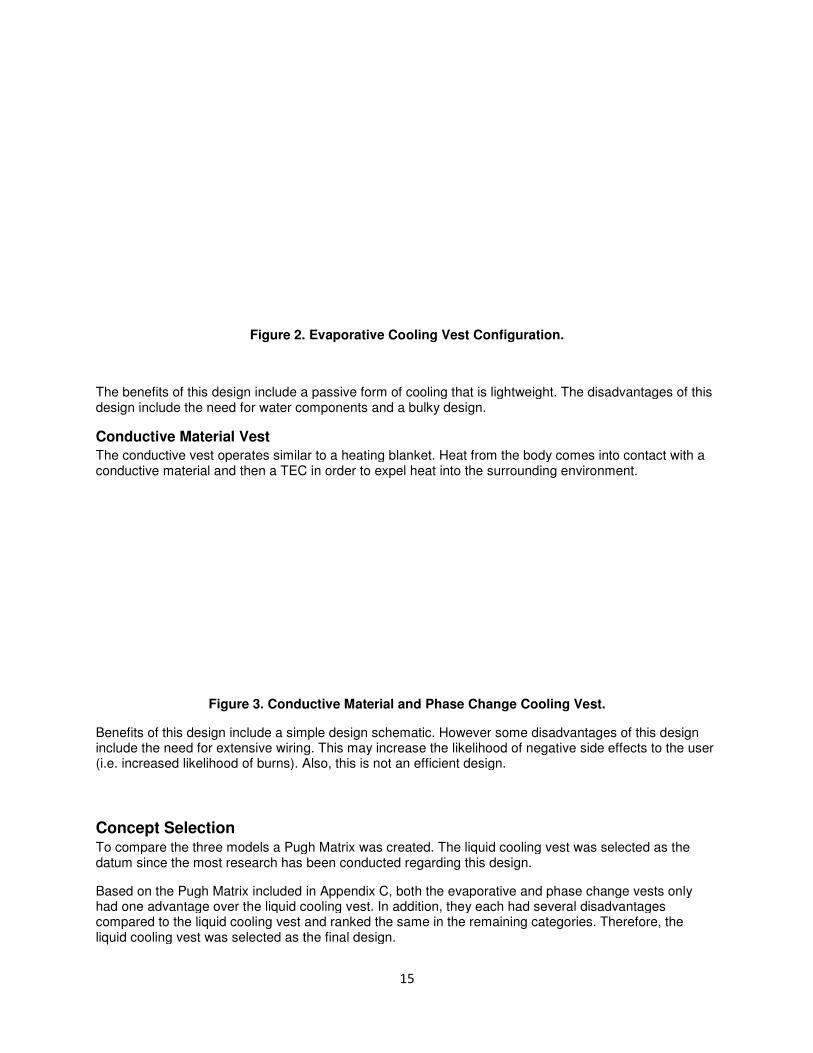
Figure 2. Evaporative Cooling Vest Configuration.
The benefits of this design include a passive form of cooling that is lightweight. The disadvantages of this design include the need for water components and a bulky design.
Conductive Material Vest
The conductive vest operates similar to a heating blanket. Heat from the body comes into contact with a conductive material and then a TEC in order to expel heat into the surrounding environment.
Figure 3. Conductive Material an
Benefits of this design include a simple design schematic. However some disadvantages of this design include the need for extensive wiring. This may increase the likelihood of negative side effects to the user (i.e. increased likelihood of burns). Also, this is not an efficient design.
Concept Selection To compare the three models a Pugh Matrix was created. The liquid cooling vest was selected as the datum since the most research has been conducted regarding this design.
Based on the Pugh Matrix included in had one advantage over the liquid cooling vest. In addition, they each had several disadvantages compared to the liquid cooling vest and ranked the same in the remaining categories. Therefore, the liquid cooling vest was selected as the final design.
15
. Evaporative Cooling Vest Configuration.
his design include a passive form of cooling that is lightweight. The disadvantages of this design include the need for water components and a bulky design.
The conductive vest operates similar to a heating blanket. Heat from the body comes into contact with a conductive material and then a TEC in order to expel heat into the surrounding environment.
. Conductive Material and Phase Change Cooling Vest.
Benefits of this design include a simple design schematic. However some disadvantages of this design include the need for extensive wiring. This may increase the likelihood of negative side effects to the user
ikelihood of burns). Also, this is not an efficient design.
To compare the three models a Pugh Matrix was created. The liquid cooling vest was selected as the datum since the most research has been conducted regarding this design.
d on the Pugh Matrix included in Appendix C, both the evaporative and phase change vests only had one advantage over the liquid cooling vest. In addition, they each had several disadvantages compared to the liquid cooling vest and ranked the same in the remaining categories. Therefore, the
ooling vest was selected as the final design.
his design include a passive form of cooling that is lightweight. The disadvantages of this
The conductive vest operates similar to a heating blanket. Heat from the body comes into contact with a conductive material and then a TEC in order to expel heat into the surrounding environment.
Benefits of this design include a simple design schematic. However some disadvantages of this design include the need for extensive wiring. This may increase the likelihood of negative side effects to the user
To compare the three models a Pugh Matrix was created. The liquid cooling vest was selected as the
, both the evaporative and phase change vests only had one advantage over the liquid cooling vest. In addition, they each had several disadvantages compared to the liquid cooling vest and ranked the same in the remaining categories. Therefore, the
16
)*(
)*(
,
,
fabcsf
fabgen
skinfiKA
tETT −=
=
=
=
=
=
=
fab
csf
fab
gen
skin
fi
K
A
t
E
T
T
,
,
)*(
)*(
,
,
tubecst
tubegen
fitubeKA
tETT −=
=
=
=
=
tube
cst
tube
tube
K
A
t
T
,
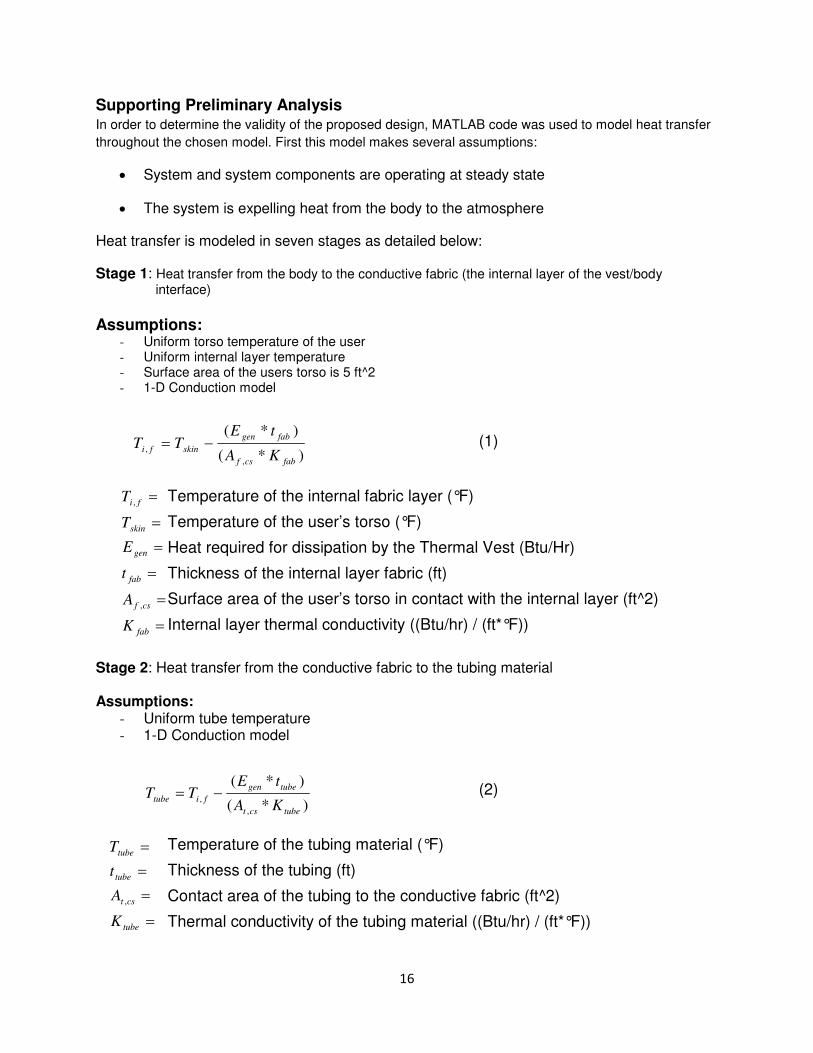
Supporting Preliminary Analysis In order to determine the validity of the proposed design, MATLAB code was used to model heat transfer throughout the chosen model. First this model makes several assumptions:
• System and system components are operating at steady state
• The system is expelling heat from the body to the atmosphere
Heat transfer is modeled in seven stages as detailed below:
Stage 1: Heat transfer from the body to the conductive fabric (the internal layer of the vest/body interface)
Assumptions:
- Uniform torso temperature of the user - Uniform internal layer temperature - Surface area of the users torso is 5 ft^2 - 1-D Conduction model
(1)
Temperature of the internal fabric layer (°F)
Temperature of the user’s torso (°F)
Heat required for dissipation by the Thermal Vest (Btu/Hr)
Thickness of the internal layer fabric (ft)
Surface area of the user’s torso in contact with the internal layer (ft^2)
Internal layer thermal conductivity ((Btu/hr) / (ft*°F))
Stage 2: Heat transfer from the conductive fabric to the tubing material Assumptions:
- Uniform tube temperature - 1-D Conduction model
(2)
Temperature of the tubing material (°F)
Thickness of the tubing (ft)
Contact area of the tubing to the conductive fabric (ft^2)
Thermal conductivity of the tubing material ((Btu/hr) / (ft*°F))
17
tubevestvest DNu Pr**Re*023.)5/4(=
f
tubeff
vest
DV
µ
ρ **Re =
tube
flvest
vestD
KNuH
*=
)*(
)(
, vestcsi
gen
tubefHA
ETT −=
=
=
=
=
=
=
=
=
=
=
=
csi
f
vest
fl
f
tube
f
f
vest
vest
A
T
H
K
V
D
Nu
,
Pr
Re
µ
ρ
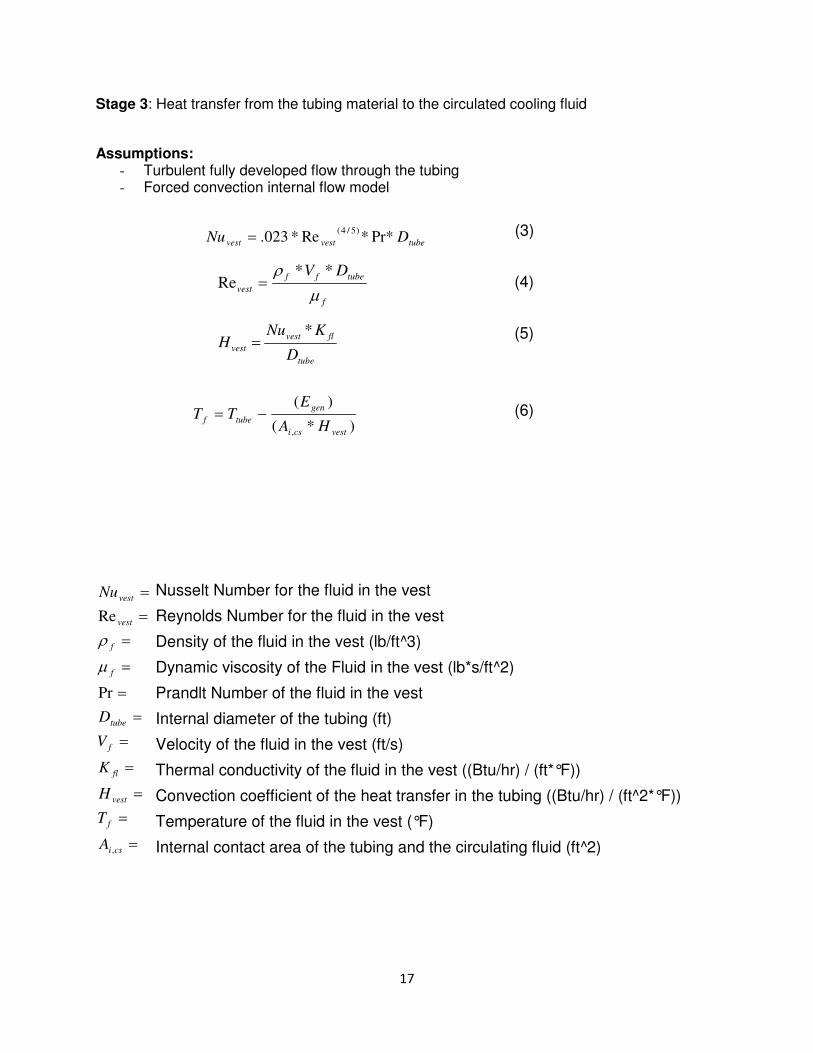
Stage 3: Heat transfer from the tubing material to the circulated cooling fluid
Assumptions:
- Turbulent fully developed flow through the tubing - Forced convection internal flow model
(3)
(4)
(5)
(6)
Nusselt Number for the fluid in the vest
Reynolds Number for the fluid in the vest
Density of the fluid in the vest (lb/ft^3)
Dynamic viscosity of the Fluid in the vest (lb*s/ft^2)
Prandlt Number of the fluid in the vest
Internal diameter of the tubing (ft)
Velocity of the fluid in the vest (ft/s)
Thermal conductivity of the fluid in the vest ((Btu/hr) / (ft*°F))
Convection coefficient of the heat transfer in the tubing ((Btu/hr) / (ft^2*°F))
Temperature of the fluid in the vest (°F)
Internal contact area of the tubing and the circulating fluid (ft^2)
18
resresres DNu Pr**Re*023.)5/4(=
f
resff
res
DV
µ
ρ **Re =
res
flres
resD
KNuH
*=
)*(
)(
resres
gen
fresHA
ETT −=
=
=
=
=
=
=
res
res
res
res
res
res
A
T
H
D
Nu
Re
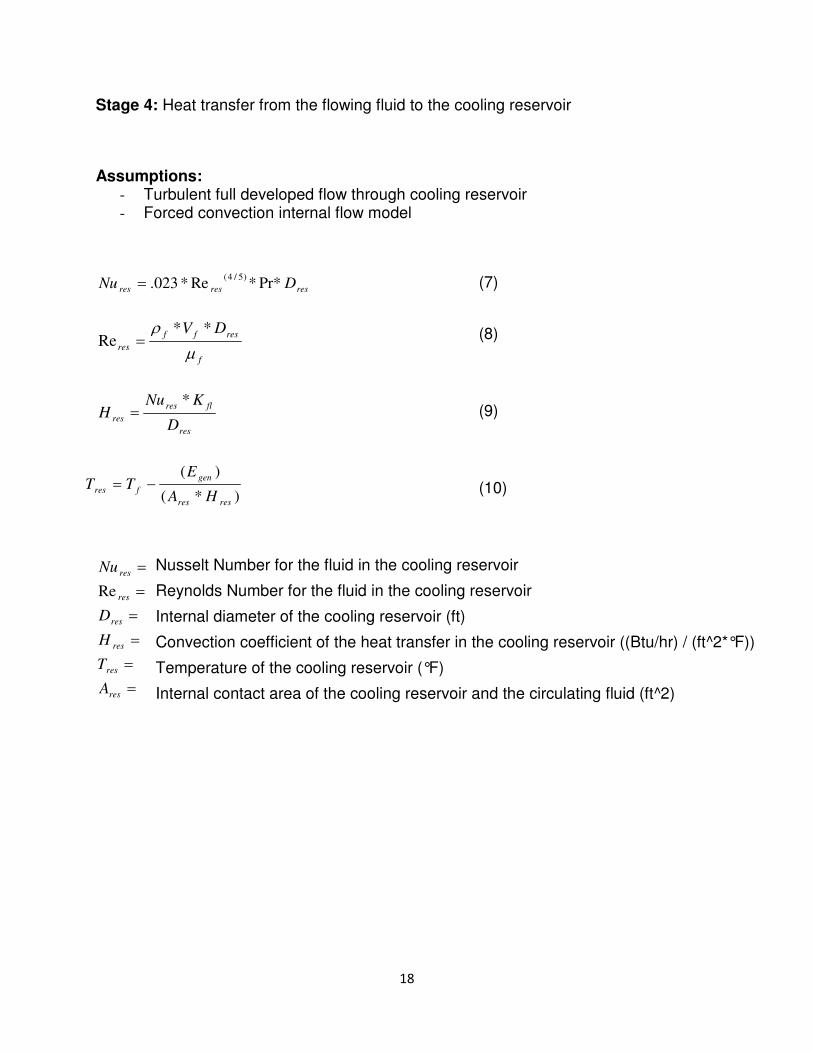
Stage 4: Heat transfer from the flowing fluid to the cooling reservoir
Assumptions:
- Turbulent full developed flow through cooling reservoir - Forced convection internal flow model
(7)
(8)
(9)
(10)
Nusselt Number for the fluid in the cooling reservoir
Reynolds Number for the fluid in the cooling reservoir
Internal diameter of the cooling reservoir (ft)
Convection coefficient of the heat transfer in the cooling reservoir ((Btu/hr) / (ft^2*°F))
Temperature of the cooling reservoir (°F)
Internal contact area of the cooling reservoir and the circulating fluid (ft^2)
19
))*4/((***
)*(
πSSqK
tETT
ssres
resgen
ressp −=
atmspatmwp TTTT +−= )(
=
=
=
=
=
=
=
wp
atm
ss
res
res
sp
T
T
S
q
K
t
T
))*4/((***
)*( ,
, πSSqK
tETT
sshs
bhsgen
wpbhs −=
)*(
)*(
,
,
,,
hsfhs
fhsgen
bhsfhsKA
tETT −=
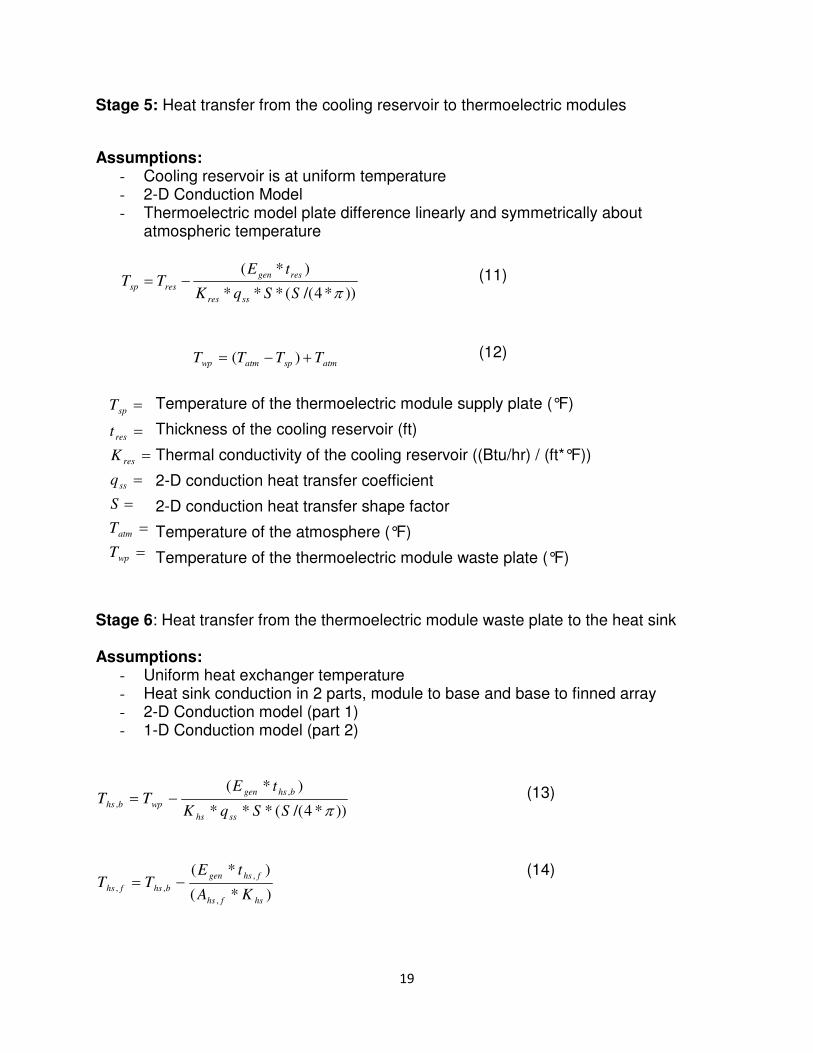
Stage 5: Heat transfer from the cooling reservoir to thermoelectric modules
Assumptions:
- Cooling reservoir is at uniform temperature - 2-D Conduction Model - Thermoelectric model plate difference linearly and symmetrically about
atmospheric temperature
(11)
(12)
Temperature of the thermoelectric module supply plate (°F)
Thickness of the cooling reservoir (ft)
Thermal conductivity of the cooling reservoir ((Btu/hr) / (ft*°F))
2-D conduction heat transfer coefficient
2-D conduction heat transfer shape factor
Temperature of the atmosphere (°F)
Temperature of the thermoelectric module waste plate (°F)
Stage 6: Heat transfer from the thermoelectric module waste plate to the heat sink Assumptions:
- Uniform heat exchanger temperature - Heat sink conduction in 2 parts, module to base and base to finned array - 2-D Conduction model (part 1) - 1-D Conduction model (part 2)
(13)
(14)
20
=
=
=
=
=
=
fhs
fhs
fhs
hs
bhs
bhs
t
T
A
K
t
T
,
,
,
,
,
hshshs DeNu Pr**Re*023.)5/4(=
a
hsaa
hs
DeV
µρ **
Re =
hs
shshs
De
KNuH
*=
)*(
)(
, hsia
gen
atmairHA
ETT −=
=
=
=
=
=
=
=
=
=
=
hs
ia
air
s
a
a
a
hs
hs
hs
H
A
T
K
V
De
Nu
,
Re
µ
ρ
Temperature of the heat sink base (°F)
Thickness of the heat sink base (ft)
Thermal conductivity of the heat sink ((Btu/hr) / (ft*°F))
Contact are of the fined array to heat sink base (ft^2)
Temperature of the heat sink finned array (°F)
Thickness of the heat sink finned array (ft)
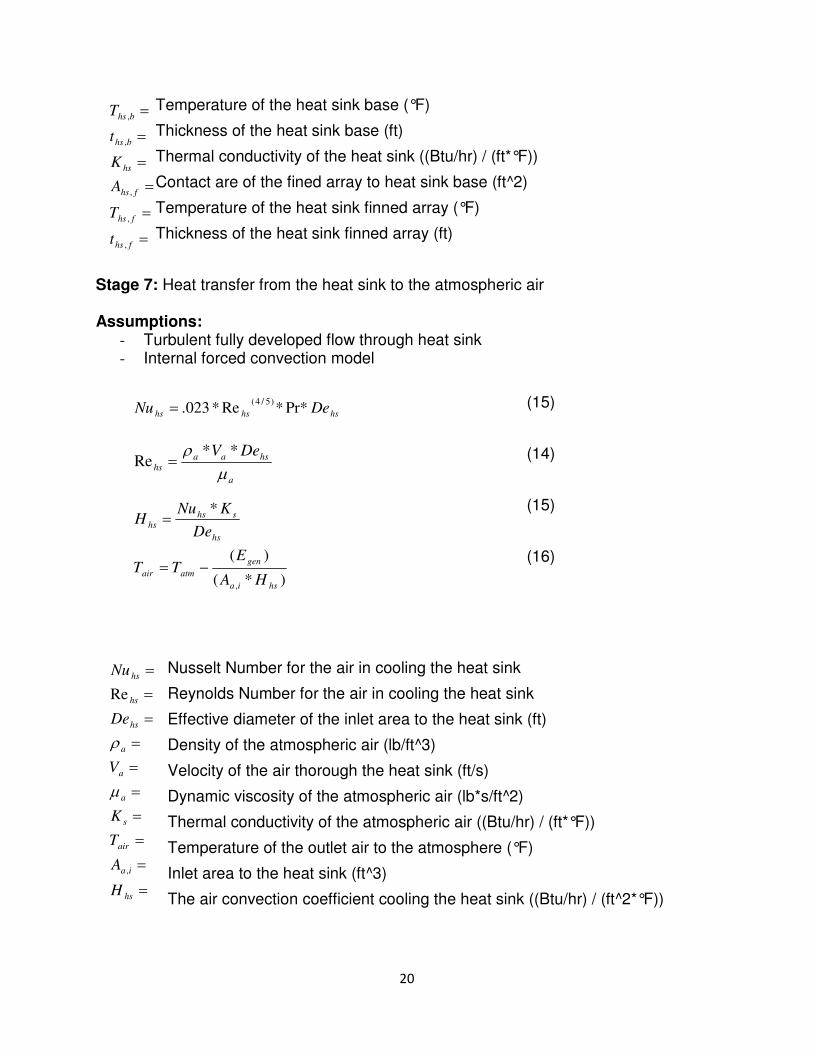
Stage 7: Heat transfer from the heat sink to the atmospheric air Assumptions:
- Turbulent fully developed flow through heat sink - Internal forced convection model
(15)
(14)
(15)
(16)
Nusselt Number for the air in cooling the heat sink
Reynolds Number for the air in cooling the heat sink
Effective diameter of the inlet area to the heat sink (ft)
Density of the atmospheric air (lb/ft^3)
Velocity of the air thorough the heat sink (ft/s)
Dynamic viscosity of the atmospheric air (lb*s/ft^2)
Thermal conductivity of the atmospheric air ((Btu/hr) / (ft*°F))
Temperature of the outlet air to the atmosphere (°F)
Inlet area to the heat sink (ft^3)
The air convection coefficient cooling the heat sink ((Btu/hr) / (ft^2*°F))
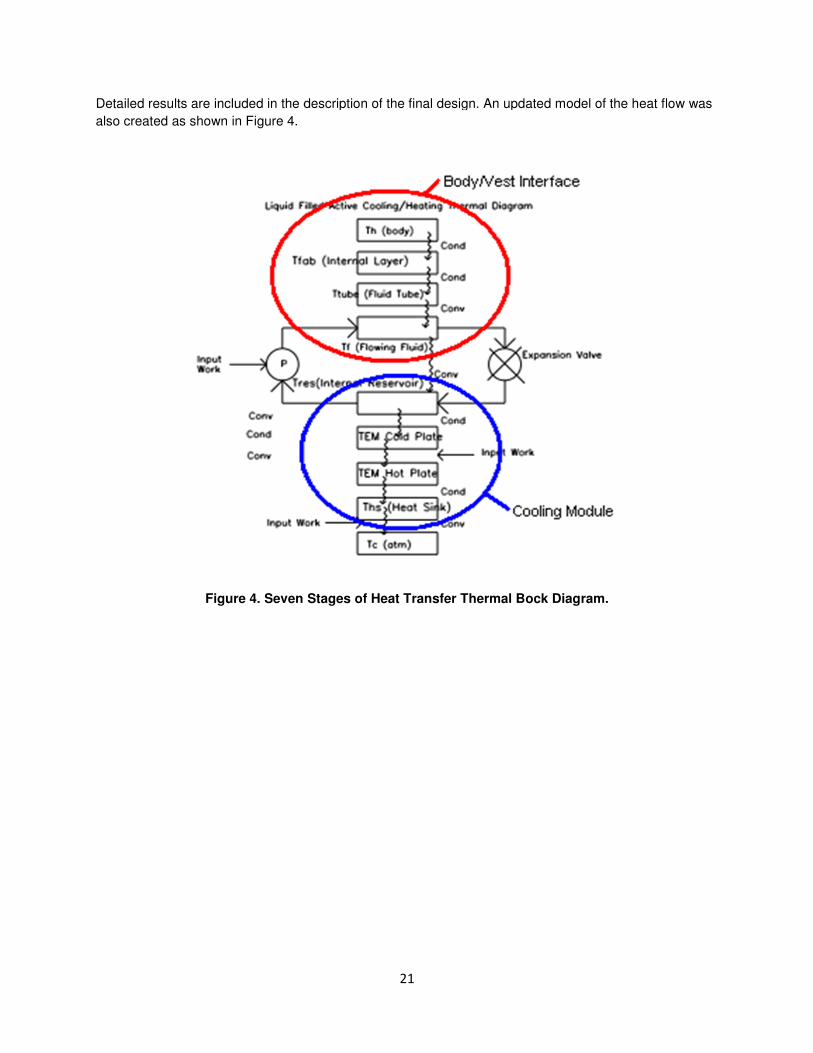
Detailed results are included in the description of the final design. An updated model of the heat flow was also created as shown in Figure 4.
Figure 4. Seven Stage
21
Detailed results are included in the description of the final design. An updated model of the heat flow was
Seven Stages of Heat Transfer Thermal Bock Diagram.
Detailed results are included in the description of the final design. An updated model of the heat flow was
.
Chapter 4: Description of the
The liquid cooling vest was chosen as the final design. The liquid cooling vest is composed of two main components: a body to vest interface and a cooling module as shown in Figure interface is composed of a conductive fabric, an insularesponsible for circulating fluid to and from the cooling module. As fluid moves through the tubing, it extracts heat from the human body and transfers it back to the cooling module.
The cooling module is then responsible for cooling the returned water. Fluid is cooled by a thermoelectric cooler which absorbs heat from the water and returns it to the surrounding atmosphere. From here, the chilled water is then pumped out of the reservoir and through the ves
Figure
22
Chapter 4: Description of the Final Prototype Design
The liquid cooling vest was chosen as the final design. The liquid cooling vest is composed of two main components: a body to vest interface and a cooling module as shown in Figure 5. The body to vest interface is composed of a conductive fabric, an insulating fabric, and vest tubing. The vest tubing is responsible for circulating fluid to and from the cooling module. As fluid moves through the tubing, it extracts heat from the human body and transfers it back to the cooling module.
then responsible for cooling the returned water. Fluid is cooled by a thermoelectric cooler which absorbs heat from the water and returns it to the surrounding atmosphere. From here, the chilled water is then pumped out of the reservoir and through the vest tubing to repeat the process.
Figure 5. CAD Model of Thermal Vest.
The liquid cooling vest was chosen as the final design. The liquid cooling vest is composed of two main . The body to vest
ting fabric, and vest tubing. The vest tubing is responsible for circulating fluid to and from the cooling module. As fluid moves through the tubing, it
then responsible for cooling the returned water. Fluid is cooled by a thermoelectric cooler which absorbs heat from the water and returns it to the surrounding atmosphere. From here, the
t tubing to repeat the process.
23
Detailed Design Description
Schematics
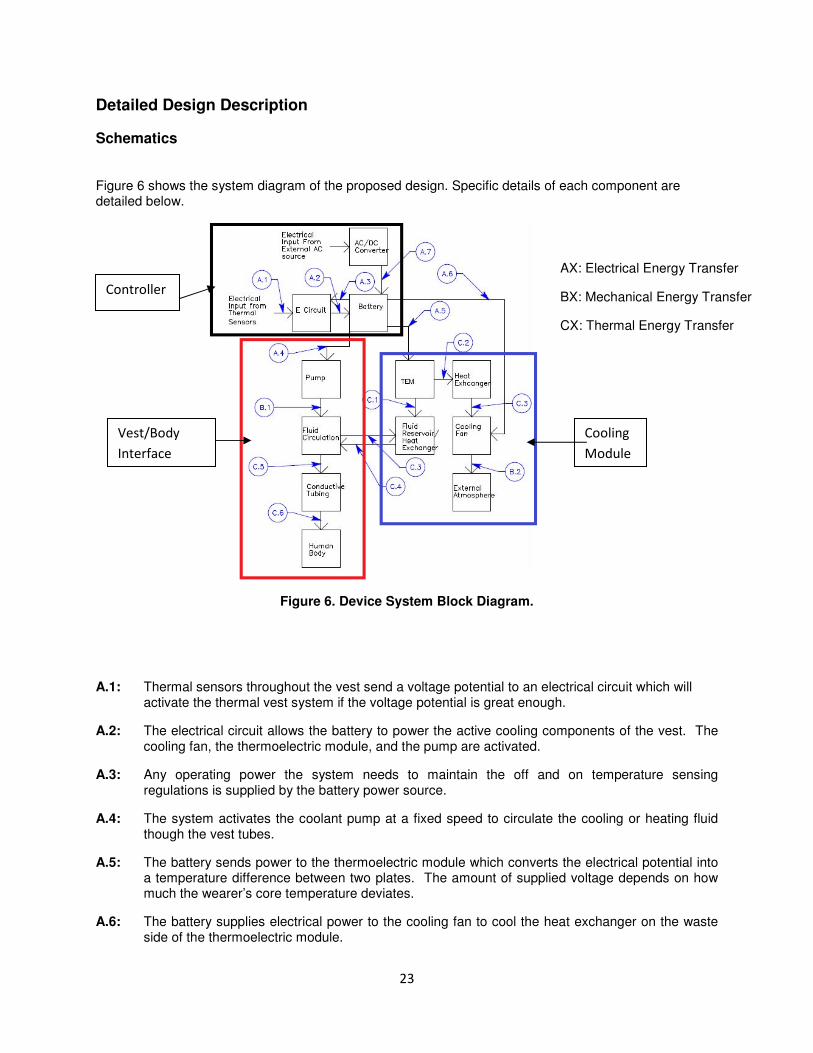
Figure 6 shows the system diagram of the proposed design. Specific details of each component are detailed below.
Figure 6. Device System Block Diagram.
A.1: Thermal sensors throughout the vest send a voltage potential to an electrical circuit which will activate the thermal vest system if the voltage potential is great enough.
A.2: The electrical circuit allows the battery to power the active cooling components of the vest. The cooling fan, the thermoelectric module, and the pump are activated.
A.3: Any operating power the system needs to maintain the off and on temperature sensing regulations is supplied by the battery power source.
A.4: The system activates the coolant pump at a fixed speed to circulate the cooling or heating fluid though the vest tubes.
A.5: The battery sends power to the thermoelectric module which converts the electrical potential into a temperature difference between two plates. The amount of supplied voltage depends on how much the wearer’s core temperature deviates.
A.6: The battery supplies electrical power to the cooling fan to cool the heat exchanger on the waste side of the thermoelectric module.
AX: Electrical Energy Transfer
BX: Mechanical Energy Transfer
CX: Thermal Energy Transfer
Vest/Body
Interface
Controller
Cooling
Module
24
A.7: The battery power source can be recharged from an external AC power source. Once the power source is depleted (approximately 8 hours) an indication light will illuminate on the battery to indicate the need to recharge.
B.1: The coolant pump converts the electrical energy into mechanical work to circulate the coolant through the cooling vest. The rate of fluid circulation is directly proportional to the amount of heat the fest can extract.
B.2: The cooling fan converts electrical energy into mechanical work to remove the hot air in the microclimate of the hot plate thermoelectric cooler heat exchanger. This fan will operate for as long as the vest is active.
C.1: The thermoelectric module cools or heats a heat exchanger/fluid reservoir. The fluid reservoir is designed to have excellent heat transfer with the thermoelectric module and the flowing fluid through the vest.
C.2: Thermoelectric module waste plate thermally exchanges energy with a heat exchanger. The waste heat exchanger is necessary to restrict the waste plate from being potentially dangerous to the user or the user’s surroundings.
C.3: The fluid reservoir intakes coolant to thermally treat to operating temperature before recalculating. The coolant enters the reservoir and is subjected to a series of heat exchanger fins before being pumped out at operating temperature.
C.4: The fluid reservoir expels operating temperature fluid to be circulated through the vest. The fluid reaches the bottom of the reservoir and is pumped back to the vest to either extract of input heat.
C.5: Operating fluid thermally transfers energy to the conductive tubing throughout the vest. As the fluid flows through the conductive tubing the tubing changes temperature towards the operating temperature of the fluid.
C.6: The conductive tubing conducts heat with the surface of the body. The body is constantly attempting to maintain its core temperature and must either expel of extract heat from the environment.
Body to Vest Interface
Figure 7
The body to vest interface is comprised of only a few sub components and has the main function of providing the best compromise of thermal efficiency and comfort to the user. Contacting the skin, the first sub component is the conductive fabric (internalorder to maintain high thermal efficiency, there needs to be a method of insulating the cooling mechanism from the atmosphere. This is achieved by securing an additional layer to the vest thathan the internal layer. This allows the bodylayers.
Internal Layer
25
7. Body to Vest Interface Configuration.
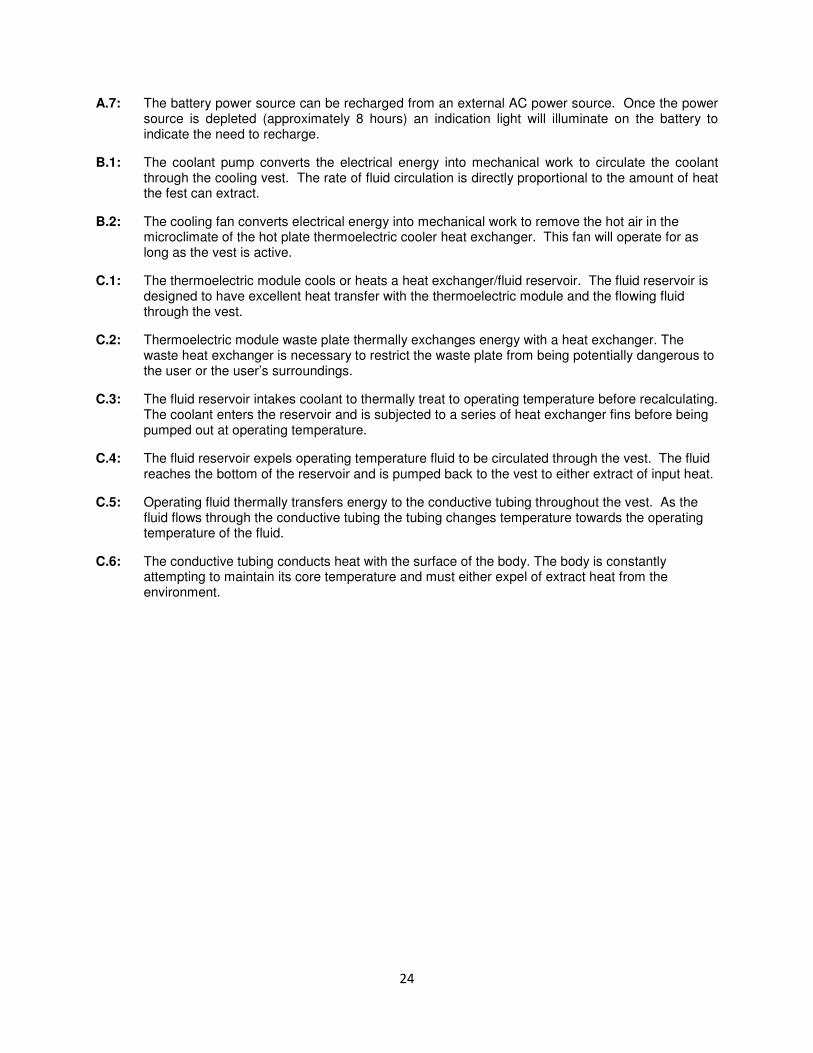
The body to vest interface is comprised of only a few sub components and has the main function of providing the best compromise of thermal efficiency and comfort to the user. Contacting the skin, the first sub component is the conductive fabric (internal layer). Sewn directly to the internal layer is the tubing. In order to maintain high thermal efficiency, there needs to be a method of insulating the cooling mechanism from the atmosphere. This is achieved by securing an additional layer to the vest that has a looser fit than the internal layer. This allows the body-vest interface to create a microclimate between the two fabric
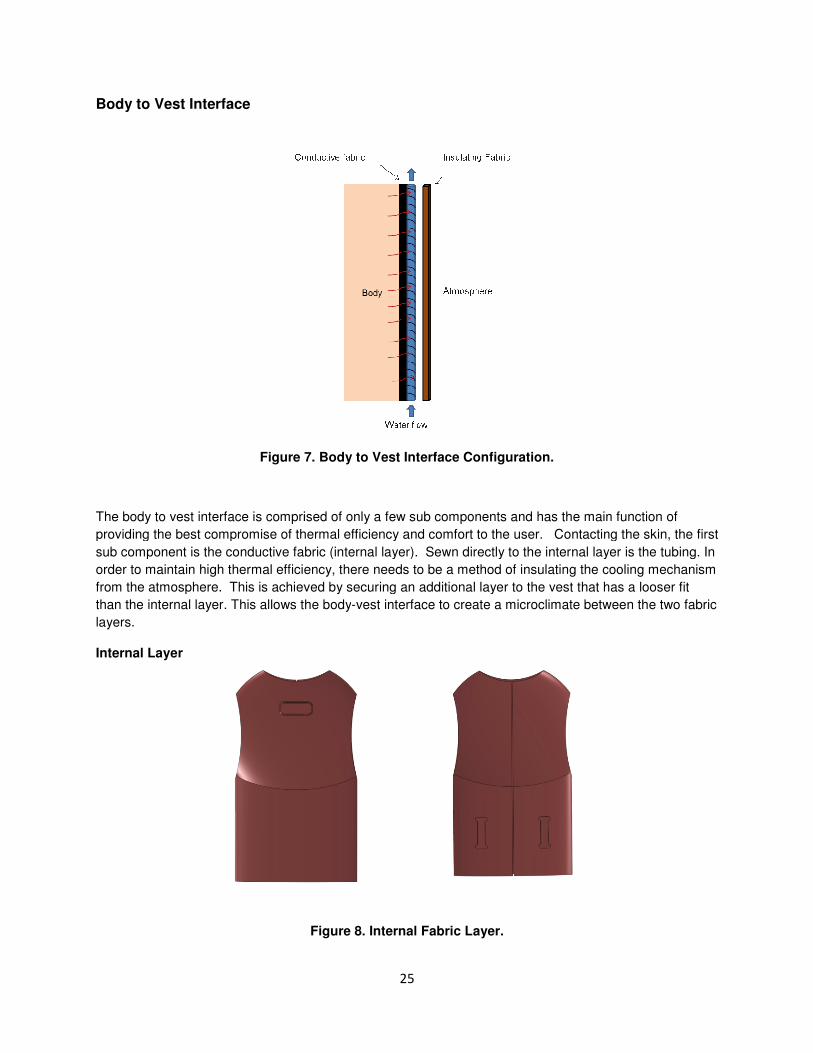
Figure 8. Internal Fabric Layer.
The body to vest interface is comprised of only a few sub components and has the main function of providing the best compromise of thermal efficiency and comfort to the user. Contacting the skin, the first
layer). Sewn directly to the internal layer is the tubing. In order to maintain high thermal efficiency, there needs to be a method of insulating the cooling mechanism
t has a looser fit vest interface to create a microclimate between the two fabric
26
The first sub component of the body vest interface is the internal layer of the vest which has to keep a tight and comfortable fit to the user while supporting the major components of the entire vest to the torso of the user. A pouch on the back of the vest is sewn in to allow a place for the pump. The two hoops in the front of the vest are designed to secure the cooling module to the user.
The internal layer is sewn directly to the tubing, so it must be tight fitting to pull the tubing close to the body and maximize heat transfer. It must also be highly thermally conductive and breathable. For these reasons UnderArmor® Heat Gear® was selected, a blend of cationic polyester and elastane
Tubing
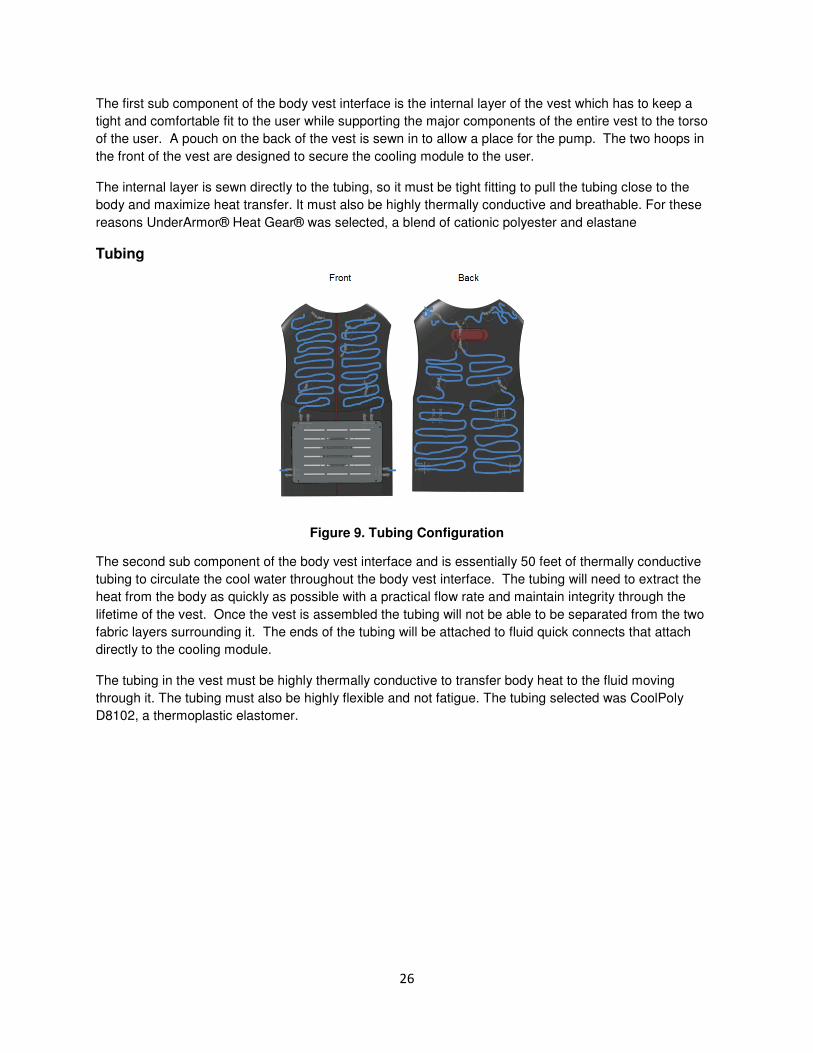
Figure 9. Tubing Configuration
The second sub component of the body vest interface and is essentially 50 feet of thermally conductive tubing to circulate the cool water throughout the body vest interface. The tubing will need to extract the heat from the body as quickly as possible with a practical flow rate and maintain integrity through the lifetime of the vest. Once the vest is assembled the tubing will not be able to be separated from the two fabric layers surrounding it. The ends of the tubing will be attached to fluid quick connects that attach directly to the cooling module.
The tubing in the vest must be highly thermally conductive to transfer body heat to the fluid moving through it. The tubing must also be highly flexible and not fatigue. The tubing selected was CoolPoly D8102, a thermoplastic elastomer.
External Layer
Figure
The final sub component of the body vest interface needs to provide insulation to the device and guide the tubing to and from the pump. The external layer (insulating fabric) must have a loose fit to the rest of the components with minimal contact. The lPolarTec 300 fabric was selected, a synthetic fleece material.
Cooling Module
Figure
27
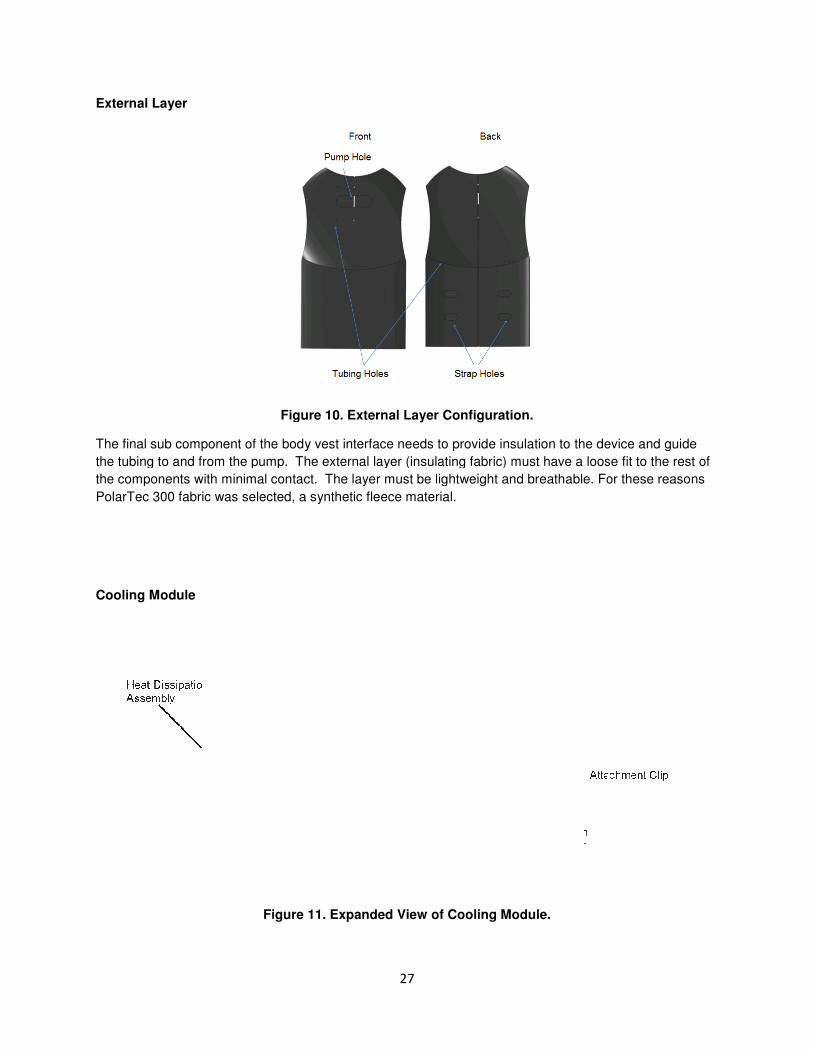
Figure 10. External Layer Configuration.
The final sub component of the body vest interface needs to provide insulation to the device and guide the tubing to and from the pump. The external layer (insulating fabric) must have a loose fit to the rest of the components with minimal contact. The layer must be lightweight and breathable. For these reasons PolarTec 300 fabric was selected, a synthetic fleece material.
Figure 11. Expanded View of Cooling Module.
The final sub component of the body vest interface needs to provide insulation to the device and guide the tubing to and from the pump. The external layer (insulating fabric) must have a loose fit to the rest of
ayer must be lightweight and breathable. For these reasons
28
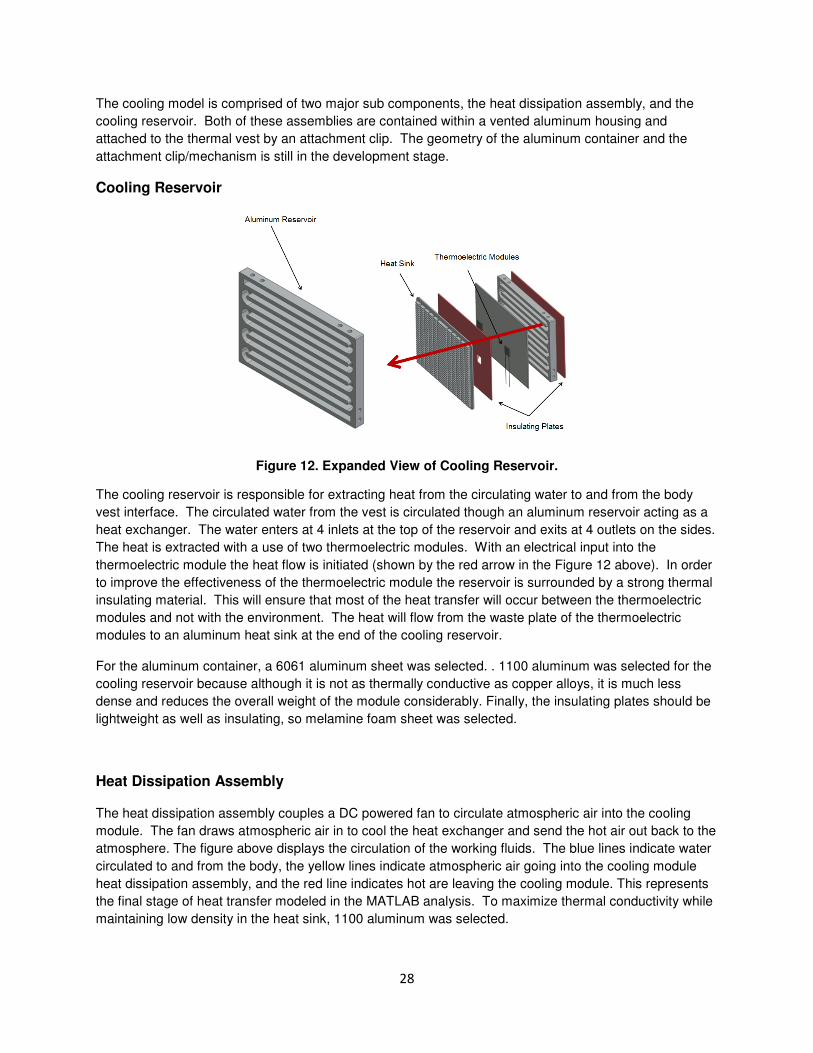
The cooling model is comprised of two major sub components, the heat dissipation assembly, and the cooling reservoir. Both of these assemblies are contained within a vented aluminum housing and attached to the thermal vest by an attachment clip. The geometry of the aluminum container and the attachment clip/mechanism is still in the development stage.
Cooling Reservoir
Figure 12. Expanded View of Cooling Reservoir.
The cooling reservoir is responsible for extracting heat from the circulating water to and from the body vest interface. The circulated water from the vest is circulated though an aluminum reservoir acting as a heat exchanger. The water enters at 4 inlets at the top of the reservoir and exits at 4 outlets on the sides. The heat is extracted with a use of two thermoelectric modules. With an electrical input into the thermoelectric module the heat flow is initiated (shown by the red arrow in the Figure 12 above). In order to improve the effectiveness of the thermoelectric module the reservoir is surrounded by a strong thermal insulating material. This will ensure that most of the heat transfer will occur between the thermoelectric modules and not with the environment. The heat will flow from the waste plate of the thermoelectric modules to an aluminum heat sink at the end of the cooling reservoir.
For the aluminum container, a 6061 aluminum sheet was selected. . 1100 aluminum was selected for the cooling reservoir because although it is not as thermally conductive as copper alloys, it is much less dense and reduces the overall weight of the module considerably. Finally, the insulating plates should be lightweight as well as insulating, so melamine foam sheet was selected.
Heat Dissipation Assembly
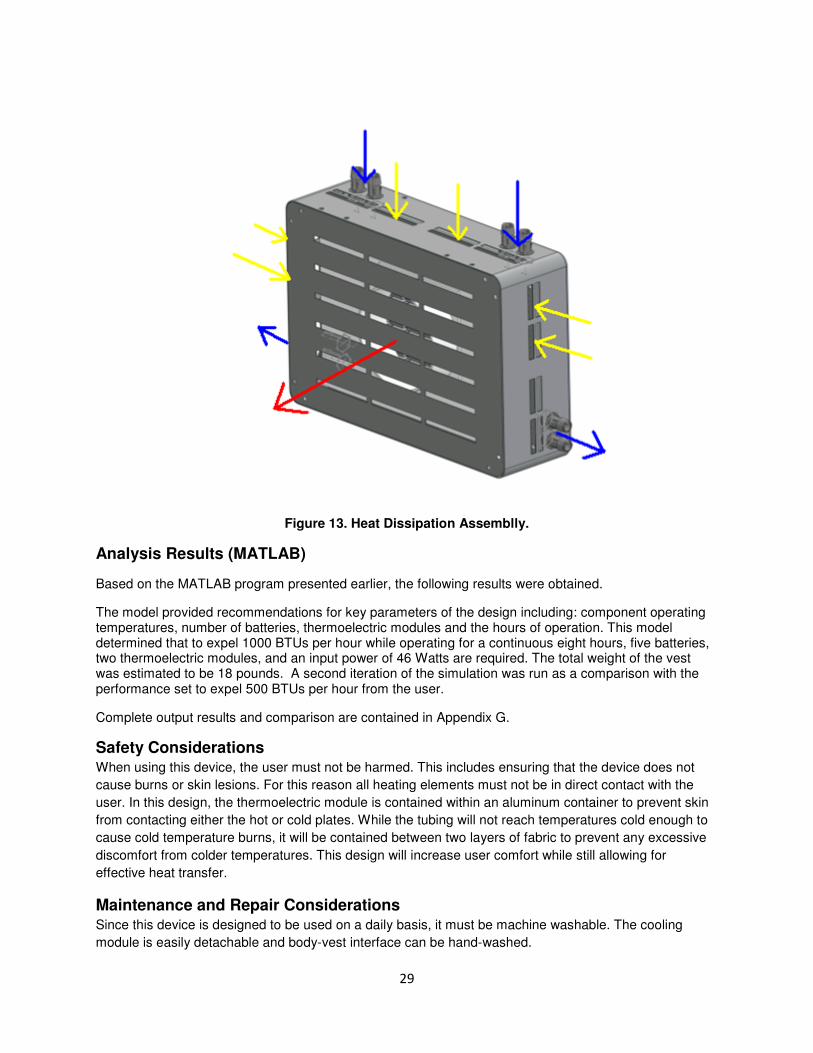
The heat dissipation assembly couples a DC powered fan to circulate atmospheric air into the cooling module. The fan draws atmospheric air in to cool the heat exchanger and send the hot air out back to the atmosphere. The figure above displays the circulation of the working fluids. The blue lines indicate water circulated to and from the body, the yellow lines indicate atmospheric air going into the cooling module heat dissipation assembly, and the red line indicates hot are leaving the cooling module. This represents the final stage of heat transfer modeled in the MATLAB analysis. To maximize thermal conductivity while maintaining low density in the heat sink, 1100 aluminum was selected.
29
Figure 13. Heat Dissipation Assemblly.
Analysis Results (MATLAB)
Based on the MATLAB program presented earlier, the following results were obtained.
The model provided recommendations for key parameters of the design including: component operating temperatures, number of batteries, thermoelectric modules and the hours of operation. This model determined that to expel 1000 BTUs per hour while operating for a continuous eight hours, five batteries, two thermoelectric modules, and an input power of 46 Watts are required. The total weight of the vest was estimated to be 18 pounds. A second iteration of the simulation was run as a comparison with the performance set to expel 500 BTUs per hour from the user.
Complete output results and comparison are contained in Appendix G.
Safety Considerations When using this device, the user must not be harmed. This includes ensuring that the device does not cause burns or skin lesions. For this reason all heating elements must not be in direct contact with the user. In this design, the thermoelectric module is contained within an aluminum container to prevent skin from contacting either the hot or cold plates. While the tubing will not reach temperatures cold enough to cause cold temperature burns, it will be contained between two layers of fabric to prevent any excessive discomfort from colder temperatures. This design will increase user comfort while still allowing for effective heat transfer.
Maintenance and Repair Considerations Since this device is designed to be used on a daily basis, it must be machine washable. The cooling module is easily detachable and body-vest interface can be hand-washed.
30
Chapter 5: Product Realization
Prototype
To create the initial prototype of this design, components from the Veskimo device will be used and custom parts will be ordered. Tubing from the veskimo will be reused. Local fabric professionals will be hired to sew both a conductive under armour material to the tubing. An insulating layer will also be attached.
Two custom thermoelectric modules will be ordered from Custom Thermoelectronics. The purchased modules will chill the water and recirculate the fluid to the veskimo tubing. Quick connect plugs will be purchased to connect the tubing to the reservoir.
Final Design
The final design will be composed entirely of custom parts. The same fabric materials will be used in the final design but different tubing will be purchased. The current prototype is an AC powered device with an infinite operation time. The final design will be battery powered and have a functional running time between two and eight hours. The final design may also be powered to work in a cyclic manner in which it is powered on for a designated amount of time followed by periods of time in which the device is powered off. Future iterations may also consider the addition of thermal sensors to power the device on when the skin temperature reaches a designated value.
Cost Estimate
The total cost of the vest component of the cooling was $619.75. The batteries at this stage of design cost $300 each. Future designs should focus on reducing the power requirements or finding alternate power options to reduce the vest cost. To construct the vest, including assembly and sewing, will require approximately $50 worth of labor due to the fact that sewing has to be outsourced locally. Therefore including labor the total cost of the vest component would be $669.75. As seen in the bill of materials (Appendix E), the other key costs are the tubing for $100 and the water pump for $100. These two items were specifically chosen because of their properties and thus cannot be replaced by a cheaper component without reducing the vest efficiency.
The cooling module resulted in a total cost of $523.59. The highest cost components in the reservoir were the two aluminum bars used to create the reservoir and the heat sink. Labor costs for the cooling module will be approximately $50. This is due to the need to machine the aluminum into the proper shape for use in the module; this includes labor and access to the resources necessary to machine the components. Including labor and material costs the total price for the cooling module is $573.59. It was found that Aluminum 1100 was the only commercially available aluminum that suited the functional requirements and thus it cannot be substituted without substantial change to the cooling unit. The thermoelectric modules are also another necessary cost as the thermoelectric modules selected were chosen based on the functional requirements.
Chapter 6: Design Verification Plan (Testing)
To verify that the customer and engineering requirements could be met by this design, five tests were designed to analyze the performance and needs omodeled the modes of heat transfer present in the system as follows:
1. Body to Vest Human Test while exercising
2. Body to Vest Human Test while stationary
3. Body to Vest Aluminum Container Model
4. Thermoelectric Performance
5. System Test to determine the Core Body Temperature Change
Test #1: Body to Vest Human Test while Exercising
The first test conducted was designed to model the amount of heat the Veskimo thermal vest was capable of extracting from a person under stress. To simulate the stress experienced when a body overheats two individuals ran eight minute miles in a controlled environment. One temperature probe was placed in the water reservoir and two temperature probes were placed on the bodyfront of the torso. Initially, each person ran an 8 minute mile without the vest to serve as the control. The individual then rested for 30 minutes before running a second eight minute mile while wearing the cooling vest. The change in body temperature between the control and experimental body temperatures were then compared to calculate how much heat the vest was able to extract from the human body.
Based on the data collected, Figure 10experimental tests, as well as the average water reservoir temperature.
Figure
31
Chapter 6: Design Verification Plan (Testing)
To verify that the customer and engineering requirements could be met by this design, five tests were designed to analyze the performance and needs of each component of the design. The five tests modeled the modes of heat transfer present in the system as follows:
1. Body to Vest Human Test while exercising
2. Body to Vest Human Test while stationary
3. Body to Vest Aluminum Container Model
moelectric Performance
5. System Test to determine the Core Body Temperature Change
Test #1: Body to Vest Human Test while Exercising
The first test conducted was designed to model the amount of heat the Veskimo thermal vest was m a person under stress. To simulate the stress experienced when a body
overheats two individuals ran eight minute miles in a controlled environment. One temperature probe was placed in the water reservoir and two temperature probes were placed on the body, specifically the upper front of the torso. Initially, each person ran an 8 minute mile without the vest to serve as the control. The individual then rested for 30 minutes before running a second eight minute mile while wearing the cooling
e in body temperature between the control and experimental body temperatures were then compared to calculate how much heat the vest was able to extract from the human body.
Based on the data collected, Figure 10 shows the average skin temperature during the control and experimental tests, as well as the average water reservoir temperature.
Figure 14.. Body to Vest Exercising Test Data
To verify that the customer and engineering requirements could be met by this design, five tests were f each component of the design. The five tests
The first test conducted was designed to model the amount of heat the Veskimo thermal vest was m a person under stress. To simulate the stress experienced when a body
overheats two individuals ran eight minute miles in a controlled environment. One temperature probe was , specifically the upper
front of the torso. Initially, each person ran an 8 minute mile without the vest to serve as the control. The individual then rested for 30 minutes before running a second eight minute mile while wearing the cooling
e in body temperature between the control and experimental body temperatures were then compared to calculate how much heat the vest was able to extract from the human body.
he control and
)(** TAhQ ∆=•
Figure 10 shows that the cooling vest was able to lower the average skin temperature during This data combined with the following equations allowed thebe calculated.
Governing Equation
Based on the difference in skin temperature from the control run and the vest run, the approximate surface area of the user’s torso, and the convection coefficient of the fluid in the Veskimo tubing wwas calculated to be 35 ((BTUs/hr)/ft^2*F). This data showed that the Veskimo vest was capable of removing 730 BTU/hour from the human body. This showed that a liquid cooled vest is capable of producing a cooling effect in the user.
Test # 2: Body to Vest Human Test while Stationary
The second test focused on testing the ability of the Veskimo vest to extract heat from an individual at rest. To set up the experiment one temperature probe was placed into the water reservoir and two temperature probes were placed on the upper torso. The test subject then wore the vest for three hours while remaining seated. Midway through the testing period an insulating layer, in the form of a sweatshirt, was added to prevent the user from becoming too chilled.
Figure
32
H
shows that the cooling vest was able to lower the average skin temperature during This data combined with the following equations allowed the amount of heat removed from the system to
Based on the difference in skin temperature from the control run and the vest run, the approximate surface area of the user’s torso, and the convection coefficient of the fluid in the Veskimo tubing wwas calculated to be 35 ((BTUs/hr)/ft^2*F). This data showed that the Veskimo vest was capable of removing 730 BTU/hour from the human body. This showed that a liquid cooled vest is capable of producing a cooling effect in the user.
to Vest Human Test while Stationary
The second test focused on testing the ability of the Veskimo vest to extract heat from an individual at rest. To set up the experiment one temperature probe was placed into the water reservoir and two
s were placed on the upper torso. The test subject then wore the vest for three hours while remaining seated. Midway through the testing period an insulating layer, in the form of a sweatshirt, was added to prevent the user from becoming too chilled.
Figure 15. Static Vest Temperature Data
shows that the cooling vest was able to lower the average skin temperature during exercise. amount of heat removed from the system to
Based on the difference in skin temperature from the control run and the vest run, the approximate surface area of the user’s torso, and the convection coefficient of the fluid in the Veskimo tubing which was calculated to be 35 ((BTUs/hr)/ft^2*F). This data showed that the Veskimo vest was capable of removing 730 BTU/hour from the human body. This showed that a liquid cooled vest is capable of
The second test focused on testing the ability of the Veskimo vest to extract heat from an individual at rest. To set up the experiment one temperature probe was placed into the water reservoir and two
s were placed on the upper torso. The test subject then wore the vest for three hours while remaining seated. Midway through the testing period an insulating layer, in the form of a sweatshirt,
Figure 15 shows the skin and reservoir temperature over a period of three hours. While wearing the cooling vest, the average skin temperature remained relatively constant around 94was not cooled over the testing period, the reservoir temperature increased as heat was being extracted from the human body. Around 10,000 seconds, an insulating layer (sweatshirt) was added to prevent the sensation of excessive cooling. The adda longer of period of time (i.e. a steeper slope after t=10,000s). This indicated that the addition of an insulating layer resulted in increased heat transfer from the liquid to the reserv
Based on the results of the first iteration of test #2, a second iteration was repeated with the subject wearing an external insulating layer of fabric over the vest throughout the entire 3 hour testing period. This was done to validate the assumptioninsulating layer would allow for the system to have a more effective heat transfer overall.
Figure
Figure 16a shows that the vest was able to maintain a relatively constant average temperature around 93⁰F. In addition Figure 16a shows that the water was cooled within the reservoir. Figure 16b calculates the temperature difference between the inlet and outlet of the reservoir. Based ostate conditions, the temperature difference between the inlet and outlet is 0.5BTUs/hour of heat, the reservoir temperature difference must be at least 0.5
33
Figure 15 shows the skin and reservoir temperature over a period of three hours. While wearing the cooling vest, the average skin temperature remained relatively constant around 94⁰F. Since,
over the testing period, the reservoir temperature increased as heat was being extracted from the human body. Around 10,000 seconds, an insulating layer (sweatshirt) was added to prevent the sensation of excessive cooling. The addition of this layer resulted in a smaller temperature increase over a longer of period of time (i.e. a steeper slope after t=10,000s). This indicated that the addition of an insulating layer resulted in increased heat transfer from the liquid to the reservoir.
Based on the results of the first iteration of test #2, a second iteration was repeated with the subject wearing an external insulating layer of fabric over the vest throughout the entire 3 hour testing period. This was done to validate the assumption made during the design process that the addition of an insulating layer would allow for the system to have a more effective heat transfer overall.
Figure 16. Body to Vest Insulative Layer Data
was able to maintain a relatively constant average temperature around F. In addition Figure 16a shows that the water was cooled within the reservoir. Figure 16b calculates
the temperature difference between the inlet and outlet of the reservoir. Based on this data at steadystate conditions, the temperature difference between the inlet and outlet is 0.5⁰F. In order to remove 750 BTUs/hour of heat, the reservoir temperature difference must be at least 0.5⁰F.
Figure 15 shows the skin and reservoir temperature over a period of three hours. While wearing the F. Since, the water
over the testing period, the reservoir temperature increased as heat was being extracted from the human body. Around 10,000 seconds, an insulating layer (sweatshirt) was added to prevent the
ition of this layer resulted in a smaller temperature increase over a longer of period of time (i.e. a steeper slope after t=10,000s). This indicated that the addition of an
Based on the results of the first iteration of test #2, a second iteration was repeated with the subject wearing an external insulating layer of fabric over the vest throughout the entire 3 hour testing period.
made during the design process that the addition of an insulating layer would allow for the system to have a more effective heat transfer overall.
was able to maintain a relatively constant average temperature around F. In addition Figure 16a shows that the water was cooled within the reservoir. Figure 16b calculates
n this data at steady-F. In order to remove 750
Test #3: Body to Vest Aluminum Container Mo
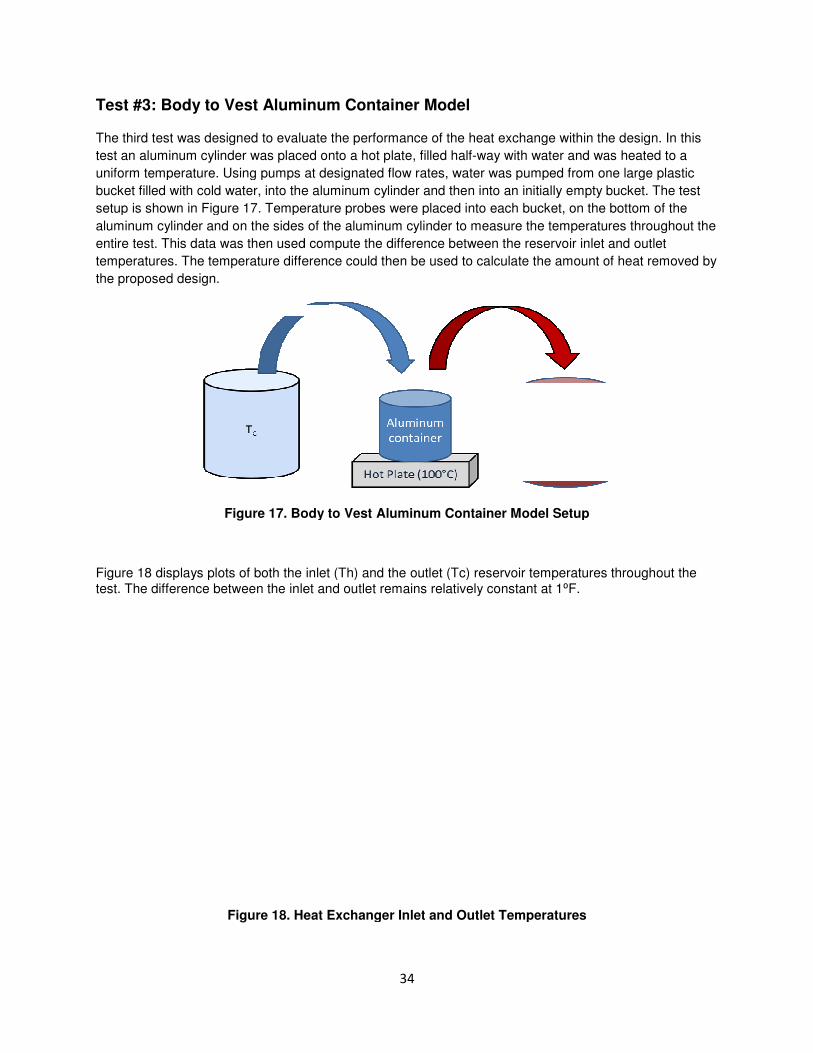
The third test was designed to evaluate the performance of the heat exchange within the design. In this test an aluminum cylinder was placed onto a hot plate, filled halfuniform temperature. Using pumps at designatedbucket filled with cold water, into the aluminum cylinder and then into an initially empty bucket. The test setup is shown in Figure 17. Temperature probes were placed into each bucket, on the bottom of aluminum cylinder and on the sides of the aluminum cylinder to measure the temperatures throughout the entire test. This data was then used compute the difference between the reservoir inlet and outlet temperatures. The temperature difference could thethe proposed design.
Figure 17. Body to Vest Aluminum Container Model Setup
Figure 18 displays plots of both the inlet (Th) and the outlet (Tc) reservoir temperatures throughotest. The difference between the inlet and outlet remains relatively constant at 1
Figure 18. Heat Exchanger Inlet and Outlet Temperatures
34
Test #3: Body to Vest Aluminum Container Model
The third test was designed to evaluate the performance of the heat exchange within the design. In this test an aluminum cylinder was placed onto a hot plate, filled half-way with water and was heated to a
temperature. Using pumps at designated flow rates, water was pumped from one large plastic bucket filled with cold water, into the aluminum cylinder and then into an initially empty bucket. The test setup is shown in Figure 17. Temperature probes were placed into each bucket, on the bottom of aluminum cylinder and on the sides of the aluminum cylinder to measure the temperatures throughout the entire test. This data was then used compute the difference between the reservoir inlet and outlet
difference could then be used to calculate the amount of heat removed by
. Body to Vest Aluminum Container Model Setup
Figure 18 displays plots of both the inlet (Th) and the outlet (Tc) reservoir temperatures throughotest. The difference between the inlet and outlet remains relatively constant at 1⁰F.
. Heat Exchanger Inlet and Outlet Temperatures
The third test was designed to evaluate the performance of the heat exchange within the design. In this way with water and was heated to a
flow rates, water was pumped from one large plastic bucket filled with cold water, into the aluminum cylinder and then into an initially empty bucket. The test setup is shown in Figure 17. Temperature probes were placed into each bucket, on the bottom of the aluminum cylinder and on the sides of the aluminum cylinder to measure the temperatures throughout the entire test. This data was then used compute the difference between the reservoir inlet and outlet
n be used to calculate the amount of heat removed by
Figure 18 displays plots of both the inlet (Th) and the outlet (Tc) reservoir temperatures throughout the
Using the following governing and derived equations, the heat transfer from
Governing Equation:
Derived Equations:
TV
D∆= *
)*(1
υπ
Test V
DT
V
D
=
∆)*(
**)*( ν
βν
By deriving a Buckingham Pi correlation for the internal flow forced convection, an equivalence ratio or 1/191 was determined for the scaled model. With the correlation we calculate that the system could remove 560 BTUs per hour of heat. This includes th
Test #4: Thermoelectric Performance
Test four was designed to evaluate the performance of the thermoelectric module incorporated into the design. This simulation allowed for a better understanding of thethe module and the amount of electrical energy requireddifference. To set up the test the thermoelectric module was placed onto an aluminum plate with foam boards placed on either side. With the hot side of the module aluminum plate was placed on top of the syst
Figure 19
According to the MATLAB model, to power and cool the system for a period of 8 hours, the temperature difference between the hot plate and the shows the temperatures of both the hot and cold plates in test #4.
35
Using the following governing and derived equations, the heat transfer from the system was calculated:
Simulation
T
∆*)
By deriving a Buckingham Pi correlation for the internal flow forced convection, an equivalence ratio or 1/191 was determined for the scaled model. With the correlation we calculate that the system could remove 560 BTUs per hour of heat. This includes the cooling reservoir component of the system only.
Test #4: Thermoelectric Performance
Test four was designed to evaluate the performance of the thermoelectric module incorporated into the design. This simulation allowed for a better understanding of the energy conversion of the module and the amount of electrical energy required to establish the desired temperature difference. To set up the test the thermoelectric module was placed onto an aluminum plate with foam boards placed on either side. With the hot side of the module facing upwards a second aluminum plate was placed on top of the system. The setup is shown in Figure 19
19. Thermoelectric Performance Test Setup
According to the MATLAB model, to power and cool the system for a period of 8 hours, the temperature difference between the hot plate and the cold plate of thermoelectric module must be 46shows the temperatures of both the hot and cold plates in test #4.
the system was calculated:
By deriving a Buckingham Pi correlation for the internal flow forced convection, an equivalence ratio or 1/191 was determined for the scaled model. With the correlation we calculate that the system could
e cooling reservoir component of the system only.
Test four was designed to evaluate the performance of the thermoelectric module incorporated energy conversion of
the desired temperature difference. To set up the test the thermoelectric module was placed onto an aluminum plate with
facing upwards a second em. The setup is shown in Figure 19.
According to the MATLAB model, to power and cool the system for a period of 8 hours, the temperature cold plate of thermoelectric module must be 46⁰C. Figure X
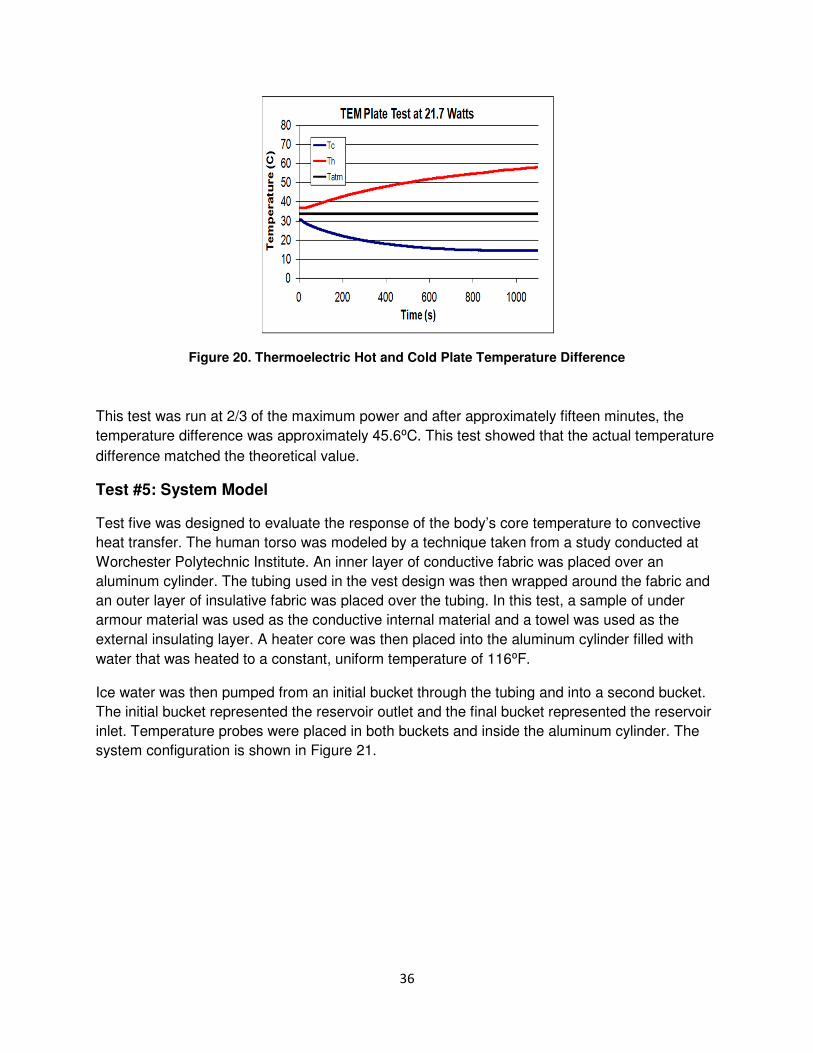
Figure 20. Thermoelectric Hot and Cold Plate Temperature Difference
This test was run at 2/3 of the maximum power and after approximately fifteen minutes, the temperature difference was approximately 45.6difference matched the theoretical value.
Test #5: System Model
Test five was designed to evaluate theheat transfer. The human torso was modeled by a technique taken from a study conducted Worchester Polytechnic Institute. An inner layer of conductive fabric was placed over an aluminum cylinder. The tubing used in the vest design was then wrapped around the fabric and an outer layer of insulative fabric was placed over the tubing. armour material was used as the conductive internal material and a towel was used as the external insulating layer. A heater corewater that was heated to a constant, uniform temperature of 116
Ice water was then pumped from an initial bucket through the tubing and into a second bucket.The initial bucket represented the reservoir outlet and the final bucket represented the reservoir inlet. Temperature probes were placed in both buckets and inside the aluminum cylinder. The system configuration is shown in Figure 21.
36
. Thermoelectric Hot and Cold Plate Temperature Difference
maximum power and after approximately fifteen minutes, the temperature difference was approximately 45.6⁰C. This test showed that the actual temperature difference matched the theoretical value.
Test five was designed to evaluate the response of the body’s core temperature to convective heat transfer. The human torso was modeled by a technique taken from a study conducted Worchester Polytechnic Institute. An inner layer of conductive fabric was placed over an
tubing used in the vest design was then wrapped around the fabric and an outer layer of insulative fabric was placed over the tubing. In this test, a sample of under armour material was used as the conductive internal material and a towel was used as the
heater core was then placed into the aluminum cylinder water that was heated to a constant, uniform temperature of 116⁰F.
water was then pumped from an initial bucket through the tubing and into a second bucket.The initial bucket represented the reservoir outlet and the final bucket represented the reservoir inlet. Temperature probes were placed in both buckets and inside the aluminum cylinder. The system configuration is shown in Figure 21.
. Thermoelectric Hot and Cold Plate Temperature Difference
maximum power and after approximately fifteen minutes, the C. This test showed that the actual temperature
response of the body’s core temperature to convective heat transfer. The human torso was modeled by a technique taken from a study conducted at Worchester Polytechnic Institute. An inner layer of conductive fabric was placed over an
tubing used in the vest design was then wrapped around the fabric and In this test, a sample of under
armour material was used as the conductive internal material and a towel was used as the cylinder filled with
water was then pumped from an initial bucket through the tubing and into a second bucket. The initial bucket represented the reservoir outlet and the final bucket represented the reservoir inlet. Temperature probes were placed in both buckets and inside the aluminum cylinder. The
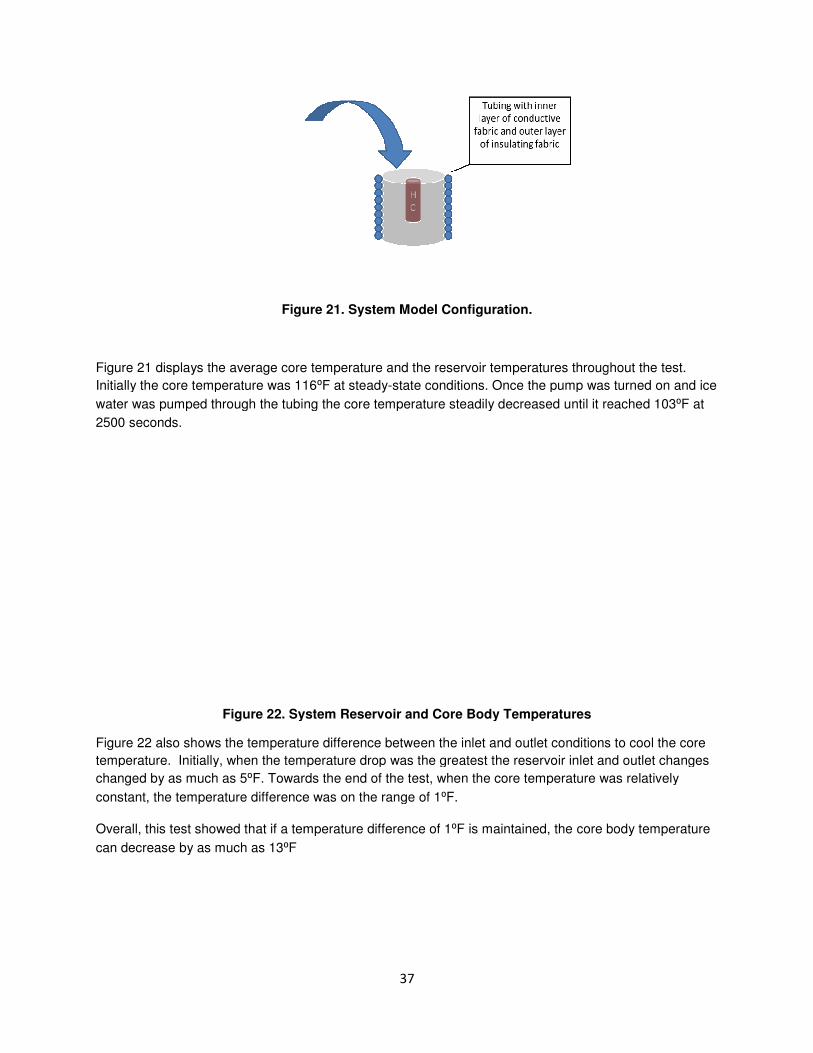
Figure
Figure 21 displays the average core temperature and the reservoir temperatures throughout the test. Initially the core temperature was 116water was pumped through the tubing the core temperature steadily decreased until it reached 1032500 seconds.
Figure 22. System Reservoir and Core Body Temperatures
Figure 22 also shows the temperature difference between the inlet and outlet conditions to cool the core temperature. Initially, when the temperature drop was the greatest the reservoir inlet and outlet changes changed by as much as 5⁰F. Towards the end of the test, whconstant, the temperature difference was on the range of 1
Overall, this test showed that if a temperature difference of 1can decrease by as much as 13⁰F
37
Figure 21. System Model Configuration.
Figure 21 displays the average core temperature and the reservoir temperatures throughout the test. Initially the core temperature was 116⁰F at steady-state conditions. Once the pump was turned on and ice
er was pumped through the tubing the core temperature steadily decreased until it reached 103
. System Reservoir and Core Body Temperatures
shows the temperature difference between the inlet and outlet conditions to cool the core temperature. Initially, when the temperature drop was the greatest the reservoir inlet and outlet changes
F. Towards the end of the test, when the core temperature was relatively constant, the temperature difference was on the range of 1⁰F.
Overall, this test showed that if a temperature difference of 1⁰F is maintained, the core body temperature
Figure 21 displays the average core temperature and the reservoir temperatures throughout the test. state conditions. Once the pump was turned on and ice
er was pumped through the tubing the core temperature steadily decreased until it reached 103⁰F at
shows the temperature difference between the inlet and outlet conditions to cool the core temperature. Initially, when the temperature drop was the greatest the reservoir inlet and outlet changes
en the core temperature was relatively
F is maintained, the core body temperature
38
Chapter 7: Conclusions & Recommendations
The MATLAB model showed that theoretically this design is capable of removing up to 1000 BTUS/hour of heat from the human body. However, there are certain limitations and requirements that must be met to fulfill this requirement.
Bench tests verified that this cooling mechanism is capable of extracting over 500 BTUs per hour from the human body. While the initial requirements stated that 1000 BTUs per hour needed to be extracted by the device, 500 BTUs per hour should be a sufficient amount of heat. The torso composes approximately half of the human body surface area; as a result additional heat is lost from the extremities, head, etc. Based on this assumption, the vest only needs to extract half the total heat.
Additionally, bench tests allowed for adjustments in certain design features. After optimizing testing features, the pump flow rate was increased from 500 ml per minute to 2000 ml per minute. This allowed for more efficient heat transfer throughout the device.
Lastly, one of the original design requirements for this project was the need to power the device for eight continuous hours. To meet this specification, the device would need five batteries that cost $300 each. Since one of the goals of this project is to produce a device that is reasonable priced, this requirement is quite excessive. Instead, either the device run time requirement may need to be reevaluated or ways to minimize battery usage need to be found. Most likely the device would not need to run for more than two hours to obtain the desired cooling results.

Chapter 8: Management PlanMethod of Approach
This project will be three quarters long. The first quarter will be dedicated to background research, formation of design requirements, determination of top conceptual models and the selection of the final design. The first quarter will also include the creation of CAD models and tmaterials. The second quarter will be dedicated to made based on the test results. The third quarter will consist of the fabrication of an initial prototype and the presentation of the project findings. ThisThe following table details the reports to be submitted to QL+ and project milestones.
Date Monday October 3rd
Monday October 10th
Monday October 31st
Monday November 14Monday November 21
Monday December 5
Monday January 2nd
Monday January 16th
Monday March 6th Monday, April 9th Monday, May 7
th
Monday, May 14th
Monday, May 28
th
Wednesday, May 30
Thursday, May 31st
The following flow chart diagrams the general process that will be utilized to complete this project.
39
Chapter 8: Management Plan
quarters long. The first quarter will be dedicated to background research, formation of design requirements, determination of top conceptual models and the selection of the final
arter will also include the creation of CAD models and the selection of final product materials. The second quarter will be dedicated to testing and modifying the final design. Revisions will be
The third quarter will consist of the fabrication of an initial prototype and sentation of the project findings. This project should be completed by Wednesday, May 30
The following table details the reports to be submitted to QL+ and project milestones.
Deliverable or Milestone Team Contract
Statement of Work th Project Planning (Gantt Chart) st Design Review
Preliminary Project Report Monday November 14th CAD Design Drawings Monday November 21st Design Review
Bill of Materials Monday December 5th Concept Design Report
Final Materials Selection nd Prototype Manufacturing
th Prototype Initial Testing Interim Design Report
Completion of Design Revision Completion of Prototype Fabrication
Prototype Testing Completed Prototype Revisions Completed
Wednesday, May 30th
2012 Project Poster Due Final Project Report Design Notebooks Due Proof-of-Concept Prototype
st, 2012 Senior Project Expo
The following flow chart diagrams the general process that will be utilized to complete this project.
quarters long. The first quarter will be dedicated to background research, formation of design requirements, determination of top conceptual models and the selection of the final
he selection of final product the final design. Revisions will be
The third quarter will consist of the fabrication of an initial prototype and Wednesday, May 30th, 2012.
Prototype Fabrication
The following flow chart diagrams the general process that will be utilized to complete this project.
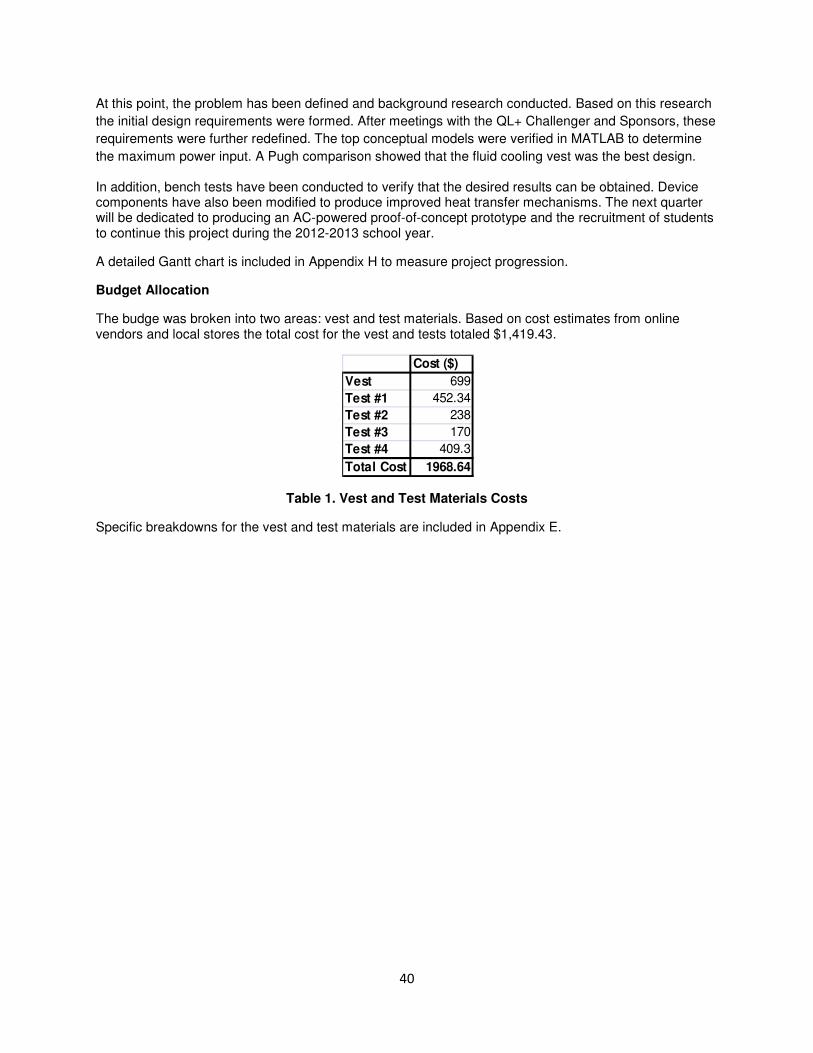
40
At this point, the problem has been defined and background research conducted. Based on this research the initial design requirements were formed. After meetings with the QL+ Challenger and Sponsors, these requirements were further redefined. The top conceptual models were verified in MATLAB to determine the maximum power input. A Pugh comparison showed that the fluid cooling vest was the best design.
In addition, bench tests have been conducted to verify that the desired results can be obtained. Device components have also been modified to produce improved heat transfer mechanisms. The next quarter will be dedicated to producing an AC-powered proof-of-concept prototype and the recruitment of students to continue this project during the 2012-2013 school year.
A detailed Gantt chart is included in Appendix H to measure project progression.
Budget Allocation
The budge was broken into two areas: vest and test materials. Based on cost estimates from online vendors and local stores the total cost for the vest and tests totaled $1,419.43.
Table 1. Vest and Test Materials Costs
Specific breakdowns for the vest and test materials are included in Appendix E.
Cost ($)
Vest 699Test #1 452.34Test #2 238Test #3 170Test #4 409.3Total Cost 1968.64
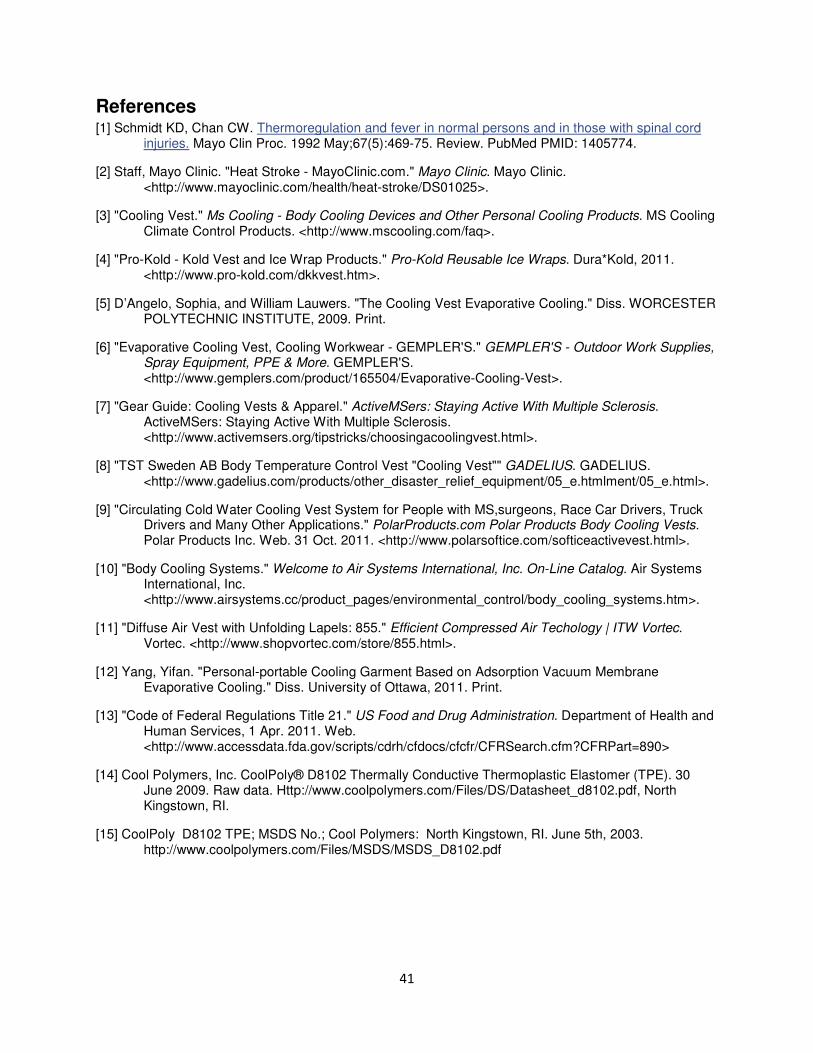
41
References [1] Schmidt KD, Chan CW. Thermoregulation and fever in normal persons and in those with spinal cord
injuries. Mayo Clin Proc. 1992 May;67(5):469-75. Review. PubMed PMID: 1405774.
[2] Staff, Mayo Clinic. "Heat Stroke - MayoClinic.com." Mayo Clinic. Mayo Clinic. <http://www.mayoclinic.com/health/heat-stroke/DS01025>.
[3] "Cooling Vest." Ms Cooling - Body Cooling Devices and Other Personal Cooling Products. MS Cooling Climate Control Products. <http://www.mscooling.com/faq>.
[4] "Pro-Kold - Kold Vest and Ice Wrap Products." Pro-Kold Reusable Ice Wraps. Dura*Kold, 2011. <http://www.pro-kold.com/dkkvest.htm>.
[5] D’Angelo, Sophia, and William Lauwers. "The Cooling Vest Evaporative Cooling." Diss. WORCESTER POLYTECHNIC INSTITUTE, 2009. Print.
[6] "Evaporative Cooling Vest, Cooling Workwear - GEMPLER'S." GEMPLER'S - Outdoor Work Supplies, Spray Equipment, PPE & More. GEMPLER'S. <http://www.gemplers.com/product/165504/Evaporative-Cooling-Vest>.
[7] "Gear Guide: Cooling Vests & Apparel." ActiveMSers: Staying Active With Multiple Sclerosis. ActiveMSers: Staying Active With Multiple Sclerosis. <http://www.activemsers.org/tipstricks/choosingacoolingvest.html>.
[8] "TST Sweden AB Body Temperature Control Vest "Cooling Vest"" GADELIUS. GADELIUS. <http://www.gadelius.com/products/other_disaster_relief_equipment/05_e.htmlment/05_e.html>.
[9] "Circulating Cold Water Cooling Vest System for People with MS,surgeons, Race Car Drivers, Truck Drivers and Many Other Applications." PolarProducts.com Polar Products Body Cooling Vests. Polar Products Inc. Web. 31 Oct. 2011. <http://www.polarsoftice.com/softiceactivevest.html>.
[10] "Body Cooling Systems." Welcome to Air Systems International, Inc. On-Line Catalog. Air Systems International, Inc. <http://www.airsystems.cc/product_pages/environmental_control/body_cooling_systems.htm>.
[11] "Diffuse Air Vest with Unfolding Lapels: 855." Efficient Compressed Air Techology | ITW Vortec. Vortec. <http://www.shopvortec.com/store/855.html>.
[12] Yang, Yifan. "Personal-portable Cooling Garment Based on Adsorption Vacuum Membrane Evaporative Cooling." Diss. University of Ottawa, 2011. Print.
[13] "Code of Federal Regulations Title 21." US Food and Drug Administration. Department of Health and Human Services, 1 Apr. 2011. Web. <http://www.accessdata.fda.gov/scripts/cdrh/cfdocs/cfcfr/CFRSearch.cfm?CFRPart=890>
[14] Cool Polymers, Inc. CoolPoly® D8102 Thermally Conductive Thermoplastic Elastomer (TPE). 30 June 2009. Raw data. Http://www.coolpolymers.com/Files/DS/Datasheet_d8102.pdf, North Kingstown, RI.
[15] CoolPoly D8102 TPE; MSDS No.; Cool Polymers: North Kingstown, RI. June 5th, 2003. http://www.coolpolymers.com/Files/MSDS/MSDS_D8102.pdf
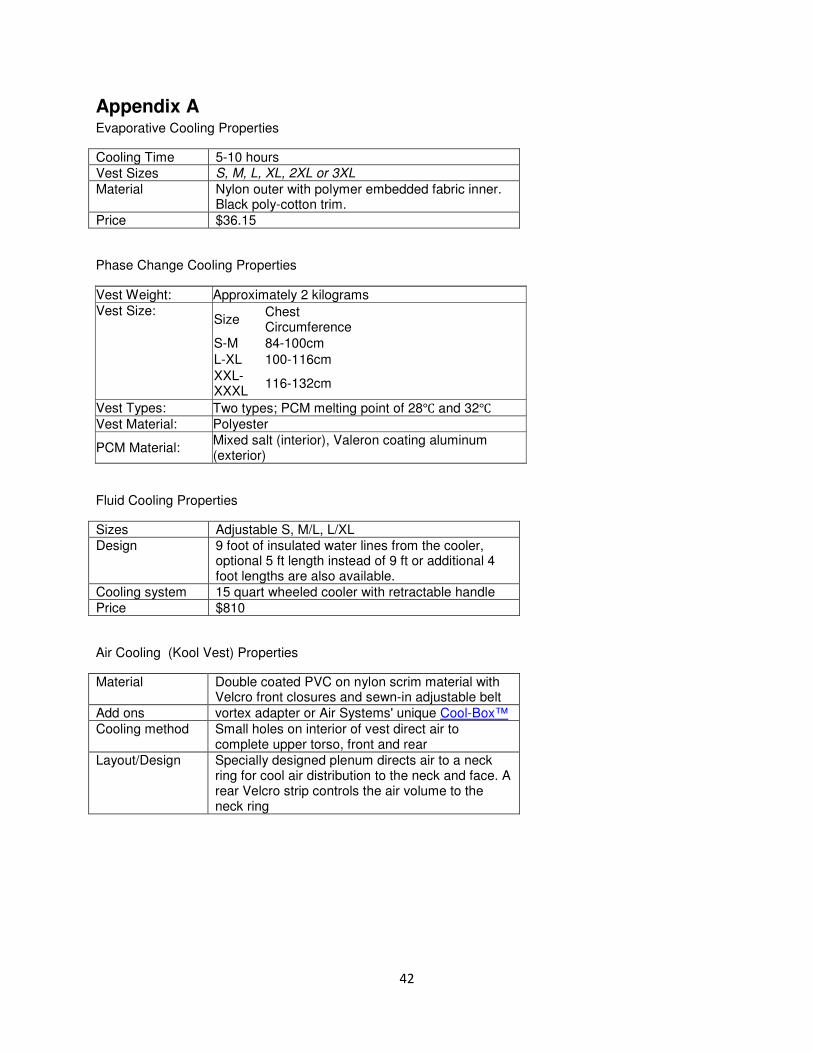
42
Appendix A Evaporative Cooling Properties
Cooling Time 5-10 hours Vest Sizes S, M, L, XL, 2XL or 3XL Material Nylon outer with polymer embedded fabric inner.
Black poly-cotton trim. Price $36.15
Phase Change Cooling Properties
Vest Weight: Approximately 2 kilograms Vest Size:
Size Chest Circumference
S-M 84-100cm L-XL 100-116cm XXL-XXXL 116-132cm
Vest Types: Two types; PCM melting point of 28℃ and 32℃ Vest Material: Polyester
PCM Material: Mixed salt (interior), Valeron coating aluminum (exterior)
Fluid Cooling Properties
Sizes Adjustable S, M/L, L/XL Design 9 foot of insulated water lines from the cooler,
optional 5 ft length instead of 9 ft or additional 4 foot lengths are also available.
Cooling system 15 quart wheeled cooler with retractable handle Price $810
Air Cooling (Kool Vest) Properties
Material Double coated PVC on nylon scrim material with Velcro front closures and sewn-in adjustable belt
Add ons vortex adapter or Air Systems' unique Cool-Box™ Cooling method Small holes on interior of vest direct air to
complete upper torso, front and rear Layout/Design Specially designed plenum directs air to a neck
ring for cool air distribution to the neck and face. A rear Velcro strip controls the air volume to the neck ring
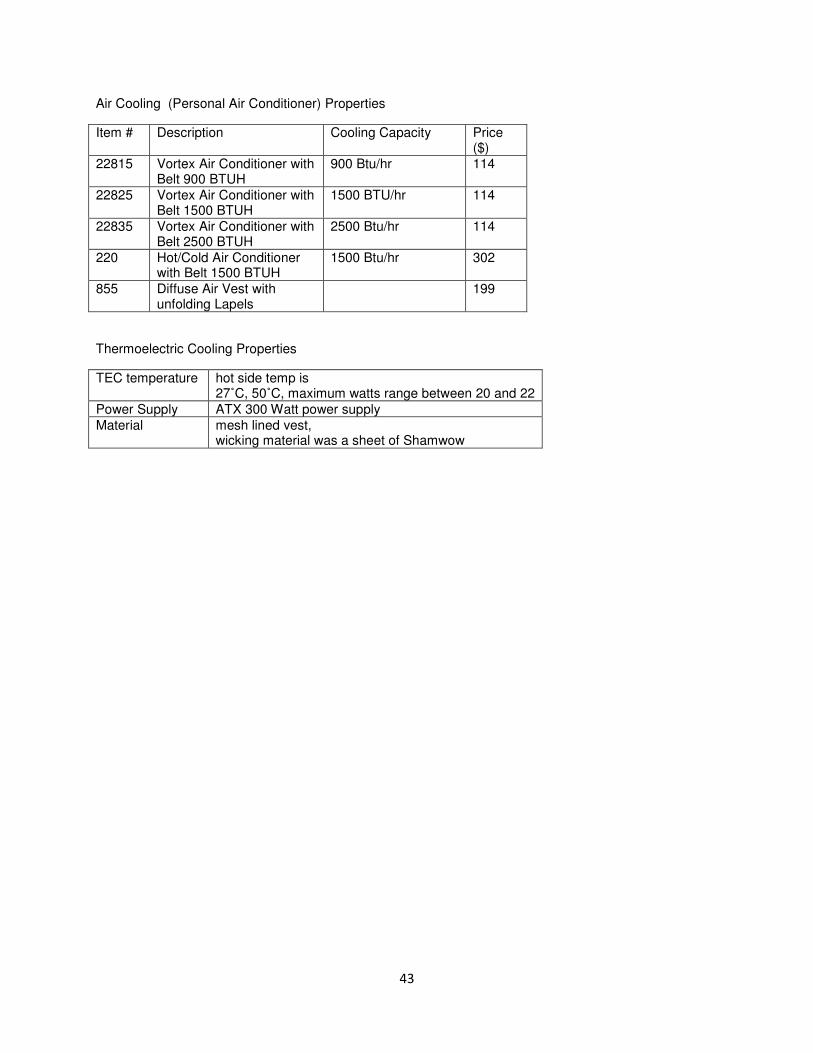
43
Air Cooling (Personal Air Conditioner) Properties
Item # Description Cooling Capacity Price ($)
22815 Vortex Air Conditioner with Belt 900 BTUH
900 Btu/hr 114
22825 Vortex Air Conditioner with Belt 1500 BTUH
1500 BTU/hr 114
22835 Vortex Air Conditioner with Belt 2500 BTUH
2500 Btu/hr 114
220 Hot/Cold Air Conditioner with Belt 1500 BTUH
1500 Btu/hr 302
855 Diffuse Air Vest with unfolding Lapels
199
Thermoelectric Cooling Properties
TEC temperature hot side temp is 27˚C, 50˚C, maximum watts range between 20 and 22
Power Supply ATX 300 Watt power supply Material mesh lined vest,
wicking material was a sheet of Shamwow
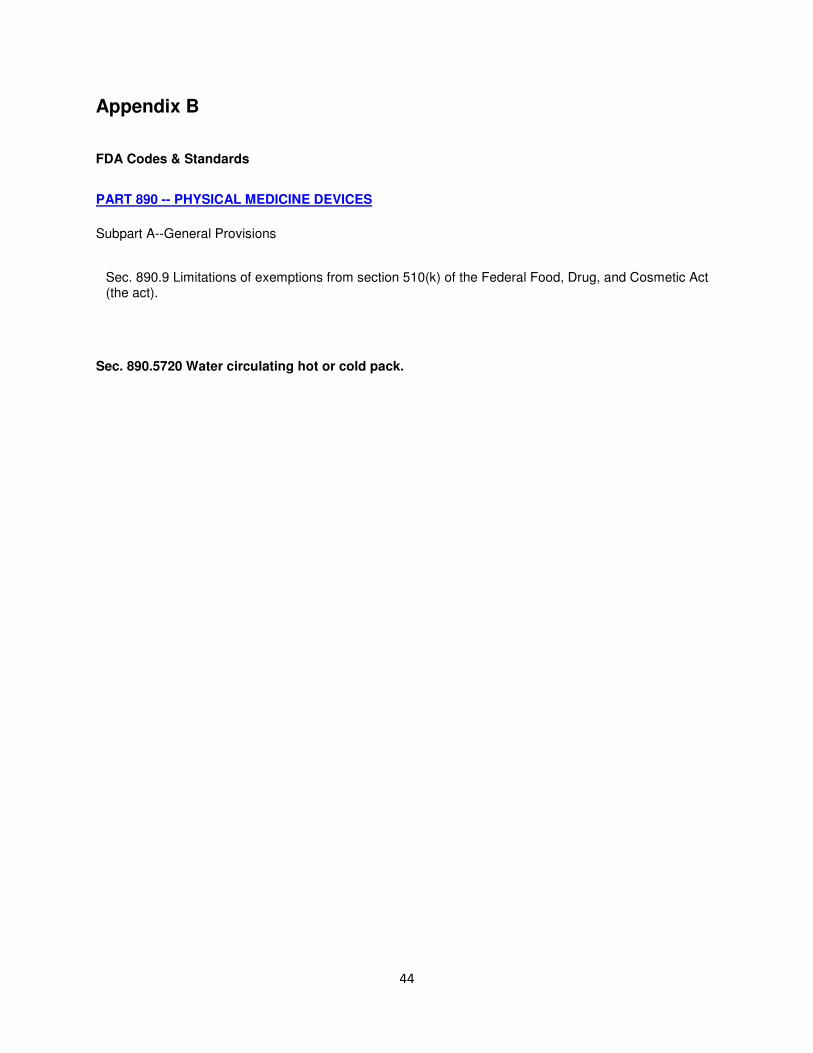
44
Appendix B
FDA Codes & Standards
PART 890 -- PHYSICAL MEDICINE DEVICES
Subpart A--General Provisions
Sec. 890.9 Limitations of exemptions from section 510(k) of the Federal Food, Drug, and Cosmetic Act (the act).
Sec. 890.5720 Water circulating hot or cold pack.
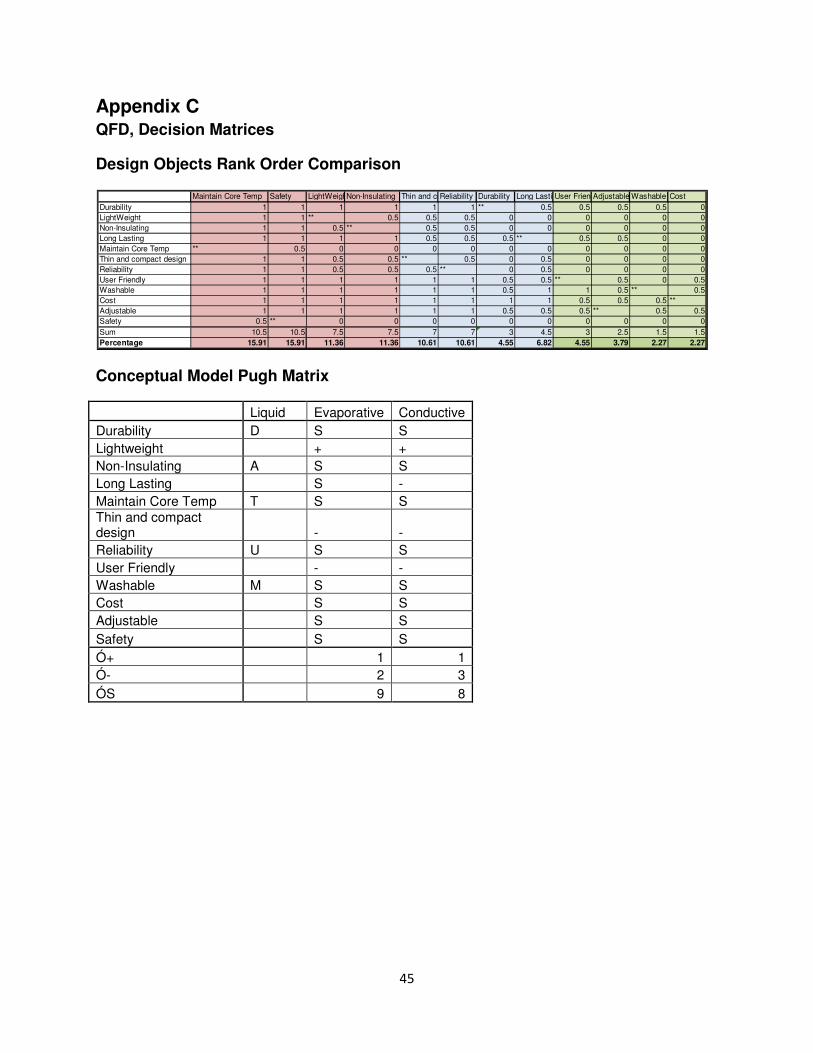
45
Appendix C QFD, Decision Matrices
Design Objects Rank Order Comparison
Conceptual Model Pugh Matrix
Liquid Evaporative Conductive Durability D S S Lightweight + + Non-Insulating A S S Long Lasting S - Maintain Core Temp T S S Thin and compact design - - Reliability U S S User Friendly - - Washable M S S Cost S S Adjustable S S Safety S S Ó+ 1 1 Ó- 2 3 ÓS 9 8
Maintain Core Temp Safety LightWeightNon-Insulating Thin and compact designReliability Durability Long LastingUser FriendlyAdjustable Washable CostDurability 1 1 1 1 1 1 ** 0.5 0.5 0.5 0.5 0LightWeight 1 1 ** 0.5 0.5 0.5 0 0 0 0 0 0Non-Insulating 1 1 0.5 ** 0.5 0.5 0 0 0 0 0 0Long Lasting 1 1 1 1 0.5 0.5 0.5 ** 0.5 0.5 0 0Maintain Core Temp ** 0.5 0 0 0 0 0 0 0 0 0 0Thin and compact design 1 1 0.5 0.5 ** 0.5 0 0.5 0 0 0 0Reliability 1 1 0.5 0.5 0.5 ** 0 0.5 0 0 0 0User Friendly 1 1 1 1 1 1 0.5 0.5 ** 0.5 0 0.5Washable 1 1 1 1 1 1 0.5 1 1 0.5 ** 0.5Cost 1 1 1 1 1 1 1 1 0.5 0.5 0.5 **Adjustable 1 1 1 1 1 1 0.5 0.5 0.5 ** 0.5 0.5Safety 0.5 ** 0 0 0 0 0 0 0 0 0 0Sum 10.5 10.5 7.5 7.5 7 7 3 4.5 3 2.5 1.5 1.5Percentage 15.91 15.91 11.36 11.36 10.61 10.61 4.55 6.82 4.55 3.79 2.27 2.27
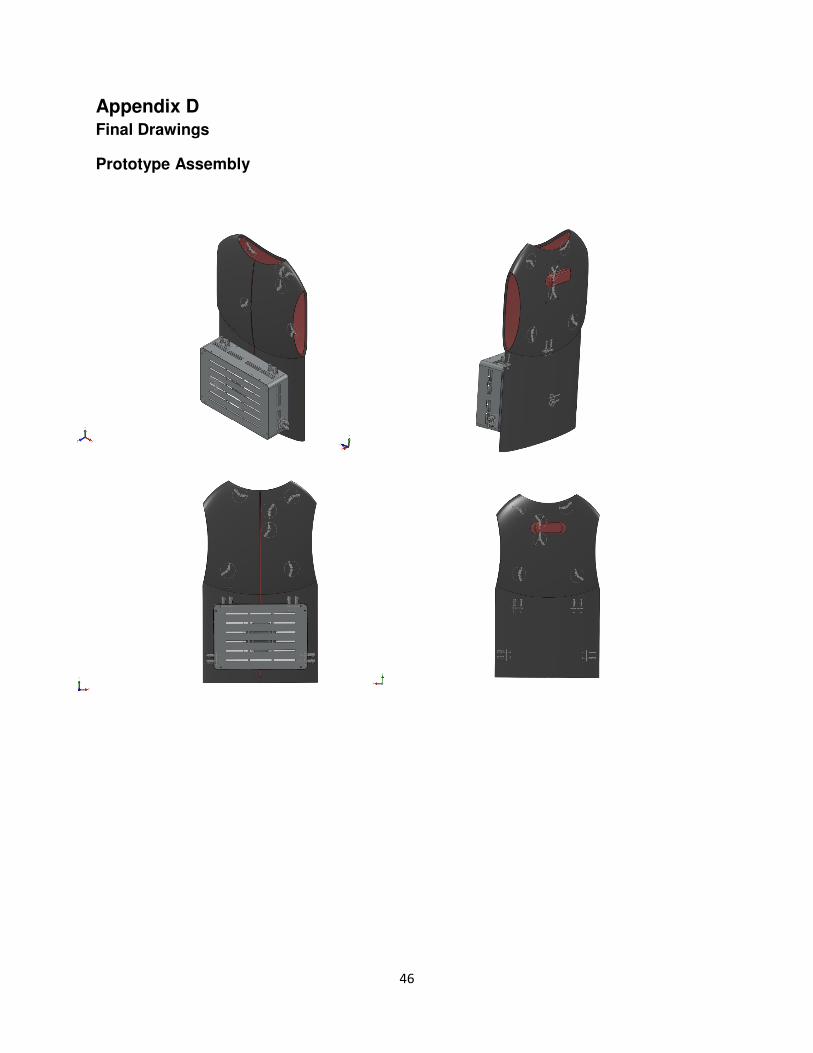
46
Appendix D Final Drawings
Prototype Assembly
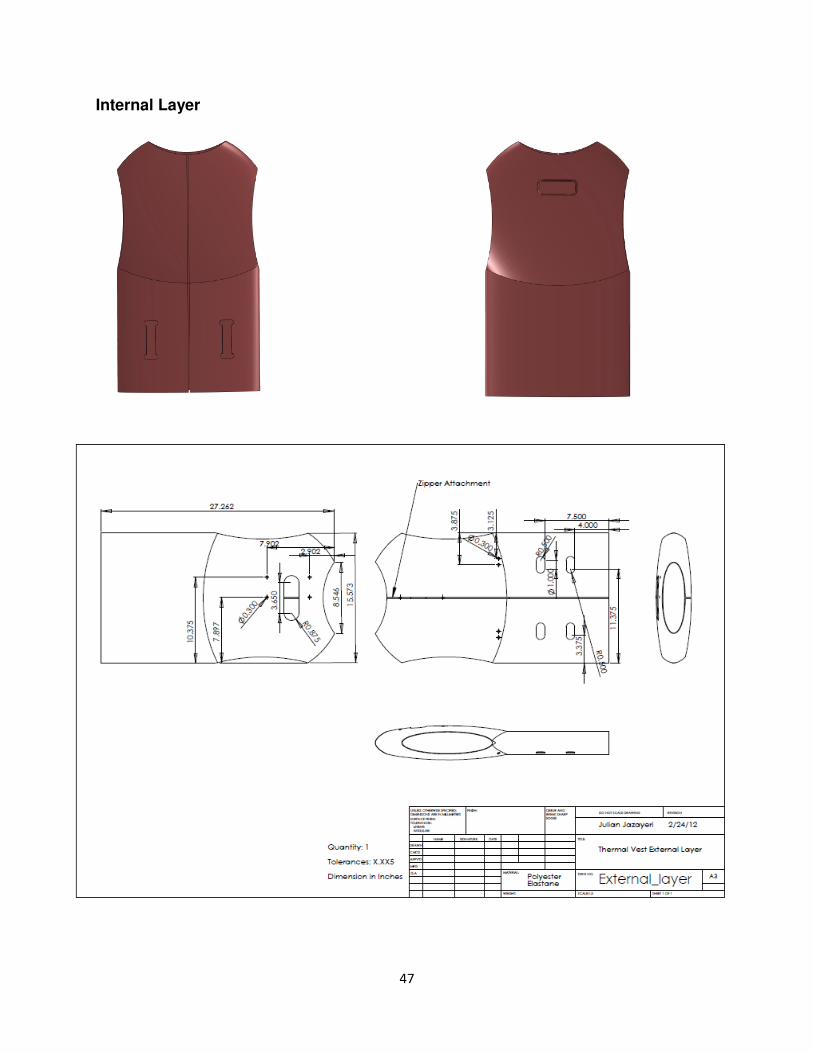
47
Internal Layer
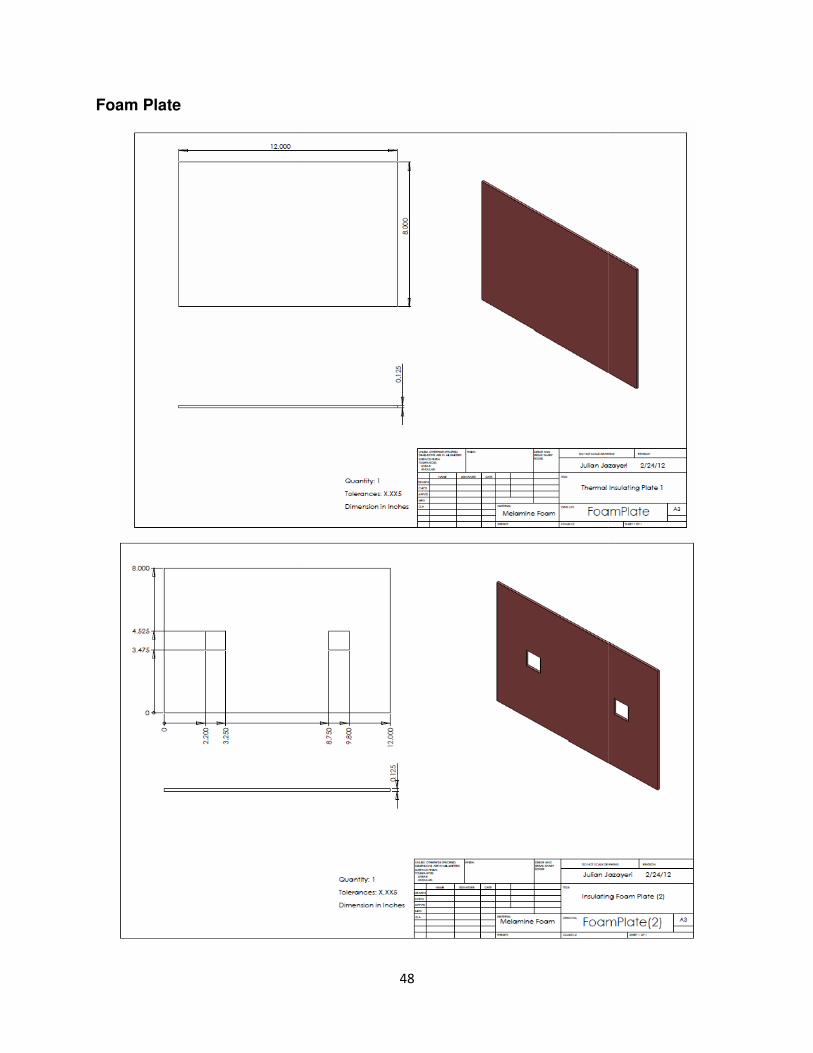
Foam Plate
48
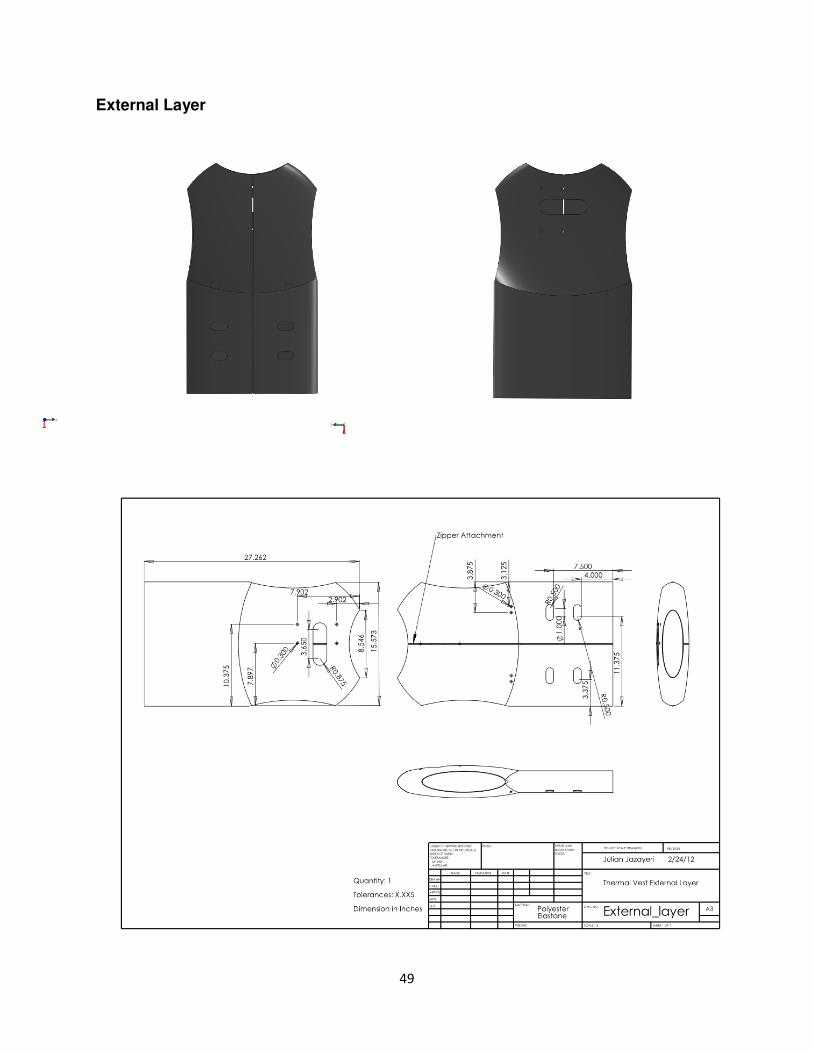
49
External Layer
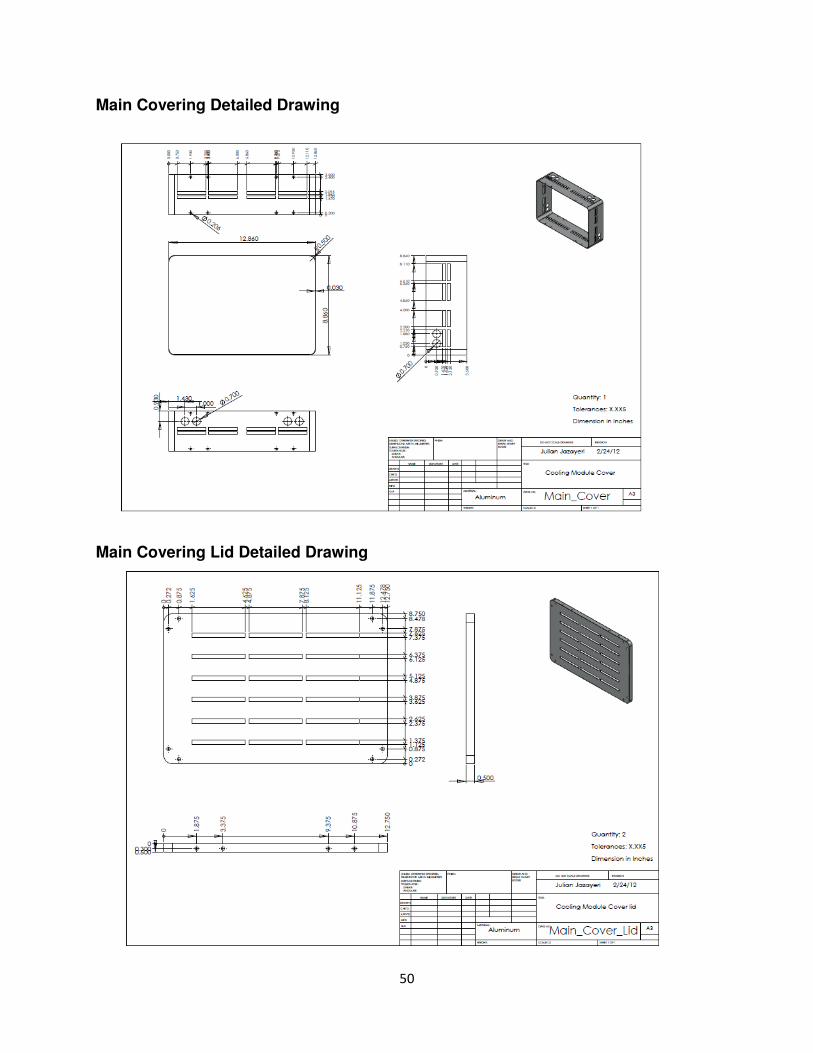
50
Main Covering Detailed Drawing
Main Covering Lid Detailed Drawing
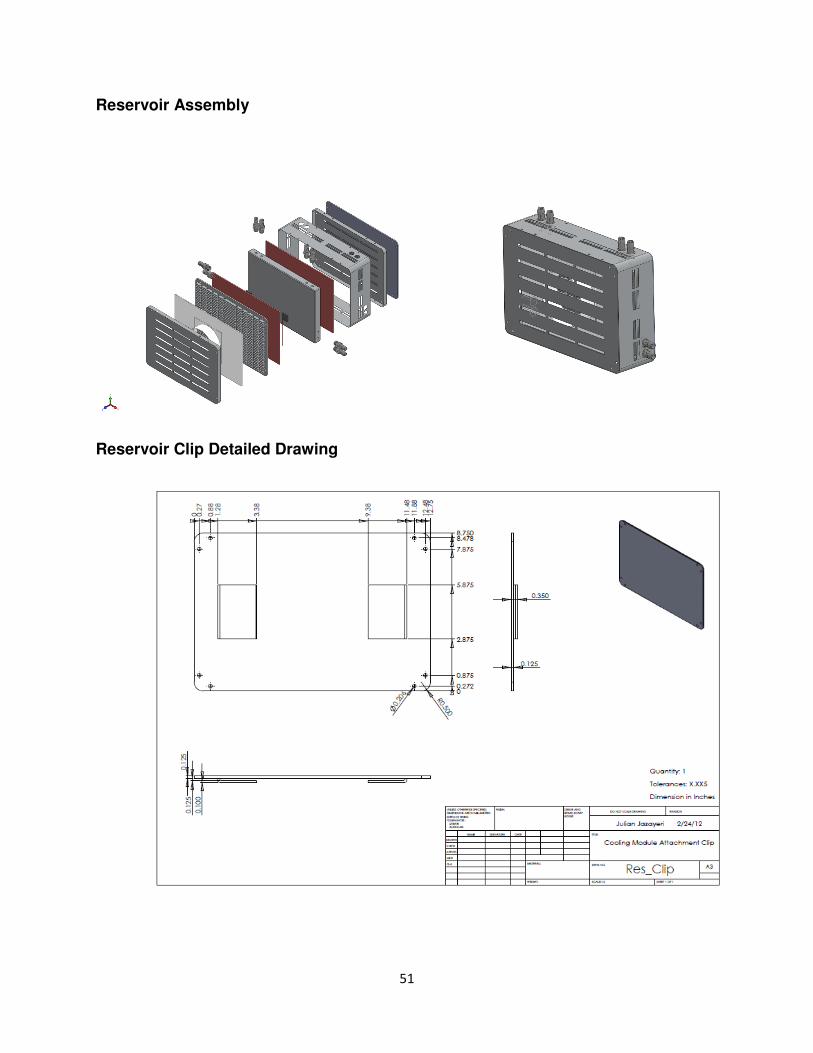
51
Reservoir Assembly
Reservoir Clip Detailed Drawing
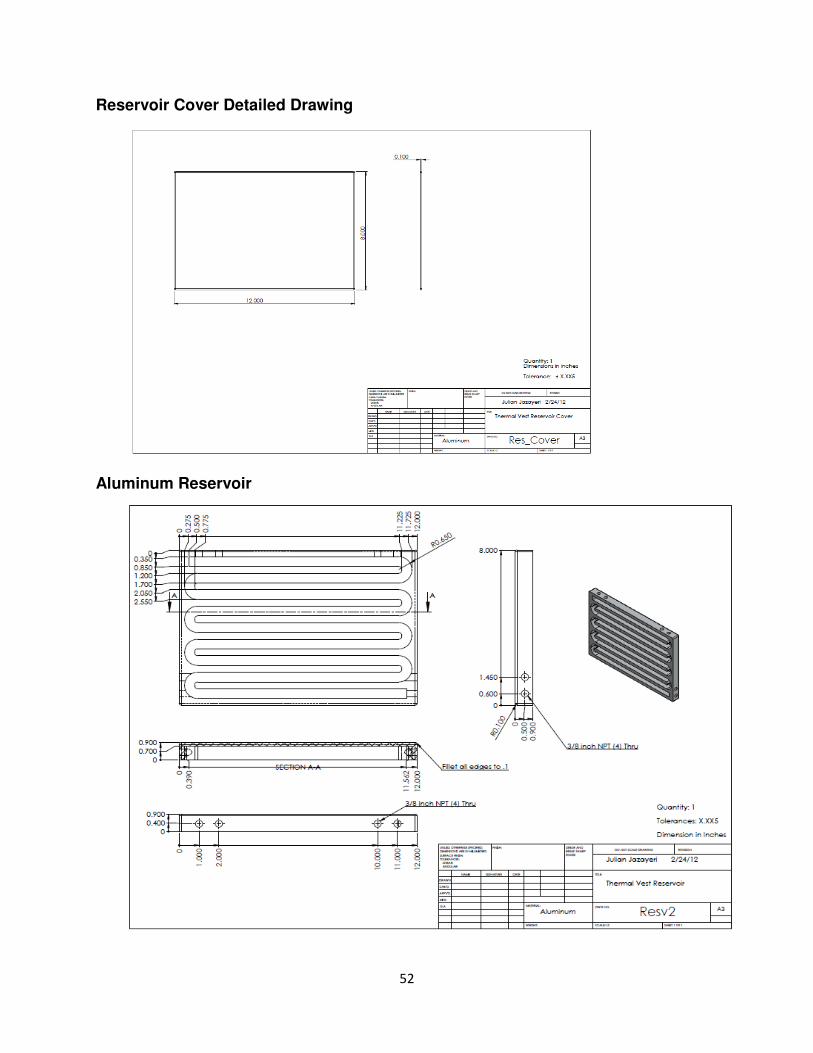
52
Reservoir Cover Detailed Drawing
Aluminum Reservoir
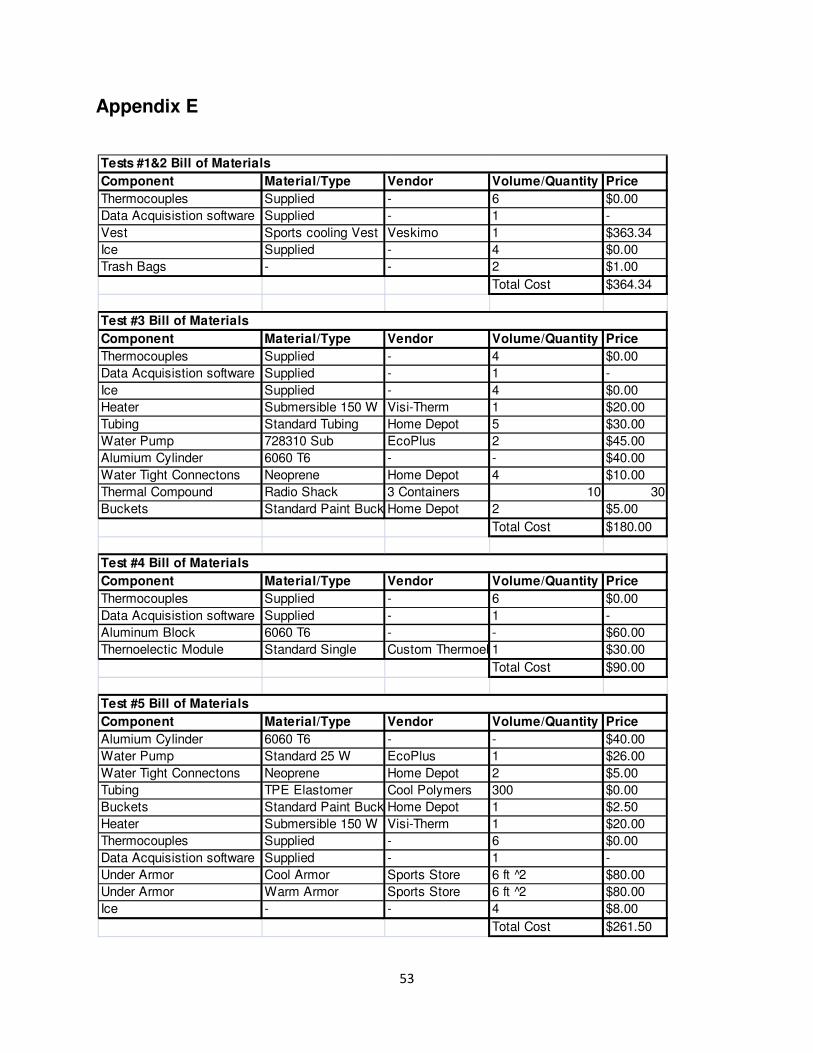
53
Appendix E
Component Material/Type Vendor Volume/Quantity Price
Thermocouples Supplied - 6 $0.00Data Acquisistion software Supplied - 1 -Vest Sports cooling Vest Veskimo 1 $363.34Ice Supplied - 4 $0.00Trash Bags - - 2 $1.00
Total Cost $364.34
Component Material/Type Vendor Volume/Quantity Price
Thermocouples Supplied - 4 $0.00Data Acquisistion software Supplied - 1 -Ice Supplied - 4 $0.00Heater Submersible 150 W Visi-Therm 1 $20.00Tubing Standard Tubing Home Depot 5 $30.00Water Pump 728310 Sub EcoPlus 2 $45.00Alumium Cylinder 6060 T6 - - $40.00Water Tight Connectons Neoprene Home Depot 4 $10.00Thermal Compound Radio Shack 3 Containers 10 30Buckets Standard Paint BucketHome Depot 2 $5.00
Total Cost $180.00
Component Material/Type Vendor Volume/Quantity Price
Thermocouples Supplied - 6 $0.00Data Acquisistion software Supplied - 1 -Aluminum Block 6060 T6 - - $60.00Thernoelectic Module Standard Single Custom Thermoelectric1 $30.00
Total Cost $90.00
Component Material/Type Vendor Volume/Quantity Price
Alumium Cylinder 6060 T6 - - $40.00Water Pump Standard 25 W EcoPlus 1 $26.00Water Tight Connectons Neoprene Home Depot 2 $5.00Tubing TPE Elastomer Cool Polymers 300 $0.00Buckets Standard Paint BucketHome Depot 1 $2.50Heater Submersible 150 W Visi-Therm 1 $20.00Thermocouples Supplied - 6 $0.00Data Acquisistion software Supplied - 1 -Under Armor Cool Armor Sports Store 6 ft 2̂ $80.00Under Armor Warm Armor Sports Store 6 ft 2̂ $80.00Ice - - 4 $8.00
Total Cost $261.50
Tests #1&2 Bill of Materials
Test #3 Bill of Materials
Test #4 Bill of Materials
Test #5 Bill of Materials
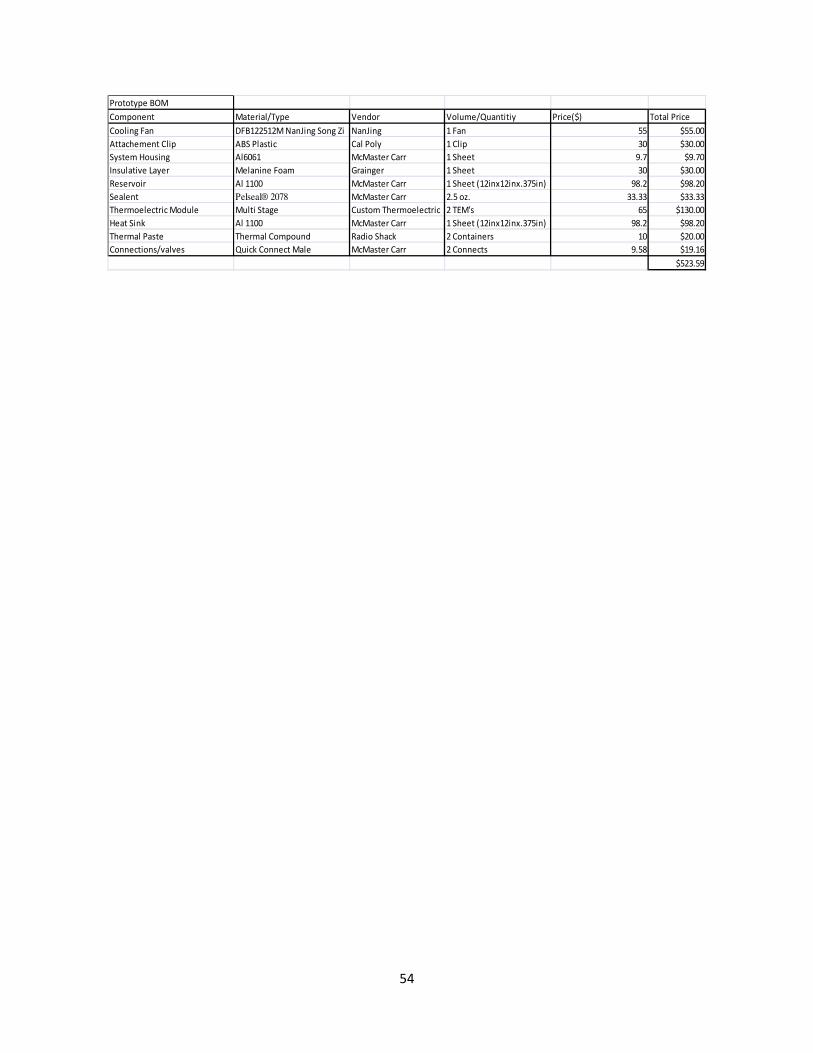
54
Prototype BOM
Component Material/Type Vendor Volume/Quantitiy Price($) Total Price
Cooling Fan DFB122512M NanJing Song Zi NanJing 1 Fan 55 $55.00
Attachement Clip ABS Plastic Cal Poly 1 Clip 30 $30.00
System Housing Al6061 McMaster Carr 1 Sheet 9.7 $9.70
Insulative Layer Melanine Foam Grainger 1 Sheet 30 $30.00
Reservoir Al 1100 McMaster Carr 1 Sheet (12inx12inx.375in) 98.2 $98.20
Sealent Pelseal® 2078 McMaster Carr 2.5 oz. 33.33 $33.33
Thermoelectric Module Multi Stage Custom Thermoelectric 2 TEM's 65 $130.00
Heat Sink Al 1100 McMaster Carr 1 Sheet (12inx12inx.375in) 98.2 $98.20
Thermal Paste Thermal Compound Radio Shack 2 Containers 10 $20.00
Connections/valves Quick Connect Male McMaster Carr 2 Connects 9.58 $19.16
$523.59
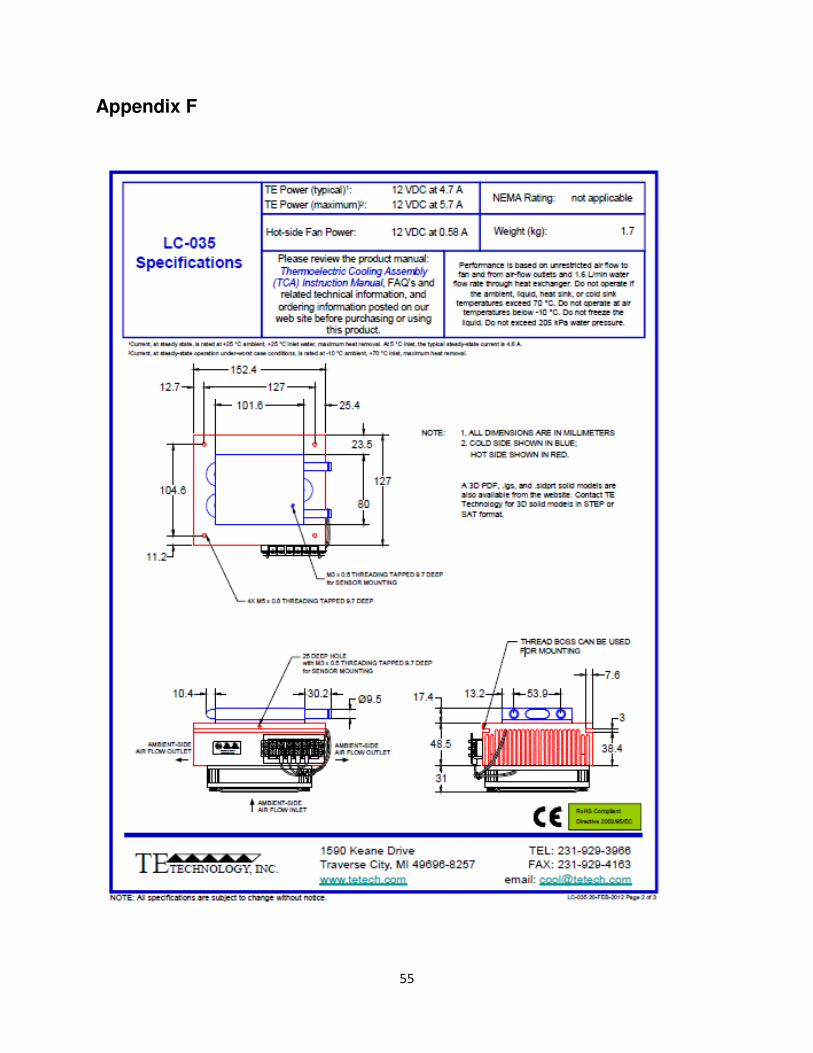
55
Appendix F
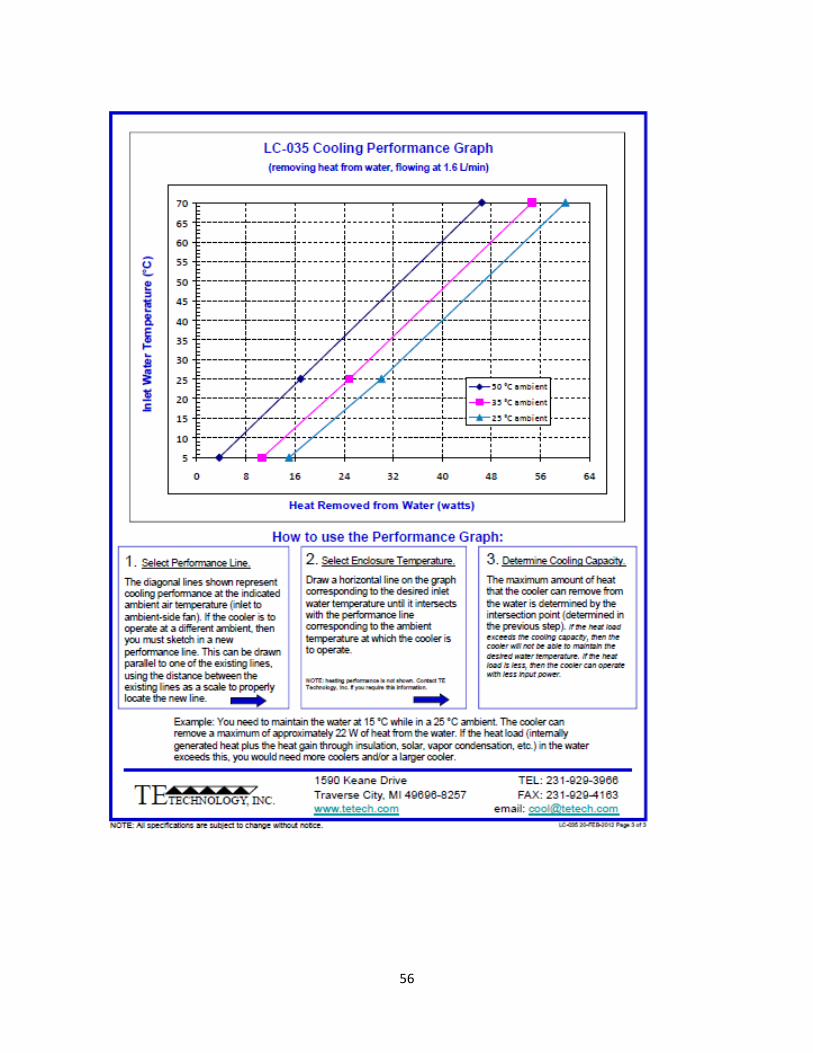
56
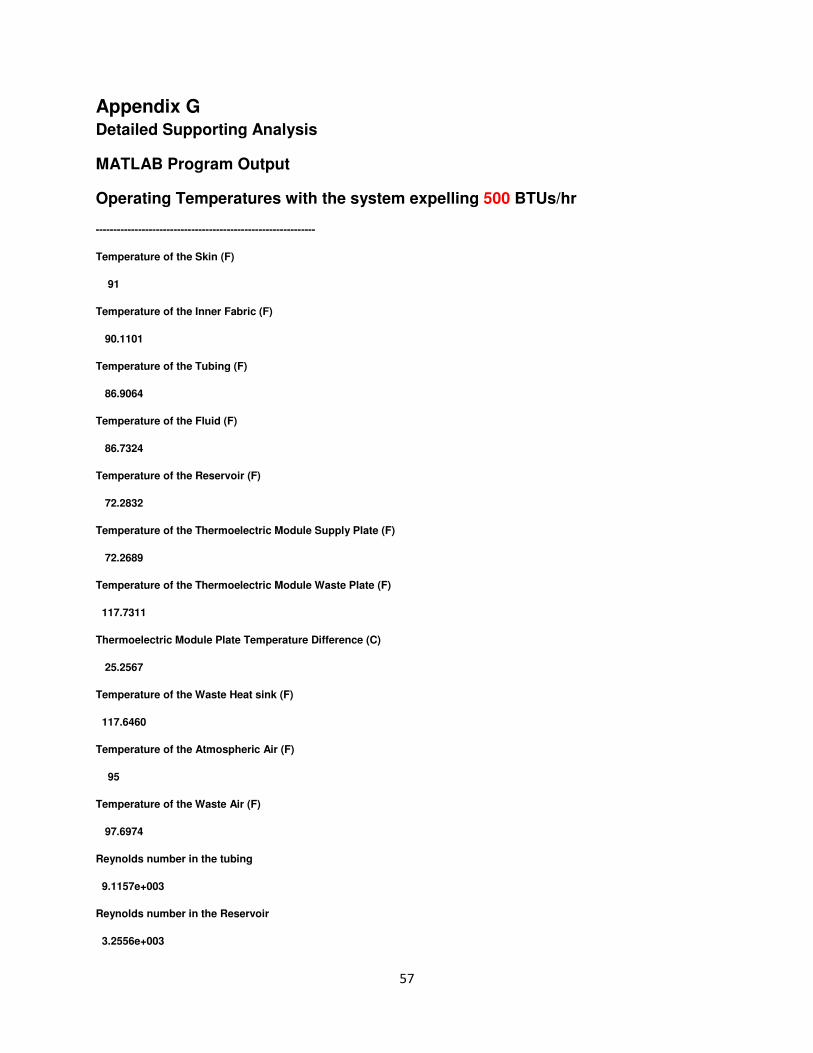
57
Appendix G Detailed Supporting Analysis
MATLAB Program Output
Operating Temperatures with the system expelling 500 BTUs/hr
--------------------------------------------------------------
Temperature of the Skin (F)
91
Temperature of the Inner Fabric (F)
90.1101
Temperature of the Tubing (F)
86.9064
Temperature of the Fluid (F)
86.7324
Temperature of the Reservoir (F)
72.2832
Temperature of the Thermoelectric Module Supply Plate (F)
72.2689
Temperature of the Thermoelectric Module Waste Plate (F)
117.7311
Thermoelectric Module Plate Temperature Difference (C)
25.2567
Temperature of the Waste Heat sink (F)
117.6460
Temperature of the Atmospheric Air (F)
95
Temperature of the Waste Air (F)
97.6974
Reynolds number in the tubing
9.1157e+003
Reynolds number in the Reservoir
3.2556e+003

58
Reynolds number in the Heat Sink
1.4592e+004
Convection Coeficient in the Tubing (BTU/Hr)/(ft*F)
1.9521e+003
Convection Coeficient in the Reservoir (BTU/Hr)/(ft*F)
305.9194
Convection Coeficient in the Heat Sink (BTU/Hr)/(ft*F)
52.5403
Input Power Required to Operate System (Watts)
28.7273
Number of Currently Selected Thermoelectric Modules
2
Hours of Operation
8
Number of Selected Batteries Required for continuous Operation
3
Total Estimated Weight of Thermal Vest (lbs)
16.1937
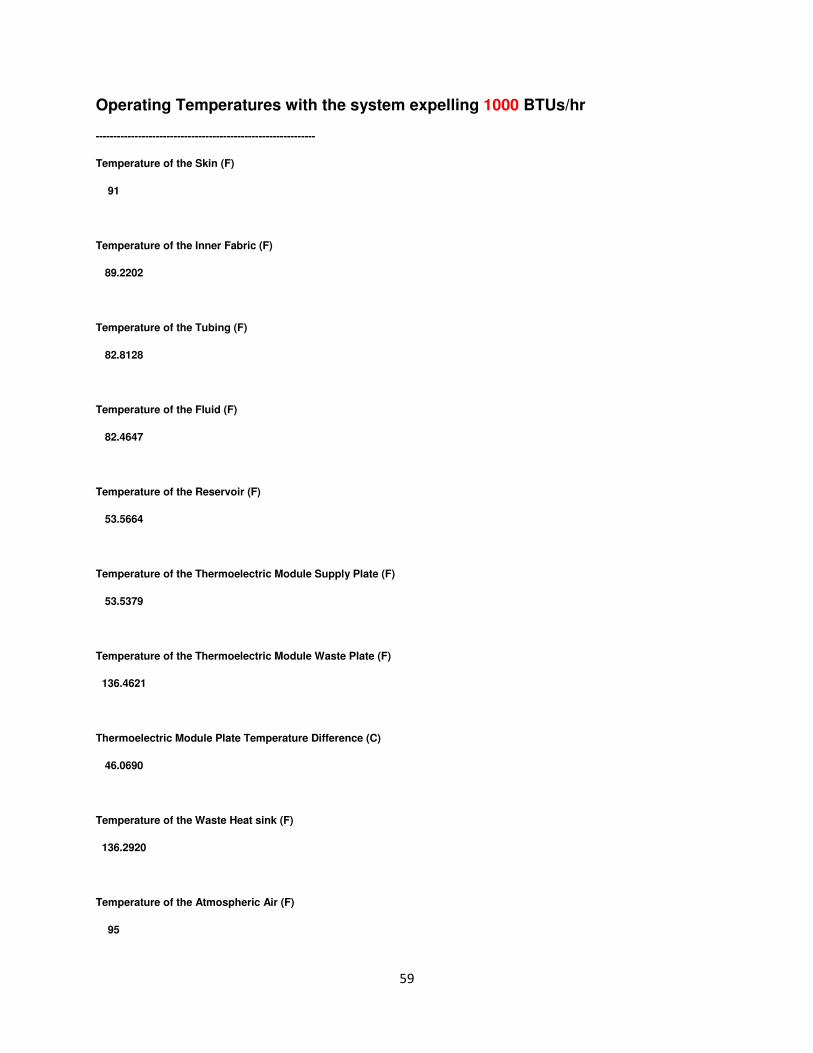
59
Operating Temperatures with the system expelling 1000 BTUs/hr
--------------------------------------------------------------
Temperature of the Skin (F)
91
Temperature of the Inner Fabric (F)
89.2202
Temperature of the Tubing (F)
82.8128
Temperature of the Fluid (F)
82.4647
Temperature of the Reservoir (F)
53.5664
Temperature of the Thermoelectric Module Supply Plate (F)
53.5379
Temperature of the Thermoelectric Module Waste Plate (F)
136.4621
Thermoelectric Module Plate Temperature Difference (C)
46.0690
Temperature of the Waste Heat sink (F)
136.2920
Temperature of the Atmospheric Air (F)
95

60
Temperature of the Waste Air (F)
100.3947
Reynolds number in the tubing
9.1157e+003
Reynolds number in the Reservoir
3.2556e+003
Reynolds number in the Heat Sink
1.4592e+004
Convection Coeficient in the Tubing (BTU/Hr)/(ft*F)
1.9521e+003
Convection Coeficient in the Reservoir (BTU/Hr)/(ft*F)
305.9194
Convection Coeficient in the Heat Sink (BTU/Hr)/(ft*F)
52.5403
Input Power Required to Operate System (Watts)
46.0708
Number of Currently Selected Thermoelectric Modules
2
Hours of Operation
8
Number of Selected Batteries Required for continuous Operation

61
5
Total Estimated Weight of Thermal Vest (lbs)
17.9200
MATLAB code used: %% This Program Models the Thermal System of the Liquid Filled Active
Regulating Thermal Vest %% By Julian Jazayeri %% Inputs: Heat Direction, Energy Requirement, Skin Temperature, Fabric
inputs, Tube inputs, TEM inputs, Fluid Properties, Pump Inputs, Rerervoir
Inputs,Fluid Flow Properties %% Outputs: Operating Termperatures and paramerters of the componenets of the
system in order to transfer the heat required %% Assumptions: % System is at steady state at all heat transfer locations % Human Body needs to expel 1000 BTU/hr to maintain the core body temp % Atmospheric temperature is defined % Surface Area of torso is approximatetly 5.4 ft^2 %% Clear Work Space clc; clear; %% Inputs %% Cooling or Heating i=1; %
i=1 for cooling, i=anything for heating if i==1 n1=.3; %
Nud Coeficient else n1=.4; end %% Constant Inputs grav=32.2; %
Gravitational Constant (ft/s^2) Egen=1000; %
Body heat generation (Btu/hr) Tskin=91; %
Temperature of the skin (F) Tatm=95; %
Atmospheric Temperature (F) Acds=10.8*.5; %
Surface area of Torso (ft^2) t=8; %
Hours of Operation (Hours) %% Conductive Fabric Inputs (86% Cat Ionic Polyester, 14% Elastane) Kc1=.3*(1/1.73); %
Thermal Conductive Fabric Conduction Ceoficient (W/m*k)=>(btu/hr)/ft*F) FabThi=(.02/12); %
Thermal Conductive Fabric Thickness (ft)

62
Wfab=1; %
Weight of Conductive internal Fabric (lbs) %% Tube Inputs (TPE D8102) ID=(2/16)/12; %
Tube Inner Diameter (ft) OD=(3/16)/12; %
Tube Outer Diameter (ft) ktb=3*(1/1.73); %
Tubing Thermal Conductivity (W/m*k)=>(Btu/hr)/ft*F LenTube=45; %
Lenght of Tubing in Vest (ft) Ain=(ID/2)^2*3.14; %
Internal Area of Tubing Ao=(OD/2)^2*3.14; Atbi=ID*3.14*LenTube; %
Contact Surface Area inside of tube (ft^2) Atbo=ID/2*LenTube; %
Contact Surface Area outside of tube (ft^2) tubeden=78.1056; %
Density of tubeing material (lb/ft^3) Wtube=(Ao-Ain)*LenTube*tubeden; %
Weight of Tubing Components (lbs) %% TEM Inputs (Multi Stage Custom Thermoelectric 19012-5L31-06CQQ) nt=2; %
Number of Thermoelectric Modules dTmax=84; %
Max TEM Temperature side difference Vmax=15.5; %
DC Voltage Input Imax=6; %
Input Current (Amps) Emax=35; %
Input Energy (Watt) Len=nt/12; %
Lenght of TEM (ft) Wid=nt/12; %
Width of TEM (ft) Area=Len*Wid; %
TEM Conductive Surface Area (ft^2) S=Area; %
Shape Factor 2d Conduction qss=.932; %
Steady State Conduction 2d factor Wtem=.125*nt; %
Thermoelectric module component weight (lbs) %% Fluid Properties (water) vis=1.052*10^-5; %
Kinematic Fluid viscosity (ft^2/s) uvis=2.034*10^-5; %
Dynamic Fluid Viscosity (lb s/ft^2) den=1000*.06242; %
Fluid Density (kg/m^3)=>(lb/ft^3) %% Pump Inputs (Series GB magnetic Drive Pump From micro pump) np=1; %
Number of pumps HeadHeight=2; %
Pump expected maximum head loss (ft)

63
Ppump=(den*HeadHeight)*(.479); %
Pump Pressure from Head Height (mbar) Vdot=(((4000)-(Ppump/1000)*100)*0.000000589*np)/3; %
Volumetric flowrate (ml/min)=>(ft^3/s) Pump gear P35 at 3450 RPM mdotpu=Vdot*den; %
Pump Mass flow rate (lb/s) Vpu=26; %
Pump Input Voltage Ipu=.18; %
Pump Input Amps Epuin=Vpu*Ipu*np; %
Pump Input max power (watt) Wpump=.8*np; %
Weight of Pump components (lbs) %% Resivoir Inputs (Aluminum Material 1050A H9) ResLen=8/12; %
Resivoir Lenght (ft) ResWid=12/12; %
Resivor Width (ft Resthi=.15/12; %
Resivor Thickness (ft) ResWalthi=.15/12; %
Reservior wall thickness (ft) Dres=.35/12; %
internal path diamteter (ft) AinRes=3.14/4*Dres^2; %
internal res path area (ft^2) reslen=((ResWid-2*(ResWalthi))*Dres*9+(11.75/12)); %
Internal res fluid contact lenght (ft) Ares=3.14*Dres*reslen; %
interneal resivoir contact surface area (ft^2) Wres=19.21/3; %
Internal Res Weight (lbs) Khs=230*(1/1.731); %
Thermal Conductivity of Copper Heat Sink Material(W/(m*K)=>(btu/hr)/ft*F) %% Fluid Flow Properties (res/vest) vel=mdotpu/(den*Ain); %
Fluid Velocity (ft/s) Re=vel*(ID)/vis; %
Reynolds Number inside tubeing Pr=7; %
Prandtl Number k=.58/1.731; %
Fluid Thermal Conductivity (BTU/(hr*ft*F) velres=mdotpu/(den*AinRes); %
Velocity of Fluid inside resivoir (ft/s) Reres=velres*Dres/vis; %
Resivoir Reynolds Number Vflu=Ain*LenTube+AinRes*reslen; %
Volume of fluid in Vest (ft^3) Wflu=Vflu*den; %
Weight of fluid in vest (lbs) %% Waste Heat Sink (Aluminum Material 1050A H9) denal=167; %
Aluminum Density (lb/ft^3) hsLenght=12.75/12; %
Heat sink Lenght (ft)

64
hsWidth=8.75/12; %
Heat sink Width (ft) hsthick=.15/12; %
Heat sink Thickness (ft) finlen=.35/12; %
Heat sink fin lenght (ft) finwid=.75/12; %
Heat sink fin width (ft) finthi=.35/12; %
Heat sink fin thickness (ft) finrow=32; %
Heat sink number of fin rows fincol=12; %
Heat sink number of fin columns nf=finrow*fincol; %
Heat sink number of fins hsbotarea=hsLenght*hsWidth; %
Heat sink bottom area (ft^2) hstoparea=finlen*finwid*nf; %
Heat sink top area (ft^2) Val=30/(12^3); %
Heat sink Volume (ft^3) Whs=Val*denal; %
Weight of Aluminum (lbs) Khs2=230*(1/1.731); %
Thermal Conductivity of aluminum Heat Sink Material(W/(m*K)=>(btu/hr)/ft*F) fla=(((hsLenght-(fincol*finwid))*finthi)+(hsWidth-
(finrow*finlen)*finthi))*2;% Heat sink internal flow area (ft^2) da=((fla)/3.14)^(1/2)*4; %
Effective Heat Sink flow diameter Acair=(hsLenght*hsWidth)+nf*finlen*finwid*2+(finthi*finwid*nf)+(finthi*finlen
*nf*2); % Heat sink to air contact area (ft^2) %% Fan inputs (DFB122512M NanJing Song Zi Commercial Trade Co. Ltd) Wfan=.266*2.2; %
Weight of the Fan (lbs) Efan=3; %
Electrical energy input to fan (W) Vdotfan=79.66/60; %
Flow rate of fan (ft^3/min)=>(ft^3/s) %% Fluid Flow Properties (Atmospheric Air) avisc=16*10^-6*10.764; %
Kinematic Viscosity of air aden=1*.06242; %
Air Density (kg/m^3)=>(lb/ft^3) mdota=Vdotfan*aden; %
Mass Flow Rate of the air through the fan (lbs/s) avel=Vdotfan/(fla); %
Air velocity in Cooling unit (ft/s) Reair=avel*da/avisc; %
Reynolds number of the flowing air ka=.03*(1/1.731); %
Thermal Conductivity of air (W/(m*K)=>(btu/hr)/ft*F) %% Heat Transfer Models %% 1-D Conduction Heat Transfer Stage 1 (Heat Transfer from the Skin to the
Internal Vest Surface) if i==1

65
Tfab=Tskin-(Egen*FabThi)/(Acds*Kc1); %
Conductive Fabric Operating temperature (F) else Tfab=Tskin+(Egen*FabThi)/(Acds*Kc1); end %% 1-D Conduction Heat Transfer Stage 2 (Heat Transfer from The Internal Vest
Surface to the Tubing Material) if i==1 Ttb=Tfab-(Egen*(OD-ID)/2)/(Atbo*ktb); %
Tubing Operating Temperature (F) else Ttb=Tfab+(Egen*(OD-ID)/2)/(Atbo*ktb); end %% Internal Flow Forced Convecrion Stage 3 (Heat Transfer from the Tubing
material to the Flowing fluid) if (Re>=2500) Dev=10*ID; %
Lenght of Fully Developed Flow (ft) if Dev>LenTube display('Flow in Tubing is not Fully Developed'); end if (Re>20000) f=.316*Re^(-1/4); %
Turbulent friction Factor else f=.184*Re^(-1/5); %
Turbulent friction Factor end Nud=.023*Re^(4/5)*Pr^n1; %
Fully Developed Turbulent Flow Nusselt else Dev=.05*Re*Pr*ID; %
Lenght of Fully Developed Flow (ft) if Dev>LenTube display('Flow in Tubing is not Fully Developed'); end f=64/Re; %
Laminor Fully Developed Flow Friction Factor lenratio=LenTube/(ID); Nud=3.66+(.0668*(1/lenratio))*Re*Pr/(1+.04*((1/lenratio)*Re*Pr)^(2/3));%
Laminor Fully Developed Flow Nusselt Number (3.66-4.36) Typicaly end H1=Nud*k/(ID); %
Convection Coeficient (BTU/(hr*F*ft^2)) if i==1 Tf=Ttb-Egen/(H1*Atbi); %
Temperature of flowing fluid at operating temperature (F) else Tf=Ttb+Egen/(H1*Atbi); end %% Internal Flow Forced Convection Stage 4 (Heat Transfer from the flowing
fluid to the Res/Heat Exchanger) if (Reres>=2500) if (Reres>20000) fres=.316*Reres^(-1/4); %
Turbulent friction Factor

66
else fres=.184*Reres^(-1/5); %
Turbulent friction Factor end Nudres=.023*Reres^(4/5)*Pr^n1; %
Fully Developed Turbulent Flow Nusselt else Devres=.05*Reres*Pr*Dres; %
Lenght of Fully Developed Flow (ft) fres=64/Re; %
Laminor Fully Developed Flow Friction Factor lenratio2=reslen/Dres;
Nudres=3.66+(.0668*(1/lenratio2))*Reres*Pr/(1+.04*((1/lenratio2)*Reres*Pr)^(2
/3)); %
Laminor Fully Developed Flow Nusselt Number (3.66-4.36) Typicaly end H2=Nudres*k/(Dres); if i==1 Tres=Tf-Egen/(H2*Ares); %
Temperature of the Flowing Fluid else Tres=Tf+Egen/(H2*Ares); end %% 2-D Conduction Heat Transfer Stage 5 (Heat Transfer from the Res/Heat
Exchanger to the Thermoelecric Module) if i==1 Tsp=Tres-Egen*Resthi/(Khs*qss*S)*(S/(4*3.14)^(1/2)); %
Temperature of the Thermoelectric module Supply Plates for 1000(btu/hr) (F) Twp=(Tatm-Tsp)+Tatm; %
Temperatire of the Thermoelectric Module Waste Plates for 1000(btu/hr) (F) else Tsp=Tres+Egen*Resthi/(Khs*S*qss)*(S/(4*3.14)^(1/2)); Twp=(Tatm-Tsp)+Tatm; end dT=abs(Tsp-Twp)*(5/9); %
Thermoelectric module plate tmeperature difference (C) %% 2-D Conduction Heat Transfer Stage 6 (Heat Transfer From the
Thermoelectric Module to the Waste Heat Exchanger) if i==1 Thsb=Twp-Egen*hsthick/(Khs2*qss*S)*(S/(4*3.14)^(1/2)); %
Temperature of the heat sink bottom (F) Thst=Thsb-Egen*finthi/(Khs2*hsLenght*hsWidth); %
Temperature of the heat sink top (F) else Thsb=Twp+Egen*hsthick/(Khs2*qss*S)*(S/(4*3.14)^(1/2)); Thst=Thsb+Egen*finthi/(Khs2*hsLenght*hsWidth); end Thsave=(Thsb+Thst)/2; %
Average Heat sink temperature (F) %% Internal Flow Convection Heat Transfer Stage 7 (Heat Transfer from the
Heat Exchanger to Atmosphere if (Reair>=2500) if (Reair>20000) fair=.316*Reair^(-1/4); %
Turbulent friction Factor

67
else fair=.184*Reair^(-1/5); %
Turbulent friction Factor end Nudair=.023*Reair^(4/5)*Pr^n1; %
Fully Developed Turbulent Flow Nusselt else Devair=.05*Reair*Pr*da; %
Lenght of Fully Developed Flow (ft) fair=64/Reair; %
Laminor Fully Developed Flow Friction Factor
Nudair=3.66; %
Laminor Fully Developed Flow Nusselt Number (3.66-4.36) Typicaly
end H3=Nudair*ka/(Dres); if i==1 Tair=Tatm+Egen/(H3*Acair); %
Temperature of the Flowing Fluid else Tair=Tatm-Egen/(H3*Acair); end %% Power Requirements Et=Emax*(dT/dTmax)*nt; %
Energy for the TEM (Watts) Ep=Epuin; %
Energy for the Pumps (Watts) E=Et+Ep+Efan; %
Total Energy for the system (Watts) Vdc=14.4; %
Current Chosen Power Source Potential Supply (volts) Adc=4.8; %
Current Chosen Power Source Amperage (a-h) Pdc=Vdc*Adc; %
Current Chosen Power Source Supplied Power (watt-h) Pdc1=Pdc/t; %
Current Chosen Power Source Supplied Power for chosen operation time (watts) nb=E/Pdc1; %
Number of Chosen Batteries to Power Vest for continuous operation Wbatt=nb*.86; %
Weight of Battery Components (lbs) %% Total Weight Wcoolingunit=11.16; %
Weight of temperature regualting module imported from Soliworks file (lbs) Wt=Wbatt+Wpump+Wfab+Wtube+Wcoolingunit; %
Total Weight of Vest %% Display Results if i==1 disp('Operating Temperatures with the system expelling 1000 BTUs/hr'); else disp('Operating Temperatures with the system providing 1000 BTUs/hr'); end disp('--------------------------------------------------------------'); disp('Temperature of the Skin (F)');disp(Tskin); disp('Temperature of the Inner Fabric (F)');disp(Tfab); disp('Temperature of the Tubing (F)');disp(Ttb); disp('Temperature of the Fluid (F)');disp(Tf);

68
disp('Temperature of the Reservoir (F)');disp(Tres); disp('Temperature of the Thermoelectric Module Supply Plate (F)');disp(Tsp); disp('Temperature of the Thermoelectric Module Waste Plate (F)');disp(Twp); disp('Thermoelectric Module Plate Temperature Difference (C)');disp(dT); disp('Temperature of the Waste Heat sink (F)');disp(Thsave); disp('Temperature of the Atmospheric Air (F)');disp(Tatm); disp('Temperature of the Waste Air (F)');disp(Tair); disp('Reynolds number in the tubing');disp(Re); disp('Reynolds number in the Reservoir');disp(Reres); disp('Reynolds number in the Heat Sink');disp(Reair); disp('Convection Coeficient in the Tubing (BTU/Hr)/(ft*F)');disp(H1); disp('Convection Coeficient in the Reservoir (BTU/Hr)/(ft*F)');disp(H2); disp('Convection Coeficient in the Heat Sink (BTU/Hr)/(ft*F)');disp(H3); disp('Input Power Required to Operate System (Watts)');disp(E); disp('Number of Currently Selected Thermoelectric Modules');disp(nt); disp('Hours of Operation');disp(t); disp('Number of Selected Batteries Required for continuous
Operation');disp(round(nb)); disp('Total Estimated Weight of Thermal Vest (lbs)');disp(Wt);
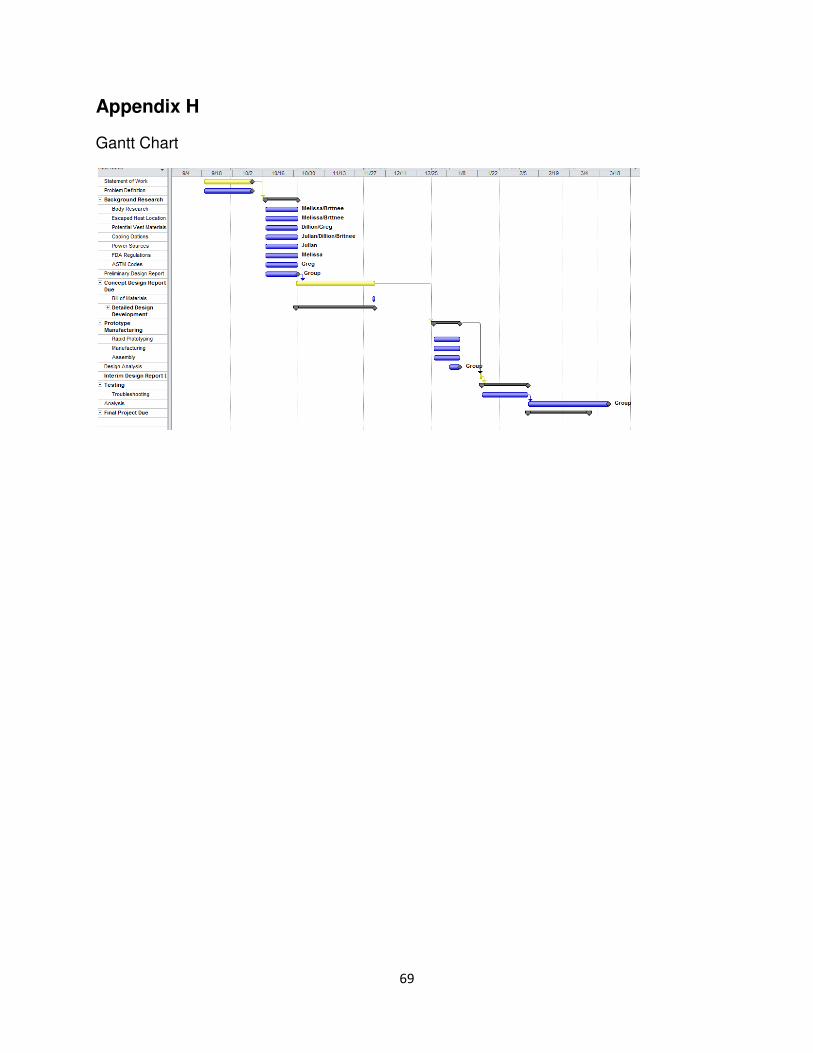
69
Appendix H
Gantt Chart