Embed Size (px)
Citation preview

Geological Survey of New South Wales
Quarterly NotesAugust 2015 No 144
© State of New South Wales through Department of Industry, Skills and Regional Development 2015.
Papers in Quarterly Notes are subject to external review. External reviewer for this issue was Phil Seccombe. His assistance is appreciated.
Quarterly Notes is published to give wide circulation to results of studies in the Geological Survey of New South Wales. Papers are also welcome that arise from team studies with external researchers. Contact: [email protected]
ISSN 0155-3410 (print)
ISSN 2204-4329 (online)
AUTHORSDavid B. Forster1, Paul McInnes2, Peter M. Downes1,
Roland Maas3, Marc Norman4 and Phillip L. Blevin1
1 Geological Survey of New South Wales, 516 High Street, Maitland NSW 23202 Formerly of Barrick (Cowal) Limited, White Road, Mt Tamborine QLD 4272
3 School of Earth Sciences, The University of Melbourne, 1–100 Grattan Street, Parkville Vic 30104 Research School of Earth Sciences, Australian National University, Canberra ACT 0200
New lead isotopic and geochronologic constraints on mineralisation in the Macquarie Arc — insights from the Lake Cowal district, New South Wales
AbstractThe Macquarie Arc of eastern Australia hosts several large to world-class Au and Cu deposits, including Cadia and Northparkes. The Cowal district hosts the large Cowal gold mine (Endeavour 42) and other significant Au and Cu deposits including Endeavour (E)41, E43 and Marsden. We present 37 new lead isotope results, including 31 high-precision Pb isotope analyses for the Cowal district, nearly all of which plot within or close to the field for Ordovician porphyry copper–gold deposits of Carr et al. (1995). The data are also consistent with mantle-like lead in the Tasmanides, suggesting that magmas and mineralising fluids did not interact with contemporaneous siliciclastic sediments such as those of the Adaminaby or Girilambone groups. Data for individual deposits mostly have lead model ages consistent with independent age constraints on mineralisation, including a new Re–Os date on molybdenite of 458 ± 2 Ma for porphyry-like mineralisation at Milly Milly.
Results for Au-rich deposits in the Cowal district including E42 have discrete lead isotope signatures compared with porphyry-style copper–gold mineralisation. Overall, discrete lead isotope signatures associated with epithermal and/or mesothermal gold mineralisation at E41 and E42 suggest that a different and/or more intense mineralising event occurred compared with porphyry-style prospects, including E43, E39 and Milly Milly. The results support studies which suggest that mineralisation in the Lake Cowal district occurred in the Ordovician around 450–460 Ma and not during the ‘alkalic’ porphyry–epithermal gold–copper event associated with the world-class Cadia and Northparkes deposits (~436–443 Ma).
Decoy, the only VAMS-style prospect so far identified in the arc, has the least radiogenic lead isotope signature in the Lake Cowal district and is among the most primitive known to be associated with the Macquarie Arc — similar to that for Peak Hill and to some Cambrian MORB-like rocks. Such signatures may represent the substrate to the arc. We also
report an unexpectedly young middle Silurian age by the Re–Os dating method, along with relatively evolved lead isotope signatures for the Trundle porphyry deposits southwest of Parkes. Overall, the data highlight lead isotopes as a useful exploration tool in the region.Keywords: Macquarie Arc, Cowal district, Pb isotopes, Re-Os dating, arc substrate

2 August 2015
Contents
Abstract 1
Introduction 2
Geological setting 3
The Cowal district 5
Application of high- and low-Pb isotope data to ore deposit studies 6
Sampling and analytical techniques 7
Mineralisation and results 7
Background 7
Structurally controlled mineralisation within the ‘gold corridor’ (E40, E41, E42 and E46) 8
Porphyry-associated mineralisation 10
Discussion 13
Cowal ‘gold corridor’ (E40–E41–E42–E46) 13
Porphyry-associated deposits 14
Regional comparisons 14
Decoy 14
Implications for the substrate to the Macquarie Arc 15
Conclusions 15
Acknowledgements 15
References 16Technical editing: Simone Meakin
Production co-ordination Simone Meakin and general editing : and Geneve Cox
Geospatial information: Stewart Watson
Layout: Nicole Edwards
IntroductionThe Ordovician to early Silurian Macquarie Arc of eastern Australia is a volcanic-dominated terrane that hosts a range of deposit types including large to world-class porphyry Au–Cu systems such as Cadia and Northparkes (e.g. Cadia East, Cadia Hill, Ridgeway, Endeavour 22, Endeavour 26 North, Endeavour 27 and Endeavour 48), large gold-only systems including those in the Cowal district such as Endeavour (E)41, E42 and E46 and high sulfidation epithermal gold deposits at Gidginbung and Peak Hill.
In New South Wales the Ordovician to early Silurian Macquarie Arc-related gold–copper and gold-only systems account for over 61% of the state’s gold endowment (~1924 t of Au) and over 75% of the state’s copper endowment (~15.6 Mt of Cu —resources and past production, December 2014; refer to GSNSW MetIndEx Database). As a result, both company exploration and scientific research has been focussed on the porphyry-style systems, such as those at Cadia and Northparkes (see Heithersay et al. 1990; Heithersay & Walshe 1995; Blevin 2002; Holliday et al. 2002; Wilson et al. 2003; Cooke et al. 2007). By contrast, the larger deposits in the Cowal district including E42, otherwise known as the Cowal (or Lake Cowal) gold mine, along with E41 and E46, are of different style and tenor. These larger deposits are not porphyry-style but are: 1) gold dominant, with characteristics of epithermal gold deposits; 2) strongly structurally controlled by faults, shears, competency contrasts; and 3) are associated with rocks of low–medium-K calc-alkaline affinity (Blevin 2002; Crawford, Glen et al. 2007; Cooke & Fanning 2007). Endeavour 42 and E41 have been variously described as mesothermal (Miles & Brooker 1998) or as transitional between porphyry and low-sulfidation epithermal gold systems (Bywater et al. 2004; Henry et al. 2014).
The Cowal district (also known as Lake Cowal district or Cowal mining district) also hosts several porphyry-style mineralised zones including Marsden (the largest porphyry Cu–Au deposit in the district), E39, E43 and Milly Milly (see McInnes et al. 1998; Henry et al. 2014) and volcanic associated massive sulfide (VAMS) mineralisation such as the Decoy prospect. Crawford, Glen et al. (2007) and Crawford, Meffre et al. (2007) published U–Pb dating and geochemical evidence relating mostly to the nature of the host rocks, which are dominated by the Cowal Igneous Complex (Crawford, Cooke & Fanning 2007 — formerly termed the Lake Cowal Volcanic Complex by Raymond et al. 2000). Until recently, few attempts to directly date mineralisation have been successful and a comprehensive metallogenic study to constrain the
DisclaimerThe information (and links) contained in this publication is based on knowledge and understanding at the time of writing (June, 2015). However, because of advances in knowledge, users are reminded of the need to ensure that the information upon which they rely is up to date and to check the currency of the information with the appropriate officer of the Department of Industry, Skills and Regional Development 2015 or the user’s independent adviser. The product trade names in this publication are supplied on the understanding that no preference between equivalent products is intended and that the inclusion of a product name does not imply endorsement by the department over any equivalent product from another manufacturer.
Copyright© State of New South Wales through Department of Industry, Skills and Regional Development 2015 You may copy, distribute and otherwise freely deal with this publication for any purpose, provided that you attribute the Department of Trade and Investment, Regional Infrastructure and Services as the owner.
Cover image: Quartz-carbonate molybdenite vein in quartz monzonite dyke. Trundle Diamond drillhole TD002-420 (30−40 m). Field of view 10 cm wide.Photographer: D. Ward.
Note from the authors
Contrary to numerous papers, in a significant recent study, Quinn et al. (2014) have cast doubt over whether some parts of the Macquarie Arc were formed in an intraoceanic arc setting. This paper does not deal directly with this debate. However, the term Macquarie Arc (sensu lato) is established in the literature and is used on that basis.

3Quarterly Notes
age of the ore forming events and the metal reservoirs of the district has yet to be undertaken, although new geological and timing constraints are available from Henry et al. (2014) and Zukowski et al. (2014).
The focus of this paper is mineralisation in the Cowal district associated with the Ordovician to early Silurian Macquarie Arc. We present new lead isotope data for several deposits and prospects in that district that complements the existing Pb isotope dataset for the Ordovician to early Silurian Macquarie Arc. In addition, we present new Re–Os dating on molybdenite for the Milly Milly porphyry-style deposit that complements earlier studies by Henry et al. (2014) and Zukowski et al. (2014). It also provides independent constraints to the Pb isotope systematics for the Cowal district and more widely the Macquarie Arc. A limitation of the present study is that no suitable samples for Pb isotope analysis are available from the Marsden Cu–Au deposit.
The present study aims to: establish lead model ages for mineralisation, to better constrain the nature and timing of mineralisation in the Cowal district; identify potential reservoirs of lead as a proxy for copper and/or gold; to better constrain metallogenic events in the area; to compare the Cowal district with other parts of the Macquarie Arc and thereby improve the plumbotectonic model for the region. Finally, the possible substrate to the Macquarie Arc is discussed based on the Pb isotope data (see Forster et al. 2011; Huston et al. in review).
Geological settingThe Lachlan Orogen (formerly the Lachlan Fold Belt — Scheibner 1975) represents part of an extensive orogenic system — the Tasmanides (Scheibner & Basden 1996; Foster & Gray 2000; Glen 2005) — that developed during the Ordovician to the middle Carboniferous. This terrane is over 1000 km east–west, and has a roughly north–south strike for about 3000 km, extending along much of eastern Australia from Queensland to Tasmania. The orogen includes three major sub-provinces; the Western, Central and the Eastern subprovinces (see Glen 2005, 2013). The oldest known rocks in the Lachlan Orogen are the Precambrian to Cambrian MORB-like rocks best exposed in serpentinite belts (Cas 1983); the Ordovician siliciclastic turbidite sequences of the Girilambone, Adaminaby and Bendoc groups (Fergusson & Coney 1992), and the volcanic rocks and related units of the Ordovician to early Silurian Macquarie Arc (Glen, Meffre & Scott 2007; Glen, Crawford & Cooke 2007; Glen, Crawford et al. 2007; Glen 2013).
The Ordovician to early Silurian Macquarie Arc has been described and discussed by many workers (Owen & Wyborn 1979; Crawford, Meffre et al. 2007; Crawford, Cooke & Fanning 2007; Glen, Meffre & Scott 2007; Glen, Crawford & Cooke 2007; Glen, Crawford et al. 2007; Fergusson 2009; Glen, Quinn & Xiao 2011; Quinn et al. 2014). It consists of several belts of volcanic and volcanic-derived rocks, with Crawford, Cooke and Fanning (2007) defining four main phases of magmatism and related mineralisation over a period of about 38 Ma. The arc formed contemporaneously with the deposition of siliciclastic turbidite sequences that are now juxtaposed adjacent to it (Colquhoun & Fergusson 1999; Glen, Quinn & Xiao 2011).
37° S
35° S
33° S
31° S
147° E 149° E 151° E
ROCKLEY – GULG
ON
G VO
LCAN
IC BELT
JUNEE – NARROM
INE VO
LCAN
IC BELT
MO
LON
G
VO
LCAN
IC
BEL
T
SYDNEY
Victoria
New South Wales
Wollongong
See inset
Northparkes
CopperHill
Cadia
Nyngan Gilgandra
Dubbo
Rose Hill
Bathurst
JunctionReefsskarns
PeakHill Mudgee
Orange
Albury
REFERENCE
Macquarie Arc outcropand inferred subcrop Porphyry deposits
0 50 100 km
2015_08_0041
Trundle
WestWyalong
Cargo
Young
Wagga Wagga
central Lachlan Orogen
eastern Lachlan Orogen
KIAN
DRA
VO
LCAN
IC B
ELT
Parkes
34°S
147°
E 0 50km
Parkes
Forbes
Junee
Temora
CO
WR
A TR
OU
GH
CowalIgneousComplex(Cowal block)
Fairholme block
Gilm
ore Fault Zone
Sprin
gdal
e F
ault
Park
es T
hrus
t
BundaburrahCreek Fault
faultfault, inferred
Mar
sden
T
hrus
t
Boob
eroi
Faul
t
WestWyalong
E42
Figure 1. Mapped and interpreted outcrop and subcrop of the Macquarie Arc (modified after Glen, Crawford & Cooke 2007) showing deposits discussed in this study. Inset map shows detail of the Cowal district (modified after David et al. 2004; Glen, Crawford & Cooke 2007; Glen, Crawford, Percival & Barron 2007; Henry et al. 2014).

4 August 2015
The Macquarie Arc is unusual among intraoceanic arcs in that substrate sequences including ophiolites are largely absent, Furthermore, volcanic-derived sediments mostly do not intercalate with the siliciclastic turbidites, and black shale units that flank the terrane and accretionary complexes are absent (Glen et al. 2011). The nature of the substrate is also uncertain. Wyborn (1992) suggested that basement to the arc included Precambrian continental rocks whereas Crawford (2001) drew comparisons with the Mt Read Volcanics where such an association occurs. However, this is inconsistent with the available Pb isotope evidence (see Forster et al. 2011). Glen, Spencer et al. (2007) proposed an alternative model, based on the interpretation of seismic reflection data and
structural studies, and suggested that Ordovician volcanic rocks may structurally underlie the terrane.
Based on wide ranging evidence, Glen and co-workers (see Glen, Meffre & Scott 2007; Glen, Crawford & Cooke 2007; Glen, Crawford et al. 2007; Glen et al. 2011 and references therein) proposed that the Macquarie Arc formed as an intraoceanic volcanic arc that formed outboard of the proto-Pacific passive margin of Gondwana, with the arc being later disaggregated into four major belts that are preserved today (Figure 1). By contrast, Quinn et al. (2014; see also Glen et al. 2012) presented stratigraphic evidence in support of an alternative model whereby the volcanic sequences formed by rifting during the Ordovician within the already established continental margin.
6260000mN
6280000mN
6300000mN
5300
00m
E
5500
00m
E
?
?
?
?
?
?
??
?
E42E41
E39E35
E43Caloola
DecoyG
ilmore Fault Zone
Boob
eroi
Fau
lt
MarsdenLogjam
Tul
lam
ore
Sync
line
Mar
sden
Fau
lt
Milly Milly
E40
‘gold corridor’
Eurowie
2015_08_0042
E46 (Cowal mine)
REFERENCE
Deposit/prospect
Syncline
Fault
Minor lineations inferredfrom aeromagnetic data
Major lineations inferredfrom aeromagnetic data
Fault (inferred)?
Geological boundary (inferred)?
Cow
al Ig
neou
s C
ompl
ex
Ordovician
Ord
ovic
ian
Mac
quar
ie A
rc
Andesite
Volcaniclastic rocks (magnetic)
Trachyandesite
Girilambone Group – phyllite
Diorite and monzonite(including Muddy Lake Diorite)Granitoid (undifferentiated includinggranodiorite & monzodiorite)
Devonian Undifferentiated
UndifferentiatedSilurian
Boonabah volcanic rocks
Belimebung volcanic rocks
Fairholme Igneous Complex
Currumburrama Igneous Complex
Volcanic and volcaniclastic rocks(undifferentiated)
0 5 km
Figure 2. Geological map of the Cowal district adapted after Raymond et al. (2000), Glen et al. (2006), Glen, Crawford, Percival and Barron (2007) and including interpretations of the geology of the Cowal Igneous complex by Henry et al. (2014). Major deposits and prospects discussed in the text are shown.

5Quarterly Notes
490 480 470 460 450 440 430
490 480 470 460 450 440 430
North
South
Diorite dyke (E46)
Diorite dyke (E42 – Henry et al. 2014)¹Diorite dyke (E42 – Strickland 2005)¹
Vesicular dyke (E42 – Miles & Brooker 1998)¹?Pre-ore diorite – Bastrakov (2000)
Early diorite (E42 – Zukowski 2009)Sericite – ore zone (E42)
E41 host mafic monzonite intrusion(Zukowski et al. 2014)
Fractionated sill E41Pre-mineral diorite(E43 – Zukowski 2010)
Host granodiorite (E43 – Zukowski 2009)
Granodiorite (E43 – Bissig 2008)
gold
eve
nt‘g
old
corr
idor
’
Ben
ambr
anal
kalic
eve
nt
Granodiorite (E39)Granodiorite (E39)
Diorite – close to E39
Milly Milly Re–Os458 ± 2.0 Ma (this study)
Muddy Lake Diorite(regional host lithology – Perkins 1993)
Age (Ma)REFERENCE
U–Pb SHRIMP – zircon
U–Pb LA-ICPMS – zircon
U–Pb SHRIMP – titanite
U–Pb SHRIMP – monazite ¹ Post-ore phase (‘gold corridor’)
^ Measured 206Pb/204Pb
* Corrected 206Pb/204Pb
Re–Os (molybdenite)
K–Ar or 40Ar/39Ar hornblende(Perkins 1993; or Perkins et al. 1995)
40Ar/39Ar sericite (Perkins et al. 1995)
*17.911 ^18.227438.1 ± 4.2 Ma (Cadia)
*17.952
*17.991
Sericite – ore zone (E39)
*17.994
Gold event group CwA ~17.965
Crawford et al. (2007c)
Forster et al. (2004)
Muddy Lake Diorite
2015_08_0043
Age (with error ± Ma)
The Cowal districtThe Cowal (Au–Cu) district lies within the Eastern Subprovince of the Lachlan Orogen, at the southern end of the Junee–Narromine Volcanic Belt of the Macquarie Arc. The Cowal district is approximately 40 km long and 15 km wide, lies between the Booberoi Fault and Marsden Thrust and has been previously informally termed the Cowal block. The Booberoi Fault and Marsden Thrust are terrane-scale faults that divide the Eastern and Central subprovinces of the Lachlan Orogen (Figures 1 & 2). The Cowal block is dominated by the Cowal Igneous Complex (see Glen et al. 2002) which was previously termed
the Lake Cowal Volcanic Complex by Raymond et al. (2000). The Cowal Igneous Complex is characterised by Ordovician, subaqueous, volcano-sedimentary successions that have been intruded by diorite to granodiorite stocks and numerous dykes (Figure 2; Miles & Brooker 1998; McInnes et al. 1998; Crawford, Cooke & Fanning 2007). Most have low to medium K, calc-alkaline chemistry (Blevin 2002) which Crawford, Cooke and Fanning (2007) suggested is broadly consistent with subduction-related magmatism.
Attempts to date the rocks and to constrain the timing of hydrothermal mineralisation in the Cowal district have proven difficult. This is mainly due to a lack of zircons or multiple ages being obtained for xenocrystic
Figure 3. Time–space plot showing age constraints for the Cowal district. It includes references for original geochronological analysis and 206Pb/204Pb ratios for deposits, and the dated rock types where available.

6 August 2015
zircons in the intrusive rocks, and 40Ar/39Ar dates for white micas being re-set by later thermal events (Bastrakov 2000; Crawford, Cooke & Fanning 2007; P. Blevin pers. comm. 2013). The timings of magmatism and mineralisation in the Cowal district are also poorly constrained. Crawford, Cooke and Fanning (2007) compiled the available geochronological data for the Lake Cowal Volcanic Complex. Three populations of U–Pb SHRIMP zircon dates and 40Ar/39Ar dates on micas and clays were interpreted — relating to Phase 1, Phase 2 and Phase 4 magmatism within the Macquarie Arc. Most dates lie between 466 and 460 Ma and are associated with the Phase 2 event of Crawford, Cooke and Fanning (2007) (see Figure 3, Perkins et al. 1990; Zukowski 2010; Henry et al. 2014).
The dating of the timing of mineralisation at E41 and E42, which have features of epithermal and/or mesothermal gold deposits, has proven problematical. Direct dating of clays and micas along the ‘gold corridor’ (including 40Ar/39Ar ages on sericite from E42) of 439 ± 1.0 Ma and 439.6 ± 1.1 Ma (Perkins et al. 1990) led Cooke et al. (2007) to infer a ~440 Ma age for gold mineralisation. This is contemporaneous with early stages of the Benambran Orogeny (Glen, Meffre & Scott 2007; Glen, Crawford & Cooke 2007; Glen, Crawford et al. 2007; Glen 2013) and alkalic porphyry Cu–Au mineralisation at Cadia and Northparkes (Lickfold et al. 2003; Forster et al. 2004; Wilson et al. 2007). However, such ages are younger than dykes that postdate mineralisation; Miles and Brooker (1998) and Henry et al. (2014) also present evidence of a long-lived hydrothermal system at E42. An age of ~440 Ma for mineralisation also conflicts with evidence from Pb isotopes. Carr et al. (1995) suggested that the age of the Pb reservoir associated with the E42 deposit was at least 440 Ma. Forster et al. (2011) noted that the Pb isotope characteristics of mineralisation in the Cowal district were distinctly less radiogenic than those of Cadia and the Goonumbla/Northparkes porphyry deposits, where mineralisation occurred at about 438 Ma (Forster et al. 2004).
Application of high- and low-Pb isotope data to ore deposit studiesUsing the principles of radioactive decay, Pb isotopes can be used to track the formation of geological terranes and mineralising events relative to the age and the initial isotopic composition of the Earth. These include known, homogeneous, crustal Pb reservoirs and primitive lithospheric mantle reservoirs.
Geological studies involving Pb isotope data typically derive the ratio of radiogenic 206Pb (formed from the radioactive breakdown of 235U) to common lead (204Pb), which relates to the age of the primitive Earth, and compare that ratio to 207Pb/204Pb and 208Pb/204Pb — where 207Pb is generated by radioactive decay of 238U, and 208Pb is the decay product of 232Th (Stacey & Kramers 1975). This enables the calculation of plumbotectonic models for specific terranes relative to μ, or the initial calculated 238U/204Pb value for a specific terrain (e.g. Stanton & Russel 1959).
Lead isotope studies can also provide insights into ore genesis and can improve the understanding of metal sources including ‘model ages’ for groups of mineral deposits within a given terrane. Major magmatic and hydrothermal events typically result in the loss of 238U, 235U and 232Th and homogenise Pb isotope values unless overprinted by separate high-Pb events, or by the addition of radiogenic Pb (see Doe & Stacey 1974; Faure & Messing 2005). Cumming and Richards (1975) computed a Pb/Pb model age for Phanerozoic rocks of eastern Australia, which produced results very similar to independently obtained ages for ores containing crustal Pb. In a very important contribution, Gulson and Mizon (1979) used Pb isotopes to characterise deposits, including secondary ores, and related these to specific metallogenic districts and events. Carr et al. (1995) used Pb isotope ratio data for approximately 100 metallic mineralised zones/deposits to investigate the metallogenic evolution of the eastern Lachlan Orogen, including a number of systems associated with the Macquarie Arc. Those authors divided deposits according to whether Pb was derived from crustal or mantle reservoirs and suggested that there was mixing between the two reservoirs over time. Forster et al. (2011) highlighted that the Pb isotope signatures for Ordovician to early Silurian mineralisation of the Macquarie Arc indicate that mixing did not occur between reservoirs and that virtually all the Pb associated with the arc was mantle-like. This is consistent with an arc devoid of crustal-derived siliciclastic sediments prior to the Benambran Orogeny that commenced around 443 Ma (Percival & Glen 2007). Finally, Forster et al. (2011) noted correspondence the between Pb model ages and mineralisation ages based on independent constraints. Further, mineralised intrusions of the Macquarie Arc became more compositionally evolved over time based on higher 206Pb/204Pb and age corrected εNd values (see also Wyborn & Sun 1993).
In studies using Pb isotope data, samples can be described as high- or low-lead. High lead samples generally contain galena, other Pb-rich minerals and/or have generally greater than ~700 ppm Pb (see Gulson 1986). For such samples there is generally

7Quarterly Notes
insufficient 238U, 235U and/or 232Th to significantly change the initial Pb isotope ratios so the results would normally be considered to preserve an ‘initial’ Pb isotope ratio. By contrast, for samples with low amounts of Pb the presence of 238U, 235U and/or 232Th, even in small amounts, can significantly change the initial Pb isotope ratio. Therefore the addition of radiogenic Pb formed after mineral deposition, needs to be corrected for, by measuring and applying an appropriate correction for the contained U and Th.
Sampling and analytical techniquesForty-four new samples from the Cowal district were analysed at the University of Melbourne, School of Earth Sciences. Seven other samples, including those by Forster et al. (2011), were analysed using mass spectrometry at the CSIRO Earth Science and Resource Engineering laboratories in Sydney (see Carr & Dean 1987; Carr et al. 1995 for methodologies). Errors, expressed as analytical precision, are shown in the upper left corner of all the Pb isotope diagrams as 95% confidence ellipses based on over 1400 analyses (Carr et al. 1995).
Samples included in the present study were sourced from drillcore except for a single hand sample of galena (from Trents Lode at E42). Sample preparation varied according to the nature of the sample and laboratory location. Samples prepared at the Geological Survey of New South Wales were drilled using a micro-drill under a binocular microscope, crushed and any magnetic material removed with a rare earth magnet covered in latex. Samples prepared at the University of Melbourne, School of Earth Sciences were handpicked. Sulfides were picked using a needle or from a coarse crush, and feldspars were picked by hand. Sulfide samples were cleaned with very dilute cold nitric acid for several hours, removed, rinsed, then 1–3 ml of very dilute (<<1M) nitric acid was added, before the samples were capped at 80°C or 100°C overnight. Feldspars were leached in hot 6M hydrochloric acid overnight.
For Pb isotope analyses the U, Th and Pb concentrations of each sample were determined using the Multicollector Inductively Coupled Plasma Mass Spectrometers (MC-ICPMS) at the University of Melbourne according to techniques outlined by Woodhead (2002). Lead counts were summed from each of the masses (208Pb, 207Pb, 206Pb & 204Pb, after applying a small correction for Hg on 204Pb) and for the standard (basalt W-2), which eliminates variation in Pb isotope ratios (variations in f208Pb) as a source of error. The 238U/204Pb and 232Th/204Pb ratios were
calculated using individually calculated Pb atomic weights and f204 values. The uncertainty of these parent/daughter ratios is ±5% (2σ). Uncertainty in Pb isotope ratios (based on results for SRM981 – the standard) is ±0.05% for 206Pb/204Pb and 207Pb/204Pb, and ±0.1% for 208Pb/204Pb. These uncertainty levels are consistent with the results for repeat analyses of the same Pb fractions on the MC-ICPMS. Several results were duplicate analyses from the same aliquot, which mostly gave highly repeatable (and therefore precise) results.
Samples from the Macquarie Arc with radiogenic results of 206Pb/204Pb >18.30 form a positive linear array that is flatter than mantle growth curve of Carr et al. (1995). Correlations of measured results (not accounting for internal errors) of 207Pb/204Pb vs 206Pb/204Pb and 208Pb/204Pb vs 206Pb/204Pb (n = 21) gave r factors of 0.990 and 0.962 respectively. The samples also have correspondingly higher calculated 238U/204Pb and 232Th/204Pb ratios, indicating that these radiogenic results are from in situ radioactive decay of 238U and 232Th. Therefore, these results (including nine from the Cowal district) were excluded from the dataset (see Forster & Maas 2015).
As part of the present study, a sample of molybdenite from the Milly Milly prospect was dated by the Re–Os method at the Australian National University, Research School of Earth Sciences (see Stein et al. 2001; Norman et al. 2004).
Mineralisation and results
BackgroundThe data in the present study from the Cowal district included 41 samples analysed at the University of Melbourne. Thirty nine of the analyses contained <700 ppm (700 000 ppb) Pb (see Table 1, p. 20) and are therefore considered ‘low-lead’ samples according to Gulson (1986). As noted above, this required that corrections be applied for 238U and 232Th. The corrections were applied based on their total U–Th–Pb concentrations and calculated parent/daughter ratios. The calculations included 238U/204Pb (or μ) and 232Th/204Pb. The greater these values, the greater the variance between the observed and corrected values and the greater the error inherent in these corrections.
The corrections were for the contained 238U and 232Th in each sample assuming a geologically reasonable age of 450 Ma for the Cowal district samples (see previous dating studies by Perkins et al. 1995; Henry et al. 2014). As outlined above, less-radiogenic analyses were preferred as they were more likely to preserve initial Pb isotope ratios.

8 August 2015
This procedure left 31 new Pb isotope analyses for the Cowal district which are included in Table 1, on Figure 4 and are discussed below. The analyses include; 1) a new sample of galena from E41; 2) a single result from Decoy that contains >1000 ppm Pb; and 3) twenty-nine results from low-lead samples from a range of sulfides, feldspars and rocks. The low-Pb results included 11 from three prospects (Decoy, Logjam and Eurowie) which have measured vs corrected 206Pb/204Pb that vary by <0.05%, or less than the analytical error, and therefore reflect initial ratios. Seven high-Pb analyses by the CSIRO from E41, E42 and E46 were presented by Forster et al. (2011) and are included in Table 1.
Mineralisation associated with the Ordovician to earliest Silurian Cowal district can mainly be grouped as structurally controlled or porphyry-related. Structurally controlled gold-dominant systems include E41, E42 (Cowal gold mine) and E46. Porphyry-related copper–gold systems include Marsden, E39, E43, Logjam and Milly Milly. We present data (roughly from north to south) to give a geographic context to each deposit. Interestingly, the initial 206Pb/204Pb for individual mineral systems roughly decreases southwards with the exception of the Decoy prospect, which is probably a VAMS system.
Structurally controlled mineralisation within the ‘gold corridor’ (E40, E41, E42 and E46)Several mineralised zones lie along a north–south-trending, structurally deformed belt that is 6 km long by 2 km wide (the ‘gold corridor’) located on the western margin of the Cowal Igneous Complex (Miles & Brooker 1998; McInnes et al. 1998; Zukowski et al. 2014; Henry et al. 2014). From north to south they include E46, E42 and E41 (Figure 2). All are controlled by faults and shears and are located along the margin of an elongate northerly trending diorite sill — the Muddy Lake Diorite (Miles & Brooker 1998).
E42 and E46The geology and mineralisation at E42 (Cowal gold mine) has been described by several workers including Miles and Brooker (1998), McInnes et al. (1998), Zukowski et al. (2014) and Henry et al. (2014) and is summarised below. The mine is hosted by a sequence including lower and upper volcaniclastic units that were tilted and subsequently intruded by a series of dykes and sills. These intrusions include at least four sets of dykes. In general dykes of mafic to intermediate composition pre-date mineralisation, whereas two sets of intermediate dykes post-date mineralisation (Henry et al. 2014; Zukowski et al. 2014). The deposit consists of gold-rich quartz–carbonate–pyrite–base-metal sulfide veins associated with sericite–carbonate–pyrite alteration. Less commonly, gold occurs with pyrite stringers and disseminations, shear-hosted chlorite–carbonate veins and shear-hosted quartz–carbonate–sulfide veins. Several stages of alteration have been identified at E42, with the post-mineralisation stage being pervasive adularia–silica alteration. Henry et al. (2014) classifies E42 as a deep epithermal deposit but notes that there are many features common to structurally controlled rather than intrusion-related deposits. However, earlier workers (e.g. Miles & Brooker 1998; McInnes et. al. 1998) described many features of the deposit as being characteristic of mesothermal and orogenic gold systems.
17.65 17.80 17.95 18.10 18.2515.38
15.42
15.46
15.50
15.54 Analytical precision
Cowal district: all data corrected vs uncorrected
17.65 17.80 17.95 18.10 18.2537.30
38.30Analytical precision
208 P
b/20
4 Pb
207 P
b/20
4 Pb
206Pb/204Pb
206Pb/204Pb
Silurian Cu–Au
Silurian Cu–Au
crustal growth curve (C
umming & Richards 1975)
Ordovician Cu–Au
Ordovician Cu–Au
37.50
37.70
37.90
38.10
REFERENCEDecoyDecoy (corrected)LogjamLogjam (corrected)E42 whole rocks (corrected)E43 feldspar (corrected)
Wyrra whole rocks (uncorrected)Wyrra whole rocks (corrected)E41 (uncorrected)E41 (corrected) 2011Cowal (E41 – Forster 2011)E39 (uncorrected)E39 (corrected)
2015_08_0044
a)
b)
Figure 4. Plumbotectonic models for a) 208Pb/204Pb vs 206Pb/204Pb and b) 207Pb/204Pb vs 206Pb/204Pb for the Lachlan Orogen by Carr et al. (1995) showing all measured results and those where corrections for contained 232Th (a) and 238U have been calculated. Results with 206Pb/204Pb >18.3 are not shown. The larger ellipses in the top left hand corner refer to analytical precision at 2σ confidence for CSIRO data (not plotted) and the smaller ellipses for the University of Melbourne data. (See also Table 1 for eliminated data).

9Quarterly Notes
To the north of E42 is the E46 zone, which may represent the northerly extension of E42. The geological setting for both is similar, being hosted by the same sequence, with a similar series of late dykes and sills. The gold mineralisation is associated with dilatant quartz–carbonate–sulfide (base-metal) veins at the faulted contact between the diorite sills and volcaniclastic and coherent volcanic rocks — analogous to those at E42. Barrick Limited (2010) interpreted the deposit as being located towards the base of the volcaniclastic sequence which is exposed at E42.
Dating of the gold mineralisation event at E42/E46 has so far been problematic, with the timing of mineralisation being constrained by a range of dates. These include K–Ar dates on hornblende of 456 ± 5 Ma for the host diorite (Perkins et al. 1995; Bastrakov 2000) and 447 Ma ± 7.0 Ma for a cross-cutting vesicular dyke (Miles & Brooker 1998). In addition, a U–Pb SHRIMP age for monazite from a post-mineralisation diorite dyke that cuts the Cowal fault yielded 450.3 ± 1.3 Ma (Henry et al. 2014; see also Strickland 2005) (Figure 3).
Four high-Pb analyses from E42 and E46 are available, along with four new high-precision low-Pb results from key rock types at E42 that are associated with mineralisation (Table 1). The high-Pb results average 206Pb/204Pb = 17.968, 207Pb/204Pb = 15.466 and 208Pb/204Pb = 37.593 and are within analytical error of five previous results from the CSIRO database and thus were ascribed to the homogeneous population Group CwA by Forster et al. (2011 — Group CwA1 on Figure 5). Low-Pb results (corrected for 238U and 232Th) average 206Pb/204Pb = 207Pb/204Pb = 15.454 and 208Pb/204Pb = 37.688 (see also discussion of E41 below) and define a tight group within analytical error of the CSIRO data (Group CwA2). The corrected low-Pb results, which include the vesicular dyke, are more variable and include higher 208Pb/204Pb, largely due to the greater error inherent in f208Pb. Nonetheless, they are distributed about the mean of high-Pb results that define Group CwA.
E41The E41 deposit occurs to the south of E42 and consists of two mineralised zones separated by the deposit scale Cowal Fault (Figure 2). The deposit has a total combined resource of 12.6 Mt @ 1.6 ppm Au. Like E42, mineralisation occurs near the margin of the Muddy Lake Diorite, which intrudes the volcaniclastic sequence along with numerous sills, dykes and stocks (informally termed the E41 intrusive complex). At E41, the major vein/mineralisation stages include early quartz–pyrite ± calcite ± adularia ± chlorite veins, and later carbonate–base-metal sulfide veins (calcite, ankerite, quartz, pyrite, sphalerite, galena, chalcopyrite, silver tellurides, arsenopyrite) with associated apatite, hematite, illite–muscovite and chlorite alteration. Late quartz–sulfide breccias contain colloform vein textures, chalcedony and adularia. The mineralisation is associated with intrusive phases including dykelets, and vein and alteration assemblages that are characteristic of both porphyry and low to intermediate sulfidation epithermal deposits. These features led Zukowski (2010) and Zukowski et al. (2014) to suggest that the deposit was a deeply emplaced epithermal gold–base-metal deposit with a structural overprint that had been unroofed during
Group CwA1
Group CwA2
GroupCwA2
Group CwA1
17.65 17.80 17.95 18.10 18.2515.38
15.42
15.46
15.50
15.54
17.65 17.80 17.95 18.10 18.2537.30
38.30
Silurian Cu–Au
Silurian Cu–Au
crustal growth curve
(Cumming & Richards 1975)
Ordovician Cu–Au
Ordovician Cu–Au
‘Gold corridor’ (E41, E42 & E46)
Analytical precision (CSIRO)
Measured (Uni Melbourne)
Analytical precision (CSIRO)
Measured (Uni Melbourne) Devonian granites
SilurianVAMS
SilurianBesshi Devonian
VAMS
37.50
37.70
37.90
38.10
208 P
b/20
4 Pb
207 P
b/20
4 Pb
206Pb/204Pb
206Pb/204Pb
2015_08_0045
REFERENCEE41 – 2012 galenaE41 (corrected) 2011Cowal (E41) Forster 2010Cowal (E46) CSIRO
E42 whole rocks (corrected)E42 – Trents Lode galenaLake Cowal NSW – CSIRO
a)
b)
Figure 5. Plumbotectonic models for a) 208Pb/204Pb vs 206Pb/204Pb and b) 207Pb/204Pb vs 206Pb/204Pb for the Lachlan Orogen by Carr et al. (1995). Data for Pb isotopes from deposits of the E41, E42 and E46 are superimposed. The model shows the average fields for groups of deposits associated with major groups of rocks and tectonic events of the Lachlan Orogen. Figure a) also shows the crustal growth curve by Cumming and Richards (1975). Group CwA1 and CwA2 omit and include old CSIRO data respectively for E42 and likely represent the Pb reservoir at that deposit. Line with arrow is a line of best fit for all E41 data and represents a secondary isochron showing that more radiogenic results for E41 may be the result of radioactive decay from the source defined by Group CwA1.

10 August 2013
the mineralising event. The maximum age of E41 is constrained by a U–Pb age of 465 ± 5.2 Ma for the host Muddy Lake Diorite and of 458.5 ± 5.2 Ma for a pre-mineralisation mafic monzonite intrusion emplaced after tilting (Zukowski et al. 2014).
For E41, four analyses for galena (Forster et al. 2011) and two corrected low-Pb results are available. They average 206Pb/204Pb = 17.988, 207Pb/204Pb = 15.459 and 208Pb/204Pb = 37.681 and have slightly greater variance than data for E42 and E46. Two high-Pb and one corrected result from a low-Pb sample of the monzonite that intrudes the Muddy Lake Diorite are conspicuously more radiogenic than the remaining samples which plot within Group CwA2 along with results from E42 and E46 (Figure 5).
Porphyry-associated mineralisationThe Cowal district hosts several porphyry-style prospects, some of which also have epithermal characteristics. These include E39, E43, Logjam and Milly Milly (Figure 2). They are associated with monzodiorite, monzonite and granodiorite intrusions of predominantly medium-K calc-alkaline affinity that are not strictly porphyries, but are associated with holocrystalline intrusive rocks (Miles & Brooker 1998; Blevin 2002; Crawford, Cooke & Fanning 2007; Zukowski et al. 2014).
EurowieThe Eurowie prospect is the most southerly of a series of gold–copper occurrences within the Wyrra district (see Figure 2). The host rocks at the prospect include coherent diorite to monzodiorite and bedded variably calcareous volcaniclastic units of calc-alkaline affinity which are intruded by mafic feldspar porphyry and diorite dykes. Gold mineralisation is associated with widespread silica–illite–pyrite alteration which grades to a deeper potassic K-feldspar–biotite–magnetite and hematite alteration that appears to be fault and breccia controlled (this study).
Eight new corrected initial ratio Pb isotope results for mineralised veins from Eurowie are the most radiogenic for the Cowal district overall, averaging 206Pb/204Pb = 18.019, 207Pb/204Pb = 15.468 and 208Pb/204Pb = 37.729 (Table 1). All but one corrected result from sulfides and feldspars are within analytical error of measured values. Sulfides and feldspars are grouped separately on Figure 6 (Groups EuA and EuB), with the sulfides being more radiogenic. These minerals were sampled from an amphibole–chlorite–calcite–feldspar vein with a magnetite selvage (see Figure 7). Other corrected results for the sulfide-bearing host rocks from Eurowie
37.50
37.70
37.90
38.10
Eurowie sulfides(Group EuA)
Eurowie feldspars(Group EuB)
Eurowie sulfides(Group EuA)
Eurowie feldspars(Group EuB)
17.65 17.80 17.95 18.10 18.2515.38
15.42
15.46
15.50
15.54
17.65 17.80 17.95 18.10 18.2537.30
38.30
Silurian Cu–Au
Silurian Cu–Aucrustal growth curve (Cumming & Richards 1975)
crustal growth curve (Carr et al. 1995)
Ordovician Cu–Au
Porphyry: corrected vs uncorrected
Analytical precision (CSIRO)
Measured (Uni Melbourne)
Analytical precision (CSIRO)
Measured (Uni Melbourne)Devoniangranites
SilurianVAMS
SilurianBesshi Devonian
VAMS
Ordovician Cu–Au
208 P
b/20
4 Pb
207 P
b/20
4 Pb
206Pb/204Pb
206Pb/204Pb
2015_08_0046
REFERENCELogjamLogjam (corrected)EurowieEurowie feldsparEurowie (corrected)
E43 feldspar (corrected)Wyrra whole rocks (corrected)Wyrra whole rocks (uncorrected)E39 (corrected)
a)
b)
prospect (five Wyrra samples) were more variable due to the greater inherent error (especially for 208Pb) given the samples’ higher U/Pb and Th/Pb.
Figure 6. Plumbotectonic models for a) 208Pb/204Pb vs 206Pb/204Pb and b) 207Pb/204Pb vs 206Pb/204Pb for the Lachlan Orogen by Carr et al. (1995) with data for Pb isotopes from porphyry-like deposits superimposed.
E43Vein- and breccia-hosted chalcopyrite±bornite-bearing mineralisation at E43 is spatially associated with a series of early and syn-mineralisation porphyry intrusions that include diorite and granodiorite. Quartz dacite along with aplite and pyroxene-phyric dykes are also closely spatially and temporally associated with the sulfides (Zukowski 2009). Sulfide (chalcopyrite>pyrite) filled fractures are generally sparse, discontinuous and are associated with a

11Quarterly Notes
age of 463.5 ± 2.1 Ma by the Re–Os method on molybdenite (H. Stein, Research School of Earth Sciences, Australian National University, unpublished data) was also reported by Bissig et al. (2008). As part of the present study feldspar from a quartz dacite was analysed for a Pb isotope signature (Table 1). The corrected data plot at 206Pb/204Pb = 17.906, 207Pb/204Pb = 15.453, 208Pb/204Pb = 37.652 and is one of the least evolved results for porphyry-related mineralisation identified in the present study.
LogjamPorphyry-style copper–gold mineralisation at the Logjam prospect 12 km southeast of E42 (Figure 2) and involves potassic alteration (biotite, magnetite and K-feldspar). The veining is generally weaker than at several other porphyry prospects in the area, with a pervasive chlorite alteration predominant. Three analyses were undertaken as part of the present study (Table 1, Figure 6). Two samples of galena from a zone that assayed 1160 ppm Pb yielded corrected results which plotted within error (206Pb/204Pb = 18.000, 207Pb/204Pb = 15.456 and 208Pb/204Pb = 37.541). In addition, a single analysis of galena from an altered and veined breccia clast in a rock flour matrix gave corrected and measured values within analytical error (measured 206Pb/204Pb = 17.917, 207Pb/204Pb = 15.455 and 208Pb/204Pb = 37.547).
Milly Milly and E39Although about 10 km apart, the E39 and Milly Milly copper–gold prospects are both porphyry-like and have similar features. Milly Milly is associated with diorite to monzodiorite and granodiorite stocks whereas E39 is entirely hosted by granodiorite, possibly suggesting that Milly Milly represents a shallower equivalent of E39 (see McInnes 2010).
E39Miles and Brooker (1998) noted that the E39 copper–gold system (Figure 2) is a large, low-grade system developed entirely within the granodiorite. At E39, early potassic alteration is overprinted by a later sericitic alteration assemblage that is closely associated with quartz–carbonate–chlorite±tourmaline–chalcopyrite–bornite±molybdenite veins (Miles & Brooker 1998) with sulfides, chlorite and epidote developed after ferromagnesian sites in alteration haloes. Highest copper and gold grades coincide with the steeply dipping sheeted veins. Previous dating at E39 has failed to resolve the timing of mineralisation (see Figure 3). Perkins et al. (1995) dated a diorite porphyry from near E39 at ~457 ± 5 Ma (K–Ar on hornblende). However, dating of the same sample of the host granodiorite gave ages of 465.7 ± 1 Ma
Mt
Py
Fld
Mt
Cal
Cal
Mt
Py
2015_08_047
Figure 7. Photograph of diamond drillcore from drillhole WYD003 (441.5 m depth) showing amphibole–chlorite–calcite–feldspar–pyrite–chalcopyrite vein with a magnetite selvage. The drillcore was sampled for Pb isotopes on individual grains of chalcopyrite and feldspar. Cal = calcite, Py = pyrite, Mt = magnetite, Fld = feldspar. Coin is 19 mm diameter.
potassic alteration assemblage. Early magnetite and quartz magnetite veins cut a locally pervasive biotite–magnetite alteration of more mafic rocks, and quartz–K-feldspar veins overprint the assemblage. Three samples from E43 have been dated by previous workers with the results summarised in Figure 3. The maximum age of the system is constrained by a U–Pb SHRIMP date of 470.8 ± 5 Ma on titanate from early-stage diorite porphyry and by a U–Pb SHRIMP date of 466.4 ± 6.2 Ma on zircon from the granodiorite (Zukowski 2009). A mineralisation

12 August 2015
and 450.9 ± 4.5 Ma using 40Ar/39Ar and U–Pb SHRIMP methods respectively (Figure 3, Perkins et al. 1995; Crawford, Cooke & Fanning 2007). Dating of sericite from the ore zone yielded a significantly younger age of 439.6 ± 1.1 Ma (Perkins et al. 1995).
Two Pb isotope results for feldspars from a diorite porphyry dyke and the host granodiorite at E39 are more radiogenic and less radiogenic respectively than group CwA1, for high-Pb results for the ‘gold corridor’ (Table 1, Figures 3 and 5).
Milly MillyThe Milly Milly copper–gold porphyry system is about 10 km south-southwest of E39 and has mineralisation associated with probable diorite to monzodiorite and granodiorite stocks. Early potassic alteration at Milly Milly is overprinted by a sericitic alteration assemblage that is very similar to that at E39.
Dating of molybdenite from an equigranular monzonite segregation within monzodiorite at Milly Milly gave an age of 458 ± 2.0 Ma using the Re–Os technique. The sample was from diamond drillhole MMD003 (142.2 m depth). The Re content (377 ppm) of the dated sample is low compared with other porphyry systems in the Macquarie Arc, suggesting a different magma source and/or degree of fractionation of the progenitor intrusion (M. Norman pers. comm. 2012).
A single Pb isotope analysis of molybdenite-rich sulfides from the dated sample gave a result that lies outside the normal range related to the Macquarie Arc (206Pb/204Pb = 21.236, 207Pb/204Pb = 15.790, 208Pb/204Pb = 39.304) and probably does not represent initial Pb isotope ratios.
OtherThe Decoy copper–gold–zinc prospect lies within a magnetic low about 1.5–2 km wide and is located just to the north of E35 (Figure 2). The mineralisation is hosted by mafic to intermediate trachyandesite, hyaloclastite volcaniclastic breccia, sandstone and mudstone units within a southeast-striking graben-structure that together indicate deposition in a submarine environment (McInnes 2008). The mineralisation is copper–gold–zinc-rich and is anomalous in arsenic, barium and cobalt. Although disrupted by faulting, the zinc-rich mineralisation grades inwards and downwards to a chalcopyrite-rich zone. The zone includes a massive chalcopyrite–pyrite-rich lens with >80% sulfides after intensely altered host rock. Chalcopyrite and pyrite stringers are present beneath the highest grade zones (including 26 m @ 1.38 g/t Au and 0.49% Cu), with chalcopyrite observed to replace fractured pyrite. Decoy is also strongly zoned, with sulfide-rich zones grading
outwards and upwards to chlorite–pyrite–chalcopyrite-rich alteration and peripheral silica–sericite–pyrite alteration. These features led Gemmel (2010) to suggest that Decoy has a VAMS association.
Five high-precision Pb isotope analyses are available for Decoy (Table 1). Two of the three samples contained visible galena. Four of the five analyses plot in a tight group, almost within analytical error (Figure 8). Measured results average 206Pb/204Pb = 17.711, 207Pb/204Pb = 15.430 and 208Pb/204Pb = 37.323, whereas corrected results plot in a tight group (Group DcA
Cadia and Goonumbla~440 Ma porphyry deposits
Cadia and Goonumbla~440 Ma porphyry deposits
17.60 17.80 18.00 18.20 18.4015.35
15.40
15.45
15.50
15.55
15.60
15.65
17.60 17.80 18.00 18.20 18.4037.00
37.50
38.00
38.50
Silurian Cu–Au
Silurian Cu–Aucrustal growth curve (Cumming & Richards 1975)
crustal growth curve (Cumming & Richards 1975)
crustal growth curve
(Carr et al. 1995)
crustal growth curve (Carr et al. 1995)
mantle growth curve
Macquarie Arc Cu–Au
Macquarie Arc: regional
Analytical precision (CSIRO)
Measured (Uni Melbourne)
Analytical precision (CSIRO)
Measured (Uni Melbourne)
Macquarie Arc Cu–Au
Peak HIll
Peak HIll
Cambrian MORB
Cambrian MORB
208 P
b/20
4 Pb
207 P
b/20
4 Pb
206Pb/204Pb
206Pb/204Pb
2015_08_0048
REFERENCE
Devonian granites
Carboniferous granites
Silurian Besshi
Silurian VAMS
Devonian VAMS
Eurowie (corrected)Copper Hill (Forster 2007)E42 – Trents Lode galenaCowal (E41 – Forster 2010)Cowal (E46)E39 (corrected)
E43 feldspar (corrected)Trundle Park galenaPontoRose Hill (corrected)Decoy (corrected)
a)
b)
Figure 8. Plumbotectonic models for a) 208Pb/204Pb vs 206Pb/204Pb and b) 207Pb/204Pb vs 206Pb/204Pb for the Lachlan Orogen by Carr et al. (1995). Summary Pb isotope data for the Cowal district and other deposits discussed in the text are superimposed. The model shows the average fields for groups of deposits associated with major groups of rocks and tectonic events of the Lachlan Orogen. Radiogenic results with 206Pb/204Pb >18.3 are not shown.
13Quarterly Notes
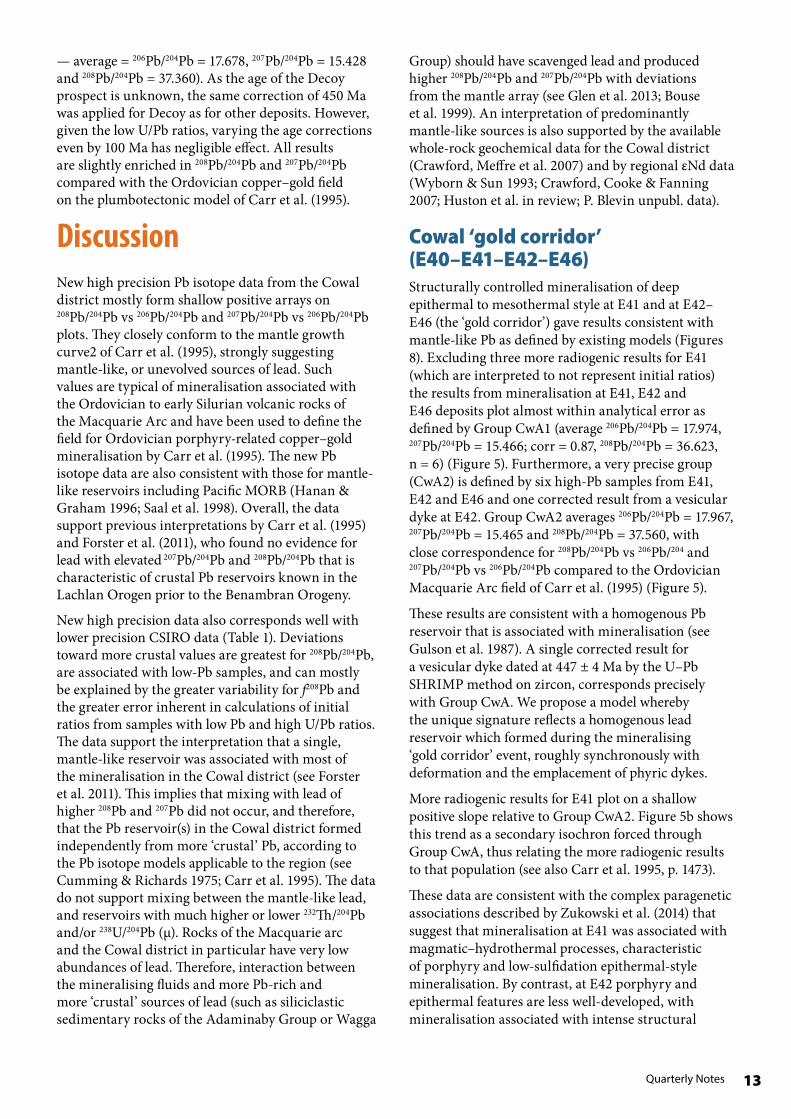
— average = 206Pb/204Pb = 17.678, 207Pb/204Pb = 15.428 and 208Pb/204Pb = 37.360). As the age of the Decoy prospect is unknown, the same correction of 450 Ma was applied for Decoy as for other deposits. However, given the low U/Pb ratios, varying the age corrections even by 100 Ma has negligible effect. All results are slightly enriched in 208Pb/204Pb and 207Pb/204Pb compared with the Ordovician copper–gold field on the plumbotectonic model of Carr et al. (1995).
DiscussionNew high precision Pb isotope data from the Cowal district mostly form shallow positive arrays on 208Pb/204Pb vs 206Pb/204Pb and 207Pb/204Pb vs 206Pb/204Pb plots. They closely conform to the mantle growth curve2 of Carr et al. (1995), strongly suggesting mantle-like, or unevolved sources of lead. Such values are typical of mineralisation associated with the Ordovician to early Silurian volcanic rocks of the Macquarie Arc and have been used to define the field for Ordovician porphyry-related copper–gold mineralisation by Carr et al. (1995). The new Pb isotope data are also consistent with those for mantle-like reservoirs including Pacific MORB (Hanan & Graham 1996; Saal et al. 1998). Overall, the data support previous interpretations by Carr et al. (1995) and Forster et al. (2011), who found no evidence for lead with elevated 207Pb/204Pb and 208Pb/204Pb that is characteristic of crustal Pb reservoirs known in the Lachlan Orogen prior to the Benambran Orogeny.
New high precision data also corresponds well with lower precision CSIRO data (Table 1). Deviations toward more crustal values are greatest for 208Pb/204Pb, are associated with low-Pb samples, and can mostly be explained by the greater variability for f208Pb and the greater error inherent in calculations of initial ratios from samples with low Pb and high U/Pb ratios. The data support the interpretation that a single, mantle-like reservoir was associated with most of the mineralisation in the Cowal district (see Forster et al. 2011). This implies that mixing with lead of higher 208Pb and 207Pb did not occur, and therefore, that the Pb reservoir(s) in the Cowal district formed independently from more ‘crustal’ Pb, according to the Pb isotope models applicable to the region (see Cumming & Richards 1975; Carr et al. 1995). The data do not support mixing between the mantle-like lead, and reservoirs with much higher or lower 232Th/204Pb and/or 238U/204Pb (µ). Rocks of the Macquarie arc and the Cowal district in particular have very low abundances of lead. Therefore, interaction between the mineralising fluids and more Pb-rich and more ‘crustal’ sources of lead (such as siliciclastic sedimentary rocks of the Adaminaby Group or Wagga
Group) should have scavenged lead and produced higher 208Pb/204Pb and 207Pb/204Pb with deviations from the mantle array (see Glen et al. 2013; Bouse et al. 1999). An interpretation of predominantly mantle-like sources is also supported by the available whole-rock geochemical data for the Cowal district (Crawford, Meffre et al. 2007) and by regional εNd data (Wyborn & Sun 1993; Crawford, Cooke & Fanning 2007; Huston et al. in review; P. Blevin unpubl. data).
Cowal ‘gold corridor’ (E40–E41–E42–E46)Structurally controlled mineralisation of deep epithermal to mesothermal style at E41 and at E42–E46 (the ‘gold corridor’) gave results consistent with mantle-like Pb as defined by existing models (Figures 8). Excluding three more radiogenic results for E41 (which are interpreted to not represent initial ratios) the results from mineralisation at E41, E42 and E46 deposits plot almost within analytical error as defined by Group CwA1 (average 206Pb/204Pb = 17.974, 207Pb/204Pb = 15.466; corr = 0.87, 208Pb/204Pb = 36.623, n = 6) (Figure 5). Furthermore, a very precise group (CwA2) is defined by six high-Pb samples from E41, E42 and E46 and one corrected result from a vesicular dyke at E42. Group CwA2 averages 206Pb/204Pb = 17.967, 207Pb/204Pb = 15.465 and 208Pb/204Pb = 37.560, with close correspondence for 208Pb/204Pb vs 206Pb/204 and 207Pb/204Pb vs 206Pb/204Pb compared to the Ordovician Macquarie Arc field of Carr et al. (1995) (Figure 5).
These results are consistent with a homogenous Pb reservoir that is associated with mineralisation (see Gulson et al. 1987). A single corrected result for a vesicular dyke dated at 447 ± 4 Ma by the U–Pb SHRIMP method on zircon, corresponds precisely with Group CwA. We propose a model whereby the unique signature reflects a homogenous lead reservoir which formed during the mineralising ‘gold corridor’ event, roughly synchronously with deformation and the emplacement of phyric dykes.
More radiogenic results for E41 plot on a shallow positive slope relative to Group CwA2. Figure 5b shows this trend as a secondary isochron forced through Group CwA, thus relating the more radiogenic results to that population (see also Carr et al. 1995, p. 1473).
These data are consistent with the complex paragenetic associations described by Zukowski et al. (2014) that suggest that mineralisation at E41 was associated with magmatic–hydrothermal processes, characteristic of porphyry and low-sulfidation epithermal-style mineralisation. By contrast, at E42 porphyry and epithermal features are less well-developed, with mineralisation associated with intense structural

14 August 2015
dilatancy. The structural history included a second stage of gold mineralisation which marks a change from an extensional to a compressional structural regime during the formation of E42 (Henry et al. 2014).
Porphyry-associated depositsAll but one result for porphyry-style prospects (for which measured and corrected values are within analytical error) plot on a linear array and are within or slightly above the field for Ordovician copper–gold deposits on the plumbotectonic models of Carr et al. (1995). Despite the deviations toward more crustal values, 208Pb/204Pb vs 207Pb/204Pb ratios noted above and corrected results for whole-rock samples have quite similar average 206Pb/204Pb and 207Pb/204Pb compared with the Eurowie prospect sulfides, and generally plot about results for the high-Pb samples from the Cowal district (Figure 6). We suggest that the porphyry deposits are related to a single, fundamental source of mantle-like lead that is typical of ore deposits associated with the Macquarie Arc. Major deviations from mantle values are interpreted to be mainly the result of calculations of initial ratios for low-Pb samples with high U/Pb and Th/Pb.
However, in detail, data for individual porphyry deposits plot in less well-defined groups compared with results from the ‘gold corridor’. The data for E39 and Logjam suggest that there was insufficient Pb and an absence of large-scale hydrothermal activity — resulting in an inhomogeneous Pb isotope signature compared to E41, E42 and E46.
Regional comparisonsThe Pb isotope signatures for the Cowal district, supported by the age dating of intrusions and mineralisation now available, are distinct from the Pb isotope signatures associated with deposits at Cadia and in the Goonumbla district (Northparkes etc; see Figure 8; Carr et al. 1995; Forster et al. 2011). Cadia and Northparkes deposits formed around 443–437 Ma, roughly coincident with the Benambran Orogeny (Figure 8, Forster et al. 2004; Glen, Meffre & Scott 2007; Glen, Crawford & Cooke 2007; Cooke et al. 2007; Percival & Glen 2007). The distinctly less radiogenic signatures in the Cowal district imply that the 40Ar/39Ar dates on sericite of 438.6 ± 0.5 Ma (Perkins 1993) and 437.6 ± 0.6 Ma (Perkins et al. 1995) from within the ore zone at the Cowal mine reflect metahydrothermal activity associated with the Benambran Orogeny, not the mineralising event associated with the ‘gold corridor’ which we interpret to have formed about 450–455 Ma. Furthermore, the almost unique Pb isotope signatures for economically significant gold mineralisation in the Cowal ‘gold
corridor’ contrast with the disparate signatures of the synchronous to slightly older porphyry deposits (e.g. Milly Milly — 458 ± 2 Ma), all of which are sub-economic, highlighting Pb isotopes as a useful exploration tool in the region (see Gulson et al. 1987).
Mantle-like Pb isotopic signatures are almost ubiquitous for the Macquarie Arc (Wyborn & Sun 1993; Carr et al. 1995; Crawford, Meffre et al. 2007; Crawford, Cooke & Fanning 2007). By contrast, the Pb isotope signatures for many of the mineralisation styles (including porphyry-style deposits analogous to those at Cowal) that post-date the Benambran Orogeny, have either mixed signatures or crustal-dominant signatures (see Carr et al. 1995; Downes 2009). New Pb isotope data for the porphyry-style Trundle and Rose Hill prospects are a good example of this (see Figure 1, Figure 8 and Forster & Maas 2015). Both prospects are hosted by Late Ordovician volcanic rocks, are probably associated with quartz monzonite to quartz syenite stocks, and are in many respects analogous to systems such as E22 and E26 at Northparkes. However, recent dating suggests that the mineralisation at Trundle is Early Devonian in age (Re–Os age of 418.6 Ma ± 2Ma on molybdenite from Trundle — D. Forster and M. Norman unpublished data). An Early Devonian age for mineralisation at Trundle is also supported by a Pb–Pb model age of ~396 Ma (Figure 8). The Pb isotope values for Rose Hill and Trundle have high 208Pb/204Pb and 207Pb/204Pb ratios that plot distinctly above the mantle-like field for Ordovician Cu–Au deposits of Carr et al. (1995). This indicates that mixing between mantle-like and crustal Pb reservoirs occurred after accretion of the Macquarie Arc along the eastern margin of Gondwana (see Glen 2013). The identification of such mixed signatures for deposits interpreted as being associated with the Ordovician to earliest Silurian Macquarie Arc is significant and emphasises the usefulness of Pb isotopes in discriminating between deposits formed as part of the arc and those formed as a result of later events.
DecoyAs well as being the first recognised VAMS-style copper–gold prospect associated with the Macquarie Arc, the Decoy prospect, which shares several characteristics with the nearby E35 prospect, has most un-radiogenic signature for deposits in the Cowal district and is the second most un-radiogenic known to be associated with the Macquarie Arc. The data for Decoy is analogous to that for Peak Hill, which has the most un- radiogenic mantle-like signature so far identified in the Macquarie Arc. Carr et al. (1995) used the data for Peak Hill to define the un-radiogenic

15Quarterly Notes
end member of the field for Ordovician copper–gold deposits associated with the Macquarie Arc. Like Peak Hill, Decoy may reflect lead being sourced from older, possible Cambrian or Early Ordovician MORB-like Pb reservoirs (see Forster et al. 2011) by deeply cycled seawater-rich fluids. Such an interpretation is supported by a lead model age of ~484 Ma for Decoy that is older than the age of the host rock sequence.
The metal abundance for VAMS-type mineralisation reflects the metal endowment of the volume of the rock within the reaction zone that forms the source area to that zone/deposit (see Franklin et al. 2005). Given that units forming the Macquarie Arc have low to very low lead abundances, it is likely that deposits such as Decoy will also have low lead abundance but be enriched in a range of elements including copper, gold and zinc. Franklin et al. (2005) noted that VAMS-type systems associated with mafic-dominated sequences (such as the Macquarie Arc where siliciclastic sedimentary rocks are lacking) have average abundances of only 0.02% Pb but host average grades of 1.2% Cu, 0.84% Zn, 1.4 g/t Au and 10.62 g/t Ag. Such grades are analogous to Decoy, further supporting a VAMS association, although silver grades are mostly <5 g/t.
Implications for the substrate to the Macquarie ArcThe substrate to the Macquarie Arc is poorly exposed and largely speculative. It most likely consists of serpentinised MORB-like rocks of Cambrian age, but for the most part they are not in contact. Quinn et al. (2014) suggested that basement to the turbidite sequences that flank the Macquarie Arc includes MORB-like ophiolite units such as those near Kiandra and Tumut, but such rocks are not well exposed within the arc itself. Lead, and to an extent neodymium isotopes can fingerprint unexposed metal reservoirs (Gulson & Mizon 1979; Gulson 1986; Carr et al. 1995). Forster et al. (2011) and Huston et al. (in review) noted the unradiogenic and isotopically primitive, mantle-like source of lead in parts of the Macquarie Arc and suggested that the signatures reflect part of the poorly exposed substrate. Decoy and Peak Hill have similar lead isotope signatures to Cambrian MORB-like mafic and ultramafic rocks such as those near the Ponto mine. Lead isotope data for the Ponto mine, which is hosted by Cambrian sedimentary rocks (see Greenfield et al. 2010) in western New South Wales, are closely analogous to the data for Peak Hill and support the interpretation that Cambrian to Early Ordovician MORB-like units are present at Peak Hill and at Decoy. Such rocks could form a key component of the substrate to the Macquarie Arc. Given that
206Pb/204Pb correlates with independent age constraints on mineralisation, we suggest that one or more primitive lead isotope reservoirs progressively evolved throughout the Ordovician, punctuated by weak tectonomagmatic events, until significant mixing with crustal lead occurred during and after the Benambran Orogeny. Further Nd-isotope and O-Hf studies are required to better constrain these models and to define the nature of the substrate to the Macquarie Arc.
ConclusionsThe lead signatures of the Cowal district suggest that lead and ore metals were sourced from mantle-dominated lead reservoirs. Structurally controlled epithermal and porphyry-style mineralisation in the district probably formed 465–450 Ma, significantly before the Cadia and Goonumbla (Northparkes) systems which formed ~440 Ma. The plumbotectonic model of Carr et al. (1995) applies to the Cowal district. However, higher 206Pb/204Pb ratios for individual deposits correspond with (younger) independent constraints on mineralisation. We suggest that mineralisation of the Macquarie Arc was associated with one or more long-lived lead reservoirs that were not heterogeneous with respect to µ prior to the Benambran Orogeny, supporting previous interpretations by Forster et al. (2011). The unique lead signatures associated with major mineral districts compared with weaker mineralisation and more crustal or evolved signatures associated with unexpectedly young prospects such as Trundle, highlights that Pb isotope data is a useful exploration tool in the region.
The mafic-hosted Decoy copper–zinc–gold VAMS-type prospect has a very non-radiogenic and possibly old lead isotope signature. This suggests that Cambrian to Early Ordovician MORB-like rocks form basement to parts of the Cowal district and younger mineralising events sourced metals from such a substrate. Additional dating to constrain the timing of mineralisation, as well as further high resolution Pb isotope, Nd isotope and O-Hf studies throughout the Macquarie Arc, would help to define the nature of the substrate to the arc and allow for more robust regional comparisons.
AcknowledgementsBarrick (Cowal) Limited is sincerely thanked for permission to publish including access to unpublished age dating data. Phil Seccombe is thanked for his thoughtful and thorough review.

16 August 2015
ReferencesBastrakov E.N. 2000. Gold metallogenesis at the Lake Cowal Prospect, NSW. PhD thesis, Australian National University. (unpubl.).
Barrick Limited 2010. Seventh Annual Exploration Report on ML1535 — Cowal Gold Project, Covering Period 13 June 2009 to 12 June 2010. Geological Survey of New South Wales, File GS2010/0693.
Bissig T., Cooke D.R., Simpson K.A. & Tosdal R.M. 2008. Shallow- and Deep-Level Alkalic Mineral Deposits: Developing an Integrated Exploration Model, Year 3 — Epithermal Module, Final update to sponsors, November 2008, Orange, NSW.
Blevin P.L. 2002. The petrographic and compositional character of variably K-enriched magmatic suites associated with Ordovician porphyry Cu−Au mineralization in the Lachlan Fold Belt, Australia. Mineralium Deposita 37, 87−99.
Bouse R.M., Ruiz J., Titley S.R. Tosdal R.M. & Wooden J.L. 1999.Lead isotope compositions of Late Cretaceous and early Tertiary igneous rocks and sulfide minerals in Arizona; implications for the sources of plutons and metals in porphyry copper deposits. Economic Geology, 94 (2), 211−244
Bywater A., Williams S., McInnes P. & Dijkmans D. 2004. Developments at the Cowal gold project. In: Bierlein F.P., Hough M.A. eds. Tectonics to Mineral Discovery – Deconstructing the Lachlan Orogen. Proceedings Volume and Field Guide, MORE-SGEG Conference, Orange, NSW, July 6–8, 2004. Geological Society of Australia Abstracts 74, 77–82.
Cas R. 1983. A review of the palaeogeographic and tectonic development of the Palaeozoic Lachlan Fold Belt of southeastern Australia. Geological Society of Australia Special Publication 10.
Carr G.R. & Dean J.A. 1987. Report to Pan Australian Mining on a Pb isotopic study of the Tara Prospect, New South Wales, SIROTOPE, CSIRO Division of Mineral Physics and Mineralogy. In: Paull P.L. 1987. Pan Australian Mining Ltd. Exploration Licences 2346 and 2347, report for the period 8 January 1987 to 7 July 1987, fifth six monthly report, Langtree Project. Geological Survey of New South Wales, File GS1987/195.
Carr G.R., Dean J.A., Suppel D.W. & Heithersay P.S. 1995. Precise Pb isotope fingerprinting of hydrothermal activity associated with Ordovician to Carboniferous metallogenic events in the Lachlan Fold Belt, New South Wales. Economic Geology 90, 1467–1505.
Colquhoun G.P., Fergusson C.L. & Tye S.C. 1999. Provenance of early Palaeozoic sandstones, southeastern Australia, Part 2: cratonic to arc switching. Sedimentary Geology 125, 153–163.
Cooke D.R., Wilson A.J., House M.J., Wolf R.C.,Walshe J.L., Lickfold V. & Crawford A.J. 2007. Alkalic porphyry Au-Cu and associated mineral deposits of the Ordovician to Early Silurian Macquarie Arc, New South Wales. Australian Journal of Earth Sciences, 54(2), 445–463.
Crawford A.J. 2001. Tectono-magmatic development of the Ordovician volcanic belts in central western New South Wales and the timing and location of porphyry-style mineralization within the Macquarie Arc. In: Crawford A. J., Cooke D. R. & Glen R. A. eds. NSW Ordovician Strategic Partners in Industry Research Theme (SPIRT) Report, pp. 7.25–7.34. Centre for Ore Deposit Research, University of Tasmania, Hobart (unpubl.).
Crawford A.J., Cooke D.R. & Fanning C.M. 2007. Geochemistry and age of magmatic rocks in the unexposed Narromine, Cowal and Fairholme Igneous Complexes in the Ordovician Macquarie Arc, New South Wales, Australian Journal of Earth Sciences 54(2), 243–271.
Crawford A.J., Glen R.A., Cooke D.R. & Percival I.G. (guest editors) 2007. Geological evolution and metallogenesis of the Ordovician Macquarie Arc, Lachlan Orogen, New South Wales. Australian Journal of Earth Sciences 54(2), 137–141.
Crawford A.J., Meffre S., Squire R.J., Barron L.M. & Falloon T.J. 2007. Middle and Late Ordovician magmatic evolution of the Macquarie Arc, Lachlan Orogen, New South Wales. Australian Journal of Earth Sciences 54(2), 181–214.
Cumming G.L & Richards J.R. 1975. Ore Pb isotope ratios in a continuously changing earth. Earth and Planetary Science Letters 28, 155–171.
David V., Glen R. & Spencer R. 2004. Geophysical and geological interpretation of the Junee-Narromine volcanic belt. Extended Abstracts, 17th Geophysical Conference and Exhibition, Sydney, August 15–19, 2004, Australian Society of Exploration Geophysicists.
Doe B.R. & Stacey J.S. 1974. The application of lead isotopes to the problem of ore prospect evaluation. Economic Geology 69, 757–776.
Downes P.M. 2009. Sulfur- and lead-isotope signatures of selected middle Silurian to Carboniferous mineral systems of the Lachlan Orogen, eastern New South

17Quarterly Notes
Wales — implications for metallogenesis. PhD thesis, University of Newcastle, New South Wales. (unpubl.).
Faure G. & Messing T.M. 2005. Isotopes: Principles and applications. John Wiley & Sons.
Fergusson C.L. 2009. Tectonic evolution of the Ordovician Macquarie Arc, central New South Wales: arguments for subduction polarity and anticlockwise rotation. Australian Journal of Earth Sciences 56(2), 179–193.
Fergusson C.L & Coney P.J. 1992. Convergence and intraplate deformation in the Lachlan fold belt of southeastern Australia. Geology 20, 1047–1049.
Forster D.B. & Maas R. 2015. New lead isotope data for the Macquarie Arc. Geological Survey of New South Wales, Report GS2015/0994.
Forster D.B, Seccombe P.K. & Phillips D. 2004. Controls on skarn alteration and mineralization at the Cadia deposits, New South Wales, Australia. Economic Geology 99, 761–788.
Forster D.B., Carr G.A. & Downes P.M. 2011. Lead isotope systematics of ore systems of the Macquarie Arc — Implications for arc substrate. Gondwana Research 19, 686–705.
Foster D.A. & Gray D.R. 2000. Evolution and structure of the Lachlan Fold Belt (Orogen) of eastern Australia Source. Annual Review of Earth and Planetary Sciences 28, 47–80.
Franklin J.M., Gibson H.L., Jonasson IR. & Galley A.G. 2005. Volcanogenic massive sulfide deposits. In: Hedenquist J.W., Thompson J.F.H., Goldfarb R.J. & Richards J.P. eds. Economic Geology, 100th Anniversary Volume, The Economic Geology Publishing Company. 523−560.
Gemmel J.B. 2010. Consultant report in EL 5616 & EL 2865 Joint Annual Technical Report. Barrick Limited. Geological Survey of New South Wales, Report GS2010/0123.
Glen R.A. 2005. The Tasmanides of Eastern Australia. In: Vaughan A.P.M., Leat P.T. & Pankhurst R.J. eds. Terrane Processes at the Margins of Gondwana, pp. 23–96. Geological Society of London Special Publication 246,
Glen R.A. 2013. Refining accretionary orogen models for the Tasmanides of eastern Australia, Australian Journal of Earth Sciences: An International Geoscience Journal of the Geological Society of Australia 60(3), 315–370. DOI: 10.1080/08120099.2013.772537
Glen R.A., Crawford A.J. & Cooke D.R. 2007. Tectonic setting of porphyry Cu–Au mineralization in the Ordovician — Early Silurian Macquarie Arc, Eastern Lachlan Orogen, New South Wales. Australian Journal of Earth Sciences 54, 465–479.
Glen R.A., Crawford A.J., Percival I.G. & Barron L.M. 2007. Early Ordovician development of the Macquarie Arc, Lachlan Orogen, New South Wales. Australian Journal of Earth Sciences 54, 167–179.
Glen R.A., Dawson M.W. & Colquhoun G.P. 2006. Eastern Lachlan Orogen: Geoscience Database (on DVD-ROM) Version 2, NSW Department of Primary Industries, Minerals, Maitland, NSW, Australia, Geological Survey of New South Wales.
Glen R.A., Korsch R.J., Direen N.G., Jones L.E., Johnston A.E.D.W., Lawrie K.C., Finlayson D.M. & Shaw R.D. 2002. Crustal structure of the Ordovician Macquarie Arc, Eastern Lachlan Orogen, based on seismic-reflection profiling. Australian Journal of Earth Sciences 49, 323–348.
Glen R.A., Meffre S. & Scott R.J. 2007. Benambran Orogeny in the Eastern Lachlan Orogen, Australia. Australian Journal of Earth Sciences 54(2), 385–415.
Glen R.A. Quinn C.D. & Cooke D.R. 2012. The Macquarie Arc, Lachlan Orogen, New South Wales: Its evolution, tectonic setting and mineral deposits. Episodes 35(1), 177–186.
Glen R.A. Quinn C.D & Xiao D.R. (guest editors) 2011. Island arcs: their role in growth of accretionary orogens and mineral endowment. Gondwana Research 19(3), 567–570.
Glen R.A., Saeed A., Quinn C.D. & Griffin W.L. 2011. U–Pb and Hf isotope data from zirconsin the Macquarie Arc, Lachlan Orogen: implications for arc evolution and Ordovician palaeogeography along part of the east Gondwana margin. Gondwana Research 19, 670–685.
Glen R.A., Spencer R., Willmore A., David V. & Scott R.J. 2007. Junee–Narromine Volcanic Belt, Macquarie Arc, Lachlan Orogen, New South Wales: components and structure. Australian Journal of Earth Sciences 54, 215–241.
Greenfield J.E. & Reid W.J. 2010. Mount Arrowsmith 1:100 000 Geological Sheet 7237. Geological Survey of New South Wales, Maitland.
Gulson B.L. 1986. Lead isotopes in mineral exploration. Amsterdam, Elsevier.

18 August 2013
Gulson B.L., Large R.R. & Porritt P.M. 1987. Based metal exploration in the Mount Read Volcanics. Western Tasmania: 3. Application of Pb isotopes at Elliot Bay. Economic Geology 82, 291–307.
Gulson B.L. & Mizon K.J. 1979. Lead isotopes as a tool for gossan assessment in base metal exploration. Journal of Geochemical Exploration 11, 299–320.
Hanan B.B. & Graham D.W. 1996. Lead and helium isotope evidence from ocean basalts for common, deep source of mantle plumes. Science 272, 991–995.
Heithersay P.S., O’Neill W.J., van der Helder P., Moore C.R. & Harbon P.G. 1990. Goonumbla porphyry Cu district — Endeavour 26 North, Endeavour 22 and Endeavour 27 Cu–Au deposits, pp. 1385–1398. In: Hughes F.E. ed. Geology of the Mineral Deposits of Australia and Papua New Guinea. The Australasian Institute of Mining and Metallurgy, Melbourne, Monograph 14(2).
Heithersay P.S. & Walsh J.L. 1995. Endeavour 26 North: A porphyry copper-gold deposit in the Late Ordovician shoshonitic Goonumbla Volcanic Complex, New South Wales, Australia. Economic Geology 90, 1506–1532.
Henry A.D., McInnes P. & Tosdal M. 2014. Structural Evolution of Auriferous Veins at the Endeavour 42 Gold Deposit, Cowal Mining District, NSW, Australia. Economic Geology 109, 1051–1077.
Holliday J.R., Wilson A.J., Blevin P.L., Tedder I.J., Dunham P.D. & Pfitzner M. 2002. Porphyry Au–Cu mineralization in the Cadia district, eastern Lachlan Fold Belt, New South Wales, and its relationship to shoshonitic magmatism. Mineralium Deposita 37, 100–116.
Huston D.L., Champion D.C., Mernagh T.P., Downes P.M., Jones P., Carr G.R., Forster D.B. & David V. in review. Metallogenesis and geodynamics of the Lachlan Orogen: new (and old) insights from spatial and temporal variations in Pb isotopes.
Lickfold V., Cooke D.R., Smith S.G. & Ullrich T.D. 2003. Endeavour Cu–Au porphyry deposits, Northparkes, N.S.W. Intrusive history and fluid evolution. Economic Geology 98, 607–636.
McInnes P. 2010. EL 5616 & EL 2865 Joint Annual Technical Report. Barrick Limited. Geological Survey of New South Wales, Report GS2010/0831.
McInnes P., Miles I.N., Radclyffe D. & Brooker M. 1998. Endeavour 42(E42) gold deposit, Lake Cowal: Geology of Australian and Papua New Guinean mineral deposits. Australian Institute of Mining and Metallurgy, Monograph Series 22, 581−585.
Miles I.N. & Brooker M.R. 1998. Endeavour 42 deposit, Lake Cowal, New South Wales: a structurally controlled Au deposit. Australian Journal of Earth Sciences 45,837–847.
Norman M., Bennett V., Blevin P.L. & McCulloch M. 2004. New Re-Os Ages of Molybdenite from Granite-related Deposits of Eastern Australia Using an Improved Multi-collector ICP-MS Technique. Deconstructing the Lachlan Orogen. Proceedings Volume and Field Guide, MORE-SGEG Conference, Orange, NSW, July 6–8, 2004. Geological Society of Australia Abstracts 74, 12–133.
Owen M. & Wyborn D. 1979. Tantangara (New South Wales and Australian Capital Territory) 1:100 000 Geological Map First Edition, Bureau of Mineral Resources, Canberra.
Percival I.G. & Glen R.A. 2007. Ordovician to earliest Silurian history of the Macquarie Arc, Lachlan Orogen, New South Wales. Australian Journal of Earth Sciences 54(2), 143–165.
Perkins C., McDougall I., Claoue-Long J. & Heithersay P.S. 1990. 40Ar/39Ar and U– Pb geochronology of the Goonumbla porphyry Cu–Au deposits, New South Wales, Australia. Economic Geology 85, 1808–1824.
Perkins C. 1993. Results of Ar–Ar and K–Ar dating of rock samples from Lake Cowal. Research School of Earth Sciences, Australian National University, Report to Geopeko (unpubl.).
Perkins C., Walshe J.L. & Morrison G. 1995. Metallogenic episodes of the Tasman Fold Belt System, Eastern Australia. Economic Geology 90, 1443–1466.
Quinn C.D., Percival I.G., Glen R.A. & Xiao W.J., Quinn C., 2014. Ordovician marginal basin evolution near the palaeo-Pacific east Gondwana margin, Australia. Journal of the Geological Society, London 171, 723–736.
Raymond O.L., Duggan M.B., Lyons P., Scott M.M., Sherwin L., Wallace D.A., Krynen J.P., Young G.C., Wyborn D., Glen R.A., Percival I.G. & Leys M. 2000. Forbes 1:250 000 geological map, SI/55−7. Second edition. Australian Geological Survey Organisation, Canberra and the Geological Survey of New South Wales, Orange.
Saal A.E., Hart S.R., Shimizu N.E.H., Hauri E.H. & Layne G.D. 1998. Pb Isotopic Variability in Melt Inclusions from Oceanic Island Basalts, Polynesia. Science 282. 1481–1484.
Scheibner E. 1975. Lachlan Fold Belt. Definition and review of structural elements. p. 108–113

19Quarterly Notes
In: Markham N.L. & Basden H. 1975. The Mineral Deposits of New South Wales. Geological Survey of New South Wales, Sydney.
Scheibner E. & Basden H. (ed.) 1996. Geology of New South Wales — Synthesis. Volume 1 Structural Framework. Geological Survey of New South Wales, Memoir Geology 13 (1).
Stacey J.S. & Kramers J.D. 1975. Approximation of terrestrial Pb isotope evolution by a two-stage model. Earth and Planetary Science Letters 26, 207–221.
Stanton R.L. & Russel R.D. 1959. Anomalous leads and the emplacement of lead sulfide ores. Economic Geology 54(4), 588–607.
Stein H.J., Markey R.J., Morgan J.W., Hannah J.L & Scherstén A. 2001. The remarkable Re–Os chronometer in molybdenite: how and why it works. Terra Nova 13(6), 479–486.
Strickland T.J. 2005. Geology of the E42 breccia complex at the Cowal Au deposit, NSW, Australia. B.Sc. Honours thesis, University of Tasmania, Hobart, Australia. (unpubl.).
Wilson A.J., Cooke D.R. & Harper B.I. 2003. The Ridgeway Au–Cu deposit: A high-grade alkalic porphyry deposit in the Lachlan Fold Belt, New South Wales, Australia. Economic Geology 98, 1637–1666.
Wilson A.J., Cooke D.R., Stein H.J., Fanning C.M., Holliday J.R. & Tedder I.J. 2007. U–Pb and Re–Os geochronologic evidence for two alkalic porphyry ore-forming events in the Cadia district, New South Wales, Australia. Economic Geology 102, 3–26.
Woodhead J. 2002. A simple method for obtaining highly accurate Pb isotope data by MC-ICP-MS. Journal of Analytical atomic spectrometry 17, 1381–1385.
Wyborn D. 1992. The tectonic significance of Ordovician magmatism in the eastern Lachlan Fold Belt. Tectonophysics 214, 177–192.
Wyborn D. & Sun S.S. 1993. Nd-isotopic fingerprinting of Cu–Au mineralization in the Lachlan Fold Belt. AGSO Research Newsletter 19, 13–14.
Zukowski W. 2009. Intrusive history, vein paragenesis, hydrothermal alteration and sulfur isotope signature of the E43 Cu–Au porphyry prospect, Cowal District, NSW, Australia. In: Barrick Limited. Twenty-Ninth Annual Exploration report on EL1590 – South Cowal Project, covering period 13 March 2009 to 12 March 2010. Geological Survey of New South Wales, File 2010/0331.
Zukowski W. 2010. Geology and mineralisation of the Endeavour 41 gold deposit, Cowal district, NSW, Australia. PhD. Thesis, University of Tasmania, Hobart, Australia. (unpubl.).
Zukowski W., Cooke D.R., Deyell C.L., McInnes P. & Simpson K. 2014. Genesis and exploration implications of epithermal gold mineralization and porphyry-style alteration at the Endeavour 41 prospect, Cowal District, New South Wales, Australia. Economic Geology 109, 1079–1115.

Table 1. Lead isotope results including corrected values based on corrections for contained 232Th and 238U.
Prospect/Deposit Sample no. DDH Depth /location Sample Type Mineral/rock
U (p
pb)
Th (p
pb)
Pb (p
pb)
238U
/204
Pb
calc
ulat
ed
232T
h/20
4Pb
calc
ulat
ed
206P
b/20
4Pb
mea
sure
d
±2sd
207P
b/20
4Pb
mea
sure
d
±2sd
208P
b/20
4Pb
mea
sure
d
±2sd
206P
b/20
4Pb
45
0 M
a
207P
b/20
4Pb
45
0 M
a
208P
b/20
4Pb
450
Ma
Decoy DBF11-1-1A D56165-D125 176.6 m wr Volcaniclastic 2947 1624 120922 1.509 0.859 17.7971 0.009 17.7971 0.009 37.3834 0.037 17.688 15.429 37.364Decoy DBF11-1-1B D56165-D125 176.6 m wr Volcaniclastic 1020 1014 438611 0.144 0.859 17.6851 0.009 17.6851 0.009 37.3639 0.037 17.675 15.428 37.361Decoy DBF11-1-2A D56165-D144 173.1 m wr Volcaniclastic 473 337 81488 0.359 0.148 17.7010 0.009 17.7010 0.009 37.3643 0.037 17.675 15.427 37.358Decoy DBF11-1-2B D56165-D144 173.1 m wr Chlorite altered porphyry 00s ppm Pb 1161 1137 1134867 0.063 0.264 17.6788 0.009 17.6788 0.009 37.3603 0.037 17.674 15.428 37.359Decoy DBF11-1-3 D56165-D144 171.6 m wr Dyke contact epidote 1068 801 252222 0.262 0.064 17.6945 0.009 17.6945 0.009 37.3650 0.037 17.676 15.428 37.360Milly_Milly DBF11-1-4* MMD003 142.2 m wr Diorite to monzodiorite − moly veins 2855 2439 3280 59.654 0.203 23.2361 0.012 23.2361 0.012 39.3044 0.039 18.923 15.549 38.119Logjam DBF11-1-5 5616D012 238.95 m wr Moly-rich breccia − trace galena 425 1319 10582 2.512 52.658 18.1814 0.009 18.1814 0.009 37.7258 0.038 18.000 15.461 37.544Logjam DBF11-1-5 5616D012 238.95 m wr Moly-rich breccia − trace galena 425 1319 10582 2.512 8.058 18.1810 0.009 18.1810 0.009 37.7194 0.038 17.999 15.458 37.538Logjam DBF11-1-5A 5616D012 238.95 m wr Moly-rich breccia − trace galena 597 716 903048 0.041 8.057 17.9165 0.009 17.9165 0.009 37.5465 0.038 17.914 15.455 37.545E42 DBF11-1-6 D1052 681 m wr Low Pb − vesicular dyke key sample 591 1461 10004 3.705 0.051 18.2421 0.009 18.2421 0.009 37.8057 0.038 17.974 15.467 37.593E41 DBF11-1-10A* D2178 176 m wr Mafic ‘monzogranite’ dated 458.5 ± 5.2 Ma 2135 4686 3976 37.063 9.460 23.5062 0.012 23.5062 0.012 39.5901 0.040 20.827 15.638 37.698E41 DBF11-1-10A* D2178 176 m wr 2135 4686 3976 37.044 84.041 23.5000 0.012 23.5000 0.012 39.5647 0.040 20.822 15.628 37.673E41 DBF11-1-10B* D2178 176 m wr 1769 3658 4698 24.662 83.997 20.3348 0.010 20.3348 0.010 38.8612 0.039 18.552 15.502 37.675E41 DBF11-1-12A D2178 245 m wr Tonalite intrusion into Muddy Lake Diorite 1251 1748 3578 22.594 52.696 19.7062 0.010 19.7062 0.010 38.4867 0.038 18.073 15.480 37.752E42 DBF11-1-11 D1034 346 m wr Muddy Lake Diorite sill 1044 1602 1751 39.400 32.620 20.8600 0.010 20.8600 0.010 38.9749 0.039 18.01 15.46 37.568E41 DBF11-1-12B D1615 245 m wr 1486 706 7091 13.291 62.469 18.8597 0.009 18.8597 0.009 38.0271 0.038 17.899 15.454 37.880E42 DBF11-1-13A D1615 571 m wr Muddy Lake Diorite 1057 1339 2267 30.333 6.521 20.1071 0.010 20.1071 0.010 38.6136 0.039 17.914 15.453 37.719
E42 DBF11-1-13A D1615 571 m wr Muddy Lake Diorite 1057 1339 2267 30.307 39.713 20.0983 0.010 20.0983 0.010 38.5721 0.039 17.907 15.438 37.679Wyrra DBF11-1-14A WYD003 437.4 m wr w/r 1006 1185 2134 30.704 39.679 20.1427 0.010 20.1427 0.010 38.6362 0.039 17.923 15.452 37.795Wyrra DBF11-1-14A WYD003 437.4 m wr w/r 911 1249 2039 29.051 37.377 20.0546 0.010 20.0546 0.010 38.5925 0.039 17.954 15.455 37.666Wyrra DBF11-1-14B WYD003 437.4 m wr w/r 804 951 2720 18.922 41.150 19.3307 0.010 19.3307 0.010 38.2456 0.038 17.963 15.457 37.725Wyrra DBF11-1-15A WYD003 434.7 m wr Sulfides mixed 42 65 1864 1.411 23.126 18.1373 0.009 18.1373 0.009 38.2456 0.038 18.035 15.463 38.195Wyrra DBF11-1-17A WYD003 434.7 m wr w/r 1213 585 9161 8.348 2.268 18.6453 0.009 18.6453 0.009 37.7893 0.038 18.042 15.476 37.696Wyrra DBF11-1-17B* WYACD003 434.7 m wr w/r 272 546 4028 4.265 4.159 18.7566 0.009 18.7566 0.009 37.9023 0.038 18.448 15.499 37.703
E39 DBF11-1-7* D6001 290 m Feldspar Diorite dyke 89 86 1726 3.240 8.853 18.5979 0.009 18.5979 0.009 37.8328 0.038 18.364 15.494 37.760
E39 DBF11-1-7* D6001 290 m Feldspar Diorite dyke 89 86 1726 3.240 3.237 18.5929 0.009 18.5929 0.009 37.8388 0.038 18.359 15.493 37.766
E39 DBF11-1-7 D6001 290 m Feldspar Diorite porphyry dyke 108 52 1234 5.499 3.237 18.3886 0.009 18.3886 0.009 37.7798 0.038 17.991 15.463 37.718E43 DBF11-1-8 D009 169 m Feldspar Quartz dacite 331 358 789 27.078 2.724 19.8642 0.010 19.8642 0.010 38.3325 0.038 17.906 15.453 37.652E39 DBF11-1-9* D6001 351 m Feldspar Granodiorite 85 50 1434 3.723 30.243 18.5879 0.009 18.5879 0.009 37.8830 0.038 18.319 15.495 37.832
E39 DBF11-1-9* D6001 351 m Feldspar Granodiorite 222 87 1292 10.972 2.259 19.4710 0.010 19.4710 0.010 38.0063 0.038 18.678 15.474 37.907E39 DBF12-1-9 D6001 351 m Feldspar Granodiorite 1507 250 6766 14.183 4.430 18.9772 0.009 18.9772 0.009 38.1754 0.038 17.952 15.474 37.628Eurowie DBF11-1-16 WYD003 434.7 m Chalcopyrite Volcaniclastic 5 3 5901 0.053 24.314 18.0683 0.009 18.0683 0.009 37.7207 0.038 18.0645 15.4888 37.7200
Eurowie DBF11-1-16 WYD003 434.7 m Chalcopyrite Volcaniclastic 99 26 115307 0.054 0.030 18.0702 0.009 18.0702 0.009 37.6742 0.038 18.0664 15.4736 37.6739
Eurowie DBF11-1-16 WYD003 434.7 m Chalcopyrite Volcaniclastic 166 11 58253 0.178 0.015 18.0688 0.009 18.0688 0.009 37.6655 0.038 18.0559 15.4710 37.6652
Eurowie DBF11-1-16 WYD003 434.7 m Chalcopyrite Volcaniclastic 149 29 89224 0.104 0.012 18.0546 0.009 18.0546 0.009 37.6400 0.038 18.0471 15.4631 37.6395Eurowie DBF11-1-16 WYD003 441.5 m Feldspar Volcaniclastic 9 7 9424 0.062 0.021 18.0091 0.009 18.0091 0.009 37.5951 0.038 18.0046 15.4549Eurowie DBF11-1-18 WYD003 441.5 m Feldspar Limey Volcaniclastic 21 15 5777 0.231 0.050 18.0209 0.009 18.0209 0.009 37.6279 0.038 18.0042 15.4654 37.6241
Eurowie DBF11-1-18 WYD003 441.5 m Chalcopyrite Limey Volcaniclastic 2 8 3325 0.036 0.166 18.0452 0.009 18.0452 0.009 37.7005 0.038 18.0426 15.4802 37.6970
Eurowie DBF11-1-18 WYD003 441.5 m Chalcopyrite Limey Volcaniclastic 2 3 4913 0.022 0.155 18.0528 0.009 18.0528 0.009 37.7085 0.038 18.0512 15.4854 37.7077Rose Hill DBF11-3-5 RHD002 406.73 m Pyrite 371 170 179280 18.1976 0.009 18.1976 0.0091 38.0531 0.038 18.188 15.559 38.039Rose Hill DBF11-3-9 RHD002 406.73 m Pyrite 466 17 144741 18.0044 0.009 18.0044 0.0090 37.8259 0.038 17.990 15.539 37.824Trundle Park DBF12-1-2a TPRC022 30−31 m Galena 18.1818 15.5723 38.0835Trundle Park DBF12-1-2b TPRC022 30−31 m Galena 18.1828 15.5747 38.0918E41 DBF12-1-5 D2155 138.1 m Mixed sulfides Volcanic-derived sandstone 18.0372 15.4789 37.6813Cowal (E42 Trents Lode − CSIRO)
DBF71aVolcanic − quartz>carbonate veining silicified, healed breccia
17.975 15.470 37.591
Cowal (E42 Trents Lode − CSIRO data)
DBF71bVolcanic − quartz>carbonate veining silicified, healed breccia
17.960 15.464 37.61
Cowal (E41 − CSIRO data) DBF7-2a 190.1 m Volcanic − galena-sphalerite-rich core of vein 17.956 15.461 37.585Cowal (E41 − CSIRO data) DFB7-2b 190.1 m Volcanic − core of vein some galena 18.027 15.473 37.575Cowal (E41 − CSIRO data) DBF7-2d 138.1 m Volcanic − core of vein some galena 17.967 15.465 37.65Cowal (E46 − CSIRO data) DBF7-3a 515.5 m Volcanic 17.968 15.464 37.586Cowal (E46 − CSIRO data) DBF7-3b 515.5 m Volcanic 17.968 15.464 37.583
For further details see Forster & Maas (2015).
* Eliminated results – Not initial ratios

NSW Department of Industry, Division of Resources & Energy516 High Street, Maitland NSW 2320PO Box 344 Hunter Region Mail Centre NSW 2310T:1300 736 122 T: (02) 49316666
www.resourcesandenergy.nsw.gov.au
Future papers:
‘Seamless geology of NSW: approach, methodology and application’ by Glen Phillips, Gary G. Colquhoun, Kyle S. Hughes and Liann Deyssing
‘A 3D model for the Koonenberry Belt from geologically constrained inversion of potential field data’ by Robert J. Musgrave and Stephen Dick
‘Regional metamorphism and the alteration response to selected Silurian to Devonian mineral systems in the Nymagee area, Central Lachlan Orogen, New South Wales — a HyLogger™ case study’ by Peter M. Downes, David B. Tilley, Joel Fitzherbert and Meagan E. Clissold
‘Outcomes of the Nymagee mineral system study — an improved understanding of the timing of events and prospectivity of the Central Lachlan Orogen’ by Peter M Downes, Phil L Blevin, Richard Armstrong, Carol J. Simpson, Lawrence Sherwin, David B. Tilley and Gary R. Burton
‘Coastal Quaternary mapping of the Southern Hunter to Northern Illawarra regions, NSW’ by Alexa Trodeson and Liann Deyssing