Embed Size (px)
Citation preview
pathogens
Article
QTL Mapping for Resistance to Cankers Induced byPseudomonas syringae pv. actinidiae (Psa) in aTetraploid Actinidia chinensis Kiwifruit Population
Jibran Tahir 1 , Cyril Brendolise 1 , Stephen Hoyte 2, Marielle Lucas 3, Susan Thomson 4,Kirsten Hoeata 5, Catherine McKenzie 5 , Andrew Wotton 6, Keith Funnell 6 , Ed Morgan 6 ,Duncan Hedderley 6 , David Chagné 6, Peter M. Bourke 7 , John McCallum 4,* ,Susan E. Gardiner 6,* and Luis Gea 5,*
1 The New Zealand Institute for Plant and Food Research Limited, Private Bag 92-169, Auckland 1025,New Zealand; [email protected] (J.T.); [email protected] (C.B.)
2 The New Zealand Institute for Plant and Food Research Limited, Hamilton 3214, New Zealand;[email protected]
3 Breeding Department, Enza Zaden, 1602 DB Enkhuizen, The Netherlands; [email protected] The New Zealand Institute for Plant and Food Research Limited, Lincoln 7608, New Zealand;
[email protected] The New Zealand Institute for Plant and Food Research Limited, 412 No 1 Road, RD2, Te Puke 3182,
New Zealand; [email protected] (K.H.); [email protected] (C.M.)6 The New Zealand Institute for Plant & Food Research Limited, Private Bag 11030, Manawatu Mail Centre,
Palmerston North 4442, New Zealand; [email protected] (A.W.);[email protected] (K.F.); [email protected] (E.M.);[email protected] (D.H.); [email protected] (D.C.)
7 Plant Sciences Group, Department of Plant Sciences, Wageningen University and Research,Droevendaalsesteeg 1, P.O. Box 386, 6700 AJ Wageningen, The Netherlands; [email protected]
* Correspondence: [email protected] (J.M.); [email protected] (S.E.G.);[email protected] (L.G.)
Received: 12 October 2020; Accepted: 16 November 2020; Published: 20 November 2020 �����������������
Abstract: Polyploidy is a key driver of significant evolutionary changes in plant species. The genusActinidia (kiwifruit) exhibits multiple ploidy levels, which contribute to novel fruit traits, high yieldsand resistance to the canker-causing dieback disease incited by Pseudomonas syringae pv. actinidiae(Psa) biovar 3. However, the genetic mechanism for resistance to Psa observed in polyploid kiwifruitis not yet known. In this study we performed detailed genetic analysis of a tetraploid Actinidiachinensis var. chinensis population derived from a cross between a female parent that exhibits weaktolerance to Psa and a highly Psa-resistant male parent. We used the capture-sequencing approachacross the whole kiwifruit genome and generated the first ultra-dense maps in a tetraploid kiwifruitpopulation. We located quantitative trait loci (QTLs) for Psa resistance on these maps. Our approachto QTL mapping is based on the use of identity-by-descent trait mapping, which allowed us to relatethe contribution of specific alleles from their respective homologues in the male and female parent,to the control of Psa resistance in the progeny. We identified genes in the diploid reference genomewhose function is suggested to be involved in plant defense, which underly the QTLs, includingreceptor-like kinases. Our study is the first to cast light on the genetics of a polyploid kiwifruit andsuggest a plausible mechanism for Psa resistance in this species.
Keywords: perennials; polyploid genetics; kiwifruit; polygenic resistance; bacterial pathogen; QTLs;chromosome pairing
Pathogens 2020, 9, 967; doi:10.3390/pathogens9110967 www.mdpi.com/journal/pathogens
Pathogens 2020, 9, 967 2 of 21
1. Introduction
Most angiosperm species are diploid, the state where there are two complete sets of chromosomesin each nucleus. However, many plant species are polyploid, exhibiting more than two completesets of chromosomes [1–4]. A number of agricultural and horticultural crops have their origin inpolyploidy or are polyploid [5,6], for example banana, coffee, potato, cotton, strawberry and wheat.However, polyploids present a significant challenge to geneticists for the investigation of the geneticbasis of traits, owing to the complex segregation patterns and preferential vs non-preferential pairingamong chromosomes observed in such species [7–9]. Recent progress in sequencing and genotypingmethodologies, as well as statistical tools for analyzing genetic data from polyploids, have overcomekey issues that previously hindered the understanding of polyploid genomes [10,11].
The manner in which different homologous chromosomes pair and recombine during meiosisfurther determines the biological properties of a polyploid genome and the transmission of geneticinformation to the offspring. For example, in a tetraploid species where there is random pairing ofhomologous chromosomes, recombination occurs among all homologues. This manner of inheritanceis termed polysomic and is characteristic of auto-polyploids such as potato and alfalfa, but can alsobe observed in “segmental” allopolyploids, such as peanuts [12–14]. Where the four homologouscopies of a chromosome in a tetraploid species pair and recombine strictly preferentially, this resultsin disomic inheritance [13,14]. This pattern is typical of allopolyploids, such as wheat and coffee.In general, chromosomal pairing preference provides strong clues as to the origin of chromosomes in aspecies and its progenitors.
Pure auto- and allopolyploids are the two extremes of the spectrum and there are several speciesthat fall in between, including some natural polyploid populations in the genus Actinidia (kiwifruit),which appears to be a “segmental” allopolyploid [15–17]. Additional polyploid kiwifruit selections havebeen generated by Plant & Food Research’s breeding programme by artificial chromosome doublingand crossing between different ploidy levels. Segmental allopolyploids can originate from parentsbelonging to distinct subspecies [18], resulting in the formation of templates for divergent genomes,with repercussions for chromosomal as well as transcriptional and epigenetic modifications [19–21].This form of hybridity in genomes can contribute to homologous recombination among segments ofchromosomes from respective parents [22], which entails changes at the molecular and phenotypiclevels, paving the way for adaptation, speciation and invasiveness. In New Zealand, some of thenative flora as well as introduced agricultural plant species exhibit allopolyploidy [23].
The exotic kiwifruit, with their high vitamin and mineral contents, attract consumers and contributebillions of dollars to the global economy, in addition to supporting the New Zealand horticulturalindustry. Originating in China, the Actinidia genus holds a resource of ploidy levels recognized at thesub-species level [24]. The green-fleshed hexaploid (2n = 6x = 174) A. chinensis var. deliciosa (‘Hayward’)was first cultivated in the mid-19th century, followed by the yellow-fleshed diploid (2n = 2x = 58)A. chinensis var. chinensis (‘Hort16A’) in the 1990s. ‘Hort16A’ succumbed to the global pandemicincited by the canker-causing Pseudomonas syringae pv. actinidiae (Psa) biovar 3 [25,26]. The genomes ofdiploid A. chinensis var. chinensis [27–29] and A. eriantha [30] have recently been sequenced, which willsignificantly assist genetic and genomic studies associated with agronomic traits, as well as elucidatingthe evolution of the genus and its fitness over diverse climates and geographies.
Breeding programmes focus on tetraploid cultivars, because of their resilience to the Psadisease, as well as robust fruit quality traits and size. However, there remains a substantialknowledge gap concerning the chromosomal biology and complex gene-trait associations in polyploidActinidia compared with diploid species. Actinidia species are mostly dioecious and exhibit highheterozygosity [24]. This high degree of heterozygosity can facilitate trait mapping in segregating F1populations using quantitative trait locus (QTL) mapping or association studies [11]. New genotypingplatforms, including genotyping-by-sequencing (GBS) and single nucleotide polymorphism (SNP)arrays, are now available to capture allelic variations and haplotypes across the genome [31].Furthermore, new tools have emerged for utilizing the abundant sequence data generated for the
Pathogens 2020, 9, 967 3 of 21
purpose of dissecting the genetic determinism of complex traits in polyploids, including the softwareTetraploidSNPMap [32] as well as packages based in R that include polymapR [33], net was [34],MapPoly [35], QTLpoly [36] and PERGOLA [37].
In this study, our goal was to cast light on the genetic regulation of resistance against thecanker-causing Psa biovar 3 in a tetraploid F1 population of kiwifruit, by performing QTL mappingbased on disease phenotype data collected in the field and greenhouse. A previous study has suggestedthat Psa resistance in a diploid yellow-fleshed kiwifruit population is governed by several QTLs [38].However, the greater resilience against the pathogen, as well as low severity of disease symptomscompared with those in diploids [39], raises questions about the mode of inheritance of resistance intetraploids. In the present study we utilized a robust new approach based on capture-based sequencing(Capture-Seq) to generate high density linkage maps using polymapR [33], followed by polyqtlR [40]for performing QTL mapping using identity-by-descent trait mapping [40]. Our analysis providesa first and comparative view of the genetic landscape of a tetraploid A. chinensis, and insights intothe genomic regions regulating the quantitative form of Psa resistance in a yellow-fleshed sub-speciesof kiwifruit.
2. Results and Discussion
2.1. Bait Selection for High-Density SNP-Based Genotyping in Kiwifruit
A total of 9918 baits were designed by Rapid Genomics (Gainesville, Florida, USA) across the 29chromosomes of diploid kiwifruit Red5, to genotype the population using Capture-Seq. These areexome baits designed within the genes to capture regions of 120 bp in length. Within each chromosome,10–20 baits were spaced on average within every 1 Mb region. On average there were ~333 baits perchromosome (Figure S1).
2.2. Variant Calling and Dosage Estimation
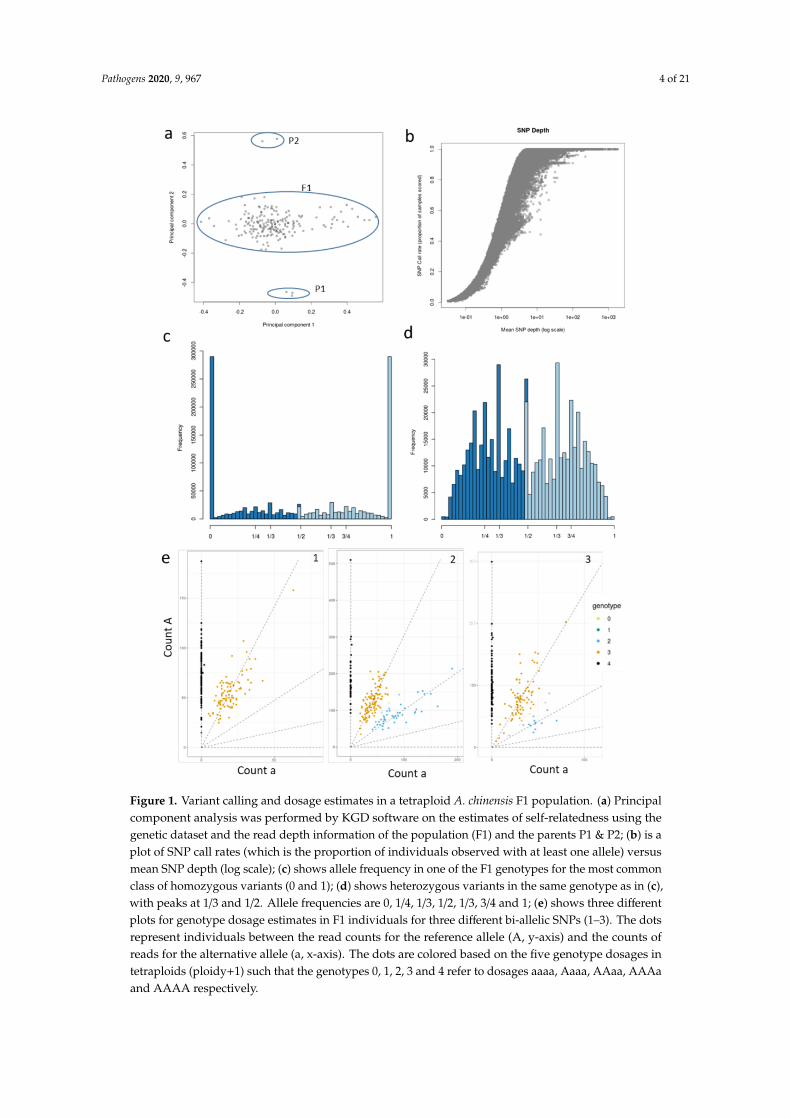
A total of 9918 baits were used to genotype 235 F1 individuals of the tetraploid A. chinensis P1 × P2population. These generated 1.03 × 10⁹ paired-end reads with a high quality score (mean Phredscore 37). The population had a mean and median depth of 120x and 111x across baits, respectively.Within this dataset, a total of 725,175 raw SNP variants were identified that had an alignment rateof ~94.5% to the Red5 diploid kiwifruit genome. Estimates for self-relatedness in the population,calculated using the SNP dataset and read depth adjustments, indicated 20 individuals were outliers,suggesting that pollen contamination had occurred (Figure S2). After the removal of these contaminants,13 F1 individuals with low quality (lower sample depth and call rate) were removed (Figure S2),which resulted in a final set of 188 true hybrids with high-quality sequence data for variant selection(Figure 1a).
A plot of the mean sequencing depth against the proportion of individuals with at least onesequence read at each SNP position (SNP call rate) indicates that most genotypes were called withsufficient read depth (1.00 log scale) (Figure 1b). A substantial proportion of SNPs had high minorallele frequency (MAF) (0.5), although SNPs with a lower MAF (0.275) were also common (Figure S3).Characterization of allele types by an allele frequency count in one of the seedlings demonstrated allelefrequency rates in the dataset and was employed to represent the ploidy level of genotypes. Figure 1c,dhighlight the frequency peaks of homozygous alleles/haplotypes (0/0 and 1/1) and heterozygousalleles/haplotypes (1/2, 3/4 and 1/4), respectively, for tetraploids. The 1/3 fractions in allelic frequenciesin tetraploids have been previously noted and could point to possible null alleles (aaA0 or aAA0) [41] orother phenomena such as copy number variations in the repetitive portion of the reference genome [42].Filtering of SNPs to a minimum read depth of 60 yielded ~70,000 markers usable for dosage estimation.
Pathogens 2020, 9, 967 4 of 21
Figure 1. Variant calling and dosage estimates in a tetraploid A. chinensis F1 population. (a) Principalcomponent analysis was performed by KGD software on the estimates of self-relatedness using thegenetic dataset and the read depth information of the population (F1) and the parents P1 & P2; (b) is aplot of SNP call rates (which is the proportion of individuals observed with at least one allele) versusmean SNP depth (log scale); (c) shows allele frequency in one of the F1 genotypes for the most commonclass of homozygous variants (0 and 1); (d) shows heterozygous variants in the same genotype as in (c),with peaks at 1/3 and 1/2. Allele frequencies are 0, 1/4, 1/3, 1/2, 1/3, 3/4 and 1; (e) shows three differentplots for genotype dosage estimates in F1 individuals for three different bi-allelic SNPs (1–3). The dotsrepresent individuals between the read counts for the reference allele (A, y-axis) and the counts ofreads for the alternative allele (a, x-axis). The dots are colored based on the five genotype dosages intetraploids (ploidy+1) such that the genotypes 0, 1, 2, 3 and 4 refer to dosages aaaa, Aaaa, AAaa, AAAaand AAAA respectively.
Pathogens 2020, 9, 967 5 of 21
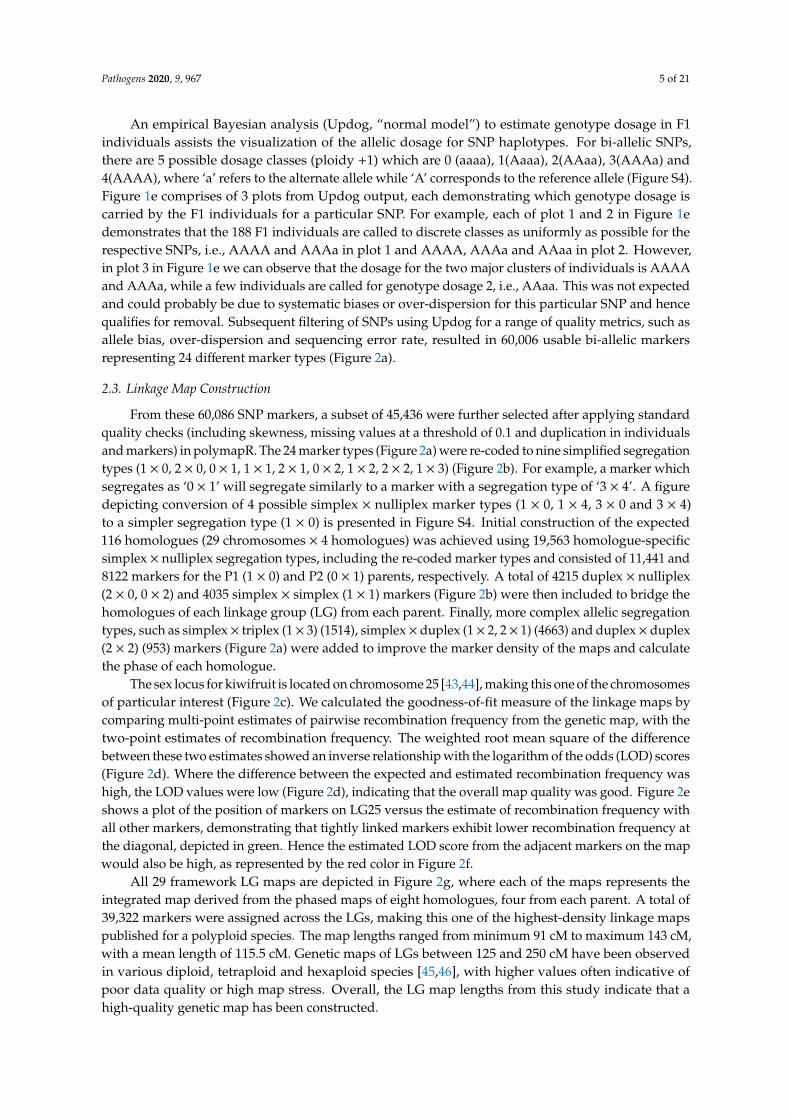
An empirical Bayesian analysis (Updog, “normal model”) to estimate genotype dosage in F1individuals assists the visualization of the allelic dosage for SNP haplotypes. For bi-allelic SNPs,there are 5 possible dosage classes (ploidy +1) which are 0 (aaaa), 1(Aaaa), 2(AAaa), 3(AAAa) and4(AAAA), where ‘a’ refers to the alternate allele while ‘A’ corresponds to the reference allele (Figure S4).Figure 1e comprises of 3 plots from Updog output, each demonstrating which genotype dosage iscarried by the F1 individuals for a particular SNP. For example, each of plot 1 and 2 in Figure 1edemonstrates that the 188 F1 individuals are called to discrete classes as uniformly as possible for therespective SNPs, i.e., AAAA and AAAa in plot 1 and AAAA, AAAa and AAaa in plot 2. However,in plot 3 in Figure 1e we can observe that the dosage for the two major clusters of individuals is AAAAand AAAa, while a few individuals are called for genotype dosage 2, i.e., AAaa. This was not expectedand could probably be due to systematic biases or over-dispersion for this particular SNP and hencequalifies for removal. Subsequent filtering of SNPs using Updog for a range of quality metrics, such asallele bias, over-dispersion and sequencing error rate, resulted in 60,006 usable bi-allelic markersrepresenting 24 different marker types (Figure 2a).
2.3. Linkage Map Construction
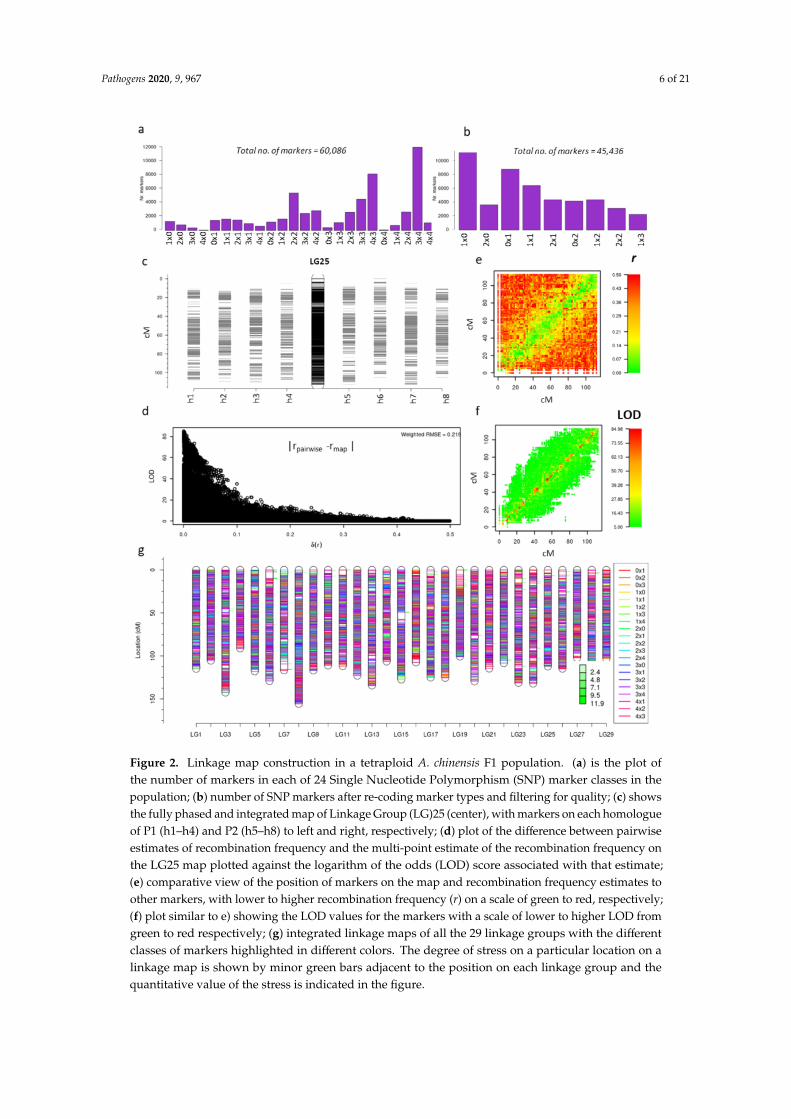
From these 60,086 SNP markers, a subset of 45,436 were further selected after applying standardquality checks (including skewness, missing values at a threshold of 0.1 and duplication in individualsand markers) in polymapR. The 24 marker types (Figure 2a) were re-coded to nine simplified segregationtypes (1 × 0, 2 × 0, 0 × 1, 1 × 1, 2 × 1, 0 × 2, 1 × 2, 2 × 2, 1 × 3) (Figure 2b). For example, a marker whichsegregates as ‘0 × 1’ will segregate similarly to a marker with a segregation type of ‘3 × 4’. A figuredepicting conversion of 4 possible simplex × nulliplex marker types (1 × 0, 1 × 4, 3 × 0 and 3 × 4)to a simpler segregation type (1 × 0) is presented in Figure S4. Initial construction of the expected116 homologues (29 chromosomes × 4 homologues) was achieved using 19,563 homologue-specificsimplex × nulliplex segregation types, including the re-coded marker types and consisted of 11,441 and8122 markers for the P1 (1 × 0) and P2 (0 × 1) parents, respectively. A total of 4215 duplex × nulliplex(2 × 0, 0 × 2) and 4035 simplex × simplex (1 × 1) markers (Figure 2b) were then included to bridge thehomologues of each linkage group (LG) from each parent. Finally, more complex allelic segregationtypes, such as simplex× triplex (1× 3) (1514), simplex× duplex (1× 2, 2× 1) (4663) and duplex× duplex(2 × 2) (953) markers (Figure 2a) were added to improve the marker density of the maps and calculatethe phase of each homologue.
The sex locus for kiwifruit is located on chromosome 25 [43,44], making this one of the chromosomesof particular interest (Figure 2c). We calculated the goodness-of-fit measure of the linkage maps bycomparing multi-point estimates of pairwise recombination frequency from the genetic map, with thetwo-point estimates of recombination frequency. The weighted root mean square of the differencebetween these two estimates showed an inverse relationship with the logarithm of the odds (LOD) scores(Figure 2d). Where the difference between the expected and estimated recombination frequency washigh, the LOD values were low (Figure 2d), indicating that the overall map quality was good. Figure 2eshows a plot of the position of markers on LG25 versus the estimate of recombination frequency withall other markers, demonstrating that tightly linked markers exhibit lower recombination frequency atthe diagonal, depicted in green. Hence the estimated LOD score from the adjacent markers on the mapwould also be high, as represented by the red color in Figure 2f.
All 29 framework LG maps are depicted in Figure 2g, where each of the maps represents theintegrated map derived from the phased maps of eight homologues, four from each parent. A total of39,322 markers were assigned across the LGs, making this one of the highest-density linkage mapspublished for a polyploid species. The map lengths ranged from minimum 91 cM to maximum 143 cM,with a mean length of 115.5 cM. Genetic maps of LGs between 125 and 250 cM have been observedin various diploid, tetraploid and hexaploid species [45,46], with higher values often indicative ofpoor data quality or high map stress. Overall, the LG map lengths from this study indicate that ahigh-quality genetic map has been constructed.
Pathogens 2020, 9, 967 6 of 21
Figure 2. Linkage map construction in a tetraploid A. chinensis F1 population. (a) is the plot ofthe number of markers in each of 24 Single Nucleotide Polymorphism (SNP) marker classes in thepopulation; (b) number of SNP markers after re-coding marker types and filtering for quality; (c) showsthe fully phased and integrated map of Linkage Group (LG)25 (center), with markers on each homologueof P1 (h1–h4) and P2 (h5–h8) to left and right, respectively; (d) plot of the difference between pairwiseestimates of recombination frequency and the multi-point estimate of the recombination frequency onthe LG25 map plotted against the logarithm of the odds (LOD) score associated with that estimate;(e) comparative view of the position of markers on the map and recombination frequency estimates toother markers, with lower to higher recombination frequency (r) on a scale of green to red, respectively;(f) plot similar to e) showing the LOD values for the markers with a scale of lower to higher LOD fromgreen to red respectively; (g) integrated linkage maps of all the 29 linkage groups with the differentclasses of markers highlighted in different colors. The degree of stress on a particular location on alinkage map is shown by minor green bars adjacent to the position on each linkage group and thequantitative value of the stress is indicated in the figure.
Pathogens 2020, 9, 967 7 of 21
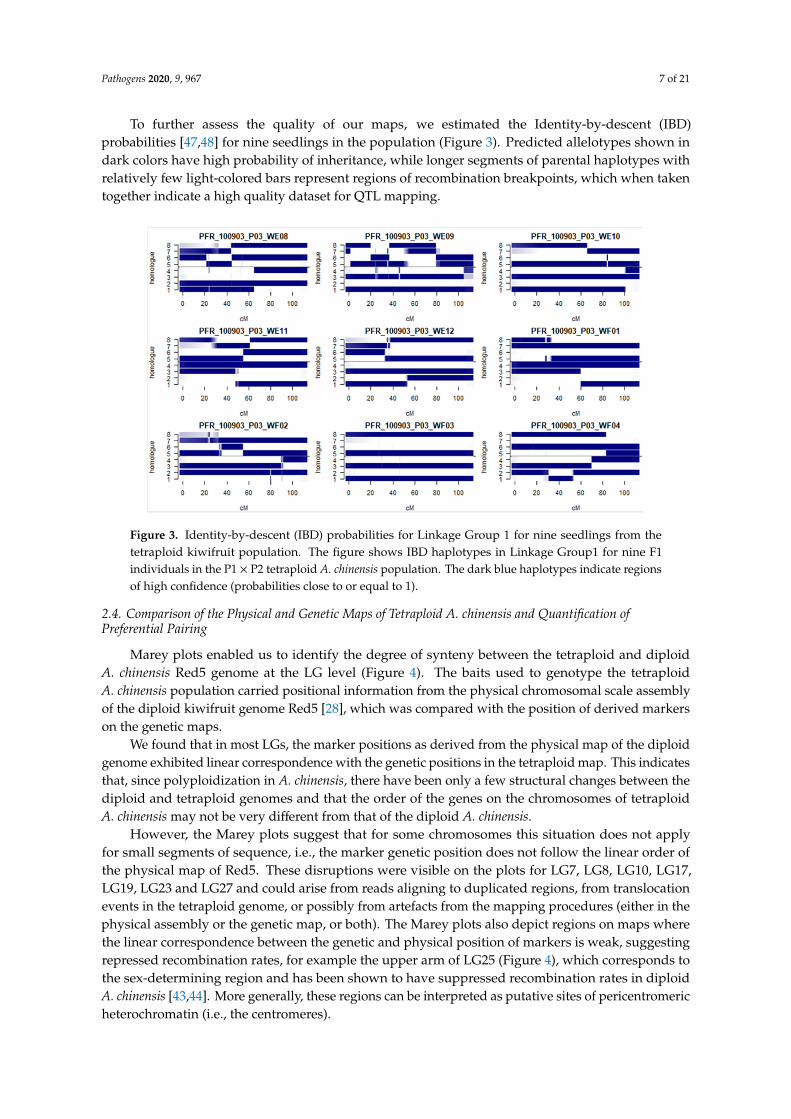
To further assess the quality of our maps, we estimated the Identity-by-descent (IBD)probabilities [47,48] for nine seedlings in the population (Figure 3). Predicted allelotypes shown indark colors have high probability of inheritance, while longer segments of parental haplotypes withrelatively few light-colored bars represent regions of recombination breakpoints, which when takentogether indicate a high quality dataset for QTL mapping.
Figure 3. Identity-by-descent (IBD) probabilities for Linkage Group 1 for nine seedlings from thetetraploid kiwifruit population. The figure shows IBD haplotypes in Linkage Group1 for nine F1individuals in the P1 × P2 tetraploid A. chinensis population. The dark blue haplotypes indicate regionsof high confidence (probabilities close to or equal to 1).
2.4. Comparison of the Physical and Genetic Maps of Tetraploid A. chinensis and Quantification ofPreferential Pairing
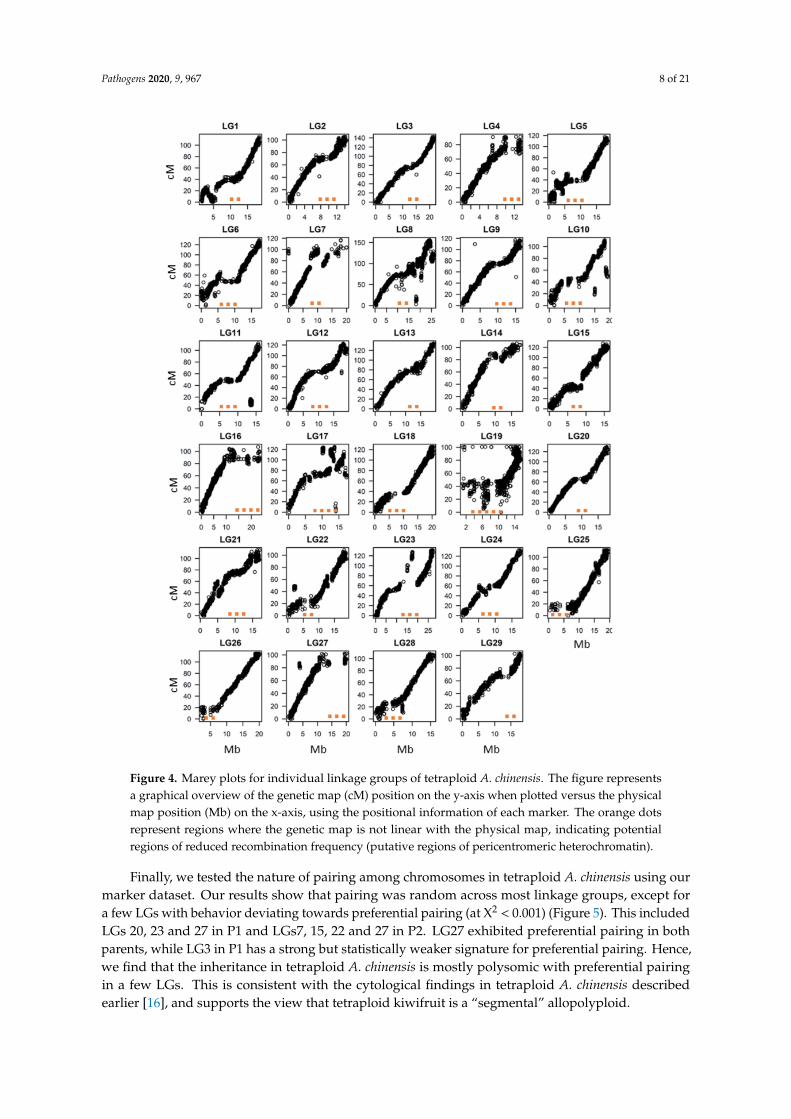
Marey plots enabled us to identify the degree of synteny between the tetraploid and diploidA. chinensis Red5 genome at the LG level (Figure 4). The baits used to genotype the tetraploidA. chinensis population carried positional information from the physical chromosomal scale assemblyof the diploid kiwifruit genome Red5 [28], which was compared with the position of derived markerson the genetic maps.
We found that in most LGs, the marker positions as derived from the physical map of the diploidgenome exhibited linear correspondence with the genetic positions in the tetraploid map. This indicatesthat, since polyploidization in A. chinensis, there have been only a few structural changes between thediploid and tetraploid genomes and that the order of the genes on the chromosomes of tetraploidA. chinensis may not be very different from that of the diploid A. chinensis.
However, the Marey plots suggest that for some chromosomes this situation does not applyfor small segments of sequence, i.e., the marker genetic position does not follow the linear order ofthe physical map of Red5. These disruptions were visible on the plots for LG7, LG8, LG10, LG17,LG19, LG23 and LG27 and could arise from reads aligning to duplicated regions, from translocationevents in the tetraploid genome, or possibly from artefacts from the mapping procedures (either in thephysical assembly or the genetic map, or both). The Marey plots also depict regions on maps wherethe linear correspondence between the genetic and physical position of markers is weak, suggestingrepressed recombination rates, for example the upper arm of LG25 (Figure 4), which corresponds tothe sex-determining region and has been shown to have suppressed recombination rates in diploidA. chinensis [43,44]. More generally, these regions can be interpreted as putative sites of pericentromericheterochromatin (i.e., the centromeres).
Pathogens 2020, 9, 967 8 of 21
Figure 4. Marey plots for individual linkage groups of tetraploid A. chinensis. The figure representsa graphical overview of the genetic map (cM) position on the y-axis when plotted versus the physicalmap position (Mb) on the x-axis, using the positional information of each marker. The orange dotsrepresent regions where the genetic map is not linear with the physical map, indicating potentialregions of reduced recombination frequency (putative regions of pericentromeric heterochromatin).
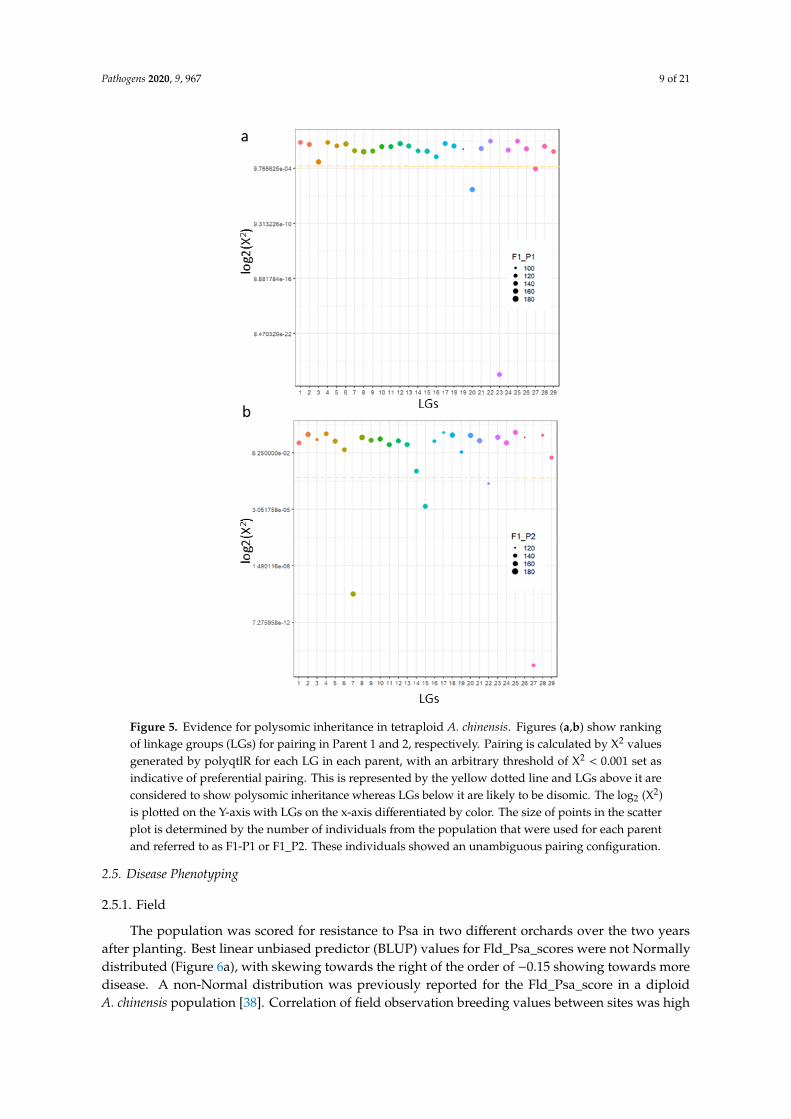
Finally, we tested the nature of pairing among chromosomes in tetraploid A. chinensis using ourmarker dataset. Our results show that pairing was random across most linkage groups, except fora few LGs with behavior deviating towards preferential pairing (at X2 < 0.001) (Figure 5). This includedLGs 20, 23 and 27 in P1 and LGs7, 15, 22 and 27 in P2. LG27 exhibited preferential pairing in bothparents, while LG3 in P1 has a strong but statistically weaker signature for preferential pairing. Hence,we find that the inheritance in tetraploid A. chinensis is mostly polysomic with preferential pairingin a few LGs. This is consistent with the cytological findings in tetraploid A. chinensis describedearlier [16], and supports the view that tetraploid kiwifruit is a “segmental” allopolyploid.
Pathogens 2020, 9, 967 9 of 21
Figure 5. Evidence for polysomic inheritance in tetraploid A. chinensis. Figures (a,b) show rankingof linkage groups (LGs) for pairing in Parent 1 and 2, respectively. Pairing is calculated by X2 valuesgenerated by polyqtlR for each LG in each parent, with an arbitrary threshold of X2 < 0.001 set asindicative of preferential pairing. This is represented by the yellow dotted line and LGs above it areconsidered to show polysomic inheritance whereas LGs below it are likely to be disomic. The log2 (X2)is plotted on the Y-axis with LGs on the x-axis differentiated by color. The size of points in the scatterplot is determined by the number of individuals from the population that were used for each parentand referred to as F1-P1 or F1_P2. These individuals showed an unambiguous pairing configuration.
2.5. Disease Phenotyping
2.5.1. Field
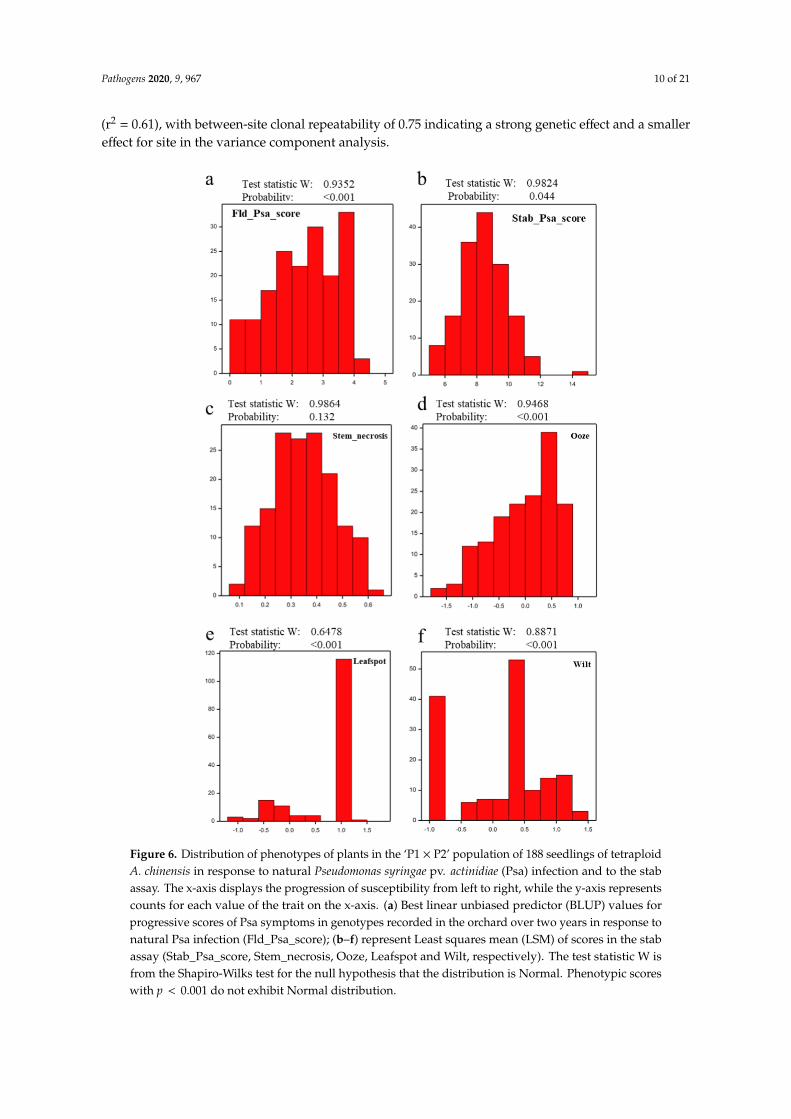
The population was scored for resistance to Psa in two different orchards over the two yearsafter planting. Best linear unbiased predictor (BLUP) values for Fld_Psa_scores were not Normallydistributed (Figure 6a), with skewing towards the right of the order of −0.15 showing towards moredisease. A non-Normal distribution was previously reported for the Fld_Psa_score in a diploidA. chinensis population [38]. Correlation of field observation breeding values between sites was high
Pathogens 2020, 9, 967 10 of 21
(r2 = 0.61), with between-site clonal repeatability of 0.75 indicating a strong genetic effect and a smallereffect for site in the variance component analysis.
Figure 6. Distribution of phenotypes of plants in the ‘P1 × P2’ population of 188 seedlings of tetraploidA. chinensis in response to natural Pseudomonas syringae pv. actinidiae (Psa) infection and to the stabassay. The x-axis displays the progression of susceptibility from left to right, while the y-axis representscounts for each value of the trait on the x-axis. (a) Best linear unbiased predictor (BLUP) values forprogressive scores of Psa symptoms in genotypes recorded in the orchard over two years in response tonatural Psa infection (Fld_Psa_score); (b–f) represent Least squares mean (LSM) of scores in the stabassay (Stab_Psa_score, Stem_necrosis, Ooze, Leafspot and Wilt, respectively). The test statistic W isfrom the Shapiro-Wilks test for the null hypothesis that the distribution is Normal. Phenotypic scoreswith p < 0.001 do not exhibit Normal distribution.
Pathogens 2020, 9, 967 11 of 21
2.5.2. Stab Assay
Evaluation of five clonal replicates of each individual genotype in the population for Psatolerance under greenhouse conditions inoculated using the stab assay revealed four key phenotypescharacterizing the response to Psa infection. These included Psa-induced stem necrosis, ooze, wilt,and leaf spot, as well as a combined Psa score for each seedling in the population, calculationsbased on all four phenotypes. The distribution of Stab_Psa_score and Stem_necrosis across thepopulation was Normal, whilst data for ooze, wilt and leaf spot were distributed in a non-Normalmanner (Figure 6b–f). Normal distribution of the Stab_Psa_score was previously reported in a diploidA. chinensis population [38]. The analysis showed that greenhouse inoculation results are highlydependent on time of inoculation, similar to the earlier results for the diploid population [38], with clonalrepeatabilities substantially lower than field repeatabilities. The best inoculated repeatability valueswere found for the sets inoculated in June (0.5) (winter) and the lowest for the sets inoculated in January(0.3) (summer).
Correlation between the greenhouse stab inoculation scores and combined field scores were poor(r2 = 0.04), indicating that the variables and responses measured in the greenhouse and field weredifferent and that the ranking for the greenhouse inoculation set was a poor predictor of the fieldobservations. Broad sense heritability values for greenhouse disease ratings calculated from seedlingmeans were lower (0.0 to 0.51) and more variable than for the field observations. This finding wasprobably due to the large random effect found for inoculation time (owing to space limitations, highertemperatures in summer [49] and developmental differences, not all seedlings were inoculated at thesame time of the year).
2.6. QTL Mapping
2.6.1. Sex Locus
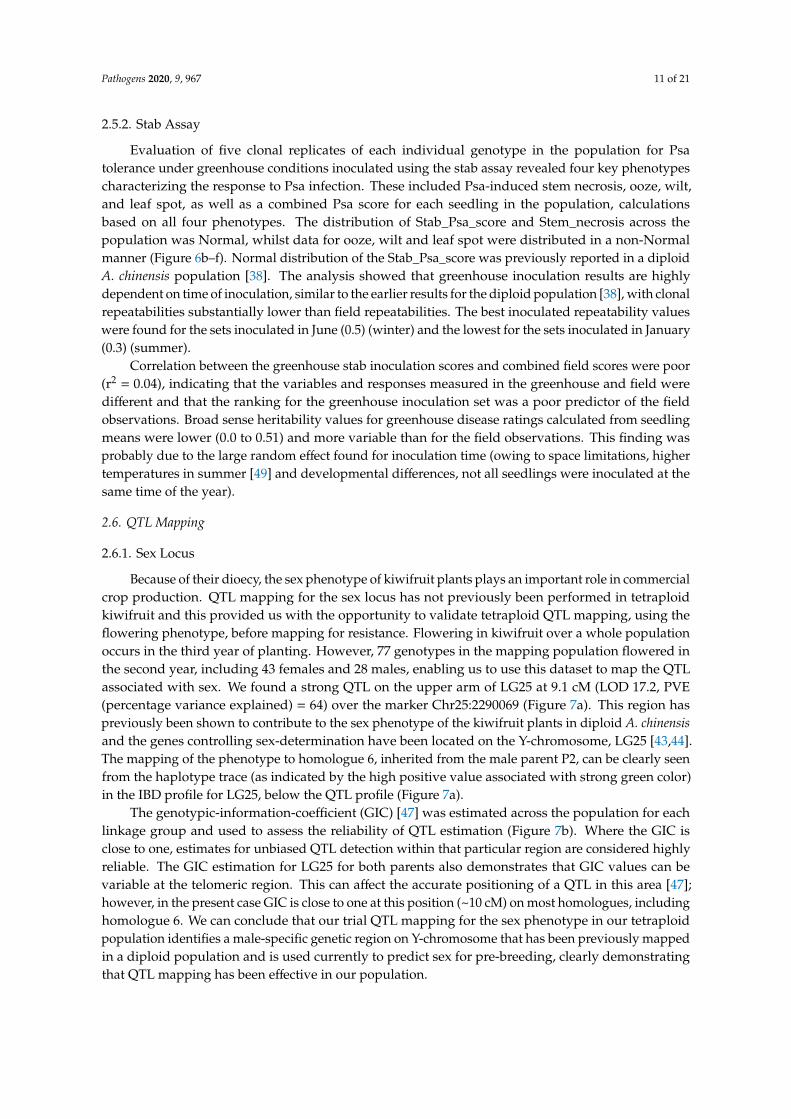
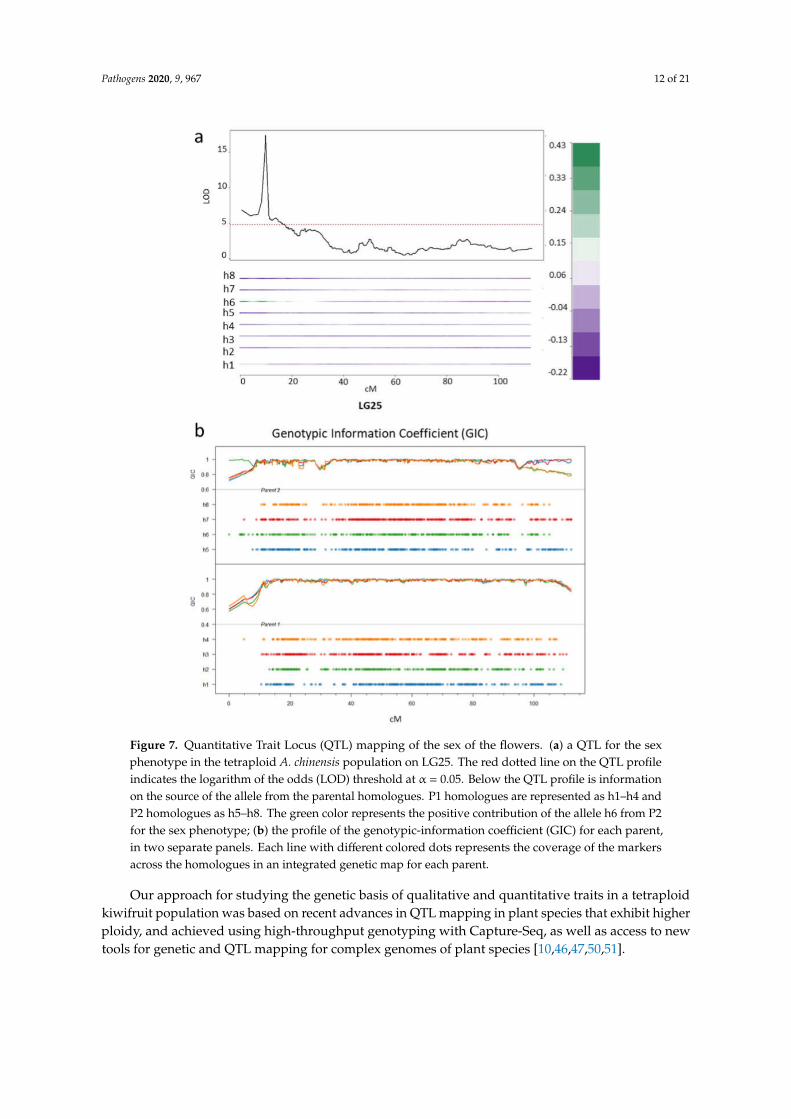
Because of their dioecy, the sex phenotype of kiwifruit plants plays an important role in commercialcrop production. QTL mapping for the sex locus has not previously been performed in tetraploidkiwifruit and this provided us with the opportunity to validate tetraploid QTL mapping, using theflowering phenotype, before mapping for resistance. Flowering in kiwifruit over a whole populationoccurs in the third year of planting. However, 77 genotypes in the mapping population flowered inthe second year, including 43 females and 28 males, enabling us to use this dataset to map the QTLassociated with sex. We found a strong QTL on the upper arm of LG25 at 9.1 cM (LOD 17.2, PVE(percentage variance explained) = 64) over the marker Chr25:2290069 (Figure 7a). This region haspreviously been shown to contribute to the sex phenotype of the kiwifruit plants in diploid A. chinensisand the genes controlling sex-determination have been located on the Y-chromosome, LG25 [43,44].The mapping of the phenotype to homologue 6, inherited from the male parent P2, can be clearly seenfrom the haplotype trace (as indicated by the high positive value associated with strong green color)in the IBD profile for LG25, below the QTL profile (Figure 7a).
The genotypic-information-coefficient (GIC) [47] was estimated across the population for eachlinkage group and used to assess the reliability of QTL estimation (Figure 7b). Where the GIC isclose to one, estimates for unbiased QTL detection within that particular region are considered highlyreliable. The GIC estimation for LG25 for both parents also demonstrates that GIC values can bevariable at the telomeric region. This can affect the accurate positioning of a QTL in this area [47];however, in the present case GIC is close to one at this position (~10 cM) on most homologues, includinghomologue 6. We can conclude that our trial QTL mapping for the sex phenotype in our tetraploidpopulation identifies a male-specific genetic region on Y-chromosome that has been previously mappedin a diploid population and is used currently to predict sex for pre-breeding, clearly demonstratingthat QTL mapping has been effective in our population.
Pathogens 2020, 9, 967 12 of 21
Figure 7. Quantitative Trait Locus (QTL) mapping of the sex of the flowers. (a) a QTL for the sexphenotype in the tetraploid A. chinensis population on LG25. The red dotted line on the QTL profileindicates the logarithm of the odds (LOD) threshold at α = 0.05. Below the QTL profile is informationon the source of the allele from the parental homologues. P1 homologues are represented as h1–h4 andP2 homologues as h5–h8. The green color represents the positive contribution of the allele h6 from P2for the sex phenotype; (b) the profile of the genotypic-information coefficient (GIC) for each parent,in two separate panels. Each line with different colored dots represents the coverage of the markersacross the homologues in an integrated genetic map for each parent.
Our approach for studying the genetic basis of qualitative and quantitative traits in a tetraploidkiwifruit population was based on recent advances in QTL mapping in plant species that exhibit higherploidy, and achieved using high-throughput genotyping with Capture-Seq, as well as access to newtools for genetic and QTL mapping for complex genomes of plant species [10,46,47,50,51].
Pathogens 2020, 9, 967 13 of 21
2.6.2. Psa Resistance
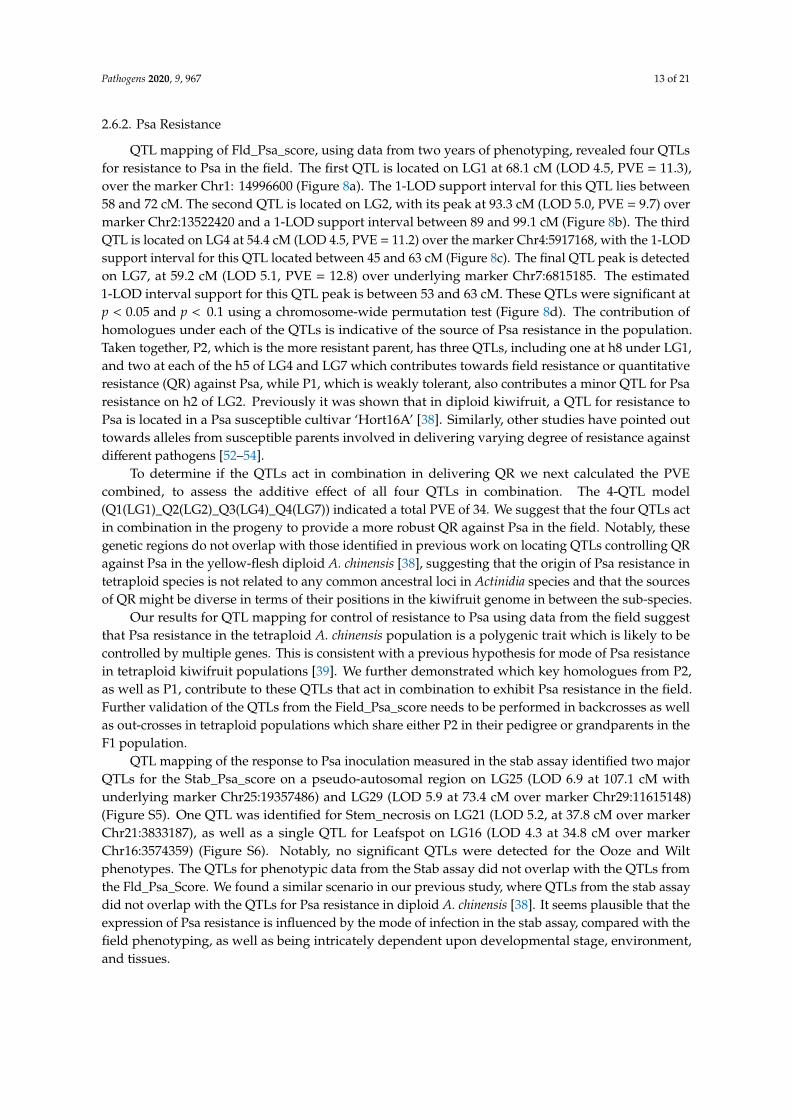
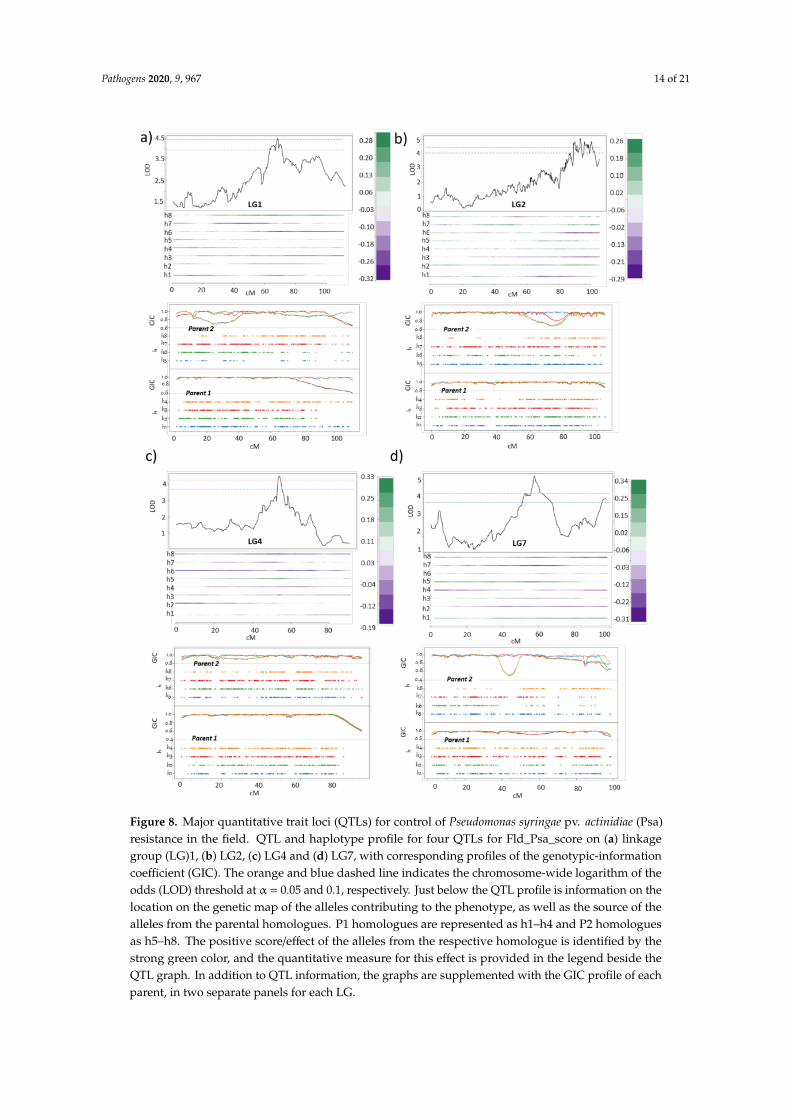
QTL mapping of Fld_Psa_score, using data from two years of phenotyping, revealed four QTLsfor resistance to Psa in the field. The first QTL is located on LG1 at 68.1 cM (LOD 4.5, PVE = 11.3),over the marker Chr1: 14996600 (Figure 8a). The 1-LOD support interval for this QTL lies between58 and 72 cM. The second QTL is located on LG2, with its peak at 93.3 cM (LOD 5.0, PVE = 9.7) overmarker Chr2:13522420 and a 1-LOD support interval between 89 and 99.1 cM (Figure 8b). The thirdQTL is located on LG4 at 54.4 cM (LOD 4.5, PVE = 11.2) over the marker Chr4:5917168, with the 1-LODsupport interval for this QTL located between 45 and 63 cM (Figure 8c). The final QTL peak is detectedon LG7, at 59.2 cM (LOD 5.1, PVE = 12.8) over underlying marker Chr7:6815185. The estimated1-LOD interval support for this QTL peak is between 53 and 63 cM. These QTLs were significant atp < 0.05 and p < 0.1 using a chromosome-wide permutation test (Figure 8d). The contribution ofhomologues under each of the QTLs is indicative of the source of Psa resistance in the population.Taken together, P2, which is the more resistant parent, has three QTLs, including one at h8 under LG1,and two at each of the h5 of LG4 and LG7 which contributes towards field resistance or quantitativeresistance (QR) against Psa, while P1, which is weakly tolerant, also contributes a minor QTL for Psaresistance on h2 of LG2. Previously it was shown that in diploid kiwifruit, a QTL for resistance toPsa is located in a Psa susceptible cultivar ‘Hort16A’ [38]. Similarly, other studies have pointed outtowards alleles from susceptible parents involved in delivering varying degree of resistance againstdifferent pathogens [52–54].
To determine if the QTLs act in combination in delivering QR we next calculated the PVEcombined, to assess the additive effect of all four QTLs in combination. The 4-QTL model(Q1(LG1)_Q2(LG2)_Q3(LG4)_Q4(LG7)) indicated a total PVE of 34. We suggest that the four QTLs actin combination in the progeny to provide a more robust QR against Psa in the field. Notably, thesegenetic regions do not overlap with those identified in previous work on locating QTLs controlling QRagainst Psa in the yellow-flesh diploid A. chinensis [38], suggesting that the origin of Psa resistance intetraploid species is not related to any common ancestral loci in Actinidia species and that the sourcesof QR might be diverse in terms of their positions in the kiwifruit genome in between the sub-species.
Our results for QTL mapping for control of resistance to Psa using data from the field suggestthat Psa resistance in the tetraploid A. chinensis population is a polygenic trait which is likely to becontrolled by multiple genes. This is consistent with a previous hypothesis for mode of Psa resistancein tetraploid kiwifruit populations [39]. We further demonstrated which key homologues from P2,as well as P1, contribute to these QTLs that act in combination to exhibit Psa resistance in the field.Further validation of the QTLs from the Field_Psa_score needs to be performed in backcrosses as wellas out-crosses in tetraploid populations which share either P2 in their pedigree or grandparents in theF1 population.
QTL mapping of the response to Psa inoculation measured in the stab assay identified two majorQTLs for the Stab_Psa_score on a pseudo-autosomal region on LG25 (LOD 6.9 at 107.1 cM withunderlying marker Chr25:19357486) and LG29 (LOD 5.9 at 73.4 cM over marker Chr29:11615148)(Figure S5). One QTL was identified for Stem_necrosis on LG21 (LOD 5.2, at 37.8 cM over markerChr21:3833187), as well as a single QTL for Leafspot on LG16 (LOD 4.3 at 34.8 cM over markerChr16:3574359) (Figure S6). Notably, no significant QTLs were detected for the Ooze and Wiltphenotypes. The QTLs for phenotypic data from the Stab assay did not overlap with the QTLs fromthe Fld_Psa_Score. We found a similar scenario in our previous study, where QTLs from the stab assaydid not overlap with the QTLs for Psa resistance in diploid A. chinensis [38]. It seems plausible that theexpression of Psa resistance is influenced by the mode of infection in the stab assay, compared with thefield phenotyping, as well as being intricately dependent upon developmental stage, environment,and tissues.
Pathogens 2020, 9, 967 14 of 21
Figure 8. Major quantitative trait loci (QTLs) for control of Pseudomonas syringae pv. actinidiae (Psa)resistance in the field. QTL and haplotype profile for four QTLs for Fld_Psa_score on (a) linkagegroup (LG)1, (b) LG2, (c) LG4 and (d) LG7, with corresponding profiles of the genotypic-informationcoefficient (GIC). The orange and blue dashed line indicates the chromosome-wide logarithm of theodds (LOD) threshold at α = 0.05 and 0.1, respectively. Just below the QTL profile is information on thelocation on the genetic map of the alleles contributing to the phenotype, as well as the source of thealleles from the parental homologues. P1 homologues are represented as h1–h4 and P2 homologuesas h5–h8. The positive score/effect of the alleles from the respective homologue is identified by thestrong green color, and the quantitative measure for this effect is provided in the legend beside theQTL graph. In addition to QTL information, the graphs are supplemented with the GIC profile of eachparent, in two separate panels for each LG.
Pathogens 2020, 9, 967 15 of 21
2.7. Candidate Genes for Control of Field Psa Tolerance Underlying the QTLs
The genes determining the QTLs identified using the Fld_Psa_score phenotype are expectedto play an important role in determining the genetic basis of control of Psa resistance in tetraploidA. chinensis. Our search among the gene models in the diploid Red5 genome, underlying the geneticmarkers flanking the four major QTLs yielded genes related to signaling, transporter, and variousother functions related to carbohydrate metabolism, transcription and stress tolerance. Table S1 listsall the predicted gene models identified on the diploid Red5 genome at the locations underlyingthe four QTLs. From these we have highlighted a few, most of which are associated with plantimmunity, including Acc00939.1 (Proline-rich receptor-like protein kinase PERK9-like), Acc00941.1 andAcc00956.1 (Receptor-like serine/threonine-protein kinase ALE2) as well as Acc00949.1 (Wall-associatedreceptor kinase-like) at LG1; and Acc04873.1 (WD and tetratricopeptide repeats-like), and Acc04875.1(Serine/threonine-protein kinase-like) Acc04916.1 (Sugar transport protein 5) on LG4. Five genes areannotated on LG2 with putative functions associated with plant immunity to pathogens. These includeAcc02420.1 (Glycerol-3-phosphate acyltransferase-like), Acc02421.1 (a Protease Do-like 1, chloroplastic-like),Acc02426.1 (Serine/threonine-protein kinase-like), Acc02438.1 (High affinity nitrate transporter-like) andAcc02443.1 (Mitogen-activated protein kinase 3-like). A further five genes involved in plant-pathogeninteraction were identified under the QTL on LG7, including Acc07849.1 (Transmembrane proteinadipocyte-associated 1-like), Acc07852.1, Acc07869.1 and Acc07861.1 (Serine/threonine-protein kinaseEDR1-like) and Acc07858.1 (WD repeat-containing protein 48-like).
Overall, our results indicate that most genes underlying QTLs for control of resistance to Psa intetraploid A. chinensis belong to a gene network that encodes proteins which have putative functionsin membrane and intracellular signaling, such as receptor-like (RL) serine/threonine kinases and aniontransporters, as well as putative enzyme functions. There seems to be functional commonality inthe genes that underlie the QTLs identified for Psa resistance in the field in both diploid [38] andtetraploid A. chinensis; for example, the gene family that encodes RL kinases. RL kinases are known toplay a significant role in plant immunity, especially early pathogen recognition and activation of plantdefense [55–58]. The mechanistic basis of resistance for the two sub-species may rely on combinatorialaction of defense proteins providing strong surveillance for pathogen-associated molecular patterns(PAMPs) and activation of signaling cascade for PAMPS-triggered immunity [59]. Our findingspinpoint gene families, genetic regions and mechanisms underlying resistance to Psa in diploid [38]and tetraploid yellow-fleshed Actinidia species.
3. Materials and Methods
3.1. Plant Material
The F1 population for genetic mapping of resistance to Psa was developed from a cross between amoderately Psa-tolerant female ‘P1’ and a highly resistant male ‘P2’. The designations and a pedigreeare provided for these parents in Figure S7. A total of 235 F1 genotypes were germinated asepticallyin 2017, under standard tissue culture growth conditions. Each seedling was replicated 15 times bycuttings, either using tissue culture, or under standard greenhouse conditions, prior to phenotyping inthe field, or with stab bioassays. A set of 235 seedlings with five clonal replicates each was planted inthe Plant & Food Research orchard in Te Puke (Bay of Plenty, New Zealand, −37◦ S and 176◦ E) and asimilarly replicated set of the same seedling was planted in the Plant & Food Research orchard in Kerikeri(Bay of Islands, New Zealand, −35◦ S and 173◦ E) in a randomized block design in 2018. Both locations,Te Puke and Kerikeri, are located within the main kiwifruit-growing regions of New Zealand andare affected by natural infections of Psa (Kiwifruit Vine Health: https://www.kvh.org.nz/maps_stats).The mapping population was maintained under standard orchard conditions, without any control forPsa infection, in both research orchards for two years. All the seedlings which were replicated for thefield trial were also replicated five times for the stab assay. Plants were grown up to 1 m in height inpots in the greenhouse and then subjected to the stab assay in batches, as described previously [38,60].
Pathogens 2020, 9, 967 16 of 21
3.2. Phenotyping
The field population was assessed for symptoms in response to natural Psa infection between2018 and 2020. Traits scored included cane death, ooze, shoot death and tip death. A cumulative Psascore (Psa_score_Field) was calculated after two years, as described previously [38]. Least SquareMeans (LSMs) were calculated for this score for each genotype and BLUPs were estimated.
The stab bioassays were performed as described previously [38,60], in standard greenhouseconditions between September to December (spring) and February to April (summer) for two yearsunder standard greenhouse facilities at Plant & Food Research Ruakura, Hamilton. Inoculationswere performed with the Strain 10627of Psa biovar 3 [61], in the greenhouse at temperatures rangingbetween 22 and 30 ◦C. The flowering data for the population were obtained in 2019.
3.3. Genotyping, Genetic Map Construction and QTL Mapping
DNA was extracted from freeze-dried leaves using the Cetyl trimethylammonium bromide(CTAB) method [62] and ~1 µg of DNA was provided to Rapid Genomics LLC, Gainesville, Floridafor Capture-sequencing. The DNA library preparation and capture enrichment were done by RapidGenomics LLC). They designed approximately 10,000 baits in the Red5 genome [28] to capture geneticvariations, targeting putative SNPs, using high throughput Illumina® sequencing, which generated150-bp paired-end reads. Raw reads were assessed for quality using FASTQC (https://github.com/s-andrews/FastQC) and trimmed using Trimmomatic [63]. Reads were aligned to the Red5 genomeusing Bwa-MEM [64] and Samtools [65].
On-target statistics were generated using TargQC (https://pypi.org/project/targqc/): mean readcounts 3.75 × 10⁶, mean mapping rate of 98% and a padded (i.e., ±200 base padding) on-target mean of68%. Target coverage depth was estimated using bedtools; the mean across all baits for each individualwas estimated. Variant calling and genotyping were performed using Freebayes-1.1.0 (command“ -p 4 -C 5 -k –report-genotype-likelihood-max –min-mapping-quality 30 –min-base-quality 20 ” asdescribed [66].
SNP calling was undertaken against the A. chinensis Red5 genome (1.69.0) [28]. The VariantCall File file for SNP dataset was analyzed using vcfR [67] to extract total, alternate and referenceallele counts with a minimum read depth of 60, to filter out low-quality SNPs. Kinship relatedness,Minor Allele Frequency (MAF) and Principal Components Analysis (PCA) plots were calculatedand constructed using the KGD software [68]. Dosage estimates were performed using an empiricalBayesian approach for dosage genotyping in offspring (Updog software, “normal model”) (command“ ## Remove SNPs with mean read-depth below some value: meandepth <- rowMeans(DP,na.rm = TRUE), mindepth <- 60, mean(meandepth < mindepth), DP <- DP[meandepth >= mindepth, ],RO <- RO[meandepth >= mindepth, ], ## Fit updog using reference and total matrices:parallel::detectCores() ## max number of cores to use, mout <- multidog(refmat = RO, sizemat = DP,ploidy = 4, model = "norm", nc = 6) ”) [69]. SNPs were further filtered for quality, allele bias,over-dispersion and sequencing errors using UpDog software (command “filter_snp (mout, bias > 0.5& bias < 2 & seq < 0.01 & od < 0.02)”).
Linkage mapping analysis and phase calculation were performed using polymapR [33] (1.1.0),which further filtered the dataset for high quality SNPs (qall_mult > 0 using function checkF1). Linkagemaps were built chromosome by chromosome, owing to the high number of genetic markers andlinkage groups and the amount of computing required. Once generated, the individual LinkageGroup (LG) phased maps were merged for QTL mapping using polyqtlR [40]. This software performsQTL mapping in the F1 populations of outcrossing, heterozygous polyploid species and relies onidentity-by-descent (IBD) probabilities to perform interval mapping, following the approach proposedby Kempthorne [70] and later developed by Hackett [71,72]. The software was made available to thisproject by Peter Bourke and will soon be available through the Comprehensive R Archive Network(CRAN: https://cran.r-project.org/). Preferential pairing among LGs was calculated using the IBDestimation function polyOrigin, which is part of the polyqtlR package, using the default function
Pathogens 2020, 9, 967 17 of 21
test_prefpairing. Percentage variance explained by each QTL and the combined model was calculatedusing the PVE function in polyqtlR. Owing to the large number of LGs and high density of markers,LOD thresholds were calculated for each LG separately, using a permutation test (1000 permutations,at α <0.01 and <0.05). Genes underlying the QTLs were identified from the in-house kiwifruit genemodel database for the diploid Red5 genome version 1.69.0 [28]. The positions for the genomic regionswere derived from the location information present within each marker.
4. Conclusions
Our study has demonstrated the application of capture-sequencing to generate a high densitySNP-based linkage map in a heterozygous polyploid fruit crop. This is the first study to report thegenetic maps of a polyploid Actinidia species. The data showed that the tetraploid kiwifruit A. chinensisexhibits polysomic inheritance for most LGs, as well as disomic inheritance for several LGs, fulfillingthe characteristics of a ‘segmental’ allopolyploid. IBD-based QTL mapping for control of the responseto Psa infection in two different field sites enabled us to map four QTLs for control of Psa resistance inthe field in this population, identify the alleles on parental homologues and the additive effect exhibitedin the variance. The candidate genes underlying the QTLs will further be explored to develop anunderstanding of their roles in strong quantitative basal resistance in kiwifruit, and this may assist inthe development of high-throughput genetic markers. Our study will help advance the developmentof marker assisted selection of tetraploid yellow-fleshed Psa-resistant kiwifruit seedlings, followingvalidation of the QTLs. The findings from the stab assay further inform us that the quantitative natureof this trait is affected by a complex of genetic, environmental and developmental factors, as well asthe method of inoculation and the phenotypes scored for QTL mapping.
Supplementary Materials: The following are available online at http://www.mdpi.com/2076-0817/9/11/967/s1,Figure S1: Bait density across Red5 chromosomes. (a) shows number of baits designed on each chromosome and(b) shows density of baits over the physical distance for each of the chromosome, Figure S2: PCA plot for thegenetic dataset of the population. Parents of the population are in purple (P1) and red (P2) circles with a singlesample of low call rate. High-quality F1 individuals are within the green circle. Clustering of outliers from theF1 population can be seen in the blue circle whereas F1 samples with low quality are highlighted in the yellow.,Figure S3: Minor Allele Frequency of the variants in the population. The plot shows Minor Allele Frequency (MAF)of the SNPs exhibited in the population, Figure S4: Marker dosage conversion in a tetraploid. A. For a tetraploid,5 different marker dosages classes are possible (or say ploidy +1) for a bi-allelic marker which originates from thecounts of alternate allele (a) in green and reference allele (A) in red. The types of genotype dosages from 0 (1st classfor the A allele) to dosage 4 (5th class for the A allele) are presented. B. The re-coding of markers is an importantprocess in defining the segregation type. Here the four different possible scenarios are presented to understand themarkers with simplex (1) × nulliplex (0) segregation type. Different marker dosage classes in each segregation type(1 × 0, 1 × 4, 3 × 0 and 3 × 4), are converted to the most obvious or simplest form of their segregation behaviour inthe population, 1 × 0, Figure S5: QTLs for control of the Stab_Psa_score in the population infected with Psa in thestab assay. Plots show the profile of two Quantitative Trait Loci (QTLs) for the Stab_Psa_score phenotype in thetetraploid A. chinensis population. The red dotted line on the QTL profile indicates the LOD threshold at alpha 0.05.Below the QTL profile is information on the source of the allele from the parental homologues. P1 homologuesare represented as h1–h4 and P2 homologues as h5–h8. Green represents the positive contribution of the alleleh1 from P1 on LG25 and the alleles from h4 and h8 from P1 and P2 respectively, on LG29, Figure S6: QTLs forthe control of Stem necrosis and Leafspot in the population infected with Psa in the stab assay. Plots show theprofile of two Quantitative Trait Loci (QTLs) for the Stem necrosis phenotype on LG21 and Leafspot on LG 16 inthe tetraploid A. chinensis population. The red dotted line on the QTL profile indicates LOD threshold at α 0.05.Below the QTL profile is information on the source of the allele in the parental homologues. P1 homologues arerepresented as h1–h4 and P2 homologues as h5–h8. Green represents the positive contribution of the allele fromh2 and h4 from P1 on LG21 for the control of Stem_necrosis and the alleles from h5 from P2 on LG16 for Leafspot.Figure S7. Designations and pedigree of the parents. The pedigree shows designation of each parent, sex andthe names of grand parents and great grand parents. The origin of the great grand parents is from a cross thatwas performed between the accessions imported from China, Table S1. List of annotated gene models under theQTLs. The raw read files for Capture-seq data in all genotypes are divided into two sub-datasets i.e., R1 andR2 reads and is submitted in a public repository https://zenodo.org. The DOI for file “Rawreads_R1.fastq.gz” is10.5281/zenodo.4285666 and DOI for the file “Rawreads_R2.fastq.gz” is 10.5281/zenodo.4287637.
Pathogens 2020, 9, 967 18 of 21
Author Contributions: Conceptualization, S.E.G., D.C., L.G. and J.T.; Methodology, L.G., D.C., S.H., S.T., M.L.,E.M., K.F., K.H., J.M., A.W., S.E.G., and J.T.; Software, P.M.B., S.T., J.M., J.T.; Validation, L.G., D.H., and C.M.;Formal Analysis, L.G., D.H., P.M.B. and J.T.; Investigation, S.H., L.G., J.T.; Resources, C.B., K.F., E.M., K.H.;Data Curation, S.T. and J.T.; Writing—Original Draft Preparation, J.T., D.C., S.E.G.; Writing—Review & Editing.All authors contributed. All authors have read and agreed to the published version of the manuscript.
Funding: We acknowledge AgMARDT New Zealand for a post-doctoral fellowship to J.T. and funding the work.Financial support was also provided by The New Zealand Institute for Plant and Food Research Limited’s(1) Strategic Science Investment Funding for ‘Breeding Technology Development’, (2) Kiwifruit BreedingProgramme, and (3) Kiwifruit Royalty Investment Programme project ‘Phenotyping Bioassays’. The workof P.B. was funded through the TKI top-sector project “Novel genetic and genomic tools for polyploid crops”(project numbers BO-26.03-009-004 and BO-50-002-022).
Acknowledgments: We acknowledge the help of David Gerard, Department of Mathematics and Statistics,American University, Washington in assisting us in using the UpDog software for dosage estimates. We also wantto acknowledge Brian J. Knaus, Department of Botany and Plant Pathology, Oregon State University for assistancein using the vcfR package. We acknowledge the assistance of Belinda Diepenheim and Andrew Mullan, Plant &Food Research, in the preparation of the population for replication.
Conflicts of Interest: The authors declare no conflict of interest. The funders had no role in the design of the study;in the collection, analyses, or interpretation of data; in the writing of the manuscript; or in the decision to publishthe results.
References
1. Bretagnolle, F.; Thompson, J.D. Gametes with the Somatic Chromosome Number: Mechanisms of TheirFormation and Role in the Evolution of Autopolyploid Plants. New Phytol. 1995, 129, 1–22. [CrossRef]
2. Ramsey, J.; Schemske, D.W. Pathways, Mechanisms and Rates of Polyploid Formation in Flowering Plants.Annu. Rev. Ecol. Syst. 1998, 29, 467–501. [CrossRef]
3. Otto, S.P.; Whitton, J. Polyploid Incidence and Evolution. Annu. Rev. Genet. 2000, 34, 401–437. [CrossRef] [PubMed]4. Masterson, J. Stomatal Size in Fossil Plants: Evidence for Polyploidy in Majority of Angiosperms. Science
1994, 264, 421–424. [CrossRef] [PubMed]5. Sattler, M.C.; Carvalho, C.R.; Clarindo, W.R. The Polyploidy and Its Key Role in Plant Breeding. Planta 2016,
243, 281–296. [CrossRef]6. Martin, C.; Viruel, M.A.; Lora, J.; Hormaza, J. Polyploidy in Fruit Tree Crops of the Genus Annona (Annonaceae).
Front. Plant Sci. 2019, 10. [CrossRef]7. Osabe, K.; Kawanabe, T.; Sasaki, T.; Ishikawa, R.; Okazaki, K.; Dennis, L.; Kazama, T.; Fujimoto, R.
Multiple Mechanisms and Challenges for the Application of Allopolyploidy in Plants. Int. J. Mol. Sci. 2012,13, 8696–8721. [CrossRef]
8. Wu, R.; Gallo-Meagher, M.; Littell, R.C.; Zeng, Z.B. A General Polyploid Model for Analyzing GeneSegregation in Outcrossing Tetraploid Species. Genetics 2001, 159, 869–882.
9. Cao, D.; Osborn, T.C.; Doerge, R.W. Correct Estimation of Preferential Chromosome Pairing in Autotetraploids.Genome Res. 2004, 14, 459–462. [CrossRef]
10. Bourke, P.M.; Arens, P.; Voorrips, R.E.; Esselink, G.D.; Koning-Boucoiran, C.F.S.; Westende, W.P.C.V.;Leonardo, T.S.; Wissink, P.; Zheng, C.; Van Geest, G.; et al. Partial Preferential Chromosome Pairing IsGenotype Dependent in Tetraploid Rose. Plant J. 2017, 90, 330–343. [CrossRef]
11. Bourke, P.M.; Voorrips, R.E.; Visser, R.G.F.; Maliepaard, C. Tools for Genetic Studies in ExperimentalPopulations of Polyploids. Front. Plant Sci. 2018, 9, 513. [CrossRef] [PubMed]
12. Comai, L. The Advantages and Disadvantages of Being Polyploid. Nat. Rev. Genet. 2005, 6, 836–846.[CrossRef] [PubMed]
13. Soltis, D.E.; Soltis, P.S.; Rieseberg, L.H. Molecular Data and the Dynamic Nature of Polyploidy. Crit. Rev.Plant Sci. 1993, 12, 243–273. [CrossRef]
14. Ramsey, J.; Schemske, D.W. Neopolyploidy in Flowering Plants. Annu. Rev. Ecol. Syst. 2002, 33, 589–639. [CrossRef]15. Mertten, D.; Tsang, G.K.; Manako, K.I.; Mcneilage, M.; Datson, P. Meiotic Chromosome Pairing in Actinidia
Chinensis Var. Deliciosa. Genetica 2012, 140, 455–462. [CrossRef]16. Wu, J.-H.; Datson, P.; Manako, K.I.; Murray, B.G. Meiotic Chromosome Pairing Behaviour of Natural Tetraploids
and Induced Autotetraploids of Actinidia Chinensis. Theor. Appl. Genet. 2014, 127, 549–557. [CrossRef]17. Atkinson, R.G.; Cipriani, G.; Whittaker, D.J.; Gardner, R.C. The Allopolyploid Origin of Kiwifruit, Actinidia
Deliciosa (Actinidiaceae). Plant Syst. Evol. 1997, 205, 111–124. [CrossRef]
Pathogens 2020, 9, 967 19 of 21
18. Stebbins, G.L. Types of Polyploids: Their Classification and Significance. In Advances in Genetics;Demerec, M., Ed.; Academic Press: Cambridge, MA, USA, 1947; pp. 403–429.
19. Szadkowski, E.; Eber, F.; Huteau, V.; Lodé, M.; Coriton, O.; Jenczewski, E.; Chèvre, A.M. Polyploid FormationPathways Have an Impact on Genetic Rearrangements in Resynthesized Brassica Napus. New Phytol. 2011,191, 884–894. [CrossRef]
20. Xu, C.; Bai, Y.; Lin, X.; Zhao, N.; Hu, L.; Gong, Z.; Wendel, J.F.; Liu, B. Genome-Wide Disruptionof Gene Expression in Allopolyploids but Not Hybrids of Rice Subspecies. Mol. Biol. Evol. 2014,31, 1066–1076. [CrossRef]
21. Madlung, A.; Wendel, J. Genetic and Epigenetic Aspects of Polyploid Evolution in Plants.Cytogenet. Genome Res. 2013, 140, 270–285. [CrossRef]
22. Mason, A.S.; Wendel, J.F. Homoeologous Exchanges, Segmental Allopolyploidy, and PolyploidGenome Evolution. Front. Genet. 2020, 11, 1014. [CrossRef] [PubMed]
23. Behling, A.H.; Shepherd, L.D.; Cox, M.P. The Importance and Prevalence of Allopolyploidy in AotearoaNew Zealand. J. R. Soc. N. Z. 2020, 50, 189–210. [CrossRef]
24. Huang, H. Kiwifruit: The Genus Actinidia; Academic Press: Cambridge, MA, USA, 2016.25. Everett, K.R.; Taylor, R.K.; Romberg, M.K.; Rees-George, J.; Fullerton, R.A.; Vanneste, J.L.; Manning, M.A.
First Report of Pseudomonas Syringae Pv. Actinidiae Causing Kiwifruit Bacterial Canker in New ZealandAustralas.Plant Dis. Notes 2011, 6, 67–71.
26. McCann, H.C.; Rikkerink, E.H.; Bertels, F.; Fiers, M.; Lu, A.; Rees-George, J.; Andersen, M.T.; Gleave, A.P.;Haubold, B.; Wohlers, M.W.; et al. Genomic Analysis of the Kiwifruit Pathogen Pseudomonas SyringaePv. Actinidiae Provides Insight into the Origins of an Emergent Plant Disease. PLoS Pathog. 2013,9, e1003503. [CrossRef]
27. Huang, S.; Ding, J.; Deng, D.; Tang, W.; Sun, H.; Liu, D.; Zhang, L.; Niu, X.; Zhang, X.; Meng, M.; et al.Draft Genome of the Kiwifruit Actinidia Chinensis. Nat. Commun. 2013, 4, 2640. [CrossRef]
28. Pilkington, S.M.; Crowhurst, R.; Hilario, E.; Nardozza, S.; Fraser, L.; Peng, Y.; Gunaseelan, K.; Simpson, R.;Tahir, J.; Deroles, S.C.; et al. A Manually Annotated Actinidia Chinensis Var. Chinensis (Kiwifruit) GenomeHighlights the Challenges Associated with Draft Genomes and Gene Prediction in Plants. BMC Genom. 2018,19, 257. [CrossRef]
29. Wu, H.; Ma, T.; Kang, M.; Ai, F.; Zhang, J.; Dong, G.; Liu, J. A High-Quality Actinidia Chinensis(Kiwifruit) Genome. Hortic. Res. 2019, 6, 117. [CrossRef]
30. Tang, W.; Sun, X.; Yue, J.; Tang, X.; Jiao, C.; Yang, Y.; Niu, X.; Miao, M.; Zhang, D.; Huang, S.; et al.Chromosome-Scale Genome Assembly of Kiwifruit Actinidia Eriantha with Single-Molecule Sequencing andChromatin Interaction Mapping. GigaScience 2019, 8. [CrossRef]
31. Negro, S.S.; Millet, E.J.; Madur, D.; Bauland, C.; Combes, V.; Welcker, C.; Tardieu, F.; Charcosset, A.;Nicolas, S.D. Genotyping-by-Sequencing and Snp-Arrays Are Complementary for Detecting QuantitativeTrait Loci by Tagging Different Haplotypes in Association Studies. BMC Plant Biol. 2019, 19, 318. [CrossRef]
32. Hackett, C.A.; Boskamp, B.; Vogogias, A.; Preedy, K.F.; Milne, I. Tetraploidsnpmap: Software for LinkageAnalysis and Qtl Mapping in Autotetraploid Populations Using Snp Dosage Data. J. Hered. 2017,108, 438–442. [CrossRef]
33. Bourke, P.M.; Van Geest, G.; Voorrips, R.E.; Jansen, J.; Kranenburg, T.; Shahin, A.; Visser, R.G.F.; Arens, P.;Smulders, M.J.M.; Maliepaard, C. Polymapr—Linkage Analysis and Genetic Map Construction from F1Populations of Outcrossing Polyploids. Bioinformatics 2018, 34, 3496–3502. [CrossRef] [PubMed]
34. Behrouzi, P.; Wit, E.C. De Novo Construction of Polyploid Linkage Maps Using Discrete Graphical Models.Bioinformatics 2018, 35, 1083–1093. [CrossRef] [PubMed]
35. Mollinari, M.; Garcia, A.A.F. Linkage Analysis and Haplotype Phasing in Experimental AutopolyploidPopulations with High Ploidy Level Using Hidden Markov Models. Genes Genomes Genet. 2019, 9, 3297–3314.[CrossRef] [PubMed]
36. Pereira, G.D.S.; Gemenet, D.C.; Mollinari, M.; Olukolu, B.A.; Wood, J.C.; Diaz, F.; Mosquera, V.;Gruneberg, W.J.; Khan, A.; Buell, C.R.; et al. Multiple QTL Mapping in Autopolyploids: A Random-EffectModel Approach with Application in a Hexaploid Sweetpotato Full-Sib Population. Genetics 2020,215, 579–595. [CrossRef]
37. Grandke, F.; Ranganathan, S.; Van Bers, N.; De Haan, J.R.; Metzler, D. Pergola: Fast and DeterministicLinkage Mapping of Polyploids. BMC Bioinform. 2017, 18, 12. [CrossRef] [PubMed]
Pathogens 2020, 9, 967 20 of 21
38. Tahir, J.; Hoyte, S.; Bassett, H.; Brendolise, C.; Chatterjee, A.; Templeton, K.; Deng, C.; Crowhurst, R.;Montefiori, M.; Morgan, E.; et al. Multiple Quantitative Trait Loci Contribute to Resistance to BacterialCanker Incited by Pseudomonas Syringae Pv. Actinidiae in Kiwifruit (Actinidia Chinensis). Hortic. Res.2019, 6, 101. [CrossRef]
39. De Silva, N.H.; Gea, L.; Lowe, R. Genetic Analysis of Resistance to Pseudomonas Syringae Pv. Actinidiae (Psa)in a Kiwifruit Progeny Test: An Application of Generalised Linear Mixed Models (GLMMs). SpringerPlus2014, 3, 547. [CrossRef]
40. Bourke, P.M. Genetic Mapping in Polyploids. Ph.D. Thesis, Wageningen University, Wageningen,The Netherlands, 2018.
41. Voorrips, R.E.; Gort, G.; Vosman, B. Genotype Calling in Tetraploid Species from Bi-Allelic Marker DataUsing Mixture Models. BMC Bioinform. 2011, 12, 172. [CrossRef] [PubMed]
42. Dufresne, F.; Stift, M.; Vergilino, R.; Mable, B.K. Recent Progress and Challenges in Population Genetics ofPolyploid Organisms: An Overview of Current State-of-the-Art Molecular and Statistical Tools. Mol. Ecol.2014, 23, 40–69. [CrossRef]
43. Akagi, T.; Pilkington, S.M.; Varkonyi-Gasic, E.; Henry, I.M.; Sugano, S.S.; Sonoda, M.; Firl, A.; Mcneilage, M.;Douglas, M.J.; Wang, T.; et al. Two Y-Chromosome-Encoded Genes Determine Sex in Kiwifruit. Nat. Plants2019, 5, 801–809. [CrossRef]
44. Pilkington, S.M.; Tahir, J.; Hilario, E.; Gardiner, S.E.; Chagné, D.; Catanach, A.; McCallum, J.; Jesson, L.;Fraser, L.; Mcneilage, M.; et al. Genetic and Cytological Analyses Reveal the Recombination Landscapeof a Partially Differentiated Plant Sex Chromosome in Kiwifruit. BMC Plant Biol. 2019, 19, 172.[CrossRef] [PubMed]
45. Latta, R.G.; Bekele, W.A.; Wight, C.P.; Tinker, N.A. Comparative Linkage Mapping of Diploid, Tetraploid, andHexaploid Avena Species Suggests Extensive Chromosome Rearrangement in Ancestral Diploids. Sci. Rep.2019, 9, 12298. [CrossRef] [PubMed]
46. Song, X.; Xu, Y.; Gao, K.; Fan, G.; Zhang, F.; Deng, C.; Dai, S.; Huang, H.; Xin, H.; Li, Y. High-DensityGenetic Map Construction and Identification of Loci Controlling Flower-Type Traits in Chrysanthemum(Chrysanthemum ×Morifolium Ramat.). Horticult. Res. 2020, 7, 108. [CrossRef] [PubMed]
47. Bourke, P.M.; Hackett, C.A.; Voorrips, R.E.; Visser, R.G.F.; Maliepaard, C. Quantifying the Power and Precisionof QTL Analysis in Autopolyploids under Bivalent and Multivalent Genetic Models. Genes Genomes Genet.2019, 9, 2107–2122. [CrossRef] [PubMed]
48. Zheng, C.; Voorrips, R.E.; Jansen, J.; Hackett, C.A.; Ho, J.; Bink, M.C.A.M. Probabilistic Multilocus HaplotypeReconstruction in Outcrossing Tetraploids. Genetics 2016, 203, 119–131. [CrossRef] [PubMed]
49. Gao, X.; Huang, Q.; Zhao, Z.; Han, Q.; Ke, X.; Qin, H.; Huang, L. Studies on the Infection, Colonization,and Movement of Pseudomonas Syringae Pv. Actinidiae in Kiwifruit Tissues Using a GFPuv-Labeled Strain.PLoS ONE 2016, 11, e0151169.
50. Klaassen, M.T.; Bourke, P.M.; Maliepaard, C.; Trindade, L.M. Multi-Allelic QTL Analysis of Protein Contentin a Bi-Parental Population of Cultivated Tetraploid Potato. Euphytica 2019, 215, 14. [CrossRef]
51. Van Geest, G.; Bourke, P.M.; Voorrips, R.E.; Marasek-Ciolakowska, A.; Liao, Y.; Post, A.; Van Meeteren, U.;Visser, R.G.F.; Maliepaard, C.; Arens, P. An Ultra-Dense Integrated Linkage Map for HexaploidChrysanthemum Enables Multi-Allelic Qtl Analysis. Theor. Appl. Genet. 2017, 130, 2527–2541. [CrossRef]
52. Quenouille, J.; Paulhiac, E.; Moury, B.; Palloix, A. Quantitative Trait Loci from the Host Genetic BackgroundModulate the Durability of a Resistance Gene: A Rational Basis for Sustainable Resistance Breeding in Plants.Heredity 2014, 112, 579–587. [CrossRef]
53. Koch, M.F.; Parlevliet, J.E. Genetic Analysis of, and Selection for, Factors Affecting Quantitative Resistance toXanthomonas Campestris Pv. Oryzae in Rice. Euphytica 1991, 53, 235–245. [CrossRef]
54. Young, N.D. QTL Mapping and Quantitative Disease Resistance in Plants. Annu. Rev. Phytopathol. 1996, 34,479–501. [CrossRef] [PubMed]
55. Afzal, A.J.; Wood, A.J.; Lightfoot, D.A. Plant Receptor-Like Serine Threonine Kinases: Roles in Signaling andPlant Defense. Mol. Plant-Microbe Interactions 2008, 21, 507–517. [CrossRef] [PubMed]
56. Eckardt, N.A. The Plant Cell Reviews Plant Immunity: Receptor-Like Kinases, Ros-Rlk Crosstalk,Quantitative Resistance, and the Growth/Defense Trade-Off. Plant Cell 2017, 29, 601–602. [CrossRef] [PubMed]
57. Greeff, C.C.; Roux, M.; Mundy, J.; Petersen, M. Receptor-Like Kinase Complexes in Plant Innate Immunity.Front. Plant Sci. 2012, 3. [CrossRef]
Pathogens 2020, 9, 967 21 of 21
58. Zhou, Z.; Zhao, Y.; Bi, G.; Liang, X.; Zhou, J.-M. Early Signalling Mechanisms Underlying ReceptorKinase-Mediated Immunity in Plants. Philos. Trans. R. Soc. B Biol. Sci. 2019, 374, 20180310. [CrossRef]
59. Zipfel, C.; Robatzek, S. Pathogen-Associated Molecular Pattern-Triggered Immunity: Veni, Vidi . . . ?Plant Physiol. 2010, 154, 551–554. [CrossRef]
60. Hoyte, S.M.; Reglinski, T.; Elmer, P.; Mauchline, N.; Stannard, K.; Casonato, S.; Chee, A.A.; Parry, F.; Taylor, J.;Wurms, K.V.; et al. Developing and Using Bioassays to Screen for Psa Resistance in New Zealand Kiwifruit.Acta Hortic. 2015, 171–180. [CrossRef]
61. Vanneste, J.L.; Moffat, B.J.; Oldham, J.M. Survival of Pseudomonas Syringae Pv. Actinidiae on CryptomeriaJaponica, a Non-Host Plant Used as Shelter Belts in Kiwifruit Orchards. N. Z. Plant Prot. 2012, 65, 1–7.
62. Doyle, J.J.; Doyle, J.L. A Rapid DNA Isolation Procedure for Small Quantities of Fresh Leaf Tissue.Phytochem. Bull. 1987, 19, 11–15.
63. Bolger, A.M.; Lohse, M.; Usadel, B. Trimmomatic: A Flexible Trimmer for Illumina Sequence Data.Bioinformatics 2014, 30, 2114–2120. [CrossRef]
64. Li, H.; Durbin, R. Fast and Accurate Long-Read Alignment with Burrows–Wheeler Transform. Bioinformatics2010, 26, 589–595. [CrossRef] [PubMed]
65. Li, H.; Handsaker, B.; Wysoker, A.; Fennell, T.; Ruan, J.; Homer, N.; Marth, G.; Abecasis, G.; Durbin, R.The Sequence Alignment/Map Format and SAMtools. Bioinformatics 2009, 25, 2078–2079. [CrossRef] [PubMed]
66. Garrison, E.; Gabor, M. Haplotype-Based Variant Detection from Short-Read Sequencing. arXiv 2012,arXiv:1207.3907.
67. Knaus, B.J.; Grünwald, N.J. Vcfr: A Package to Manipulate and Visualize Variant Call Format Data in R. Mol.Ecol. Resour. 2017, 17, 44–53. [CrossRef] [PubMed]
68. Dodds, K.G.; McEwan, J.C.; Brauning, R.; Anderson, R.M.; van Stijn, T.C.; Kristjánsson, T.; Clarke, S.M.Construction of Relatedness Matrices Using Genotyping-by-Sequencing Data. BMC Genom. 2015,16, 1047. [CrossRef]
69. Gerard, D.; Ferrão, L.F.V.; Garcia, A.A.F.; Stephens, M. Genotyping Polyploids from Messy Sequencing Data.Genetics 2018, 210, 789–807. [CrossRef]
70. Murphy, E.A. An Introduction to Genetic Statistics. Am. J. Human Genet. 1973, 25, 578–580.71. Hackett, C.A.; Bradshaw, J.E.; Bryan, G.J. QTL Mapping in Autotetraploids Using SNP Dosage Information.
Theor. Appl. Genet. 2014, 127, 1885–1904. [CrossRef]72. Hackett, C.A.; McLean, K.; Bryan, G.J. Linkage Analysis and QTL Mapping Using SNP Dosage Data in
a Tetraploid Potato Mapping Population. PLoS ONE 2013, 8, e63939. [CrossRef]
Publisher’s Note: MDPI stays neutral with regard to jurisdictional claims in published maps and institutionalaffiliations.
© 2020 by the authors. Licensee MDPI, Basel, Switzerland. This article is an open accessarticle distributed under the terms and conditions of the Creative Commons Attribution(CC BY) license (http://creativecommons.org/licenses/by/4.0/).