Embed Size (px)
Citation preview
NOAA Technical Memorandum NMFS-AFSC-362
A J Orr J D Harris K A Hirschberger R L DeLong G S Sanders and J L Laake
Qualitative and Quantitative Assessment of Use of Offshore Oil and Gas Platforms by the California Sea Lion (Zalophus californianus)
US DEPARTMENT OF COMMERCENational Oceanic and Atmospheric Administration
National Marine Fisheries ServiceAlaska Fisheries Science Center
October 2017
doi107289V5TM-AFSC-362
NOAA Technical Memorandum NMFS
The National Marine Fisheries Services Alaska Fisheries Science Center uses the NOAA Technical Memorandum series to issue informal scientific and technical publications when complete formal review and editorial processing are not appropriate or feasible Documents within this series reflect sound professional work and may be referenced in the formal scientific and technical literature
The NMFS-AFSC Technical Memorandum series of the Alaska Fisheries Science Center continues the NMFS-FNWC series established in 1970 by the Northwest Fisheries Center The NMFS-NWFSC series is currently used by the Northwest Fisheries Science Center
This document should be cited as follows
Orr A J J D Harris K A Hirschberger R L DeLong G S Sanders and J L Laake 2017 Qualitative and quantitative assessment of use of offshore oil and gas platforms by the California sea lion (Zalophus californianus) US Dep Commer NOAA Tech Memo NMFS-AFSC-362 72 p
Document available httpwwwafscnoaagovPublicationsAFSC-TMNOAA-TM-AFSC-362pdf
Reference in this document to trade names does not imply endorsement by the National Marine Fisheries Service NOAA
October 2017
NOAA Technical Memorandum NMFS-AFSC-362
byA J Orr1 J D Harris1 K A Hirschberger1 R L DeLong1
G S Sanders2 and J L Laake1
1Marine Mammal LaboratoryAlaska Fisheries Science CenterNational Marine Fisheries Service
National Oceanic and Atmospheric Administration7600 Sand Point Way NE
Seattle Washington 98115
2Environmental Studies ProgramPacific OCS Region
Bureau of Ocean Energy Management760 Paseo Camarillo Suite 102
Camarillo California 93010
US DEPARTMENT OF COMMERCEWilbur L Ross Jr Secretary
National Oceanic and Atmospheric Administration Benjamin Friedman Acting Under Secretary and Administrator
National Marine Fisheries Service Chris Oliver Assistant Administrator for Fisheries
doi107289V5TM-AFSC-362
Qualitative and Quantitative Assessment of Use of Offshore Oil and Gas Platforms by the California Sea Lion (Zalophus californianus)
This document is available to the public through
National Technical Information Service US Department of Commerce 5285 Port Royal Road Springfield VA 22161
wwwntisgov
ABSTRACTThere are 23 oil and gas production platforms in federal waters offshore southern California These platforms provide haul-out space near foraging areas for California sea lions (Zalophus californianus) a species protected under the Marine Mammal Protection Act Information on abundance and age- sex- and seasonal-use patterns of California sea lions on oil and gas platforms is useful for the environmental review of ongoing activitiesand the eventual removal of platforms when oil and gas production ceases Quantitative estimates of potential harassment injury or mortality for future activities may be derivedfrom data collected during this studyFor this study 5 of the 23 federal platforms were selected as focal sites based on their geographical location and relative accessibility by sea lions Time-lapse camera systems were deployed on the platforms from January 2013 to January 2015 Photos were taken every 30 minutes during day and night A subsample of images was randomly selected from 6-hour blocks of time throughout the day and during randomly selected days throughout each month Individuals were counted and identified to a particular agesex class when possible Counts of animals by month and hour were conducted to examine intra-platform (temporal) and inter-platform (spatial) comparisons A subsample of images (ntotal = 12489 Platform Elly = 1981 Platform Gina = 1960 Platform Habitat = 4742 Platform Heritage = 2551 Platform Harvest = 1255) was used in data analyses There were no consistent spatial trends (ie south-to-north) in numbers of sea lions using the platforms Platform Habitat (central) had the highest counts of sea lions (Median 2013range= 32 ndash 134 2014range = 40 ndash 110) whereas Platform Gina (south) had the lowest (Median 2013range = 1 ndash 21 2014range = 3 ndash 22) throughout the study Also there were no consistent iii
seasonal trends in numbers across all platforms At some platforms (ie Platforms Gina and Habitat) the animals primarily hauled out at night and were away during the middle of theday whereas at others (ie Platforms Heritage and Harvest) the opposite trend was apparent At Platform Elly the sea lions used the platform relatively consistent throughoutthe dayAdditional observations made during this study included 1) pinniped-use on all platforms was dominated by California sea lions however Steller sea lions (Eumetopias
jubatus) were occasionally present at Platforms Elly and Habitat 2) California sea lion adult females were observed nursing at platforms and 3) adult and subadult California sea lion males were seen at the platforms year-round These observations have enhanced our understanding about the distribution and behavior of California sea lions and their use of offshore platforms
iv
Contents
INTRODUCTION 1METHODS 2Platforms and Camera Systems 2Data Collection Quality contr ol 46Data Analyses 6RESULTS 7Intra-platform (Temporal) Comparisons 8Platform Elly 8Platform Gina 10Platform HabitatPlatform Heritag e 1213 Platform Harvest Inter-platform (Spa tial) Comparisons 1517Monthly comparisons Hourly comparisons 1718Agesex class comparisons 19DISCUSSION 20Platforms and Camera Systems 20Data Analysis Issues Pinniped Presence 2224Intra-platform (Temporal) Comparisons Inter-platform (Spatial) Comparisons 2530Notables 30Conclusions 34ACKNOWLEDGMENTS 35REPORT AVAILABILITY 37CITATIONS 39APPENDICES 65
v
INTRODUCTION As of 2016 there are 27 oil and gas production platforms offshore southern California Twenty-three of the platforms are in federal waters offshore San Pedro Bay (n = 4) the Santa Barbara Channel (n = 15) and in the Santa Maria Basin (n = 4) Theseplatforms operate under leases issued by the Bureau of Ocean Energy Management (BOEM)and administered by the Bureau of Safety and Environmental Enforcement (BSEE) The other four platforms are in state waters (less than 5 km from shore) and operate under leases issued by the California State Lands CommissionThe federal platforms were erected between 1967 and 1989 Currently they produce approximately 63000 barrels of oil and 130 million cubic feet (Mmcf) of natural gas per day (BOEM Studies Plan) At this rate production could be sustained into the nextdecade However eventually all of these facilities will be decommissioned at the end of their productive life times Decommissioning of platforms falls under the jurisdiction of BSEE and BOEM conducts environmental studies and environmental review support for BSEE actions Many of the oil and gas platforms provide haul-out space near foraging areas for pinniped species like the California sea lion (Zalophus californianus) the Steller sea lion (Eumetopias
jubatus) and the Pacific harbor seal (Phoca vitulina) During 2012 BOEM entered an inter-agency agreement with the National Oceanic and Atmospheric Administrationrsquos (NOAA) Marine Mammal Laboratory (MML Seattle Washington) to collect information in supportof analyses pursuant to the National Environmental Policy Act (NEPA) and Marine MammalProtections Act (MMPA) permitting requirements Analyses of ongoing activities anddecommissioning of platforms will benefit from the information collected during this study
Specifically the objectives of this study were to 1) characterize and quantify California sea lion use of oil and gas platforms offshore southern California area of the Pacific OuterContinental Shelf (OCS) Region and 2) assess the abundance seasonal use patterns andagesex class structure of animals using the offshore facilities METHODS
Platforms and Camera Systems All 23 federal platforms were visited between 30 October and 7 November 2012 (Fig 1) During these visits the number and agesex class of each individual pinnipedhauled out on the platforms were recorded Additionally each platform was evaluated for the installation of digital automated time-lapse camera systems including the followingnumber and size of landing decks height of railing above pinniped-occupied decks and diameter of rails Camera systems could not be placed on all the platforms due to time and monetary constraints After the initial assessments were completed 5 of the 23 platforms were selected as focal study sites Selection criteria included the following 1) high usage bypinnipeds 2) camera placement constraints and 3) a ldquogoodrdquo representative within a particular geographical area The five platforms selected were (from south to north) Platform Elly (Beta Offshore San Pedro Bay) Platform Gina (DCOR Point Hueneme Unit) Platform Habitat (DCOR Pitas Point Unit) Platform Heritage (Exxon Mobil Santa Ynez Unit) and Platform Harvest (originally Plains Exploration and Production Company (PXP) but ownership transferred to Freeport McMoran during the study Point Arguello Unit Fig 2) 2
The camera systems (Trail Watcher Game Cameras Monticello Georgia Fig 3) were composed of a timing circuit a small point-and-shoot camera (Sony Cyber-shot DSC-WX50 162 megapixels) and battery bank (Energizer Ultimate Lithium AA and DuracellProcell C) which were all mounted within a small Pelicanreg waterproof case (Fig 3)Cameras systems were attached to custom fabricated aluminum backing plates with ahood The backing plates containing the camera systems were attached to railings on the platform using clamps and stainless steel fastings (Fig 3) Initially the time-lapse camera systems were programmed to take a photo every 15 minutes between the hours of 0300h and 1900h 16GB memory cards were installed in each camera Cameras were deployed on Platforms Elly Gina Habitat and Heritage in January 2013 and Platform Harvest in February 2013 The number of cameras required location and viewing angle to maximize coverage of pinniped-use areas were all considered in determining the placement of the camera systems (Fig 4) The number of camera systems installed on each platform were as follows Platform Elly = 3 Platform Gina = 3 Platform Habitat = 4 Platform Heritage = 4 and Platform Harvest = 3In February 2013 the four platforms that had camera systems were revisited so that the conditions of the camera systems could be inspected and maintenance performed (eg batteries replaced battery voltage measured) and memory cards containing digital images were collected and replaced with newempty cards It was determined that 16GB memory cards did not have sufficient space to store 2-monthsrsquo worth of images at a rate of 1 image15 min The sampling protocol was changed to 1 image30 min throughout the entire day and 16GB cards were replaced by 32GB cards We also encountered problems of failing battery voltage on a few of the camera systems [ie Platform Elly (n = 2) and
3
Platform Gina (n = 1)] which resulted in the cameras operating for less than a monthDuring this month three camera systems were deployed on Platform HarvestIn April 2013 all five study platforms were revisited so that batteries and memory cards could be exchanged and other maintenance (eg cleaning viewing window) could beperformed following a 2-month deployment Two camera systems (one each on Platforms Elly and Habitat) were determined not to be working properly resulting in failures to takephotos at programmed times since the last visit The failing units were replaced withfunctional ones and subsequently repaired or replaced After April 2013 we visited the platforms every 2 to 3 months for data retrieval andmaintenance of the camera systems which included replacing batteries measuring batteryvoltage and checking camera functionality (Table 1) All camera systems were removedfrom the platforms in January 2015 Data Collection Images were uploaded from memory cards to a laptop computer Some of the digital images were examined to determine if there were any issues with camera performance or the camera system housing (eg unclear viewing window faulty programming alterationof housing unit) Organizational and nomenclature changes of images were made using the freeware Total Commander [C Ghisler ver 851a 32-bit (2014)] Image file names were changed to a Year Month Day Hour Minute Second original file name and Camera Number format ldquoYYYYMMDD_HHMMSS_original file name_CAM rdquoA Microsoft Access database was created to archive and analyze the time-lapse images The database contained fields to input metadata for each image (eg visibility
4
quality environmental conditions distance of camera from haul-out sites species of pinniped seen) as well as to identify and count animals To identify and count individualsan analyst would view the image files for a given platform corresponding to a specific date and time Landmarks on images that had overlapping areas taken from two or more cameras were marked For each image file the analyst used their computer mouse to place a marker on each animal they saw hauled out on the platform The analyst chose one of seven different agesex class (individuals that generally share the same morphological characteristics) or unclassified markers and a blank category indicating no animals were seen (the first four categories are descriptors for California sea lions only) 1) ldquomature malesrdquo ndash included subadult and adult males approximately 6 or more years old 15 to25 m long brown to black in coloration sagittal crest partially or fully developed thick neck 2) ldquoadult femalesrdquo ndash 5 or more years old 15 to 2 m long light brown or cream-colored no sagittal crest present 3) ldquojuvenilesrdquo ndash of both sexes approximately 1- to 4ndashyears-old from lt1 to 15 m long light to dark brown coloration 4) ldquopupsrdquo ndash of both sexes lt1-year-old le 1 m long dark brown coloration It was often difficult to discern yearlings (categorized as juveniles) from older pups therefore 1 July was set as the demarcation date in which individuals that looked like pups were categorized as juveniles5) ldquounknownrdquo ndash individuals that could not be identified to a specific agesex class or could only see a body part (eg flipper rump) 6) ldquocannot countrdquo ndash for various reasons (eg blurred images too dark) and 7) ldquoblankrdquo (Fig 5) Identifications were automatically tallied using programming code embedded in the database Analysts also noted if an image contained marked (eg branded tagged instrumented) individuals animals with shark bites or lesions evidence of fishery-interactions (eg individual entangled with 5
monofilament line bands fish hooks) human disturbance (eg humans working on the platform crew boat exchange) or any other unusual occurrence (eg birthing nursing)Analysts were conservative with their identifications If there were any uncertainties inassigning an agesex class to an animal then the analyst would consult with other analysts or label animal as ldquounknownrdquo Additionally individuals that were difficult to differentiate between being a pup or juvenile were marked as ldquojuvenilerdquo Individuals that were questionable to identify as juvenile adult female or subadult male were labeled as ldquounknownrdquo Quality Control To ensure that identifications and counts were done correctly the analyst wouldopen the image a second time and view the assigned markers Images were viewed at least twice to make sure all animals were accounted for A subset of images was viewed by at least two analysts to determine if the counts and identifications were consistent across analysts Additionally a subset of images was re-analyzed after all images for a platform were processed in order to determine if analysts were consistent with their counts andidentifications from the beginning through the end of their image counting processing
Data AnalysesDue to time constraints it was not possible to analyze all the images obtainedduring the study so a subsampling protocol was developed The dates when all thecameras on a given platform were operational was split into 2-week blocks From each block 2 days were selected at random Within each day two images were analyzed from 6
the following blocks of time 0001hearliest hour ndash 0659h 0700h ndash 1259h 1300h ndash 1859h 1900 ndash 0000hlatest hour (Fig 6) Months when a particular camera-system was not operational were not included in the subsampling protocol (Table 2) If an image from one or more camera-systems on a platform was not able to be analyzed (eg too dark out offocus) then discernable photos from the nearest in time (prior in time was given preference) to the time period selected in the subsampling protocol were usedTotal counts were calculated by summing the number of individuals (identified to a specific agesex class if possible) counted from images taken from all cameras for the same time and date Only individuals on the platform including supporting beams landing decks and stairs were counted Individuals in the water beneath the platform or around landing decks were not counted Counts were used to generate hourly daily and monthly median numbers of animals using the platforms Inter-platform comparisons were made to examine spatial trends in animal usage Intra-platform comparisons were examined to determine if there were any temporal (ie monthlyseasonal) changes Statistical differences in counts of California sea lions were assessed using generalized linear models (GLMs) with the glm function (quasipoisson family) in R (R Core Team 2015) GLMs included response variables platform year month hour and interaction terms GLMs were used because response variables had non-normal distributions Significance level was set at α = 005 No statistical comparisons were madeamong agesex classifications because most identifications were ldquounknownrdquo and individuals were not assigned to an agesex class on Platform Habitat
7
RESULTS Of the 464174 images obtained from all the platforms during this study 12489(Platform Elly = 1981 Platform Gina = 1960 Platform Habitat = 4742 Platform Heritage = 2551 Platform Harvest = 1255) were used in data analyses There were periods of time when one or more of the camera-systems were not functioning properly Images were notanalyzed during those months (Table 2) Therefore it was not possible to examine complete inter- and intra-annual comparisons of California sea lion use on the platformsSteller sea lions were observed in photographs on only two of the platforms Platform Elly on 22 February 2013 and 3 January 2014 and Platform Habitat on 22 January 2014 (Fig 7a) Harbor seals were occasionally seen in waters adjacent to the platforms during our visits but none were actually seen hauled out on the platforms (Fig 7b) Intra-platform (Temporal) Comparisons
Platform EllyData that were collected and analyzed indicated that significantly more sea lions used the platform during 2013 compared to 2014 (GLM P lt 005 Fig 8 Appendix Figs 1 ndash 3)Monthly comparisons Monthly median counts fluctuated throughout the study and differed significantly (GLM P lt 005) During 2013 monthly median counts ranged from 13 (February) to 86 (October) The range of monthly maximum counts was 81 (December) to 137 (October Fig 8 Appendix Fig 1) During 2014 monthly median counts were more consistent and ranged from 15 (November) to 58 (May) The range of monthlymaximum estimates was 32 (November) to 123 (December Fig 8 Appendix Fig 2) Intra-
8
monthly countstrends were not consistent and differed significantly between years (GLM P lt 005) For example the highest number of animals were observed during October 2013 whereas October 2014 had some of the lowest counts (Fig 8 Appendix Figs 1 and 2) Hourly comparisons Overall hourly median counts differed significantly (GLMP lt 005) During 2013 hourly median numbers ranged from 33 (0300h) to 83 (1500h Fig 9 Appendices 4) Hourly maximum counts ranged from 64 (0100h) and 137 (1800h)During 2014 hourly median counts ranged from 13 (1800h) to 54 (0200h) Hourly maximum estimates ranged from 25 (1200h) to 123 (2200h Fig 9 Appendix Fig 5) Intra-hourly comparisons of median counts indicated that in 2013 there was a gradual increase in numbers of sea lions hauled out from early morning to the afternoon (0300h ndash 1500h)then a decrease in numbers during the remainder of the day whereas median counts were relatively consistent throughout the day during 2014 (Fig 9 Appendix Figs 4 ndash 6)Agesex class comparisons The monthly mean percentage (plusmn standard error) ofindividuals identified to an agesex class was 473 (SE = 40) during 2013 and 498 (SE = 34) during 2014Juvenile California sea lions comprised the highest proportion of identified animalson Platform Elly during every month of the study (Fig 10) They represented a higher proportion of animals using the platform during 2013 [range 075 (September) ndash 092 (July)] compared to 2014 [073 (November December) ndash 086 (May)] In general adult females had the second highest proportions of identified individuals depending on month (Fig 10) Their monthly proportions were higher in 2014[range 009 (May) ndash 018 (December)] compared to 2013 [range 004 (July November) ndash 014 (February)]
9
Mature males had higher proportions of classified animals than adult females during5 months of the sampling period (ie August September and December 2013 January andJuly 2014) however overall they represented the third most assigned agesex class The proportion of mature males ranged from 006 (February November) to 014 (September) in 2013 and from 004 (May) to 013 (January) in 2014 of the classified population (Fig 10) The mean annual proportion of mature males was the same during both years (mean = 008 standard deviation = 003) Pups were only seen on Platform Elly during February 2013 (05 n = 4 Fig 10)There was no consistent seasonal trend in the proportion of individuals within any agesexclass during any year of the study (Fig 10) Platform GinaData were not obtained during January 2013 nor any month after September 2014from Platform Gina because of camera-system failures However general patterns in thenumber of sea lions using Platform Gina could be ascertained from the months that were sampled
Monthly comparisons During 2013 monthly median numbers ranged from1 (April) to 21 (November) and maximum monthly counts ranged from 3 (April) to 59 (October Fig 8 Appendix Fig 1) During 2014 monthly median counts ranged from 3 (February) to 22 (August) The range for monthly maximum estimates was 24 (June) to 79 (May Fig 8 Appendix Fig 2) There was a general upward trend in the number of California sea lions using Platform Gina from February to November 2013 (Fig 8 Appendix
10
Fig 1) During 2014 the trajectory was similar to 2013 until June after which countsfluctuated (Fig 8 Appendix Fig 2) Hourly comparisons General trends of hourly median data indicated that California sea lions hauled out less during ldquodaytimerdquo hours (~0600h-2000h) compared toldquonighttimerdquo hours in both 2013 and 2014 (Fig 9 Appendices 4 and 5) During 2013 hourly median counts ranged from 2 (1000h 1700h and 1800h) to 21 (0100h Fig 9 Appendix Fig 4) Hourly maximum counts ranged from 15 (0800h and 1700h) to 59 (0500h) During 2014 hourly median numbers ranged from 2 (1700h) to 35 (0500h) The range of hourly maximum counts was 18 (1800h) to 79 (0400h Fig 9 Appendix Fig 5) General patterns of intra-hourly and inter-annual counts were similar (Fig 9 Appendix Figs 4 ndash 6)Agesex class comparisons The monthly mean percentage of individuals identified to an agesex class was 592 (SE = 52) during 2013 and 730 (SE = 47)during 2014Juveniles were the most numerous agesex class during every month for which datawere available (Fig 10) Overall juveniles had approximately the same proportions during 2013 [range 052 (June) to 092 (March)] and 2014 [range 048 (January) to 094 (JulyAugust)] however their proportions were not consistent by month (Fig 10)Adult females were the second most common agesex class counted Theirproportions were similar between years [range 2013 007 (November December) to 023 (May) range 2014 002 (August) to 028 (February)] although intra-monthly comparisons were not (Fig 10)
11
Pups were only seen during May to June 2013 Their proportions ranged from 014 (May) to 020 (April June Fig 10) During 2014 pups were sighted as early as JanuaryTheir monthly proportions ranged from 007 (February) to 029 (June Fig 10) Mature males monthly proportions ranged from 0 (March) to 025 (February) during 2013 and 003 (July) to 020 (January) during 2014 (Fig 10)There did not appear to be a consistent seasonal trend in the proportion of individuals within any agesex class during either year of the study (Fig 10) Platform HabitatData were obtained during all months on Platform Habitat except January 2013 February 2014 and January 2015 Using data that were collected and analyzed indicatedthat California sea lions used Platform Habitat significantly more during 2014 compared to2013 (GLM P lt 005 Fig 8 Appendix Figs 1 ndash 3)
Monthly comparisons During 2013 monthly median counts ranged from 32 (July) to 134 (October) Maximum monthly counts ranged from 65 (April) to 234 (October Fig 8 Appendix Fig 1) During 2014 monthly median numbers ranged from 40 (November) to110 (April) and maximum monthly counts ranged from 73 (June) to 493 (SeptemberFig 8 Appendix Fig 2) Intra-monthly median counts were different between years (GLM P lt005) however some trends were apparent For example prior to July there was a general downward trend in median counts followed by an upward trend in counts untilNovember during both years (Fig 8 Appendix Figs 1 ndash 3)Hourly comparisons There were significant differences in hourly median counts in both years (GLM P lt 005) During 2013 hourly median counts ranged from 33 (2200h) to
12
96 (1400h) and hourly maximum counts ranged from 65 (0100h) to 234 (1100h Fig 9Appendix Fig 4) During 2014 hourly median numbers ranged from 25 (1500h) to 161(0200h) and hourly maximum counts ranged from 67 (1500h) to 493 (0600h Fig 9 Appendix Fig 5) Intra-hourly trends were similar during some periods of the day For example there was a decreasing trend in the number of sea lions using the platform from 0300h to approximately 1000h although the decrease in numbers was more pronouncedduring 2014 (Fig 9 Appendix Figs 4 ndash 6) Intra-hourly trends were inconsistent during other periods of the day (Fig 9)Agesex class comparisons Individuals were not assigned to agesex classes on Platform Habitat because of the distance between the animals and the camera systems and because they were often tightly aggregated
Platform HeritageFrom data that were available it was apparent that California sea lions used the platform significantly more during 2013 compared to 2014 (GLM P lt 005 Fig 8 Appendix Figs 1 ndash 3)Monthly comparisons During 2013 monthly median counts ranged from 26 (July) to 64 (February and May) Monthly maximum estimates ranged from 53 (July) to 116 (September Fig 8 Appendix Fig 1) During 2014 monthly median counts ranged from 14(July) to 42 (May) Monthly maximum counts ranged from 50 (November) to 108 (JanuaryFig 8 Appendix Fig 2) Although the median number of animals were different between years the inter-annual pattern of median numbers from April through August were similar (Fig 8 Appendix Figs 1 and 2)
13
Hourly comparisons During 2013 hourly median counts ranged from 19 (1700h) to 63 (1000h) Hourly maximum counts ranged from 42 (0400h) to 116 (1200h Fig 9Appendix Fig 4) During 2014 hourly median counts ranged from 13 (2100h) to 45(1400h) and maximum hourly counts ranged from 20 (0000h) to 108 (0800h Fig 9 Appendix Fig 5) Intra-hourly trends were similar during both years (Fig 9 Appendix Figs 4 and 5) Hourly median data indicated that California sea lions were hauled out on Platform Heritage more during late morning through afternoon (~0900h ndash 1500h) compared to other periods of the day (Fig 9 Appendix Figs 4 ndash 6) Agesex class comparisons The monthly mean percentage of individuals identified to an agesex class was 509 (SE = 30) during 2013 and 428 (SE = 39)during 2014Juveniles represented more than 50 of classified animals during every month They represented a greater proportion of individuals during 2014 [range 060 (December) to 094 (June) Fig 10] compared to 2013 During 2013 proportion of juveniles rangedfrom 058 (October) to 085 (May Fig 10) Adult females were the second-most classified sea lions They had higher monthly proportions during 2013 compared to 2014 (GLM P lt 005) During 2013 adult females represented between 135 (May) and 375 (October) of animals identified during each month (Fig 10) During 2014 the monthly proportion of adult females ranged from 005(May June) to 030 (December Fig 10)Proportions of mature males were similar in 2013 and 2014 (Fig 10) During 2013their monthly proportions ranged from 001 (January) to 012 (December Fig 10) Mature
14
males comprised between 11 (June) and 95 (December) of the classified population during 2014 (Fig 10)Pups represented the agesex class least identified on Platform Heritage They wereseen during 2 months during 2013 and their monthly proportions ranged from 001 to 002in December and April respectively (Fig 10) Pups were seen during spring 2014 Their monthly proportions ranged from 001 (March May) to 002 (April Fig 10)There did not appear to be any other consistent monthly or annual trends in theproportion of individuals within any agesex class (Fig 10) Platform Harvest Data that were collected and analyzed indicated that there were slightly more California sea lions using Platform Harvest during 2014 compared to 2013 (Fig 8Appendices 1 ndash 3)
Monthly comparisons During 2013 monthly median counts ranged from 19 (June and November) to 42 (October) Monthly maximum counts ranged from 37 (April) to 78 (October Fig 8 Appendix Fig 1) During 2014 monthly median numbers ranged from 22(December) to 54 (June) and monthly maximum counts ranged from 50 (February) to 107 (June Fig 8 Appendix Fig 2) Intra-monthly median count trends were not consistent between years (Fig 8 Appendix Figs 1 ndash 3) Monthly median counts fluctuated during 2013 whereas in 2014 they steadily increased during January through June followed by asteady decrease until August (Fig 8 Appendix Figs 1 and 2)Hourly comparisons During 2013 hourly median counts ranged from 7 (0300h)to 42 (1400h) and hourly maximum estimates ranged from 11 (0200h) to 78 (1600h
15
Fig 9 Appendix Fig 4) During 2014 hourly median numbers ranged from 18 (0400h) to 67 (1000h) Hourly maximum counts ranged from 47 (0400h) to 107 (1200h and 1600h Fig 9 Appendix Fig 5) Intra-hourly comparisons from both years indicated that sea lions were most often present on Platform Harvest during late morning through the afternoon (~1000h ndash 1400h) compared to other hours of the day (Fig 9 Appendix Figs 4 and 5)Hourly platform-use patterns were similar during both years (Fig 9 Appendix Figs 4 and 5) Agesex class comparisons The monthly mean percentage of individuals identified to an agesex class was 733 (SE = 11) during 2013 and 828 (SE = 23)during 2014Similar to other platforms juveniles comprised the majority of individuals classifiedduring each month on Platform Harvest (Fig 10) Their monthly proportions ranged from 055 (November) to 080 (May July) during 2013 (Fig 10) During 2014 their monthlyproportions ranged from 053 (February) to 090 (June Fig 10)Adult females had the second highest proportions of classified animals however they were outnumbered by mature males during a few months of the study period (ie April 2013 May 2014 and January 2015 Fig 10) During 2013 adult female monthly proportions ranged from 005 (May) to 025 (February November and December Fig 10)Their monthly proportions ranged from 008 (May June) to 030 (January February) during 2014 (Fig 10)Mature males had higher monthly proportions during 2013 [range 006 (July) to023 (April) Fig 10] compared to 2014 [range 003 (June) to 018 (December) Fig 10]
16
Fewer pups were seen on Platform Harvest compared to other agesex classes Additionally they were only seen during 3 months in both 2013 and 2014 (Fig 10) When present their monthly proportions ranged from 001 (May) to 003 (April) during 2013 and 001 (March) to 004 (April) during 2014 (Fig 10)There were inter-annual and intra-monthly trends in the proportions of juveniles and mature males The proportion of juveniles increased during summer and decreasedduring winter The opposite trend was apparent for mature males (Fig 10) Inter-platform (Spatial) Comparisons
Monthly ComparisonsThere were no consistent spatial (south-to-north) trends in the number of California sea lions using the offshore platforms by month (Fig 8 Appendix Figs 1 ndash 3) However the number of sea lions increased during October 2013 which was consistent across platforms During the first 5 months of 2013 Platforms Habitat and Heritage had the highest median number of animals Median numbers decreased for Platform Heritage after May increaseduntil September and subsequently decreased the remainder of 2013 whereas numbers of animals increased at Platform Habitat until August after which they declined (Fig 8 Appendix Fig 1) Median counts on Platform Elly (southernmost platform) increased during the summer 2013 and remained one of the most used platforms the rest of the yearMedian counts at Platform Gina were the lowest throughout 2013 with the exception ofNovember (Fig 8 Appendix Fig 1) Platform Harvest was the second least used platform during 2013 (Fig 8 Appendix Fig 1)
17
In 2014 more animals were counted at Platform Habitat during each month exceptMarch when no counts were available and June (Fig 8 Appendix Fig 2) Platform Ginaremained the least used platform with the exception of July and August during which time counts were similar to those at other platforms Median numbers of sea lions at Platform Harvest were slightly higher than at Platform Heritage with the exception of JanuaryDecember and January 2015 (Fig 8 Appendix Fig 2) Patterns of median numbers at Platform Elly were similar to those at Platform Harvest (Fig 8 Appendix Fig 2) Afterpooling all monthly data the order of mean medians (from lowest to highest) was PlatformGina Platform Harvest Platform Heritage Platform Elly and Platform HabitatContrary to monthly data analyzed separately for each year averaged monthly datafrom all years (eg mean January2013-2015 February2013-2014 etc) indicated that there was a general increase in California sea lion numbers at Platforms Elly Gina and Habitat from January to at least May and a corresponding decrease in numbers at Platforms Heritage and Habitat There was another increase in numbers of individuals at Platforms Gina Habitat and Heritage in August and September corresponding with no change at the other platforms However from examining the count data by individual dates it did not appear that individuals from one of the selected platforms moved to another of the selected ones because of a disturbance (including change in accessibility) However animals could have moved to any one of the adjacent facilities during such events Hourly Comparisons As with monthly comparisons there were no distinct consistent spatial (south-to-north) patterns of time of day when California sea lions hauled out on the platforms (Fig 9
18
Appendix Figs 4 ndash 6) During 2013 the general trend for Platforms Elly Heritage andHarvest was a gradual increase in numbers from morning to midday followed by a gradual decrease from midday to night (Fig 9 Appendix Fig 4) The exact opposite trend was exhibited at Platform Habitat Median numbers at Platform Gina gradually decreased until midday but then remained relatively the same during the remaining hours of the day (Fig9 Appendix Fig 4) Median count trends were more variable during 2014 across platformsNumbers increased after 2200h which also happened during 2013 with the exception of Platform Elly (Fig 9 Appendix Fig 5) AgeSex Class ComparisonsIn general Platforms Elly and Gina had a higher proportion of juveniles than Platforms Heritage and Harvest Platform Heritage had a higher proportion of adult females compared to the other platforms and Platform Harvest had a higher proportion of adult males (Fig 10) Proportion of juveniles tended to increase during late springearly summer on Platforms Heritage and Harvest (Fig 10) Only four pups were counted during just one month (February 2013) on Platform Elly whereas more pups were counted on the other platforms (esp Platform Gina) during multiple months (Fig 10)Based on pooled data there were some latitudinal patterns in agesex classes The number of immature animals (pups and juveniles) increased from north (Platform Harvest) to south (Platform Elly) as did the number of adult females (Platforms Heritage andHarvest compared to Platforms Gina and Elly)
19
DISCUSSION
Platforms and Camera Systems The five platforms selected for this study met the selection criteria because they were used by pinnipeds (California sea lions in particular) and were located in areas that encompassed the distribution range of the 23 oil and gas platforms administered by BOEM in the Southern California Planning Area Some of the other offshore facilities had physical barriers that limited access to pinnipeds Although other platforms were viable study sites we were limited in the number of camera systems that could be installed and maintainedWe decided to allocate enough camera-systems on each selected platform to best coverareas where animals potentially could be located rather than just cover some areas on more platforms Additionally rather than change platforms during different years of the study we decided to retain the same sites so that temporal comparisons in pinniped-use of the platforms could be examined in addition to the spatial comparisons Although the chosen platforms were selected as focal sites to represent other adjacent platforms itmight not be possible to extrapolate our findings to those other sites because of differences in structure exposure or activities on each facilityPrior to the onset of this project there were concerns that the time-lapse camera systems might not be useful because they might have been affected by the salt spraycommon on the lower levels of the platforms where the animals hauled out Failure to obtain satisfactory images could have occurred due to salt spray covering the lens or penetrating the electrical control panel of the camera system Although there is experience with remote digital camera systems in marine mammal research what has been done was based on terrestrial applications at sites near the sea (eg Burkanov et al 2014 2015) but 20
not on artificial platforms poised just above the sea surface Despite the conditions that the camera systems experienced for the most part the salt spray did not adversely affect thecamerasrsquo ability to obtain quality images This is not to say that some of the images were not compromised but the vast majority were usable There were other issues with the camera systems on the platforms at different times throughout the study period On several occasions we noticed that batteries apparently shifted from their proper positions within the battery bank The probable cause of batterydisplacement was from vibrations on the rails on which the camera systems were mounted that were caused by platform activities Batteries were strapped and taped into theirproper position but upon examination during the subsequent maintenance trip a battery occasionally was not in proper alignment It is not clear if this was a cause of camera-system failure A couple of the camera systems were malfunctioning and weresubsequently replaced and sent back to the manufacturer Regardless of the reason why a camera system was not operating properly we could not detect the problem until the following maintenance trip This resulted in an inability to capture photos for a period oftime We chose to only include times when all camera systems were functional to assure that data were comparable throughout the studyDespite our best efforts not all areas where animals potentially could haul out on the platforms were covered by the camera systems Additionally some of the camerasystems were partially obstructed placed in locations where it was difficult to ascertain the agesex class of the animals or were altered by activities conducted on the platforms
21
Data Analysis Issues Except for the first 2 months the time-lapse camera systems were programmed to take a photo every 30 minutes and over 400000 photos were taken Three people analyzed the photos Because of time and budget constraints it was not possible to examine every image to count and identify animals The subsampling protocol encompassed all time periods of the day and month so that a reasonable amount of information could be obtained to address the study objectives All of the images are retained in a database and ina public repository [NOAA National Centers for Environmental Information (httpsnodcnoaagov) Package Reference ID R1B85T] so that data are available for additional analysis as neededBecause of issues with the time-lapse camera systems and understanding that onlyanimals actually on the platforms were counted it is important to recognize that the countsrepresent a minimum estimate of animals using these offshore facilities There may havebeen animals that were present but not seen in areas not covered by the camera systems Individuals resting or swimming underneath or around the platform may have used the platform prior to or after the photo was acquired However this was not known with certainty and we defined ldquouserdquo as physically being on the platform There were other factors that impeded pinnipeds from hauling out on the platforms at different times of the study including tidal height physical barriers and platform activities Additionallyanimals were disturbed at times and actively encouraged into the water during thearrivaldeparture of the crew boats (Table 3) The end result was that there were feweranimals on the platforms during those periods However some of the animals may have been in nearby waters waiting to get back onto the platforms when it was possible to do so 22
It should be noted that hourly and monthly numbers of animals do not necessarily reflect different individuals Many of the same individuals could have been photographed in multiple imagesIdentifying individuals to a particular agesex class was often challengingDifficulties included (but are not limited to) only seeing part of an animal inadequate light at night distance to the animals animals congregated too tightly to discern each individual and inability to discern animal morphology to classify Because of distinct morphological characteristics the easiest animals to classify were pups and adult males However it should be noted that because of the smaller size of some yearlings (here categorized witholder juveniles) during the past few years it was challenging to differentiate some juveniles from pups Often it was difficult to distinguish large juveniles adult females and subadult males so they were labeled ldquounknownrdquo Analyzers did their best to identify individuals andbe consistent with their identifications however the agesex class information providedhere is incomplete It should not be assumed that the proportions of classified individuals are reflective of those unidentified Pinniped Presence California sea lions were the dominant pinniped species on the platforms This was expected because the California sea lion is the most abundant pinniped within theCalifornia Current ecosystem and their use of man-made structures is well documentedCalifornia sea lions primarily breed in the United States at several of the California Channel Islands including Santa Barbara (3348degN 11904degW) San Clemente (3290degN 11850degW)
23
San Miguel (3403degN 12038degW) and San Nicolas (3325degN 11950degW) islands which are all relatively near the oil and gas platforms Steller sea lions were seen at two of the platforms (ie Platforms Elly and Habitat) during winter months This species also is present in the California Current ecosystem although not as abundant as California sea lions In US waters they are distributed from Alaska to central California Historically they bred as far south as the California Channel Islands however no pups have been seen there in decades (although mature males have been sighted at San Miguel Island) There are three Steller sea lion rookeries (where 50 or more pups have been counted) in California all located well north of our study area AntildeoNuevo Island (3711degN 12234degW) Cape MendocinoSugarloaf Island (4044degN 12441degW)and St George Reef (Southwest Seal Rock 4180degN 12435degW) smaller numbers of pupsare also born on the Farallon Islands (3772degN 12303degW Pitcher et al 2007 NMFS 2013)Pacific harbor seals also occur in the California Current ecosystem They haul outand breed on rocky islets mud flats reefs and mainland beaches along the North American coast from San Quintin Bay Baja California Mexico to Nome Alaska (including the Channel Islands Reeves et al 1992) They exhibit strong site fidelity however they are capable ofmaking long-distance movements (Reeves et al 1992) Harbor seals were seen at the Carpinteria Harbor Seal Preserve and Rookery Carpinteria California which is nearseveral platforms including Platform Habitat Although harbor seals were seen in waters near platforms they were never seen actually on the platforms which may be due to an inability to physically get onto the platforms a propensity to return to a preferred hauloutor other reasons
24
Intra-platform (Temporal) ComparisonsBecause California sea lions were the dominant pinniped species using theplatforms we will restrict our discussion to this species The largest differences in counts among months were observed at Platforms Gina and Habitat These platforms also exhibited the greatest disparity in counts both within a day and between years Platforms Heritage and Harvest exhibited similar use patterns by hour during both years of the studywith animals hauling out more frequently during the day and leaving at night Platform Gina exhibited the opposite pattern Seasonal variability in numbers of animals using the platforms can be expected due to reproductive foraging and physiological characteristics of California sea lions as well as changes in regional prey availability oceanic conditions and sea state Their breeding season starts in May when adult males arrive at rookeries to establish and defend territories Adult females return to rookeries during May and June and give birth 4 to 5days after coming ashore Postpartum females remain on land nursing their pups for approximately 7 to 10 days and then alternate between foraging trips of 1 to 3 days andnursing periods of 1 to 2 days (Heath 1989 Antonelis et al 1990 Ono 1991 Melin et al2000) They continue this pattern of feeding and nursing until their pup is weaned (~11 months) Lactating females are central place foragers and are constrained in duration by their pupsrsquo fasting limitations to forage near rookeries during the reproductive season (Melin et al 2000) Although lactating females can go on longer foraging trips because their pups start supplementing their diet by feeding at sea as early as 6 months-of-age (Orr et al 2012) they along with other adult females generally remain near rookeries year-round (Odell 1975 Antonelis et al 1990 Melin et al 2000 Kuhn 2006 Kuhn and Costa 2014) 25
Adult females may have been using the offshore platforms as resting sites while traveling to and from foraging areas some of which were near the platforms Although the distribution and at-sea behavior of adult females from different rookeries (eg San Miguel and San Nicolas Islands) may differ geographically ndash individuals from San Nicolas Island forage predominately in the Los Angeles Bight (offshore Los Angeles County Kuhn 2006Kuhn and Costa 2014) and those from San Miguel Island feed in the Santa Barbara Channel northward in the Santa Maria Basin and farther north to Monterey Bay (Antonelis et al 1990 Melin et al 2000 2008) ndash these locations are near all of the platform sites Adultfemales may not have been as abundant as juveniles on the platforms because of their needto return and nurse their young or because of our inability to classify many of them as ldquoadult femalesrdquo Adult and subadult male California sea lions usually depart the Channel Islandrookeries during late July and August and migrate north to northern California Oregon Washington and British Columbia Canada (Peterson and Bartholomew 1967 Weise et al2006 Wright et al 2010 Gearin et al 2017) This reduces intraspecific competition by habitat partitioning and niche divergence Therefore mature males would normally only be present in the southern California OCS from AprilMay (when they are migrating to rookeries) through August (when they are making their return migrations) However they were seen on the platforms during every month of the study though in relatively low numbers during the breeding season This finding was not expected because there are relatively few mature males at the rookery islands during the non-breeding season Theirpresence during the breeding season might be attributable to non-territorial bulls using the platforms as resting sites while foraging (either at or away from the platform) Mature 26
males present at the offshore facilities during the non-breeding season may be individuals from the Channel Islands or they might have been animals migrating from rookeries offwest side of Baja California Mexico They were not as abundant as adult females or juveniles on the platforms because of their inconsistent attendance in the southernCalifornia Bight or because many of them were at rookeries defending territories Juvenile California sea lions were the most abundant agesex class on the platformsUnlike adult females they are not necessarily central place foragers Once weanedjuveniles are not obligated to return to the rookery until they are sexually mature They only require energy for self-maintenance and growth Although they need to alter their behaviors in response to prey movements theoretically they can afford to be moreselective in prey choice or follow migrating prey for greater distances than adult females if needed However physiological factors that limit dive duration and traveling distance are positively correlated with body size and age (Feldkamp et al 1989 Horning and Trillmich1997 Burns 1999 Baker and Donohue 2000 Fowler et al 2007ab) Therefore the morphological physiological and energetic requirement changes that these immature individuals undergo may influence their distribution at-sea behaviors and use of the platforms throughout the year Orr et al (2012) reported that yearlings and juveniles instrumented with satellite tags at San Miguel Island were primarily distributed in areas around the northern California Channel Islands and on the continental shelf near Point Conception California which are locations in close proximity to the oil and gas platforms in the Santa Barbara Channel Seasonal changes in prey availability [eg spawning of market squid (Doryteuthis opalescens)] also may strongly influence where juveniles fed and rested
27
California sea lion pups were seen the least of any agesex class During their first 6 months of life they are dependent exclusively on their mothers for nutrition (Orr et al2012) As pups grow and develop they begin to attain the necessary morphological and physiological characteristics as well as the motor skills to swim and transition from dependence to foraging in the marine environment At approximately 6-months of age they begin to supplement their diet with prey acquired at sea (Orr et al 2012) This wasreflected by the presence of pups at Platform Gina as early as January Their numbers increased during the spring until June when they were weaned and considered juveniles after their first birthday Apart from the natural history aspects of California sea lions and aforementioned factors (eg tidal heights sea state disturbance from the arrivaldeparture of crew boatsor crew activities) their numbers may have fluctuated temporally because ofenvironmental conditions Environmental conditions strongly affect the annual and seasonal variability in prey distribution availability and abundance These attributes of prey may also be influenced by potentially longer- or larger-scale periodic anomalies orperturbations [eg the North Pacific heat wave (formally termed ldquothe Blobrdquo (Bond et al 2015) and El Nintildeo] The North Pacific heat wave was a warm-water mass that startedduring fall 2013 when the usual winter storms in the Gulf of Alaska that cool the North Pacific Ocean did not occur This resulted in an expanse of warm water that by summer 2014 spanned 3200 km from Alaska to Baja Mexico and stretched 800 km wide (Almasy et al 2015 Bond et al 2015 Kintisch 2015) It was observed that many individuals of some species died and others behaved abnormally (Almasy et al 2015) Even prior to the NorthPacific heat wave and the 2015-2016 El Nintildeo the National Marine Fisheries Service 28
declared an Unusual Mortality Event in March 2013 in response to high numbers of stranded California sea lion pups on southern California beaches (Melin and DeLong 2014)Pups at San Miguel and San Nicolas islands (the two largest California sea lion rookeries) exhibited low growth with pups weighing ~10 kg (~40) less (on average) than normal at 7 months of age (Melin and DeLong 2014) One hypothesis for the poor condition of pups was that prey distribution and abundance changed such that it was difficult for theirmothers to find enough food for self-maintenance and nutrition for their pups The stranding of pups on mainland California beaches indicated that the pups weaned early and sought to forage at sea because their mothers were not able to support them nutritionally (Melin and DeLong 2014) Warmer less productive waters persisted in the eastern Pacific Ocean during this study Therefore the presence of pups on the platforms as early as January suggests that many were weaned early and foraged at sea in order to survive Inter-platform (Spatial) Comparisons There was no discernible latitudinal pattern in the use of the platforms by California sea lions Rather size or space on the platform (ie the amount of structure that was available and accessible to use) location and human activities (eg maintenance)appeared to be more important factors Fencing and platform activities severely limited haul-out space on all platforms except Platform Habitat at various times during the studywhich had a direct effect on the numbers of California sea lions counted Some of the fencing was a permanent barrier however some of it was set up temporarily PlatformHabitat was not necessarily one of the larger facilities but it had many large pipes and supporting structures that provided areas where sea lions could rest Sea lions were
29
observed occupying most of the lower-level deck Platform Gina on the contrary was one of the smaller platforms where camera-systems were deployed Although there were other areas that sea lions could have used they predominantly used the landing decks stairs and periphery of the lower-level deck Overall the animals used Platform Heritage slightlymore than Platform Harvest Whereas both platforms are north and relatively close to San Miguel Island Platform Heritage is south of Point Conception within the southernCalifornia Bight which provides a lee from the prevailing north-west winds Wind and sea-state conditions are calmer at Platform Heritage compared to Platform Harvest California sea lions were abundant on Platform Elly as well It is east of Santa Barbara San Clementeand San Nicolas islands Notables During our travels tofrom the platforms while we were installing and servicing the camera systems and from our examinations of images we noted California sea lions withcharacteristics or engaging in activities that enhanced our understanding of their ecology and how they use offshore platforms Above the water surface the offshore platforms provided structure and space for animals like pinnipeds gulls (Larus spp) brown pelicans (Pelecanus occidentalis) and cormorants (Phalacrocorax spp) to rest and peregrine falcons (Falco peregrinus) to nestand hunt Below the water surface the gas and oil platforms provided structure and habitat for various invertebrate and fish communities Consequently areas beneath and aroundthe platforms were habitats that California sea lions (among other species) could exploit for foraging Love et al (2006) noted that the offshore platforms harbor three fish
30
assemblages 1) ones that inhabit the shell mound area surrounding the base of the platform 2) those that utilize the areas adjacent to the platform bottom and 3) ones that occupy the midwater Rockfishes (Sebastes spp) predominate these assemblages (Love et al 2006) Rockfishes are known prey of California sea lions (Antonelis et al 1984 Lowryet al 1991 Melin et al 2008 Orr et al 2011) and were seen being consumed by sea lions during our visits to the platforms (Fig 11) Spiny dogfish (Squalus acanthias) were alsoseen being eaten by the sea lions during the study (Fig 11) We observed schools of fish within a kilometer of the platforms being attacked by several predators including California sea lions common dolphins (Delphinus delphis or D capensis) minke whales(Balaenoptera acutorostrata) gulls brown pelicans and cormorants (Fig 11)Adult female California sea lions were observed nursing their young (includingpups yearlings and juveniles Fig 12) on the offshore platforms This is notable because Melin et al (2000) examined the at-sea distribution and diving behaviors of adult femaleCalifornia sea lions and adult female-pup pair attendance patterns and concluded that pups did not accompany their mothers to sea on foraging trips Our observations indicated that some pups and older conspecifics follow their mothers from rookeries (eg Santa Barbara San Clemente San Miguel and San Nicolas islands) to foraging areas Dispersal of mother-pup Steller sea lion pairs from natal rookeries has been documented as well (Calkins andPitcher 1982 Merrick et al 1988 Raum-Suryan et al 2002 2004) Dead premature pups were also seen on the offshore platforms during the study period Premature birthing can occur at any place including the water so we did not believe that the adult females were selecting the platforms to give birth Rather they delivered the fetus prior to arriving at their rookery 31
California sea lions that were marked (branded andor flipper-tagged) fordemographic studies on San Miguel Island or in the Pacific Northwest conducted by the MML were observed using the gas and oil platforms or adjacent waters (Fig 13)Individuals that were rehabilitated flipper-tagged and released by one of the rehabilitation centers in central or southern California also were seen using the platforms (Fig 13)Additionally pups that were instrumented with satellite instruments by researchers at Hubbs-Sea World Research Institute (San Diego California) during the 2013 UnusualMortality Event were observed on the offshore facilities Further examination of additionalimages obtained during this study may provide insight about the dispersal and movements of marked California sea lions for these various studiesCalifornia sea lions (and harbor seals) depredate fish caught by anglers using line orgillnets The animals may follow fishing vessels and subsequently take fish that have been caught and being reeled in While trying to capture the fish these predators may gethooked with the fishing gear Gillnets may be difficult for these animals to detect subsequently they might swim into or through the nets Those that are not caught in the nets might still be entangled with pieces of the net around their neck or body (Fig 14a) As the animal grows the net can cut into their body and eventually kill the animal Many sea lions on the platforms had fishing line or remnants of gill nets wrapped around themFurther examination of additional images collected during this study may provideinformation about the type of gillnets being used and which animals primarily are being entangledThe main predators of California sea lions include killer whales and sharks The incidence of shark predation or attacks by great white (Carcharodon carcharias) and mako 32
sharks (Isurus oxyrinchus) on California sea lions have appeared to increase during the past several years perhaps partly due to the recovery of these shark species (Long et al 1996)We observed several sea lions on the platforms that exhibited evidence of interactions withsharks (ie bite or teeth-rake lesions Fig 14b) With further examination of the images collected during this study one may gain insight about which species of shark are attacking sea lions what part of the body they are striking and the agesex class of sea lions they are targetingCalifornia sea lions generally are skittish around humans On the spectrum of fight-or-flight responses they will usually flee from humans until they are far enough away on land that they feel comfortable or if they are in the water This behavior was not observedon the platforms The sea lions often had to be coaxed to move Therefore it should be noted that crew activities may not have necessarily adversely affected the sea lions Conclusions The platforms provide benefits to pinnipeds (esp California sea lions) Whereas some human activities may be disruptive to resting pinnipeds the overall benefit of having a structure to rest in areas where pinnipeds feed or along foraging routes likely outweighed any negative impacts of human disturbance The temporal and spatial variability in number of California sea lions using the platforms was pronounced for some platforms and minimal at others They were observed on the platforms year-round andduring all hours of the day Most of the identified animals were juveniles howeverproportionally relatively few of the animals were identified to a particular agesex class in
33
comparison to all counted individuals Therefore caution should be taken when using or interpreting findingsWe only analyzed images during periods when all camera systems were operational on a given platform for consistency in interpreting results Many images remain to be examined and analyzed which may result in a better resolution of our understanding of usage of the offshore oil and gas platforms by pinnipeds Analyses of additional images may also be useful for other projects For example we now have empirical evidence that some California sea lion pups and juveniles travel with their mothers to areas a good distance away from their rookeries Marked individuals were found using the platforms It may be possible to examine their residency times and general movement patterns if they are seen at different platforms or other haulouts where either camera systems or observers are located From examining images of individuals entangled in fishing gear it may be possible to get an idea of the quantity of entanglement and information about the fishinggearfishery for management purposes Useful information may also be obtained from images with individuals with shark bite lesions such as agesex class of sea lion species of predator and location During this study we obtained information about the use of oil and gas platforms by pinnipeds in support of analyses pursuant to the NEPA and MMPApermitting requirements by owners of the offshore facilities when they are decommissioned as well as a greater understanding of the ecology of pinnipeds in southern California waters
34
ACKNOWLEDGMENTS We would like to thank the owners and operators of the platforms including BetaOffshore (Platform Elly) DCOR (Platforms Gina and Habitat) Exxon Mobil (Platform Heritage) and Plains Exploration and Production Company (PXP Platform Harvest) We also extend our gratitude to the Bureau of Safety and Environmental Enforcement for their knowledge and assistance when accessing platforms by helicopter the boat operators forproviding the majority of the transportation tofrom the platforms and the platform crews who helped us perform our work in a safe and expeditious manner We thank Alexey Altukhov for his help and guidance in the design of the database and camera systems We also thank Trail Watcher Game Cameras for designing and building the camera systems We extend our gratitude to L Fritz and P Gearin for reviewing this manuscript This study was funded in part by the US Department of the Interior Bureau of Ocean Energy Management (BOEM) Environmental Studies Program Washington DC through Inter-Agency Agreement Number M12PG00027 with the National Marine Fisheries ServiceAlaska Fisheries Science Center This report has been technically reviewed by BOEM and it has been approved for publication
35
REPORT AVAILABILITYMetadata for this study is provided in InPort NMFS Enterprise Data Management Program (httpsinportnmfsnoaagov) Dataset ID 26353 Data for this study is archived at NOAA National Centers for Environmental Information (httpsnodcnoaagov) PackageReference ID R1B85T
37
CITATIONSAlmasy S D Hennen and J Gray 2015 Blob of warm Pacific water threatens ecosystem may intensify drought httpwwwcnncom20150422uspacific-ocean-blobAccessed 5 April 2016 Antonelis G A C H Fiscus and R L DeLong 1984 Spring and summer prey of California sea lions Zalophus californianus at San Miguel Island California 1978-79 Fish Bull US 8267-76 Antonelis G A B S Stewart and W F Perryman 1990 Foraging characteristics of female northern fur seals (Callorhinus ursinus) and California sea lions (Zalophus
californianus) Can J Zool 68150-158 Baker J D and M J Donohue 2000 Ontogeny of swimming and diving in northern fur seal (Callorhinus ursinus) pups Can J Zool 78100-109 Bond N A M C Cronin H Freeland and N Mantua 2015 Causes and impacts of the 2014 warm anomaly in the NE Pacific Geophys Res Lett 423414-3420httpdxdoiorg1010022015GL063306 Burkanov V A Altukhov and T S Gelatt 2014 Long-term surveillance of SSL rookeries with time-lapse cameras in Russia and Alaska Presented as poster presentation atAlaska Marine Science Symposium Anchorage Alaska 20-24 January 2014 251 p
39
Burkanov V A Altukhov and T S Gelatt 2015 Using high-resolution time-lapse photo cameras for long-term surveillance of the Steller sea lion rookeries and haulouts Vth International Wildlife Management Congress Sapporo Hokkaido Japan 26-30July 2015 97 p Burns J M 1999 The development of diving behavior in juvenile Weddell seals Pushingphysiological limits in order to survive Can J Zool 77737-747 Calkins D G and K W Pitcher 1982 Population assessment ecology and trophicrelationships of Steller sea lions in the Gulf of Alaska p 447-546 In Environmental Assessment of the Alaska Continental Shelf US Department of Commerce and USDepartment of Interior Final Reports of Principal Investigators Volume 19 Feldkamp S D R L DeLong and G A Antonelis 1989 Diving patterns of California sea lions Zalophus californianus Can J Zool 67872-883 Fowler S L D P Costa J P Y Arnould N J Gales and J M Burns 2007a Ontogeny of oxygen stores and physiological diving capacity in Australian sea lion Funct Ecol21922-935 Fowler S L D P Costa and J P Y Arnould 2007b Ontogeny of movements and foragingranges in the Australian sea lion Mar Mammal Sci 23598-614
40
Gearin P J S R Melin R L DeLong M E Gosho and S J Jeffries 2017 Migration patterns of adult male California sea lions (Zalophus californianus) US Dep Commer NOAA Tech Memo NMFS-AFSC-346 29 p Heath C B 1989 The behavioral ecology of the California sea lion Zalophus californianusPhD dissertation Univ California Santa Cruz Santa Cruz California 510 p Horning M and F Trillmich 1997 Development of hemoglobin hematocrit and erthyrocyte values in Galapagos fur seals Mar Mammal Sci 13100-113 Kintisch E 2015 ldquoThe Blobrdquo invades Pacific flummoxing climate experts Science 34817-18 httpdxdoiorg101126science348623017 Kuhn C E 2006 Measuring at sea feeding to understand the foraging behavior of pinnipeds PhD dissertation Univ California Santa Cruz Santa Cruz California 129 p Kuhn C E and D P Costa 2014 Interannual variation in the at-sea behavior of California sea lions (Zalophus californianus) Mar Mammal Sci 301297-1319 doi101111mms12110
41
Long D J K D Hanni P Pyle J Roletto R E Jones and R Bandar 1996 White shark predation on four pinniped species in central California waters Geographic and temporal patterns inferred from wounded carcasses p 263-274 In Klimley AP and DG Ainley (eds) Great White Sharks the Biology of Carcharodon carchariasLondon Academic Press Lowry M S B S Stewart C B Heath P K Yochem and J M Francis 1991 Seasonal andannual variability in the diet of California sea lions Zalophus californianus at San Nicolas Island California 1981-86 Fish Bull US 89331-336 Love M S D M Schroeder W Lenarz A MacCall A S Bull and L Thorsteinson 2006Potential use of offshore marine structures in rebuilding an overfished rockfishspecies bocaccio (Sebastes paucispinis) Fish Bull US 104383-390 Melin S R R L DeLong J R Thomason and G R VanBlaricom 2000 Attendance patterns of California sea lion (Zalophus californianus) females and pups during the non-breeding season at San Miguel Island Mar Mammal Sci 16169-185 Melin S R R L DeLong and D B Siniff 2008 The effects of El Niῆo on the foraging behaviour of lactating California sea lions (Zalophus californianus californianus)during the nonbreeding season Can J Zool 86192-206
42
Melin S R and R L DeLong 2014 Spring and summer foraging behavior of lactating California sea lions at San Miguel Island California during the 2013 UnusualMortality Event Final Report for the Waitt Foundation 30 pMerrick R L P J Gearin S Osmek and D E Withrow 1988 Field studies of northern sea lions at Ugamak Island Alaska during the 1985 and 1986 breeding seasons USDepart Commer NOAA Tech Memo NMFS FNWC-143 60 pNational Marine Fisheries Service (NMFS) 2013 Status review of the eastern distinctpopulation segment of Steller sea lion (Eumetopias jubatus) Protected Resources Division Alaska Region National Marine Fisheries Service 709 West 9th Street Juneau Alaska 99802 144 pp + appendices Odell D K 1975 Abundance of California sea lions on San Nicolas Island California WildlManage 39729-736 Ono K 1991 Introductory remarks and the natural history of the California sea lion 109-112 p In F Trillmich and K Ono (eds) Pinnipeds and El Nintildeo Responses to Environmental Stress Springer-Verlag New York Orr A J G R VanBlaricom R L DeLong V H Cruz-Escalona and S D Newsome 2011Intraspecific comparison of diet of California sea lions (Zalophus californianus)assessed using fecal and stable isotope analyses Can J Zool 89109-122
43
Orr A J S D Newsome J L Laake G R VanBlaricom and R L DeLong 2012 Ontogenetic dietary information of the California sea lion (Zalophus californianus) assessed using stable isotope analysis Mar Mammal Sci 28714-732 Peterson R S and G A Bartholomew 1967 The natural history and behavior of the California sea lion Amer Soc Mammal Stillwater Oklahoma Pitcher K W P F Olesiuk R F Brown M S Lowry S J Jeffries J L Sease W L Perryman C E Stinchcomb and L F Lowry 2007 Abundance and distribution of the eastern North Pacific Steller sea lion (Eumetopias jubatus) population Fish Bull US 107102-115 R Core Team 2015 R A language and environment for statistical computinghttpswwwR-projectorg Raum-Suryan K L K P Pitcher D G Calkins J L Sease and T R Loughlin 2002Dispersal rookery fidelity and metapopulation structure of Steller sea lions (Eumetopias jubatus) in an increasing and a decreasing population in Alaska MarMammal Sci 18746-764
44
Raum-Suryan K L M J Rehberg G W Pendleton K W Pitcher and T S Gelatt 2004Development of dispersal movement patterns and haul-out use by pup and juvenile Steller sea lions (Eumetopias jubatus) in Alaska Mar Mammal Sci 20823-850 Reeves R R B S Stewart and S Leatherwood 1992 The Sierra Club handbook of seals and sirenians Sierra Club Books San Francisco 359 p Weise M J D P Costa and R M Kudela 2006 Movement and diving behavior of male California sea lion (Zalophus californianus) during anomalous oceanographic conditions of 2005 compared to those of 2004 Geophys Res Lett 33 L22S10 DOI1010292006GL027113 Wright B E M J Tennis and R F Brown 2010 Movements of male California sea lions captured in the Columbia River Northwest Sci 8460-72httpdxdoiorg1039550460840107
45
Table 1 -- Tasks and dates of visitation to oil and gas platforms in federal waters off the southern California Bight Camera systems were deployed on the platforms to document their usage by pinnipeds between January 2013 and January 2015 Trip
1 PurposeReconnai Dates 30 Octob 7 Platforms All 23
Notes
2 ssance er - November 2012 E Habitat3
Camera systeminstallation 7-10 January 2013 7-12 February 2013
lly Gina Herit HarvestElly Gina Habitat4
Data retrieval maintenance
age Herit HarvestElly Gina Habitat Camera 1 removed from 5
Data retrieval maintenance 9-14 April 2013 4 - 7 and 25 June
age Herit HarvestEll Gi Harvest 6
Data retrieval maintenance 201320 - 24 2013
ageyHeri na Habitat t HarvestElly Gina Habitat7
Data retrieval maintenance August 12 - 22 Novemb
age Herit HarvestEll Gi8
Data retrieval maintenance er 2013 2
ageyHeri na Habitat t HarvestEll Gi10
Data retrieval maintenance 24 February -23 March 2014 and20 - 24 May 2014
ageyHeri na Habitat t HarvestEll Gi11
Data retrieval maintenance 18 - 31 2014
ageyHeri na Habitat t HarvestElly Gina Habitat12
Data retrieval maintenance August 1 - 6 December 2014
age Herit HarvestElly Gina Habitat13
Data retrieval maintenance 12 - 17 Jage Herit HarvestE HabitatData retrieval camera systemremoval anuary 2015 agelly Gina Heritage Harvest
47
Table 2 -- Months during which at least one camera system located at a focal gas and oil platform was not operational or not set up (eg January 2013 for Platform Harvest) Data were not analyzed during those months Platform 2013 2014 2015Elly January Apriebruary MarchApril May March F l
October NovemberGina January December January
Habitat January February January Heritage September October September OctoberHarvest January November
48
Table 3 -- Crew boat departure to (Platforms Elly Gina and Habitat) or arrival at(Platform Heritage) platform times Actual arrival times to platforms were dependent on weather and sea-state conditions and activities of the crew but usually within 15 hours Crew exchanges on Platform Harvest were primarily done by helicopter Platform Mon Tue Wed Thr Fri Sat SunElly 0500h 0500h 0500h 0500h 0500h 0500h 0500h (Depart to) 0700h 0700h 0700h 0700h 0700h 0700h 0700h 1000h 1000h 1000h 1000h 1000h 1000h 1000h 1600h 1600h 1600h 1600h 1600h 1600h 1600h
Gina 0645h 0645h 0645h 0530h 0645h 1400h 1400h (Depart to) 1400h 1000h 1400h 1400h 1000h 1400h 1730h 1730h 1400h
Habitat 0630h 0630h 0630h 0630h 0630h 0630h 0630h (Depart to) 0830h 0830h 0830h 0830h 0830h 0830h 0830h 1430h 1430h 1430h 1430h 1430h 1430h 1430h 1830h 1830h 1830h 1830h 1830h 1830h 1830h
Heritage 0900h 0900h 0900h 0715h 0900h 0900h 0900h (Arrive) 1830h 1200h 1200h 0900h 1830h 1830h 1830h 1830h 1830h 1200h 2300h 1830h Harvest Helicopter
49
Figure 1 -- Several of the 23 oil and gas proisited during October and November 2012 tosouthern California that were v
duction platforms in federal waters offshore evaluate for the installation of time-lapse camera systems to document the use of the platforms by pinnipeds
50
120deg00W 115deg00W
plusmn 0 60 120 180 24030
Kilometers
120deg00W
California
Mexico
Elly
GinaHabitat
Heritage HarvestSan Miguel Is San Nicolas Is Los Angeles Santa Barbara IsSan Clemente Is
40deg00N
40deg00N
35deg00N
35deg00N
Figure 2 -- Locations of gas and oil platforms located in the Pacific Outer Continental Shelf Region offshore southern California where time-lapse camera systems were installed to document the use of the platforms by pinnipeds between January 2013 and January 2015 The offshore platforms included (from south to north) Platform Elly (Beta Offshore San Pedro Bay) Platform Gina (DCOR Point Hueneme Unit) Platform Habitat (DCOR Pitas Point Unit) PlatformHeritage (Exxon Mobil Santa Ynez Unit) and Platform Harvest (Plains Exploration and Production Company (PXP)Freeport McMoran PointArguello Unit)
51
Figure 3 -- Digital automated time-lapse camera systems (developed by Trail Watcher Game Cameras Monticello Georgia) that were installed on five gas and oilplatforms offshore southern California and programmed to take images between January 2013 and January 2015 The systems consistedcircuit a camera and battery bank They were placed in locati of a timing ere most areas where pinnipeds could be viewed were covered ons wh
52
Camera 1 Camera 2
Camera 3
Figure 4 -- The number placement and viewing angle of cameras were considered to maximize viewing coverage of where pinnipeds used the platforms
53
Figure 5 -- Example of an image viewed and individual animals marked according to agesex class Identifications were automatically tabulated for analyses
54
Figure 6 -- An example of images of a platform that were selected from different time blocks from the subsampling protocol Rows represent different cameras (ieareas of the platform) during the same hour Columns represent different hours of the day
55
(a)
(b)
Figure 7 -- Pinniped species observed at or near the gas and oil platforms besides the California sea lion (Zalophus californianus) included (a) Steller sea lion(Eumetopias jubatus) and (b) Pacific harbor seal (Phoca vitulina richardii)
56
0255075100125
Med
ian
0100200300400500
J F M A M J J A S O N D J F M A M J J A S O N D J
Max
imum
2013 2014 2015
Elly Gina Habitat Heritage Harvest 150
Month
Figure 8 -- Monthly median (top) and maximum (bottom) counts of California sea lionsContinental Shelf RegZalophus californianus) on gas and oil platforms located in the Pacific Outer ( ion offshore southern California from January 2013 toJanuary 2015 Platforms are listed in order from south to north
57
0
50
100
150
Med
ian
Max
imum
0100200300400500
0 2 4 6 8 10 12 14 16 18 20 22 0 2 4 6 8 10 12 14 16 18 20 222013 2014
Elly Gina Habitat Heritage Harvest
Hour
Figure 9 -- Hourly median (top) and maximum (bottom) counts of California sea lions Continental Shelf RegZalophus californianus) on gas and oil platforms located in the Pacific Outer ( ion offshore southern California during 2013 and 2014 Platforms are listed in order from south to north
58
Pup Juvenile Adult female Mature male Elly Gina 100806
J F M A M J J A S O N D J F M A M J J A S O N D J J F M A M J J A S O N D J F M A M J J A S O N D J
16 12 10 43 273 128 348 401 516 708 122 126 167 522 452 508 171 702 858 264742 2434 809 1161 677 1458 788 422 195 272 749 422 419 228275696 638 338233149 122 459 704 718 220345304292497122 780142 470602 385 651 634491521613 308 956 612 838372 323724 880634 399 791286 481 402 1086 700 969 4518921462 487 220
Heritage Harvest 040200
100806
Prop
orti
on
000420
2013 2014 20152013 2014 2015
Month
Figure 10 -- Proportion of California sea lions (specific agesex class [(from south (top left) to norZalophus californianus) using gas and oil platforms that were identified to a th (bottom right)] by month from January 2013 throughJanuary 2015 Numbers within bars indicate total number of animals identified during that month 59
Figure 11 -- California sea lions (Zalophus californianus) feeding in waters adjacent to gas and oil platforms Sometimes feeding occurs along with other animals including cetaceans and sea birds
60
Figure 12 -- Adult female California sea lions (Zalophus californianus) nursing pup (left)and juvenile (right) while hauled out on gas and oil platforms during thestudy period
61
(a)
(b)
(c)
Figure 13 -- Marked (ie (a) tagged (b) branded or (c) instrumented) California sea lions (Zalophus californianus) were seen on and around the gas and oil platforms during the study area Marked individuals included those that were a) were rehabilitated and tagged at The Marine Mammal Center Sausalito CA and b) tagged andor branded by the Marine Mammal Laboratory Seattle WA for demographic studies on San Miguel Island WA or in the Pacific Northwest
62
(a)
(b)
Figure 14 -- California sea lions (platforms exhibiting signs of encounters with Zalophus californianus) hauled out on gas and oil(a) fisheries (eg monofilamentfishing line) and (b) sharks (eg lesions)
63
APPENDICES
64
Appendix Figure 1 -- Box-and-whisker plots of California sea lions counted on gas and oil platforms (from south-top to north-bottom) by month during 2013 Note some of the tops of plots for Platform Habitat could not be displayed because they exceeded the range of the y-axis
66
Appendix Figure 2 -- Box-and-whisker plots of California sea lions counted on gas and oil platforms (from south-top to north-bottom) by month during 2014 Note some of the tops of plots for Platform Habitat could not be displayed because they exceeded the range of the y-axis 67
Appendix Figure 3 -- Box-and-whisker plots of California sea lions counted on gas and oil platforms (from south-top to north-bottom) by month during January 2015 68
-- - -Appendix Figure 4 Box and whisker plots (including the minimum 25th quartile median 75th quartile and maximum) of California sea lions counted on gas and oil platforms (from south-top to north-bottom) by hour during 2013 Note some of the tops of plots for Platform Habitat could not be displayed because they exceeded the range of the y-axis 69
-- Appendix Figure 5 Box-and-whisker plots of Calnorth-bottom) by hour ifornia sea lions counted on gas and oil platforms (from south-top to during 2014 Note some of the tops of plots for Platform Habitat could not be displayed because they exceeded the range of the y-axis
70
Appendix Figure 6 -- Box-and-whisker plots of California sea lions counted on gas and oil platforms (from south-top to north-bottom) by hour during January 2015 71
RECENT TECHNICAL MEMORANDUMS
Copies of this and other NOAA Technical Memorandums are available from the National Technical Information Service 5285 Port Royal Road Springfield VA 22167 (web site wwwntisgov) Paper and electronic (pdf) copies vary in price
AFSC-
361 MCCONNAUGHEY R A K E BLACKHART M P EAGELTON and J MARSH 2017
Habitat assessment prioritization for Alaska stocks Report of the Alaska Regional Habitat Assessment Prioritization Coordination Team US Dep Commer NOAA Tech Memo NMFS-AFSC-361 102 p NTIS number pending
360 TURNER K C N ROOPER E A LAMAN S C ROONEY D W COOPER and M ZIMMERMANN 2017 Model-based essential fish habitat definitions for Aleutian Island groundfish species 239 p NTIS number pending
359 RODGVELLER C J P W MALECHA and C R LUNSFORD 2017 Long-term survival and
observable healing of two deepwater rockfishes Sebastes after barotrauma and subsequent recompression in pressure tanks 37 p NTIS No PB2017-102716
358 FAUNCE C J SULLIVAN S BARBEAUX J CAHALAN J GASPER S LOWE and R WEBSTER 2017 Deployment performance review of the 2016 North Pacific Groundfish and Halibut Observer Program US Dep Commer NOAA Tech Memo NMFS-AFSC-358 75 p NTIS No PB2017-102715
357 LAMAN E A C N ROOPER S C ROONEY K A TURNER D W COOPER and M ZIMMERMANN 2017 Model-based essential fish habitat definitions for Bering Sea groundfish species 75 p NTIS No PB2017-102512
356 CSEPP D J D C HONEYFIELD J J VOLLENWEIDER and J WOMBLE 2017 Estuarine distribution nutritional and thiaminase content of eulachon (Thaleichthys pacificus) in Southeast Alaska with implications for Steller sea lions 56 p NTIS No No PB2017-102383
355 M M MUTO V T HELKER R P ANGLISS B A ALLEN P L BOVENG J M BREIWICK M F CAMERON P J CLAPHAM S P DAHLE M E DAHLHEIM B S FADELY M C FERGISON L W FRITZ R C HOBBS Y V IVASHCHENKO A S KENNEDY J M LONDON S A MIZROCH R R REAM E L RICHMOND K E W SHELDEN R G TOWELL P R WADE J M WAITE and A N ZERBINI 2017 Alaska marine mammal stock assessments 2016 366 p NTIS No PB2017-102381
354 HELKER V T M M MUTO K SAVAGE S TEERLINK L A JEMISON K WILKINSONand
J JANNOTT 2017 Human-caused mortality and injury of NMFS-managed Alaska marine mammal stocks 2011-2015 US Dep Commer NOAA Tech Memo NMFS-AFSC-354112 p NTIS No PB2016102765
353 CONNER J D G NICHOL and R R LAUTH 2017 Results of the 2015 eastern Bering Sea continental shelf bottom trawl survey of groundfish and invertebrate resources 154 p NTIS No PB2017-102385
352 CONNER J and R R LAUTH 2017 Results of the 2016 eastern Bering Sea continental shelf bottom trawl survey of groundfish and invertebrate resources159 p NTIS No PB2017-102386
351 GODDARD P R E WILBORN C N ROOPER K WILLIAMS and R TOWLER 2017 Results of
the 2012 and 2014 underwater camera surveys of the Aleutian Islands 505 p NTIS No PB2017-102387
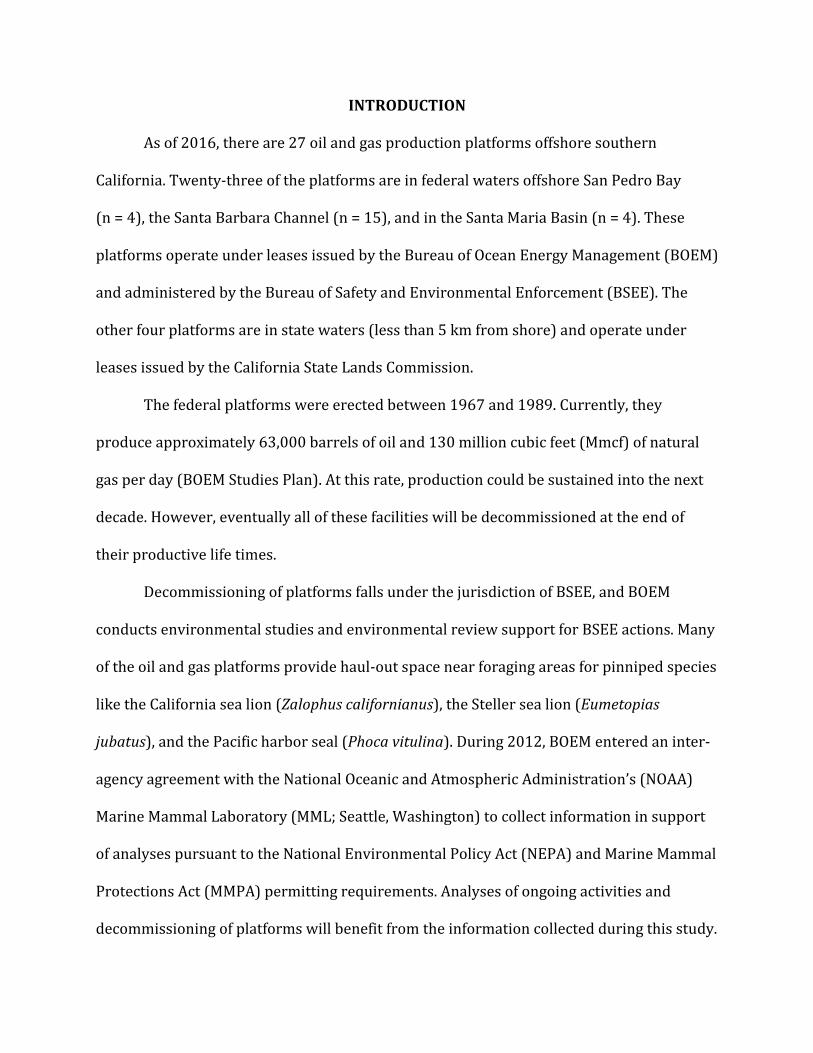
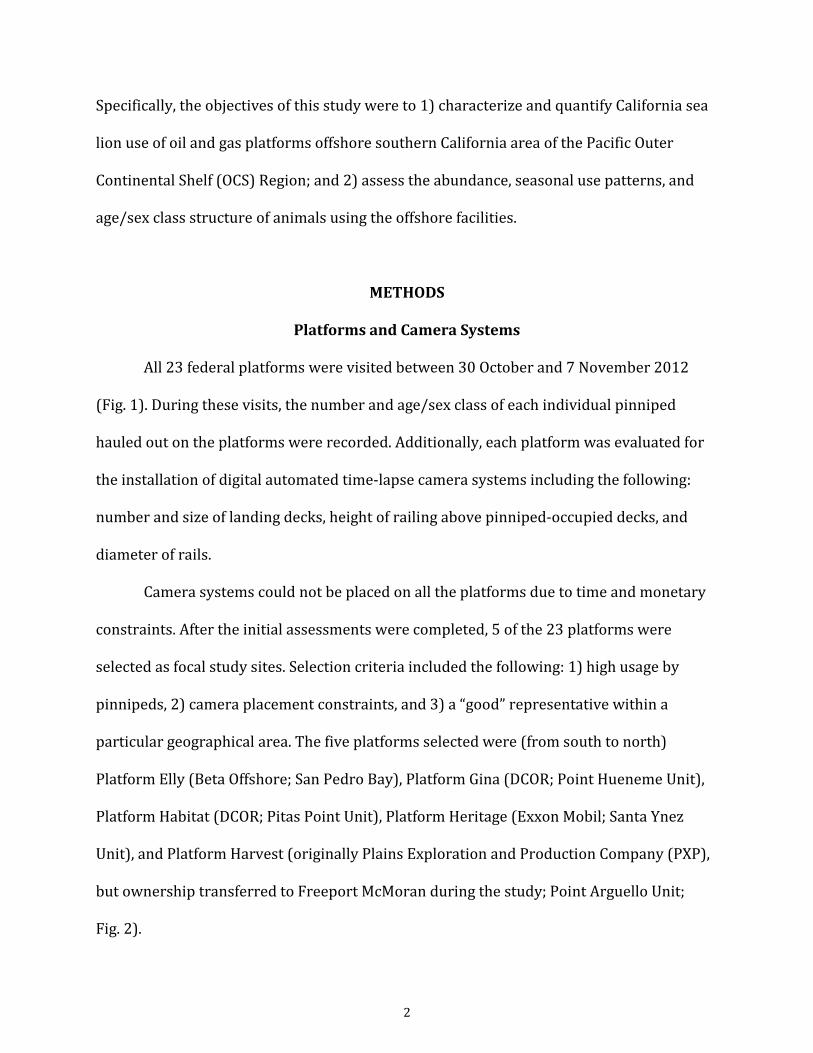
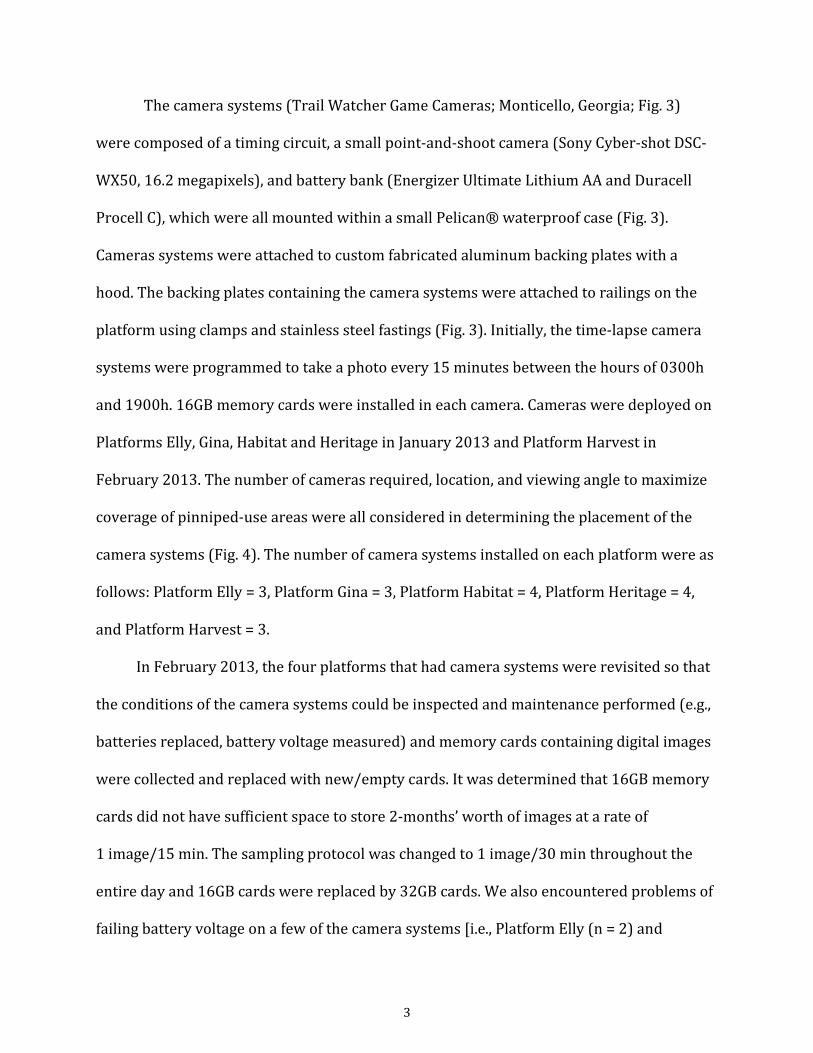
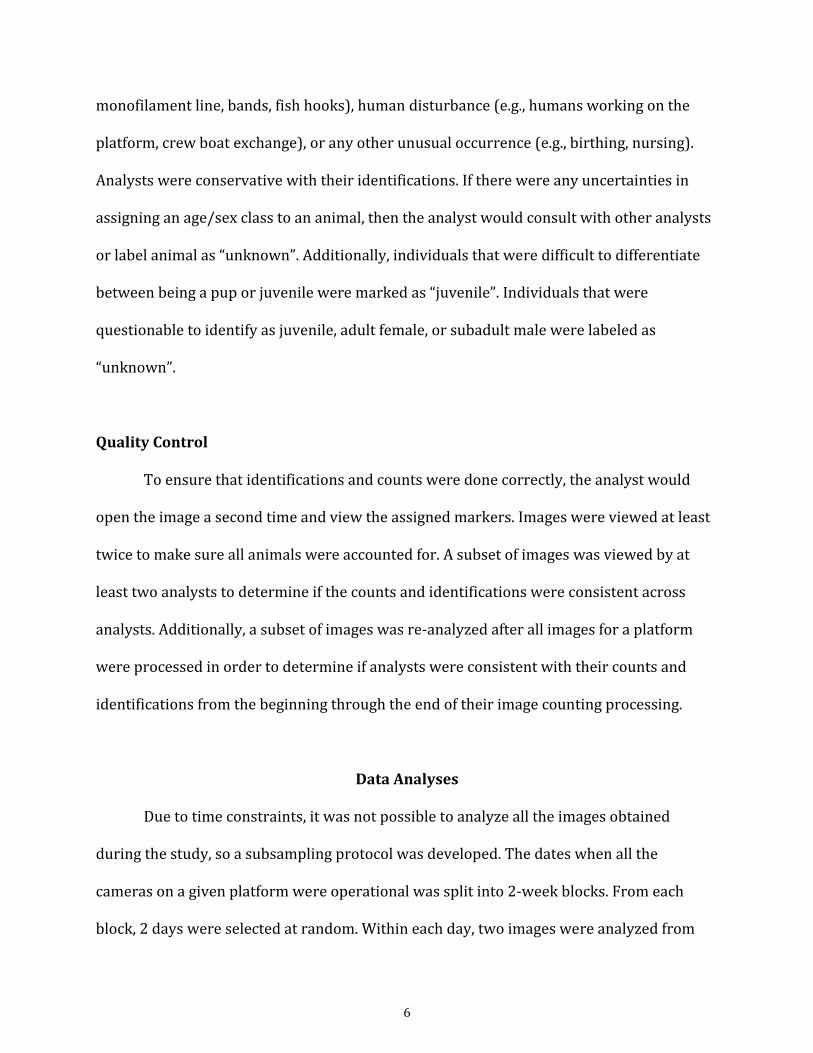
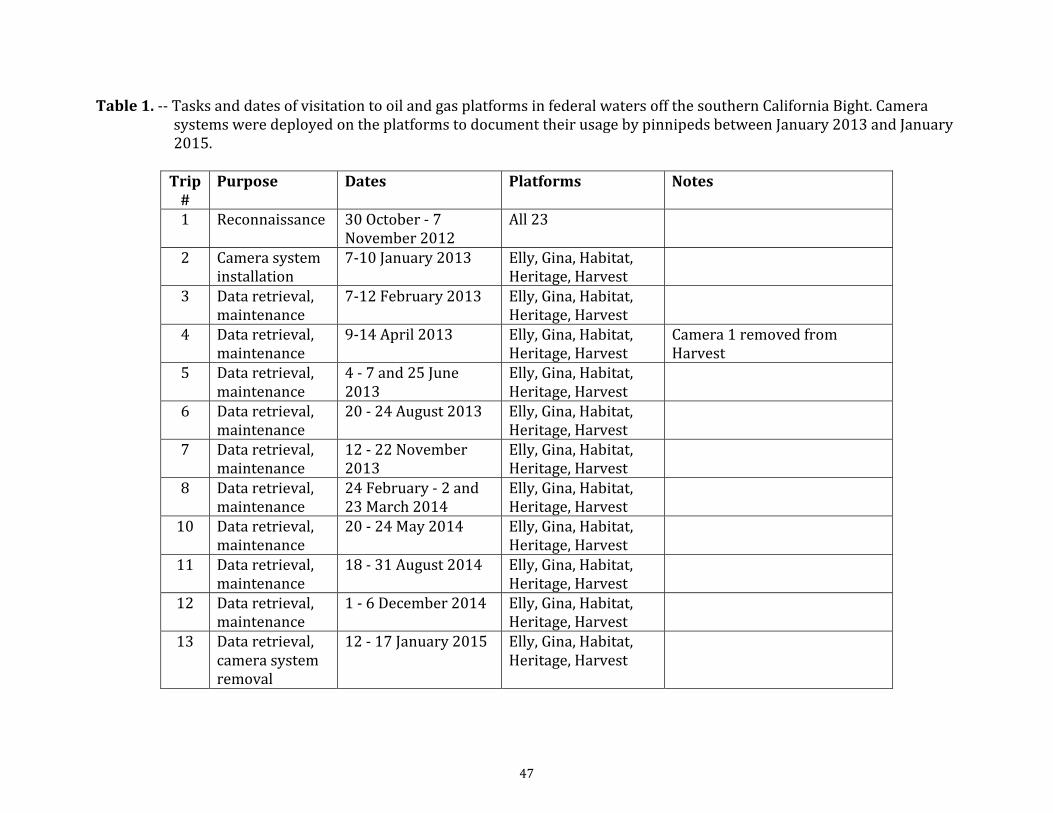
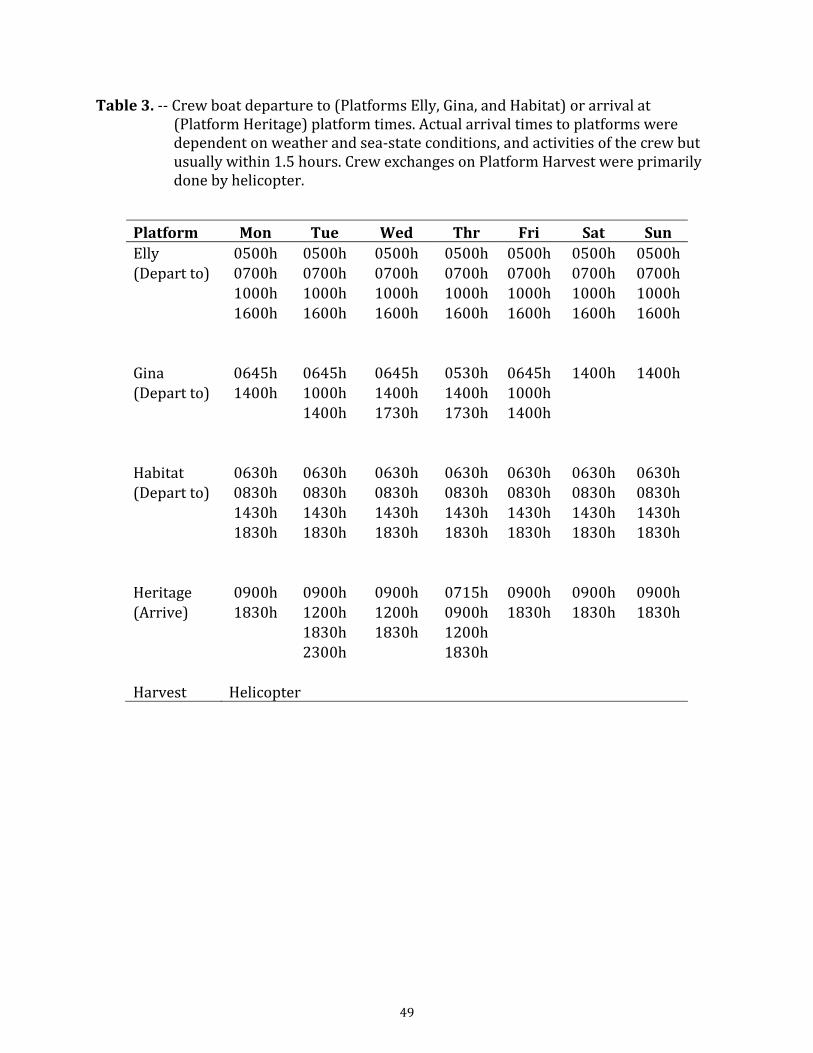
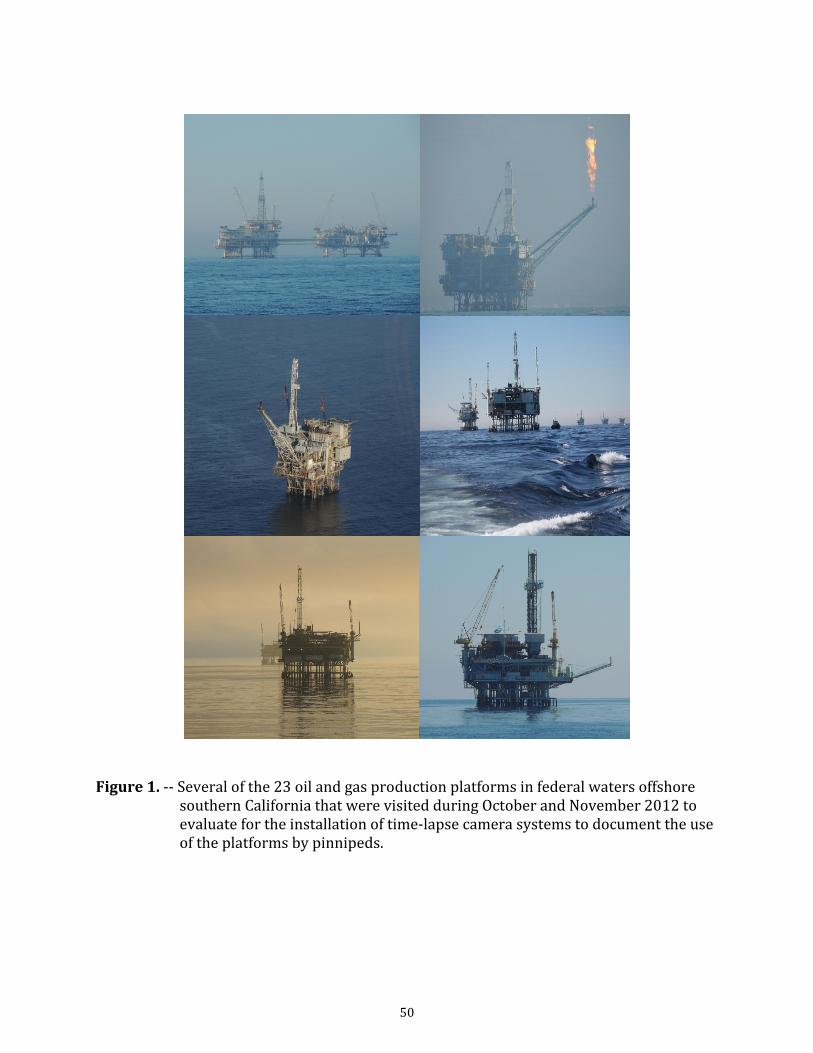
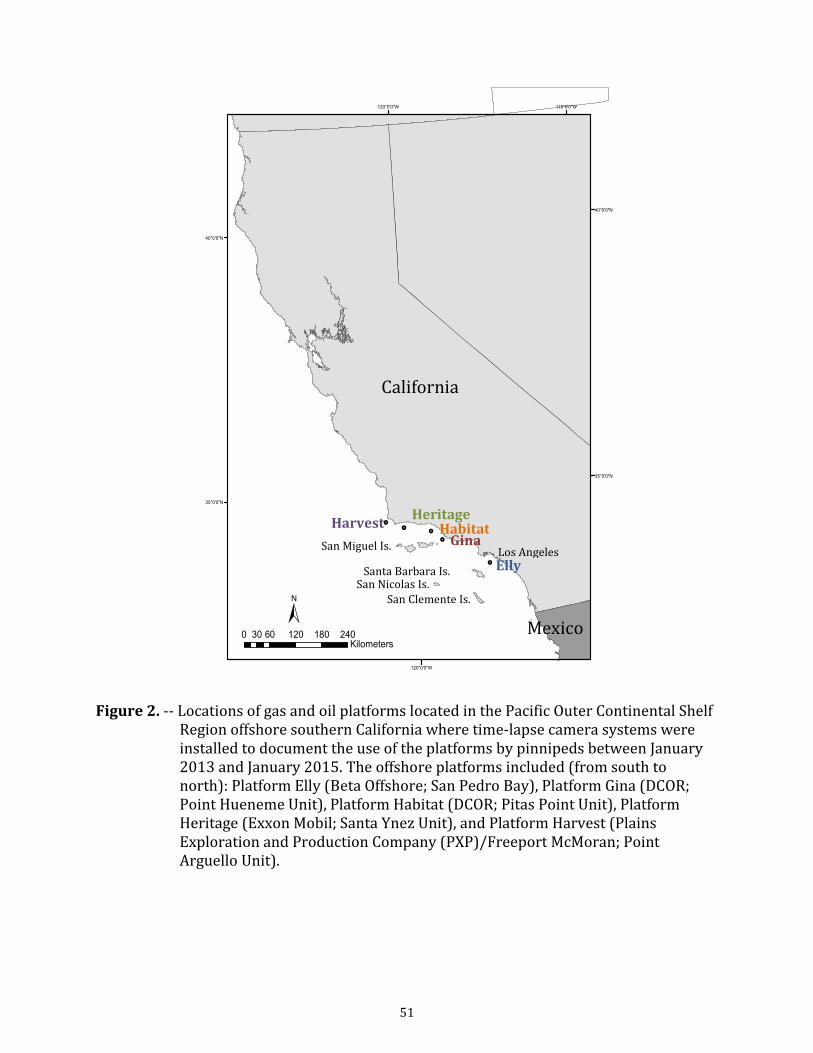
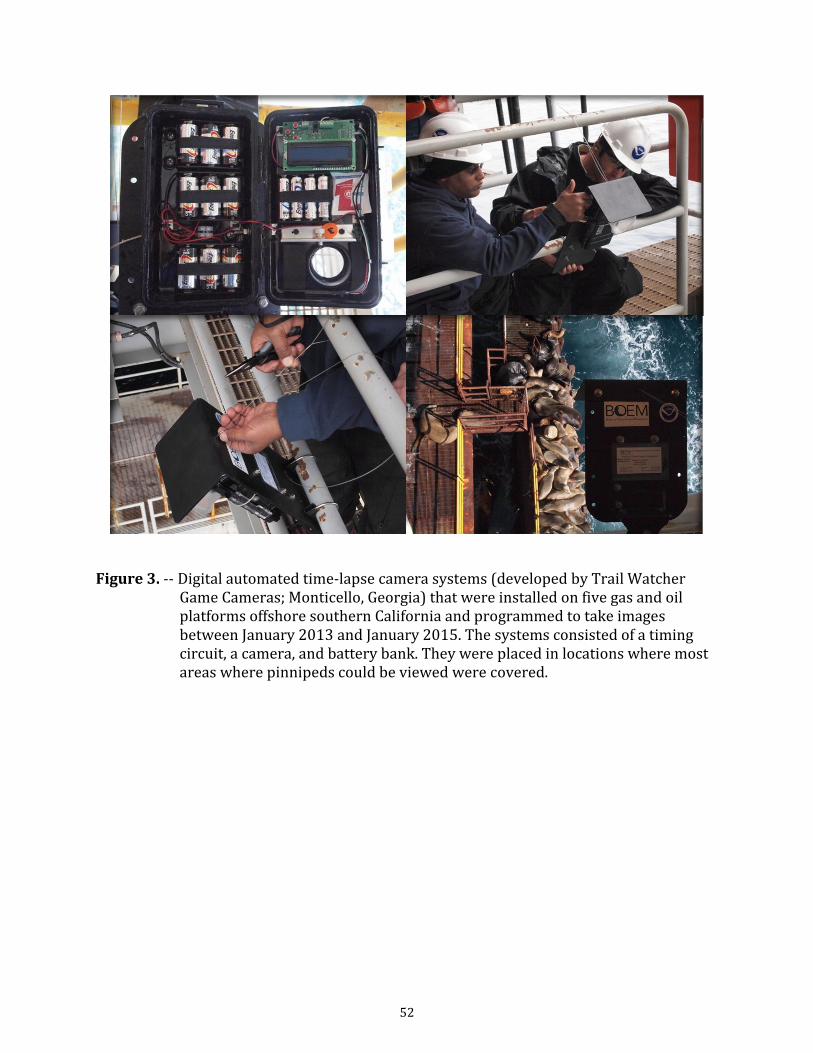
(a)
(b)
Figure 7 -- Pinniped species observed at or near the gas and oil platforms besides the California sea lion (Zalophus californianus) included (a) Steller sea lion(Eumetopias jubatus) and (b) Pacific harbor seal (Phoca vitulina richardii)
56
0255075100125
Med
ian
0100200300400500
J F M A M J J A S O N D J F M A M J J A S O N D J
Max
imum
2013 2014 2015
Elly Gina Habitat Heritage Harvest 150
Month
Figure 8 -- Monthly median (top) and maximum (bottom) counts of California sea lionsContinental Shelf RegZalophus californianus) on gas and oil platforms located in the Pacific Outer ( ion offshore southern California from January 2013 toJanuary 2015 Platforms are listed in order from south to north
57
0
50
100
150
Med
ian
Max
imum
0100200300400500
0 2 4 6 8 10 12 14 16 18 20 22 0 2 4 6 8 10 12 14 16 18 20 222013 2014
Elly Gina Habitat Heritage Harvest
Hour
Figure 9 -- Hourly median (top) and maximum (bottom) counts of California sea lions Continental Shelf RegZalophus californianus) on gas and oil platforms located in the Pacific Outer ( ion offshore southern California during 2013 and 2014 Platforms are listed in order from south to north
58
Pup Juvenile Adult female Mature male Elly Gina 100806
J F M A M J J A S O N D J F M A M J J A S O N D J J F M A M J J A S O N D J F M A M J J A S O N D J
16 12 10 43 273 128 348 401 516 708 122 126 167 522 452 508 171 702 858 264742 2434 809 1161 677 1458 788 422 195 272 749 422 419 228275696 638 338233149 122 459 704 718 220345304292497122 780142 470602 385 651 634491521613 308 956 612 838372 323724 880634 399 791286 481 402 1086 700 969 4518921462 487 220
Heritage Harvest 040200
100806
Prop
orti
on
000420
2013 2014 20152013 2014 2015
Month
Figure 10 -- Proportion of California sea lions (specific agesex class [(from south (top left) to norZalophus californianus) using gas and oil platforms that were identified to a th (bottom right)] by month from January 2013 throughJanuary 2015 Numbers within bars indicate total number of animals identified during that month 59
Figure 11 -- California sea lions (Zalophus californianus) feeding in waters adjacent to gas and oil platforms Sometimes feeding occurs along with other animals including cetaceans and sea birds
60
Figure 12 -- Adult female California sea lions (Zalophus californianus) nursing pup (left)and juvenile (right) while hauled out on gas and oil platforms during thestudy period
61
(a)
(b)
(c)
Figure 13 -- Marked (ie (a) tagged (b) branded or (c) instrumented) California sea lions (Zalophus californianus) were seen on and around the gas and oil platforms during the study area Marked individuals included those that were a) were rehabilitated and tagged at The Marine Mammal Center Sausalito CA and b) tagged andor branded by the Marine Mammal Laboratory Seattle WA for demographic studies on San Miguel Island WA or in the Pacific Northwest
62
(a)
(b)
Figure 14 -- California sea lions (platforms exhibiting signs of encounters with Zalophus californianus) hauled out on gas and oil(a) fisheries (eg monofilamentfishing line) and (b) sharks (eg lesions)
63
APPENDICES
64
Appendix Figure 1 -- Box-and-whisker plots of California sea lions counted on gas and oil platforms (from south-top to north-bottom) by month during 2013 Note some of the tops of plots for Platform Habitat could not be displayed because they exceeded the range of the y-axis
66
Appendix Figure 2 -- Box-and-whisker plots of California sea lions counted on gas and oil platforms (from south-top to north-bottom) by month during 2014 Note some of the tops of plots for Platform Habitat could not be displayed because they exceeded the range of the y-axis 67
Appendix Figure 3 -- Box-and-whisker plots of California sea lions counted on gas and oil platforms (from south-top to north-bottom) by month during January 2015 68
-- - -Appendix Figure 4 Box and whisker plots (including the minimum 25th quartile median 75th quartile and maximum) of California sea lions counted on gas and oil platforms (from south-top to north-bottom) by hour during 2013 Note some of the tops of plots for Platform Habitat could not be displayed because they exceeded the range of the y-axis 69
-- Appendix Figure 5 Box-and-whisker plots of Calnorth-bottom) by hour ifornia sea lions counted on gas and oil platforms (from south-top to during 2014 Note some of the tops of plots for Platform Habitat could not be displayed because they exceeded the range of the y-axis
70
Appendix Figure 6 -- Box-and-whisker plots of California sea lions counted on gas and oil platforms (from south-top to north-bottom) by hour during January 2015 71
RECENT TECHNICAL MEMORANDUMS
Copies of this and other NOAA Technical Memorandums are available from the National Technical Information Service 5285 Port Royal Road Springfield VA 22167 (web site wwwntisgov) Paper and electronic (pdf) copies vary in price
AFSC-
361 MCCONNAUGHEY R A K E BLACKHART M P EAGELTON and J MARSH 2017
Habitat assessment prioritization for Alaska stocks Report of the Alaska Regional Habitat Assessment Prioritization Coordination Team US Dep Commer NOAA Tech Memo NMFS-AFSC-361 102 p NTIS number pending
360 TURNER K C N ROOPER E A LAMAN S C ROONEY D W COOPER and M ZIMMERMANN 2017 Model-based essential fish habitat definitions for Aleutian Island groundfish species 239 p NTIS number pending
359 RODGVELLER C J P W MALECHA and C R LUNSFORD 2017 Long-term survival and
observable healing of two deepwater rockfishes Sebastes after barotrauma and subsequent recompression in pressure tanks 37 p NTIS No PB2017-102716
358 FAUNCE C J SULLIVAN S BARBEAUX J CAHALAN J GASPER S LOWE and R WEBSTER 2017 Deployment performance review of the 2016 North Pacific Groundfish and Halibut Observer Program US Dep Commer NOAA Tech Memo NMFS-AFSC-358 75 p NTIS No PB2017-102715
357 LAMAN E A C N ROOPER S C ROONEY K A TURNER D W COOPER and M ZIMMERMANN 2017 Model-based essential fish habitat definitions for Bering Sea groundfish species 75 p NTIS No PB2017-102512
356 CSEPP D J D C HONEYFIELD J J VOLLENWEIDER and J WOMBLE 2017 Estuarine distribution nutritional and thiaminase content of eulachon (Thaleichthys pacificus) in Southeast Alaska with implications for Steller sea lions 56 p NTIS No No PB2017-102383
355 M M MUTO V T HELKER R P ANGLISS B A ALLEN P L BOVENG J M BREIWICK M F CAMERON P J CLAPHAM S P DAHLE M E DAHLHEIM B S FADELY M C FERGISON L W FRITZ R C HOBBS Y V IVASHCHENKO A S KENNEDY J M LONDON S A MIZROCH R R REAM E L RICHMOND K E W SHELDEN R G TOWELL P R WADE J M WAITE and A N ZERBINI 2017 Alaska marine mammal stock assessments 2016 366 p NTIS No PB2017-102381
354 HELKER V T M M MUTO K SAVAGE S TEERLINK L A JEMISON K WILKINSONand
J JANNOTT 2017 Human-caused mortality and injury of NMFS-managed Alaska marine mammal stocks 2011-2015 US Dep Commer NOAA Tech Memo NMFS-AFSC-354112 p NTIS No PB2016102765
353 CONNER J D G NICHOL and R R LAUTH 2017 Results of the 2015 eastern Bering Sea continental shelf bottom trawl survey of groundfish and invertebrate resources 154 p NTIS No PB2017-102385
352 CONNER J and R R LAUTH 2017 Results of the 2016 eastern Bering Sea continental shelf bottom trawl survey of groundfish and invertebrate resources159 p NTIS No PB2017-102386
351 GODDARD P R E WILBORN C N ROOPER K WILLIAMS and R TOWLER 2017 Results of
the 2012 and 2014 underwater camera surveys of the Aleutian Islands 505 p NTIS No PB2017-102387
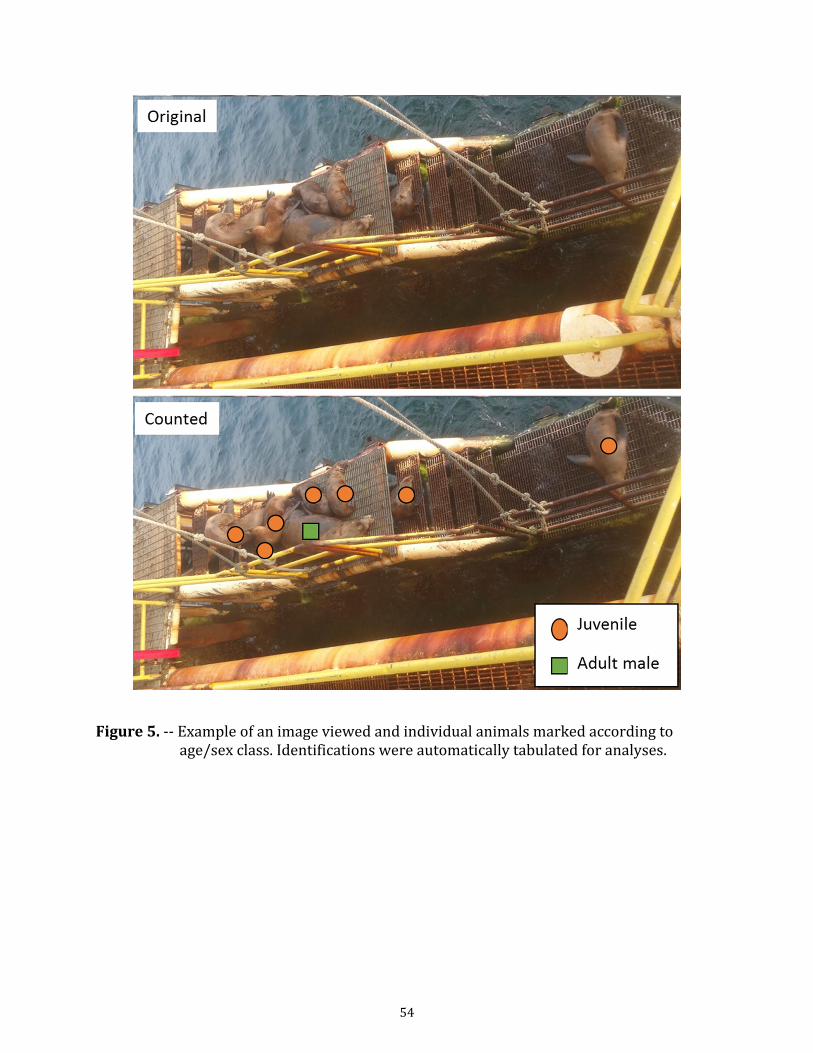
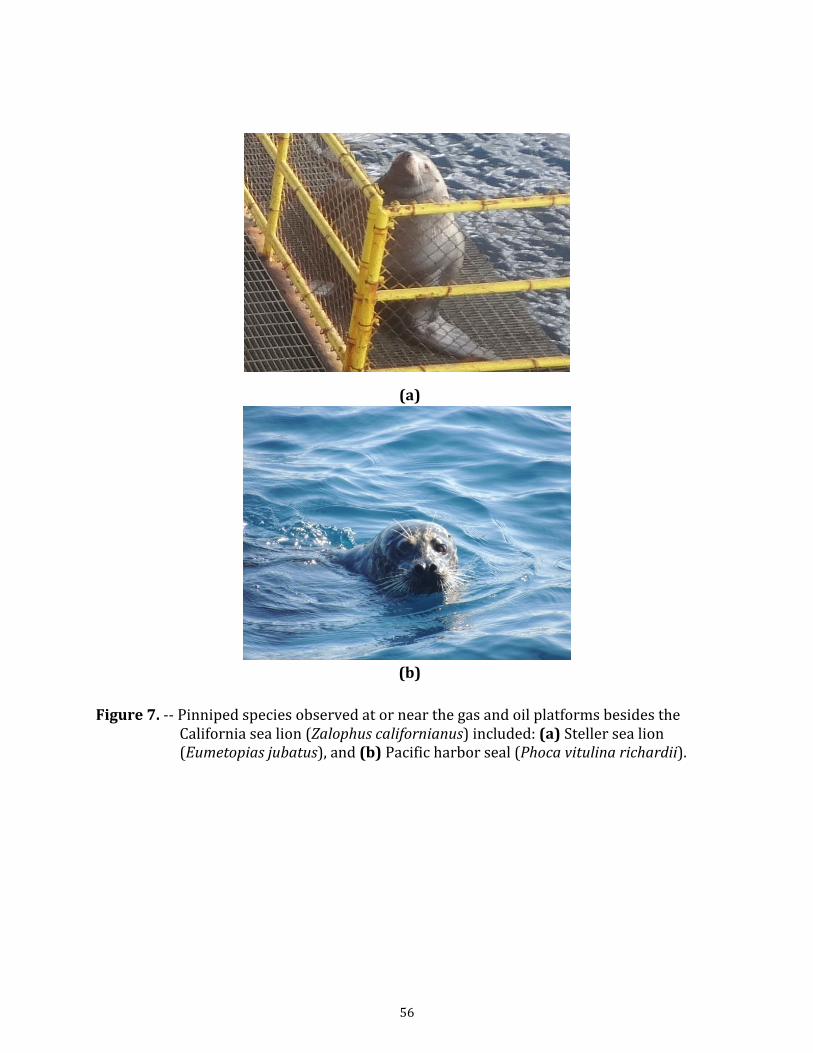
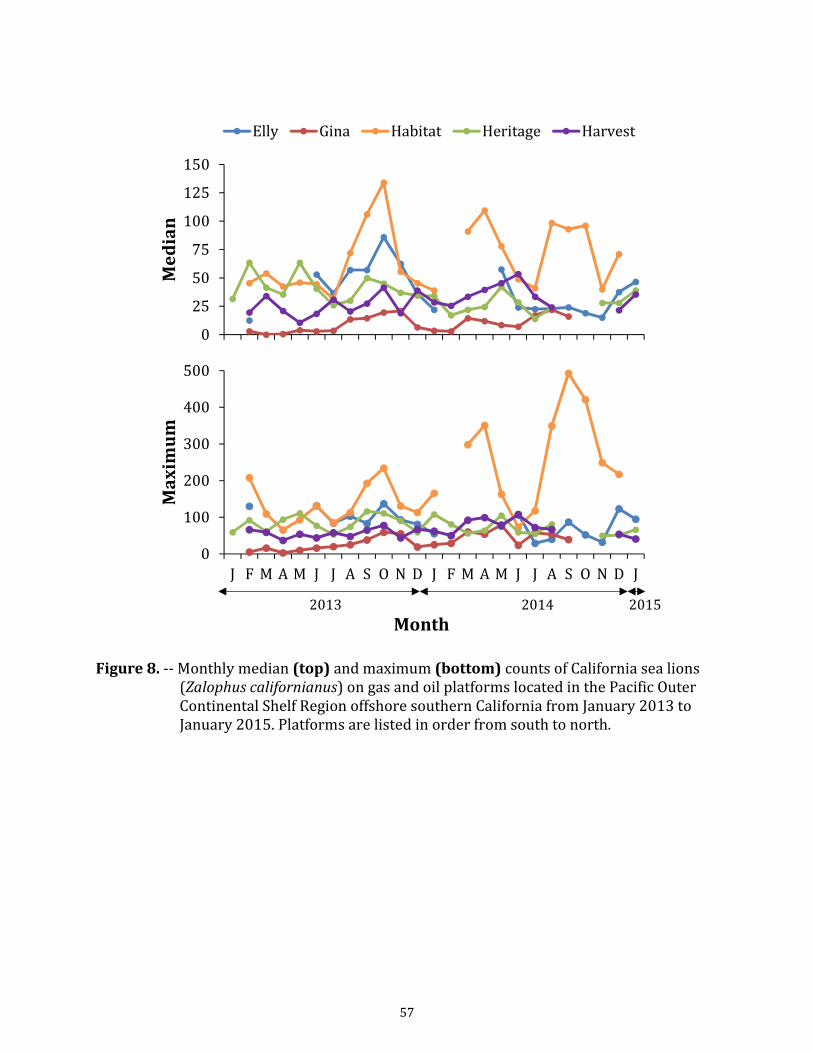
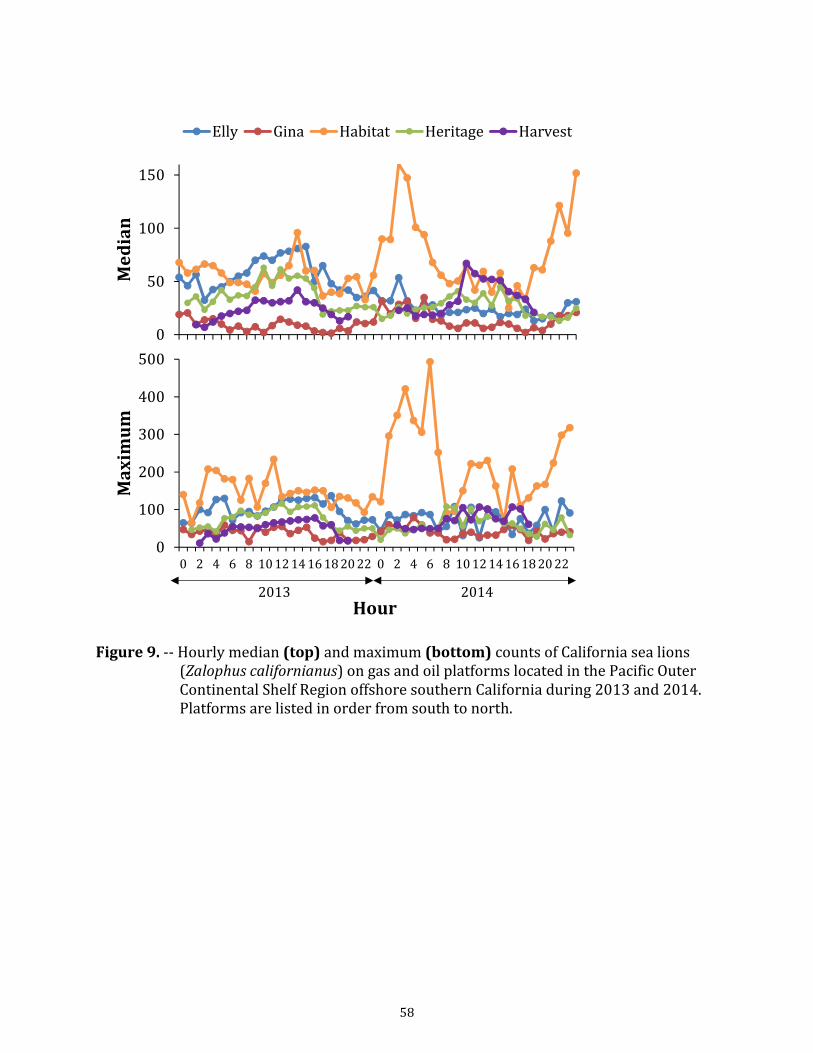
(a)
(b)
(c)
Figure 13 -- Marked (ie (a) tagged (b) branded or (c) instrumented) California sea lions (Zalophus californianus) were seen on and around the gas and oil platforms during the study area Marked individuals included those that were a) were rehabilitated and tagged at The Marine Mammal Center Sausalito CA and b) tagged andor branded by the Marine Mammal Laboratory Seattle WA for demographic studies on San Miguel Island WA or in the Pacific Northwest
62
(a)
(b)
Figure 14 -- California sea lions (platforms exhibiting signs of encounters with Zalophus californianus) hauled out on gas and oil(a) fisheries (eg monofilamentfishing line) and (b) sharks (eg lesions)
63
APPENDICES
64
Appendix Figure 1 -- Box-and-whisker plots of California sea lions counted on gas and oil platforms (from south-top to north-bottom) by month during 2013 Note some of the tops of plots for Platform Habitat could not be displayed because they exceeded the range of the y-axis
66
Appendix Figure 2 -- Box-and-whisker plots of California sea lions counted on gas and oil platforms (from south-top to north-bottom) by month during 2014 Note some of the tops of plots for Platform Habitat could not be displayed because they exceeded the range of the y-axis 67
Appendix Figure 3 -- Box-and-whisker plots of California sea lions counted on gas and oil platforms (from south-top to north-bottom) by month during January 2015 68
-- - -Appendix Figure 4 Box and whisker plots (including the minimum 25th quartile median 75th quartile and maximum) of California sea lions counted on gas and oil platforms (from south-top to north-bottom) by hour during 2013 Note some of the tops of plots for Platform Habitat could not be displayed because they exceeded the range of the y-axis 69
-- Appendix Figure 5 Box-and-whisker plots of Calnorth-bottom) by hour ifornia sea lions counted on gas and oil platforms (from south-top to during 2014 Note some of the tops of plots for Platform Habitat could not be displayed because they exceeded the range of the y-axis
70
Appendix Figure 6 -- Box-and-whisker plots of California sea lions counted on gas and oil platforms (from south-top to north-bottom) by hour during January 2015 71
RECENT TECHNICAL MEMORANDUMS
Copies of this and other NOAA Technical Memorandums are available from the National Technical Information Service 5285 Port Royal Road Springfield VA 22167 (web site wwwntisgov) Paper and electronic (pdf) copies vary in price
AFSC-
361 MCCONNAUGHEY R A K E BLACKHART M P EAGELTON and J MARSH 2017
Habitat assessment prioritization for Alaska stocks Report of the Alaska Regional Habitat Assessment Prioritization Coordination Team US Dep Commer NOAA Tech Memo NMFS-AFSC-361 102 p NTIS number pending
360 TURNER K C N ROOPER E A LAMAN S C ROONEY D W COOPER and M ZIMMERMANN 2017 Model-based essential fish habitat definitions for Aleutian Island groundfish species 239 p NTIS number pending
359 RODGVELLER C J P W MALECHA and C R LUNSFORD 2017 Long-term survival and
observable healing of two deepwater rockfishes Sebastes after barotrauma and subsequent recompression in pressure tanks 37 p NTIS No PB2017-102716
358 FAUNCE C J SULLIVAN S BARBEAUX J CAHALAN J GASPER S LOWE and R WEBSTER 2017 Deployment performance review of the 2016 North Pacific Groundfish and Halibut Observer Program US Dep Commer NOAA Tech Memo NMFS-AFSC-358 75 p NTIS No PB2017-102715
357 LAMAN E A C N ROOPER S C ROONEY K A TURNER D W COOPER and M ZIMMERMANN 2017 Model-based essential fish habitat definitions for Bering Sea groundfish species 75 p NTIS No PB2017-102512
356 CSEPP D J D C HONEYFIELD J J VOLLENWEIDER and J WOMBLE 2017 Estuarine distribution nutritional and thiaminase content of eulachon (Thaleichthys pacificus) in Southeast Alaska with implications for Steller sea lions 56 p NTIS No No PB2017-102383
355 M M MUTO V T HELKER R P ANGLISS B A ALLEN P L BOVENG J M BREIWICK M F CAMERON P J CLAPHAM S P DAHLE M E DAHLHEIM B S FADELY M C FERGISON L W FRITZ R C HOBBS Y V IVASHCHENKO A S KENNEDY J M LONDON S A MIZROCH R R REAM E L RICHMOND K E W SHELDEN R G TOWELL P R WADE J M WAITE and A N ZERBINI 2017 Alaska marine mammal stock assessments 2016 366 p NTIS No PB2017-102381
354 HELKER V T M M MUTO K SAVAGE S TEERLINK L A JEMISON K WILKINSONand
J JANNOTT 2017 Human-caused mortality and injury of NMFS-managed Alaska marine mammal stocks 2011-2015 US Dep Commer NOAA Tech Memo NMFS-AFSC-354112 p NTIS No PB2016102765
353 CONNER J D G NICHOL and R R LAUTH 2017 Results of the 2015 eastern Bering Sea continental shelf bottom trawl survey of groundfish and invertebrate resources 154 p NTIS No PB2017-102385
352 CONNER J and R R LAUTH 2017 Results of the 2016 eastern Bering Sea continental shelf bottom trawl survey of groundfish and invertebrate resources159 p NTIS No PB2017-102386
351 GODDARD P R E WILBORN C N ROOPER K WILLIAMS and R TOWLER 2017 Results of
the 2012 and 2014 underwater camera surveys of the Aleutian Islands 505 p NTIS No PB2017-102387
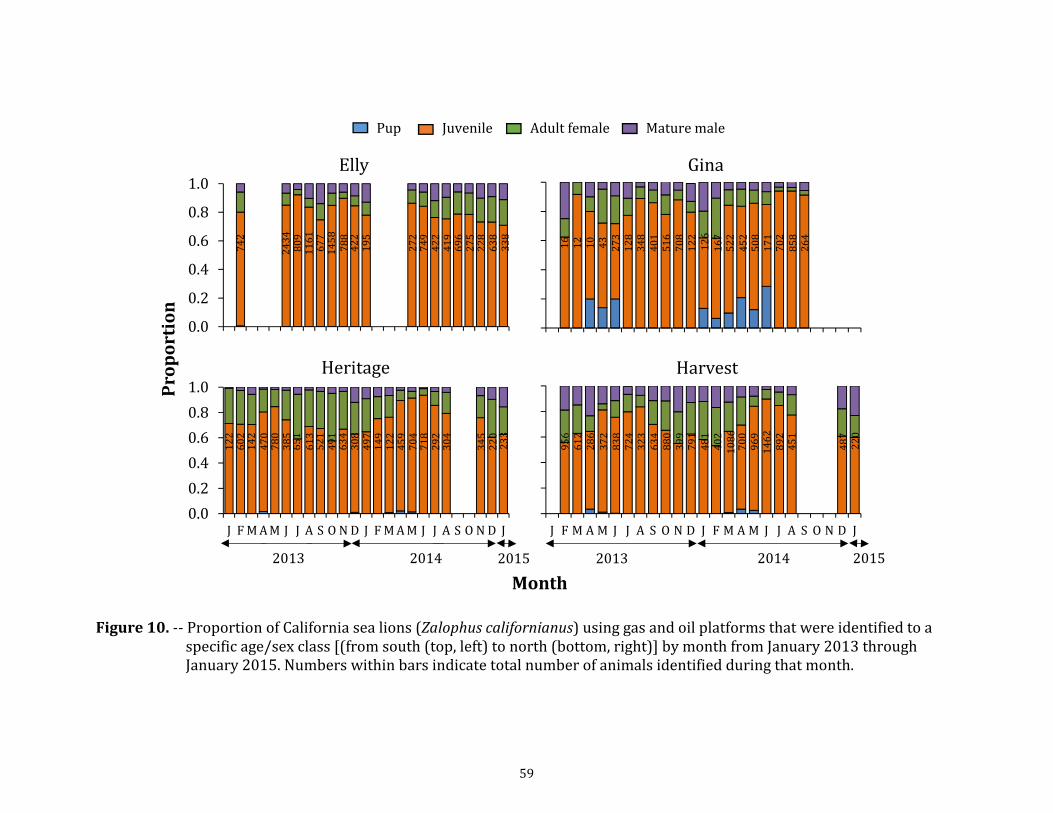
(a)
(b)
Figure 14 -- California sea lions (platforms exhibiting signs of encounters with Zalophus californianus) hauled out on gas and oil(a) fisheries (eg monofilamentfishing line) and (b) sharks (eg lesions)
63
APPENDICES
64
Appendix Figure 1 -- Box-and-whisker plots of California sea lions counted on gas and oil platforms (from south-top to north-bottom) by month during 2013 Note some of the tops of plots for Platform Habitat could not be displayed because they exceeded the range of the y-axis
66
Appendix Figure 2 -- Box-and-whisker plots of California sea lions counted on gas and oil platforms (from south-top to north-bottom) by month during 2014 Note some of the tops of plots for Platform Habitat could not be displayed because they exceeded the range of the y-axis 67
Appendix Figure 3 -- Box-and-whisker plots of California sea lions counted on gas and oil platforms (from south-top to north-bottom) by month during January 2015 68
-- - -Appendix Figure 4 Box and whisker plots (including the minimum 25th quartile median 75th quartile and maximum) of California sea lions counted on gas and oil platforms (from south-top to north-bottom) by hour during 2013 Note some of the tops of plots for Platform Habitat could not be displayed because they exceeded the range of the y-axis 69
-- Appendix Figure 5 Box-and-whisker plots of Calnorth-bottom) by hour ifornia sea lions counted on gas and oil platforms (from south-top to during 2014 Note some of the tops of plots for Platform Habitat could not be displayed because they exceeded the range of the y-axis
70
Appendix Figure 6 -- Box-and-whisker plots of California sea lions counted on gas and oil platforms (from south-top to north-bottom) by hour during January 2015 71
RECENT TECHNICAL MEMORANDUMS
Copies of this and other NOAA Technical Memorandums are available from the National Technical Information Service 5285 Port Royal Road Springfield VA 22167 (web site wwwntisgov) Paper and electronic (pdf) copies vary in price
AFSC-
361 MCCONNAUGHEY R A K E BLACKHART M P EAGELTON and J MARSH 2017
Habitat assessment prioritization for Alaska stocks Report of the Alaska Regional Habitat Assessment Prioritization Coordination Team US Dep Commer NOAA Tech Memo NMFS-AFSC-361 102 p NTIS number pending
360 TURNER K C N ROOPER E A LAMAN S C ROONEY D W COOPER and M ZIMMERMANN 2017 Model-based essential fish habitat definitions for Aleutian Island groundfish species 239 p NTIS number pending
359 RODGVELLER C J P W MALECHA and C R LUNSFORD 2017 Long-term survival and
observable healing of two deepwater rockfishes Sebastes after barotrauma and subsequent recompression in pressure tanks 37 p NTIS No PB2017-102716
358 FAUNCE C J SULLIVAN S BARBEAUX J CAHALAN J GASPER S LOWE and R WEBSTER 2017 Deployment performance review of the 2016 North Pacific Groundfish and Halibut Observer Program US Dep Commer NOAA Tech Memo NMFS-AFSC-358 75 p NTIS No PB2017-102715
357 LAMAN E A C N ROOPER S C ROONEY K A TURNER D W COOPER and M ZIMMERMANN 2017 Model-based essential fish habitat definitions for Bering Sea groundfish species 75 p NTIS No PB2017-102512
356 CSEPP D J D C HONEYFIELD J J VOLLENWEIDER and J WOMBLE 2017 Estuarine distribution nutritional and thiaminase content of eulachon (Thaleichthys pacificus) in Southeast Alaska with implications for Steller sea lions 56 p NTIS No No PB2017-102383
355 M M MUTO V T HELKER R P ANGLISS B A ALLEN P L BOVENG J M BREIWICK M F CAMERON P J CLAPHAM S P DAHLE M E DAHLHEIM B S FADELY M C FERGISON L W FRITZ R C HOBBS Y V IVASHCHENKO A S KENNEDY J M LONDON S A MIZROCH R R REAM E L RICHMOND K E W SHELDEN R G TOWELL P R WADE J M WAITE and A N ZERBINI 2017 Alaska marine mammal stock assessments 2016 366 p NTIS No PB2017-102381
354 HELKER V T M M MUTO K SAVAGE S TEERLINK L A JEMISON K WILKINSONand
J JANNOTT 2017 Human-caused mortality and injury of NMFS-managed Alaska marine mammal stocks 2011-2015 US Dep Commer NOAA Tech Memo NMFS-AFSC-354112 p NTIS No PB2016102765
353 CONNER J D G NICHOL and R R LAUTH 2017 Results of the 2015 eastern Bering Sea continental shelf bottom trawl survey of groundfish and invertebrate resources 154 p NTIS No PB2017-102385
352 CONNER J and R R LAUTH 2017 Results of the 2016 eastern Bering Sea continental shelf bottom trawl survey of groundfish and invertebrate resources159 p NTIS No PB2017-102386
351 GODDARD P R E WILBORN C N ROOPER K WILLIAMS and R TOWLER 2017 Results of
the 2012 and 2014 underwater camera surveys of the Aleutian Islands 505 p NTIS No PB2017-102387
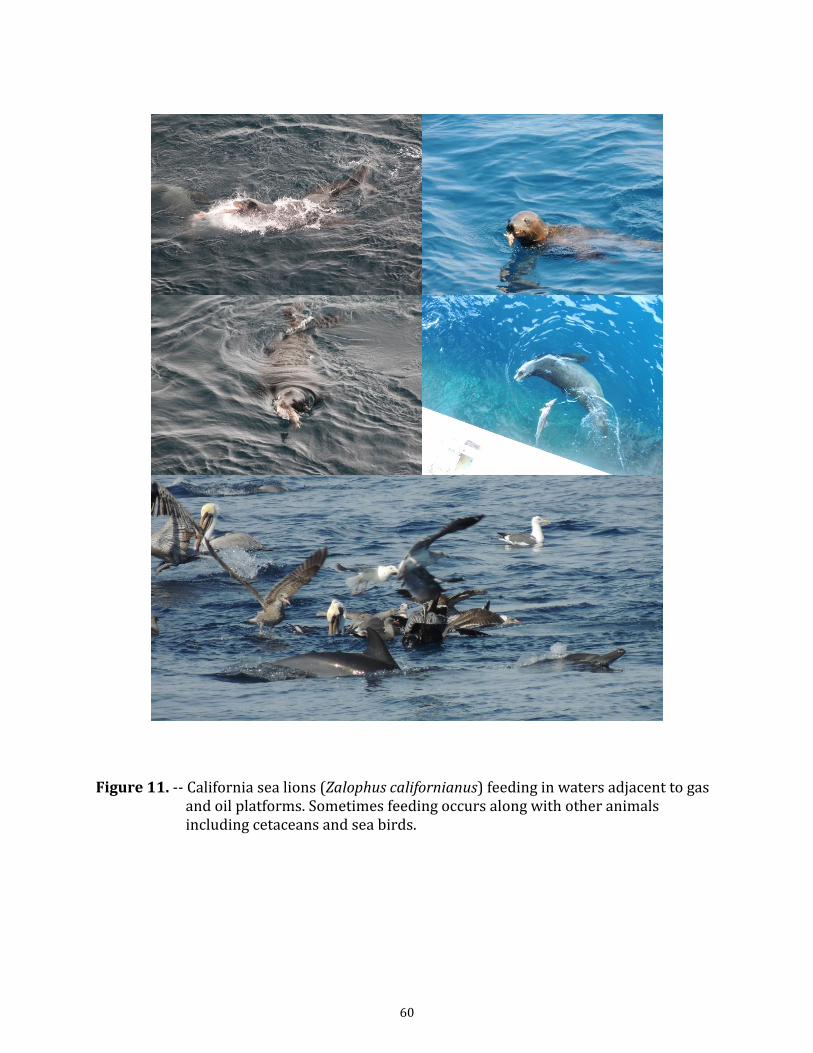
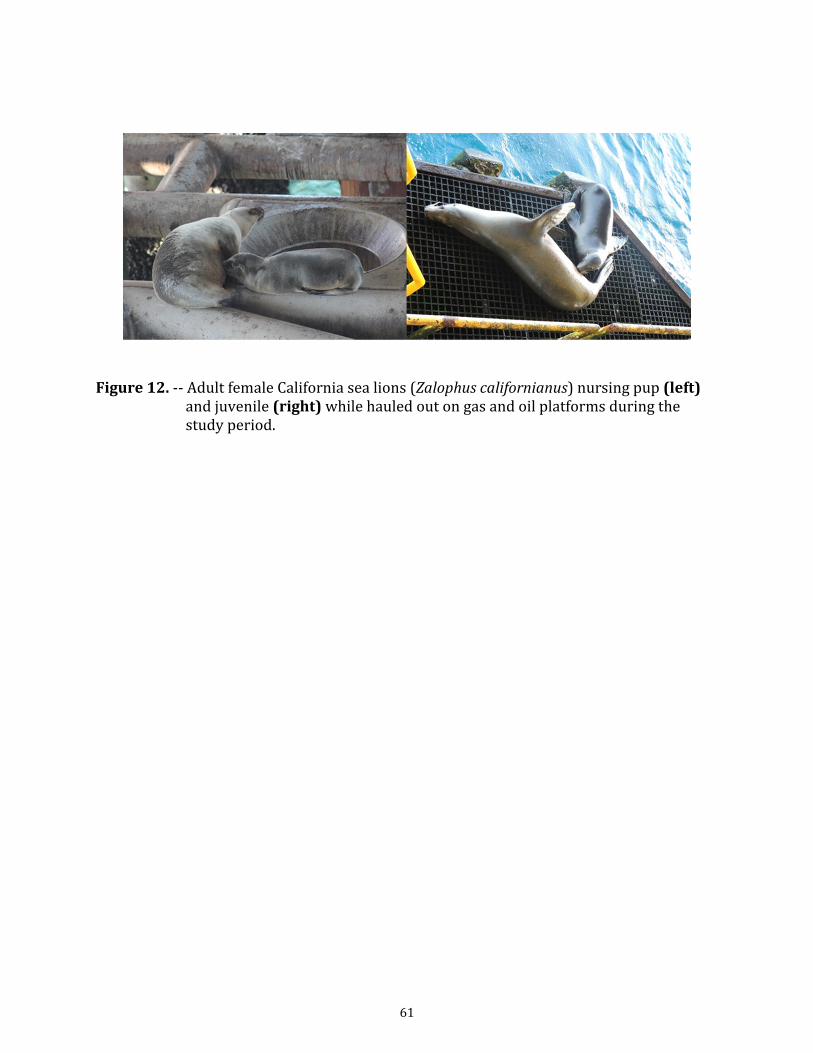
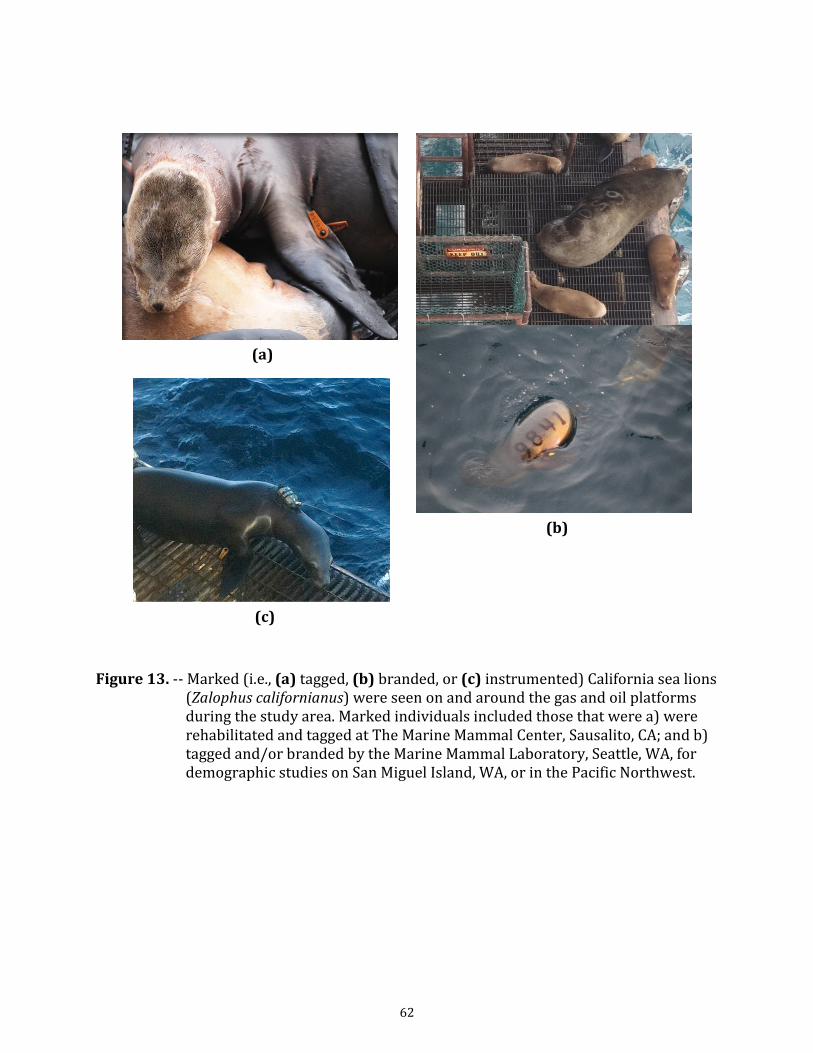
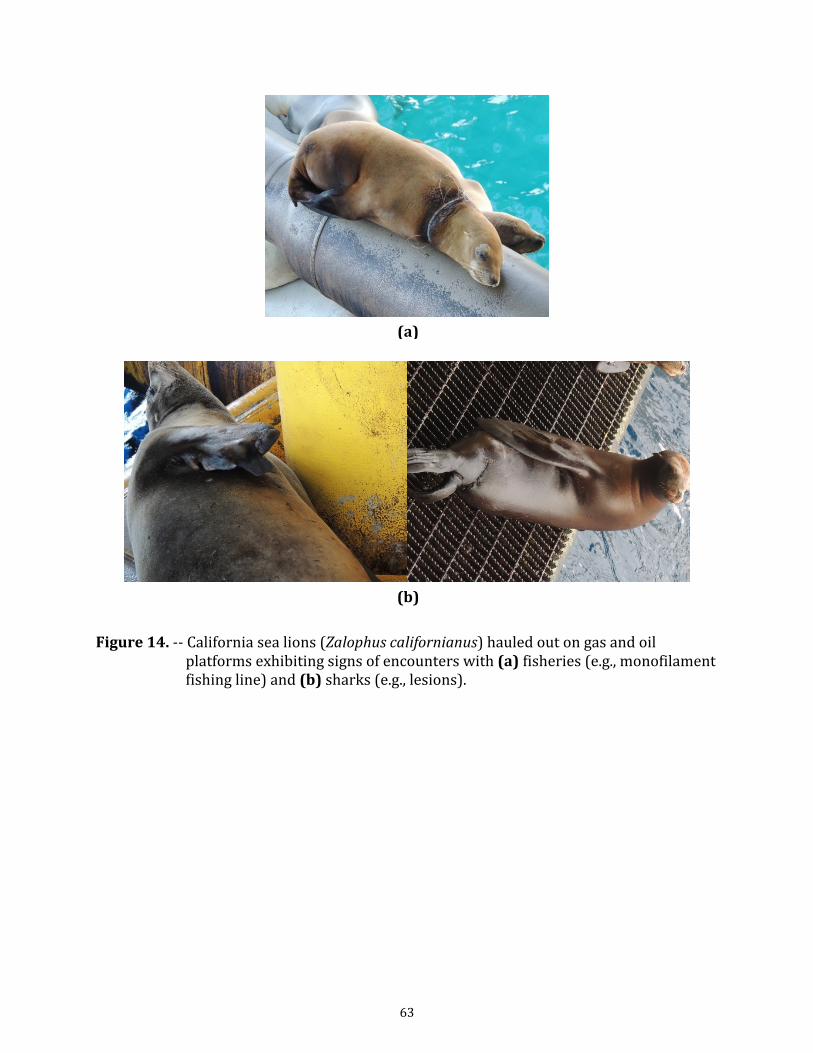
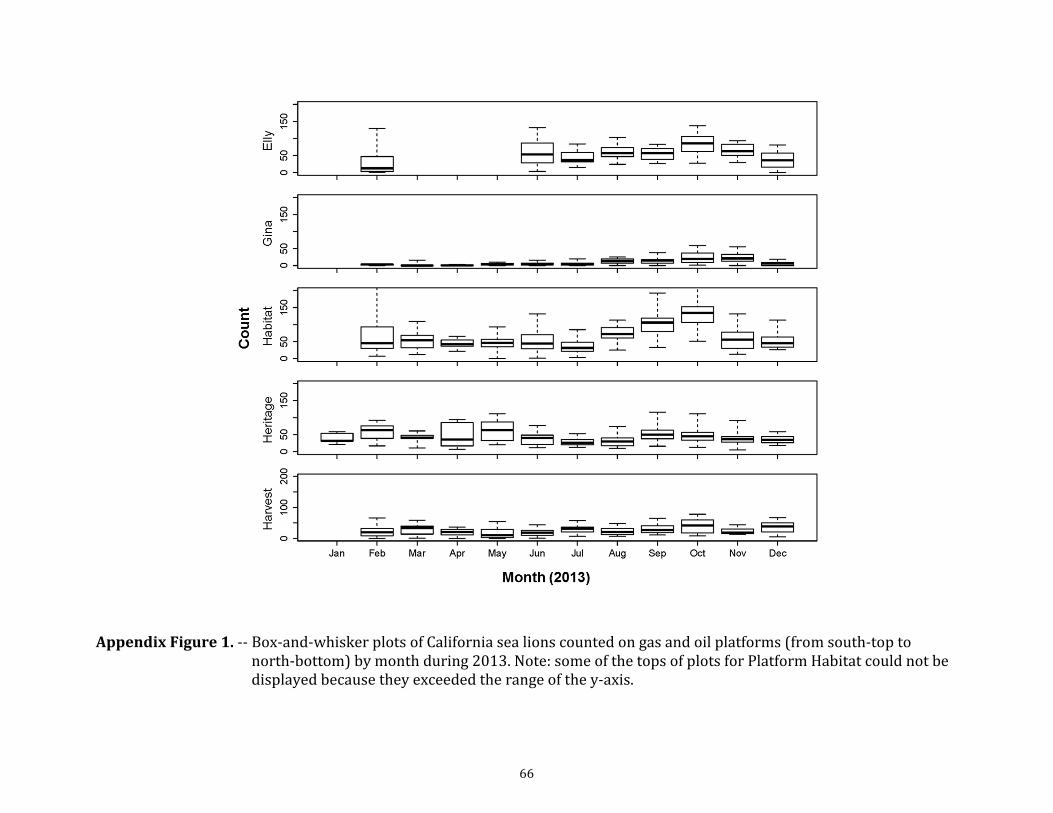
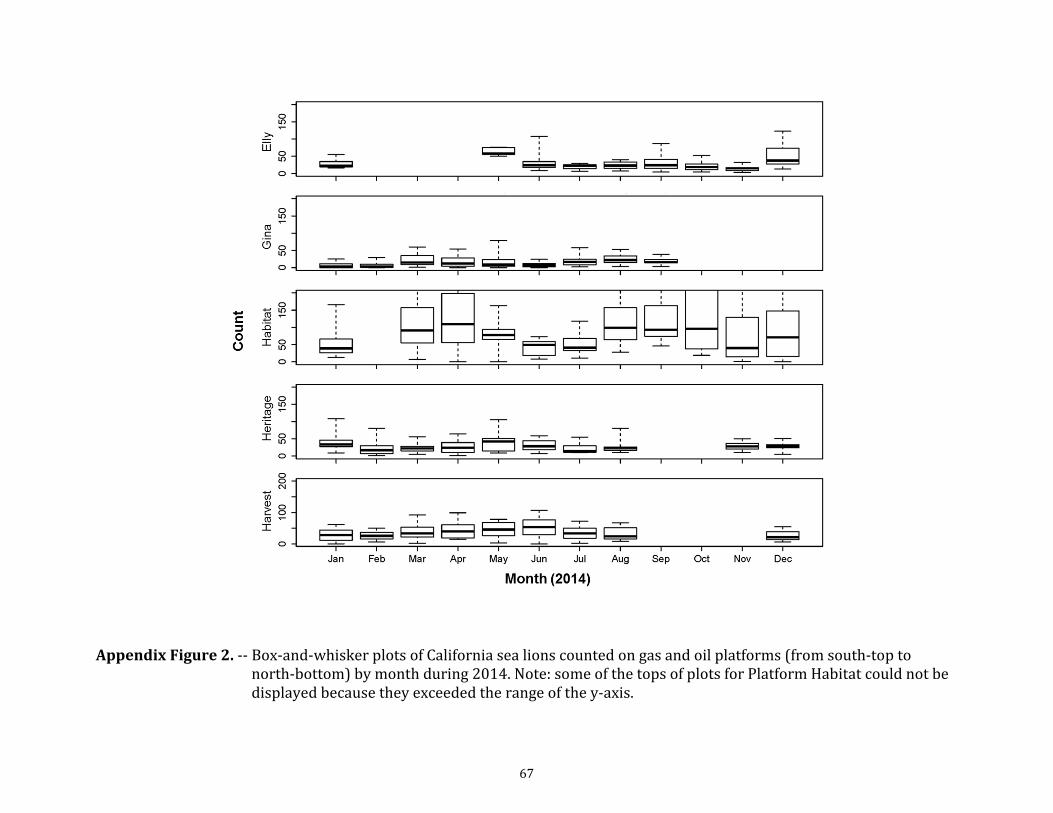