Embed Size (px)
Citation preview
1
Qualitative Community Health Survey
St. Vincent’s Community Health Needs Assessment Task
Force
Survey developed by Judy Wessler, CPHS.
Surveys done through Miguel Acevedo, Fulton Youth of the Future
Data Entry by Raymond Castro
Report and Analysis by Judy Wessler, Disha Shah, and Mary Li, CPHS
As part of the St. Vincent’s Community Health Assessment Task Force process, CPHS
and Fulton Youth of the Future determined that portions of the population that are
traditionally underserved, and unrecorded, would not be part of the health assessment
unless another step was taken. It was therefore decided that a paper survey form
would be developed and administered face-to-face by community residents for
community residents in parts of the Chelsea community. The survey was developed by
CPHS. Interviewers were supervised by Miguel Acevedo of the Fulton Youth of the
Future. A very small grant was made to Fulton Youth by North Shore/LIJ for purposes
of paying the interviewers and for the data entry. Analysis of the data is provided by
CPHS.
This survey sample contains a higher percentage of people of color (African Americans
and Latinos) than other samples in this overall community health assessment. The data
analysis will therefore report results separately for people of color in the sample.
The Survey
Three hundred eight seven (387) survey s were done by members of the Fulton Youth
of the Future. The surveys were administered as part of a community health needs
assessment following the closing of St. Vincent’s Hospital in April 2010, to understand
the impact on the community and identified needs for community health services. This
survey was part of an overall analysis that also includes: statistical data provided by
North Shore University Hospital; focus groups, key informant interviews; and an on-line
quantitative survey provided by Hunter College. This community survey was done to
ensure that residents who would not otherwise be captured for the assessment, were
reached. Many of the people surveyed used a variety of St. Vincent’s services while the
hospital was open.
NOTE: This survey could have been more robust, however, because of a delay in
negotiations, the survey was initiated very late and had a short time to be completed. In
addition, because of the tight schedule, CPHS was unable to do training for the
2
surveyors so that, in particular, the open-ended questions were not recorded in a
complete way and this important information was not always collected.
To adjust for the lack of ―people’s direct voices‖ a community meeting, organized by
Miguel Acevedo, was held on August 10th at the Fulton Tenants Association office.
Fifteen community residents from Fulton Houses attended this meeting. Some of the
residents had been involved in administering the survey to others. A short synopsis of
the findings from the survey was presented. The people who attended were much more
interested in telling their personal, and their neighbors and family stories. The floor was
opened to a free flowing discussion with no pre-determined questions.
There were many important stories of problems that people have had in knowing where
to go for care since St. Vincent’s Hospital closed and of having trouble getting
appointments when they did try to go for care. People do not know who to call or where
to find out information about services. Many people voiced the grave concern that
getting to an ER now that St. Vincent’s is closed, takes too long and endangers people
in the process.
The wait time for an appointment at the Callen Lord Health Center is three months,
even for someone who went and asked for care and had ―high sugar level.‖ One good
alternative for access to care is the Raymond Naftali Center which several people said
they had found their way to for appointments. We were told that the Naftali Center has
room to expand in the building where they are located, but a problem is that they close
at 5 pm which does not accommodate people who work. The center has a full range of
outpatient services available. A few people described long wait times at Beth Israel.
One woman said she was told at the Emergency Room at Beth Israel by staff that there
was ―overbooking‖ at the Emergency Room. At least one other person said that she
would not go to Bellevue because of care she received at that hospital. Several people
had no idea of the location of the North Shore Urgi Care Center that has opened.
There had been discussions with Ryan Chelsea-Clinton Health Center about providing
an on-site nurse to provide services. But the numbers did not work out so the
discussions were ended.
There are 3,000 residents in Fulton Houses. We were told that 30 percent (about 1,000
people) of the population of Fulton Center is seniors. We were also told that eight
senior people had died in their apartments – although we did not have details about
these deaths. Seniors have trouble getting to health services, although they either
walked or had arranged transportation when St. Vincent’s was still open. There are lots
of people ill with chronic diseases. Many people have diabetes. Asthma is very
common as well.
3
Some specific stories:
The son of a woman in attendance had a very bad asthma attack and they had to
wait for an ambulance. She said that the attack was so bad that they had to
intubate her son in the ambulance. Her son is not going any place now to get
care for his asthma.
After a trip to the Beth Israel Emergency Room, a woman was given a phone
number to call to get a follow-up clinic appointment. The woman spent 1 ½ hours
on the phone trying to get an appointment and was given an appointment 1 ½
months later.
One woman talked about her arthritis which makes it difficult to walk, she has
trouble getting to health care services.
Another woman told about her nine year old child with asthma. Her child is daily
on three steroid medications. She also has an Epi pen. She is very worried
about getting her child to an Emergency Room on time.
Recommendations:
o People expressed a need for a new hospital and for an Emergency Room,
that having emergency without beds would not work.
o People need information about insurance and about specifics of where
they can go for care.
o People, particularly the seniors, need support services and help in
coordinating care.
o People expressed a need for primary care, for a medical home, in the
community.. They did not call it primary care, but rather described types
of care that could and should be treated by a primary care practitioner.
4
Survey Questions and Responses:
Where the survey was filled out: Please let us know where and how you are filling out
this survey.
A large number of surveys, 194 (50.1%), were filled out at the Fulton
Houses/youth program
27 at the Hudson Guild (7%)
21 referred by a friend (5.4%)
11 referred by family (2.8%)
33 miscellaneous (8.5%)
For 101 of the surveys there was No Answer (26.1%).
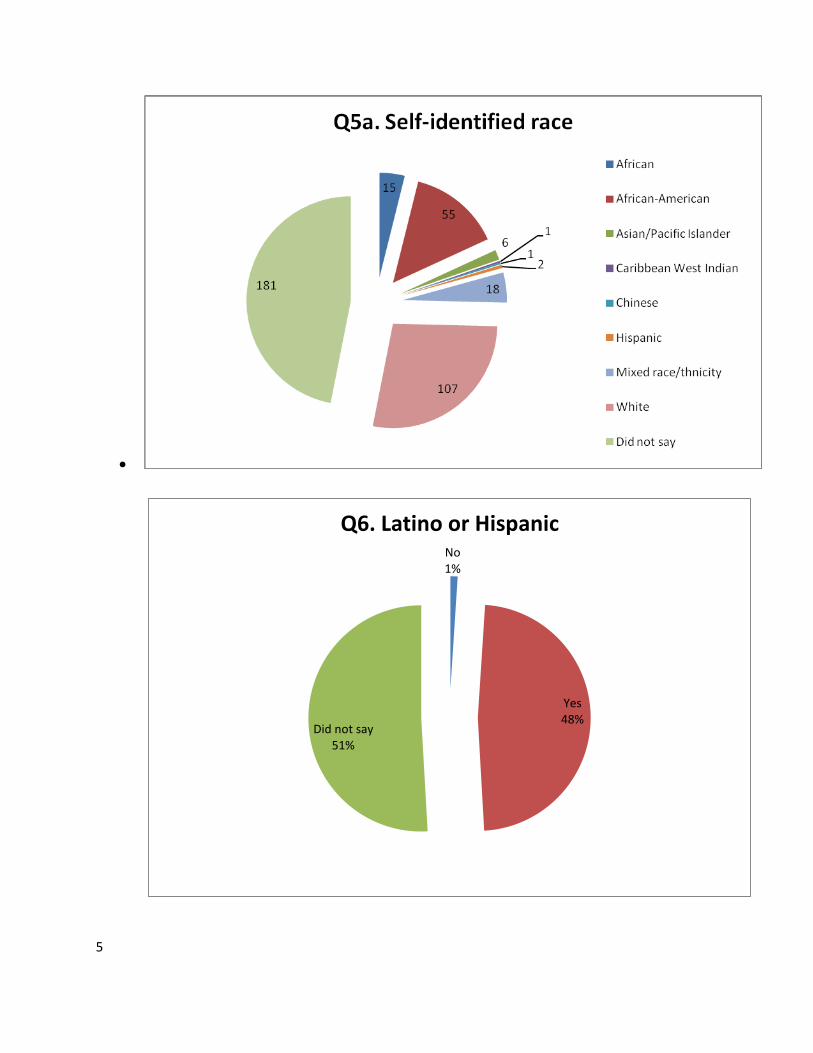
Self-identified race - ethnicity: What is your race? Are you Latino/Hispanic?
Seventy people identified as African American (55) and African (15)
1 as Caribbean/West Indian
107 identified as White
18 as mixed race/ethnicity
6 as Asian/Pacific Islander
1 as Chinese
2 as Hispanic
A large number of people, 181, did not respond to the initial race question.
186 people identified as Latino or Hispanic.
5
No1%
Yes48%
Did not say51%
Q6. Latino or Hispanic

6
Primary Language: What is the primary language that you speak at home?
Two hundred twenty respondents are English only speakers (56.8%)
89 speak Spanish and English (23%)
47 speak Spanish only (12.1%)
2 speak English and Chinese (0.5%)
1 speaks English and Greek (0.3%)
2 speak English and Italian (0.5%)
There were 24 No Answers (6.2%).
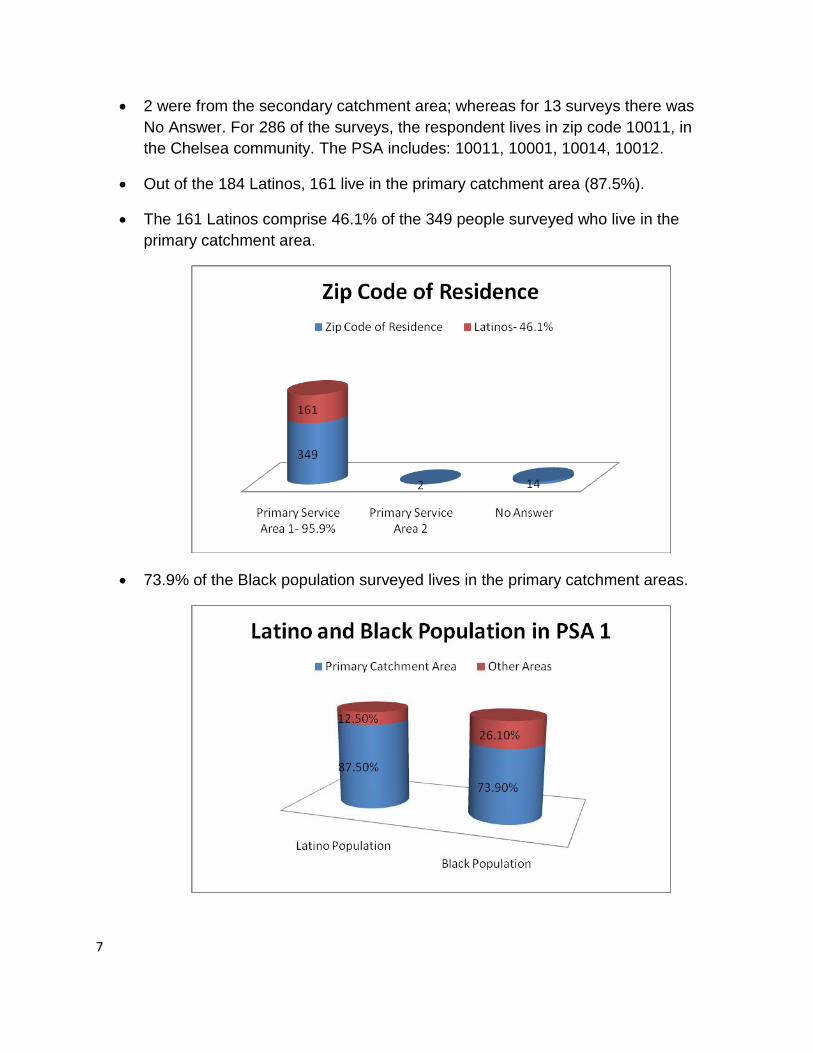
Zip code of residence:
The overwhelming number of surveys, 349 (95.9%), were filled out for people
residing in the primary service area (PSA) for this study
7
2 were from the secondary catchment area; whereas for 13 surveys there was
No Answer. For 286 of the surveys, the respondent lives in zip code 10011, in
the Chelsea community. The PSA includes: 10011, 10001, 10014, 10012.
Out of the 184 Latinos, 161 live in the primary catchment area (87.5%).
The 161 Latinos comprise 46.1% of the 349 people surveyed who live in the
primary catchment area.
73.9% of the Black population surveyed lives in the primary catchment areas.

8
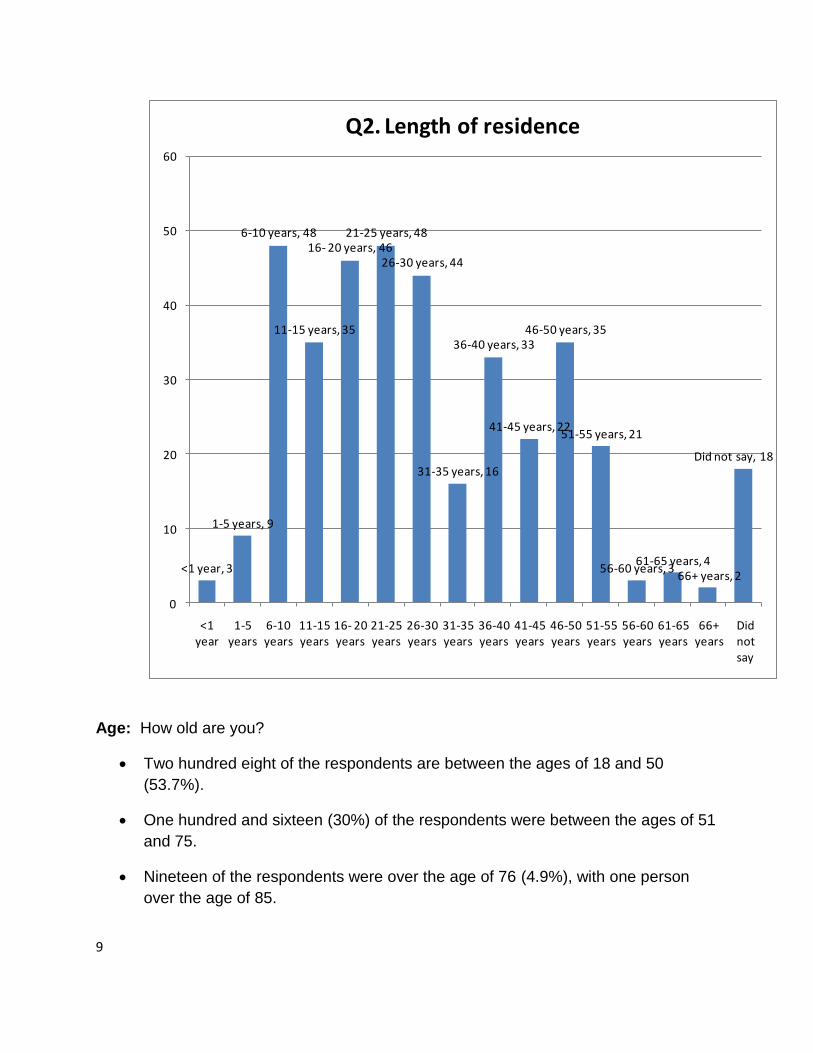
Length of residence: How long have you lived in this zip code?
Three hundred twenty five of the people surveyed have lived in the community
from six to 50 years.
There are also 30 people living in the catchment area for over 50 years.
154 Latinos surveyed have lived in the community from six to 50 years and 17
have lived there for more than 50 years.
58 people among the Black population surveyed have lived in the community
from six to 50 years and 3 have lived there for more than 50 years.
9
<1 year, 3
1-5 years, 9
6-10 years, 48
11-15 years, 35
16- 20 years, 4621-25 years, 48
26-30 years, 44
31-35 years, 16
36-40 years, 33
41-45 years, 22
46-50 years, 35
51-55 years, 21
56-60 years, 361-65 years, 4
66+ years, 2
Did not say, 18
0
10
20
30
40
50
60
<1 year
1-5 years
6-10 years
11-15 years
16- 20 years
21-25 years
26-30 years
31-35 years
36-40 years
41-45 years
46-50 years
51-55 years
56-60 years
61-65 years
66+ years
Did not say
Q2. Length of residence
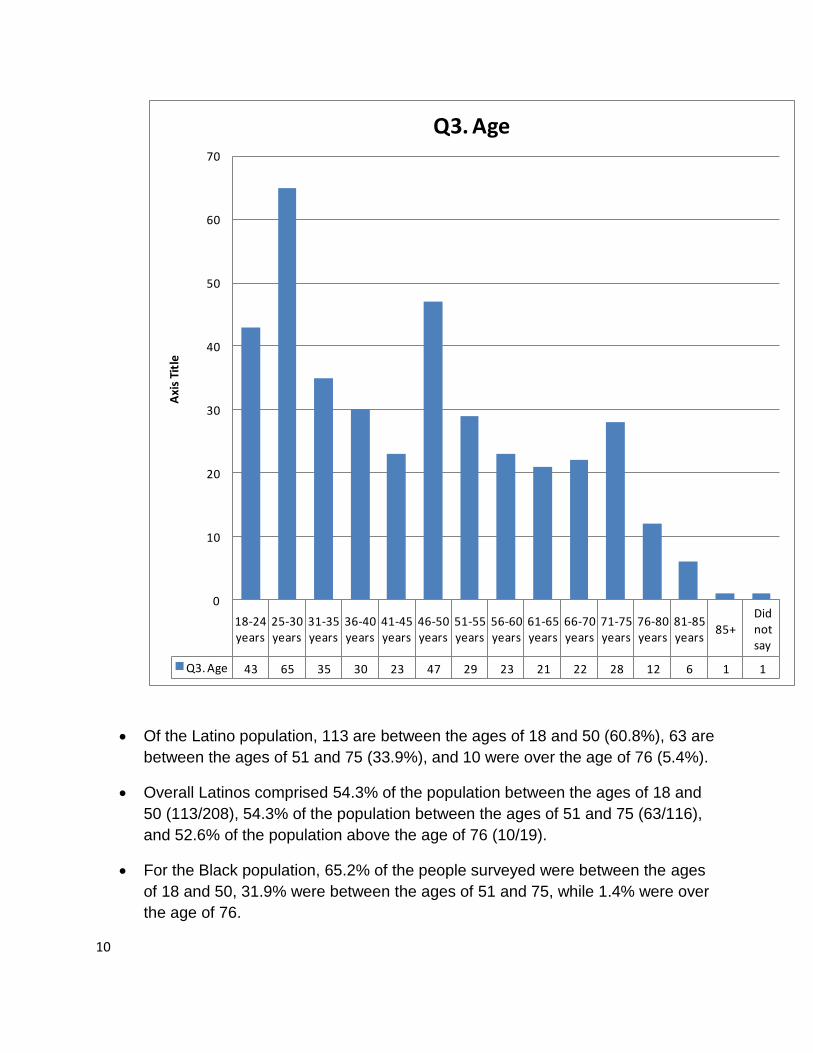
Age: How old are you?
Two hundred eight of the respondents are between the ages of 18 and 50
(53.7%).
One hundred and sixteen (30%) of the respondents were between the ages of 51
and 75.
Nineteen of the respondents were over the age of 76 (4.9%), with one person
over the age of 85.
10
18-24 years
25-30 years
31-35 years
36-40 years
41-45 years
46-50 years
51-55 years
56-60 years
61-65 years
66-70 years
71-75 years
76-80 years
81-85 years
85+Did not say
Q3. Age 43 65 35 30 23 47 29 23 21 22 28 12 6 1 1
0
10
20
30
40
50
60
70
Axi
s Ti
tle
Q3. Age
Of the Latino population, 113 are between the ages of 18 and 50 (60.8%), 63 are
between the ages of 51 and 75 (33.9%), and 10 were over the age of 76 (5.4%).
Overall Latinos comprised 54.3% of the population between the ages of 18 and
50 (113/208), 54.3% of the population between the ages of 51 and 75 (63/116),
and 52.6% of the population above the age of 76 (10/19).
For the Black population, 65.2% of the people surveyed were between the ages
of 18 and 50, 31.9% were between the ages of 51 and 75, while 1.4% were over
the age of 76.
11
Majority of the people surveyed in the Latino (60.8%) and Black populations
(65.2%), fell in the 18 to 50 age group whereas overall 53.7% of the population
surveyed are in this age range.
Gender:
There are 227 females (58.7%), 150 males (38.8%), 6 transgender (1.6%); and 4
no answer (1%).
Of Latinos, 120 were female (65%), 64 were male (34%), 1 person was trans-
gender (0.5%) and 1 person did not specify (0.5%).
In the Black population, 26 out of the 69 people surveyed were male (37.7%)
while 40 were female (58%) and 30 were trans-gender (4.3%).
Overall, the survey reached more females than males in the overall population as
well as the Black and Latino populations.
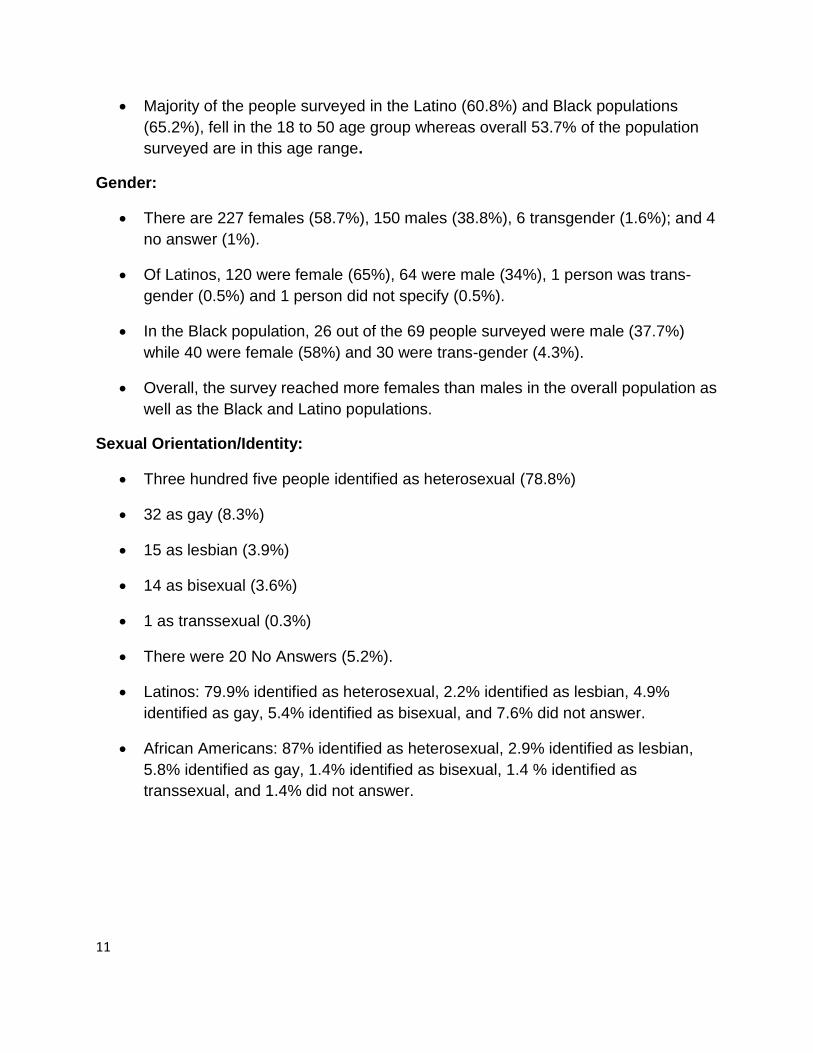
Sexual Orientation/Identity:
Three hundred five people identified as heterosexual (78.8%)
32 as gay (8.3%)
15 as lesbian (3.9%)
14 as bisexual (3.6%)
1 as transsexual (0.3%)
There were 20 No Answers (5.2%).
Latinos: 79.9% identified as heterosexual, 2.2% identified as lesbian, 4.9%
identified as gay, 5.4% identified as bisexual, and 7.6% did not answer.
African Americans: 87% identified as heterosexual, 2.9% identified as lesbian,
5.8% identified as gay, 1.4% identified as bisexual, 1.4 % identified as
transsexual, and 1.4% did not answer.
12
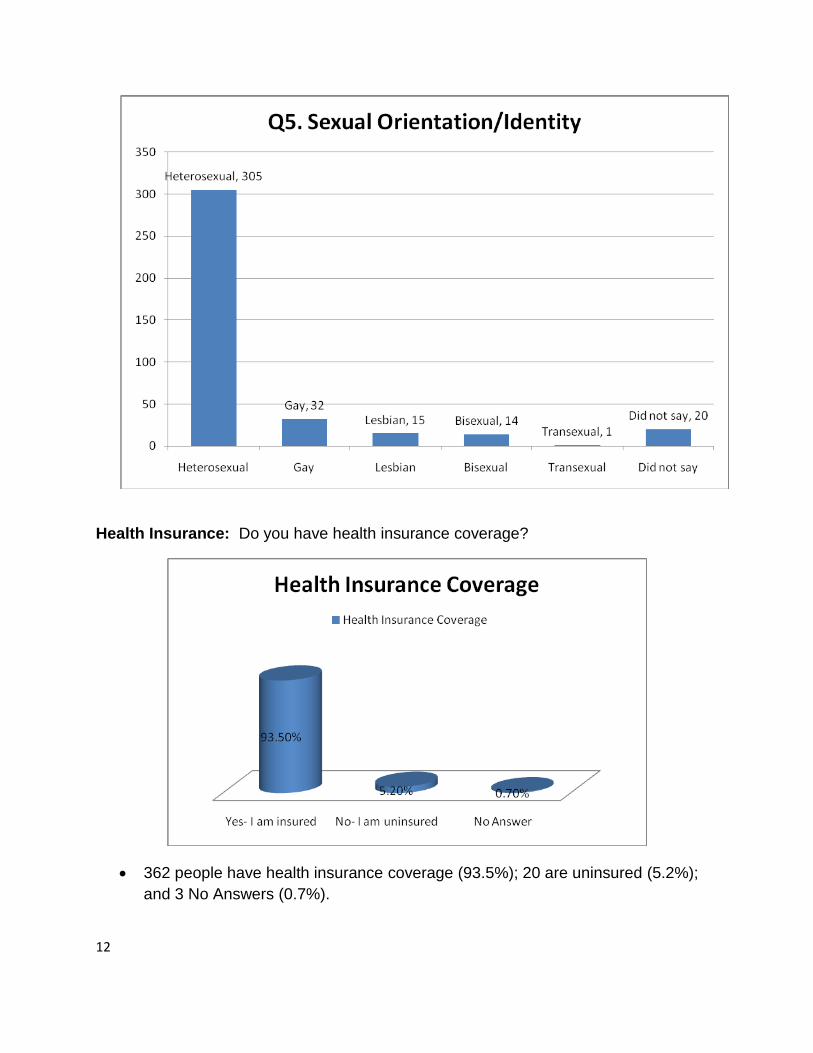
Health Insurance: Do you have health insurance coverage?
362 people have health insurance coverage (93.5%); 20 are uninsured (5.2%);
and 3 No Answers (0.7%).
13
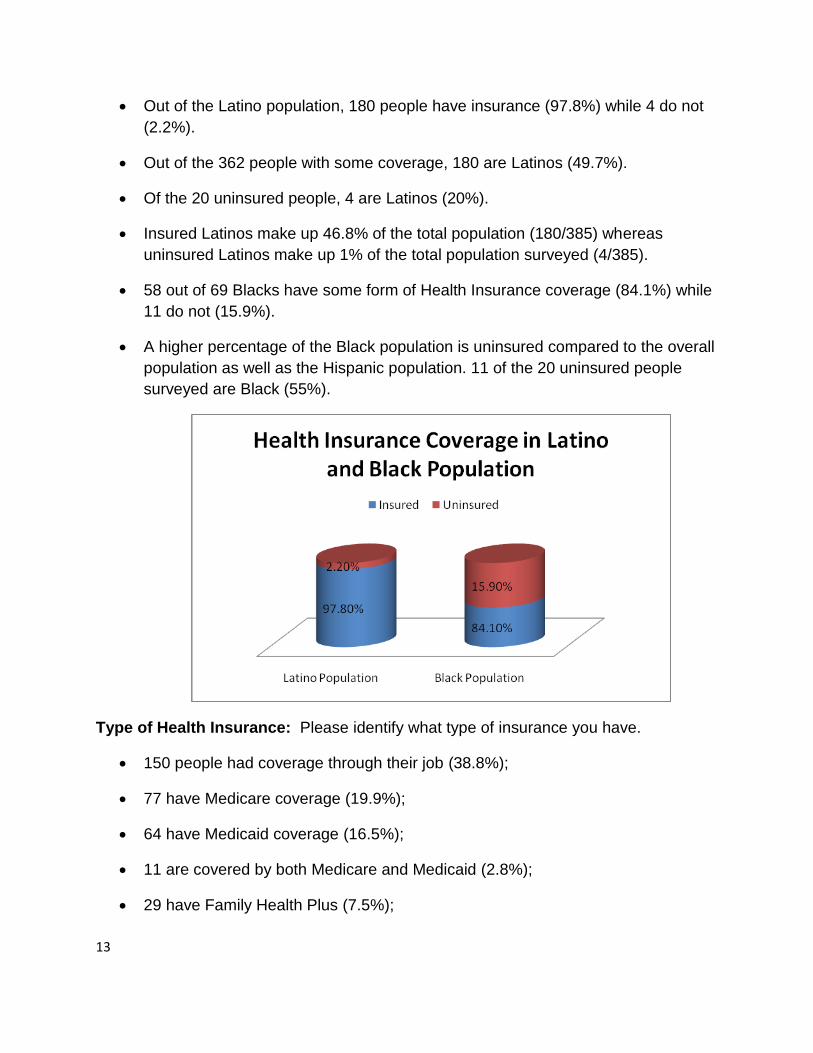
Out of the Latino population, 180 people have insurance (97.8%) while 4 do not
(2.2%).
Out of the 362 people with some coverage, 180 are Latinos (49.7%).
Of the 20 uninsured people, 4 are Latinos (20%).
Insured Latinos make up 46.8% of the total population (180/385) whereas
uninsured Latinos make up 1% of the total population surveyed (4/385).
58 out of 69 Blacks have some form of Health Insurance coverage (84.1%) while
11 do not (15.9%).
A higher percentage of the Black population is uninsured compared to the overall
population as well as the Hispanic population. 11 of the 20 uninsured people
surveyed are Black (55%).
Type of Health Insurance: Please identify what type of insurance you have.
150 people had coverage through their job (38.8%);
77 have Medicare coverage (19.9%);
64 have Medicaid coverage (16.5%);
11 are covered by both Medicare and Medicaid (2.8%);
29 have Family Health Plus (7.5%);
14
8 have Medicaid and Family Health Plus (2.1%);
15 respondents named an insurance company but not the type of coverage
(3.9%);
21 No Answers (5.4%).
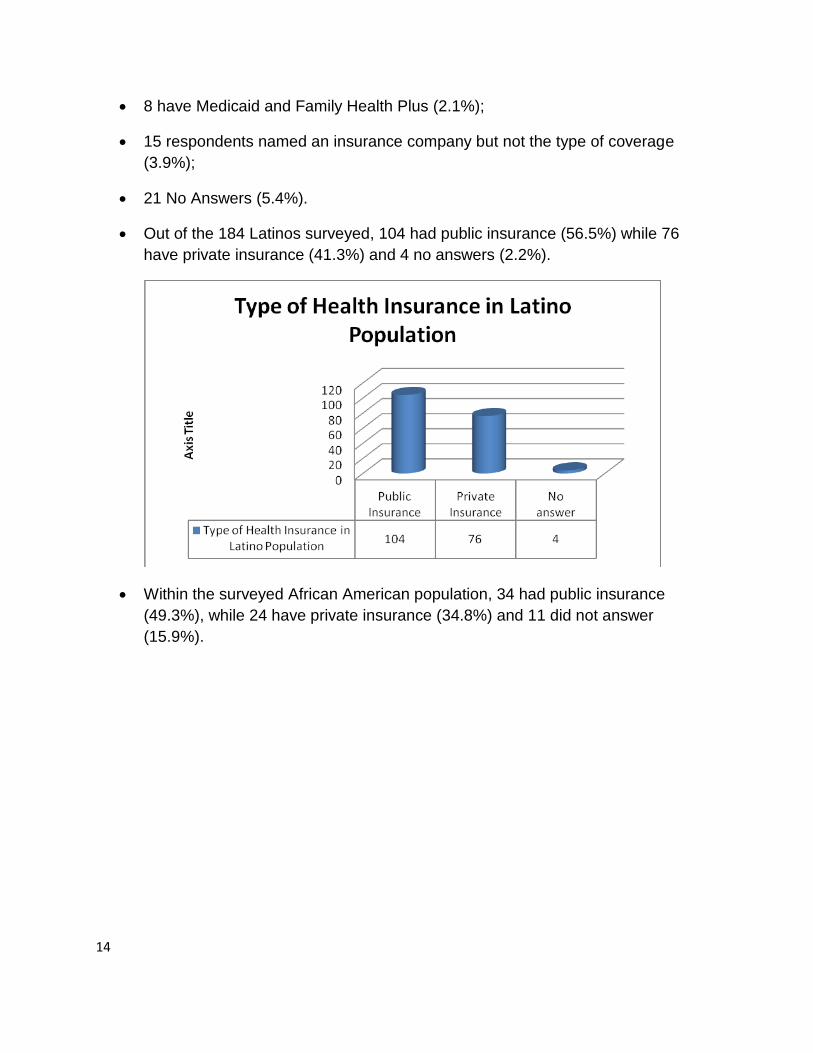
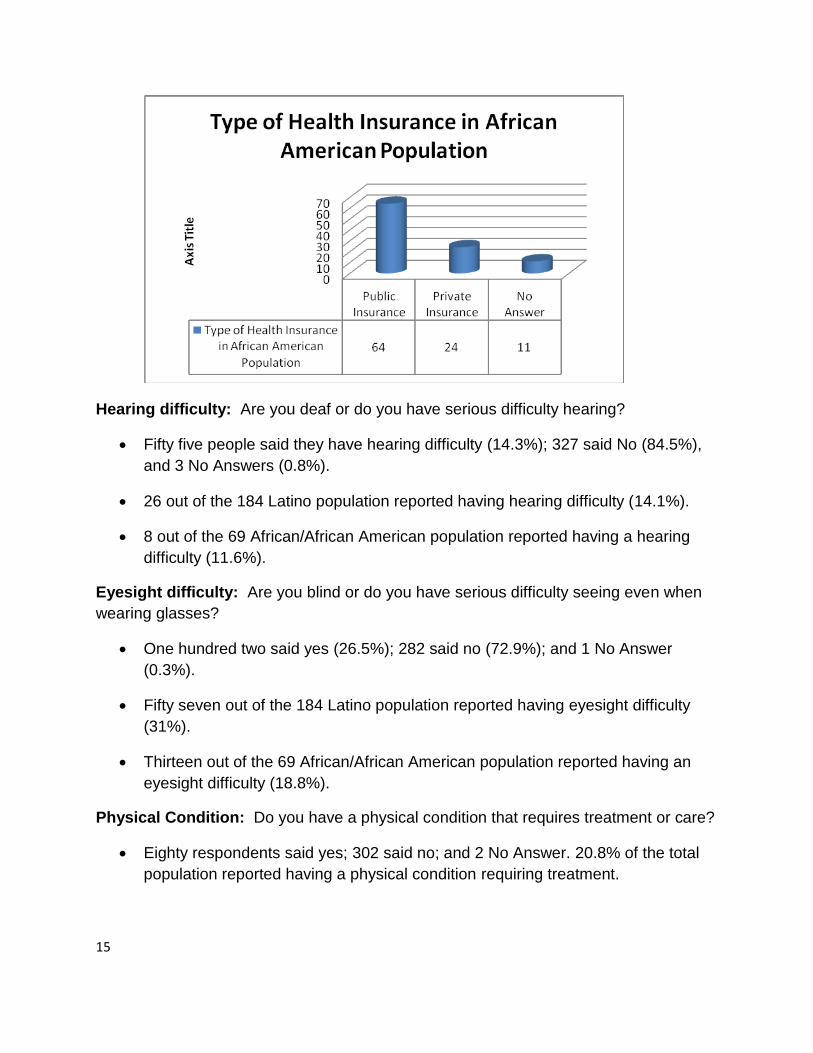
Out of the 184 Latinos surveyed, 104 had public insurance (56.5%) while 76
have private insurance (41.3%) and 4 no answers (2.2%).
Within the surveyed African American population, 34 had public insurance
(49.3%), while 24 have private insurance (34.8%) and 11 did not answer
(15.9%).
15
Hearing difficulty: Are you deaf or do you have serious difficulty hearing?
Fifty five people said they have hearing difficulty (14.3%); 327 said No (84.5%),
and 3 No Answers (0.8%).
26 out of the 184 Latino population reported having hearing difficulty (14.1%).
8 out of the 69 African/African American population reported having a hearing
difficulty (11.6%).
Eyesight difficulty: Are you blind or do you have serious difficulty seeing even when
wearing glasses?
One hundred two said yes (26.5%); 282 said no (72.9%); and 1 No Answer
(0.3%).
Fifty seven out of the 184 Latino population reported having eyesight difficulty
(31%).
Thirteen out of the 69 African/African American population reported having an
eyesight difficulty (18.8%).
Physical Condition: Do you have a physical condition that requires treatment or care?
Eighty respondents said yes; 302 said no; and 2 No Answer. 20.8% of the total
population reported having a physical condition requiring treatment.
16
46 out of the 184 Latino population reported having a physical condition requiring
treatment (25%).
Thirteen out of the 69 African/African American population reported having a
physical condition requiring treatment (18.8%).
Latinos had a higher percent (25%) of physical conditions requiring treatment.
Mental health condition: Do you have a mental health condition that requires
treatment or care?
Forty seven said yes; 336 said no; and 2 No Answer. 12.2% of the total
population reported having a mental health condition that requires treatment.
28 out of the 184 Latino population reported having a mental health condition
(15.2%).
Five out of the 69 African/African American population reported having a mental
health condition (7.2%).
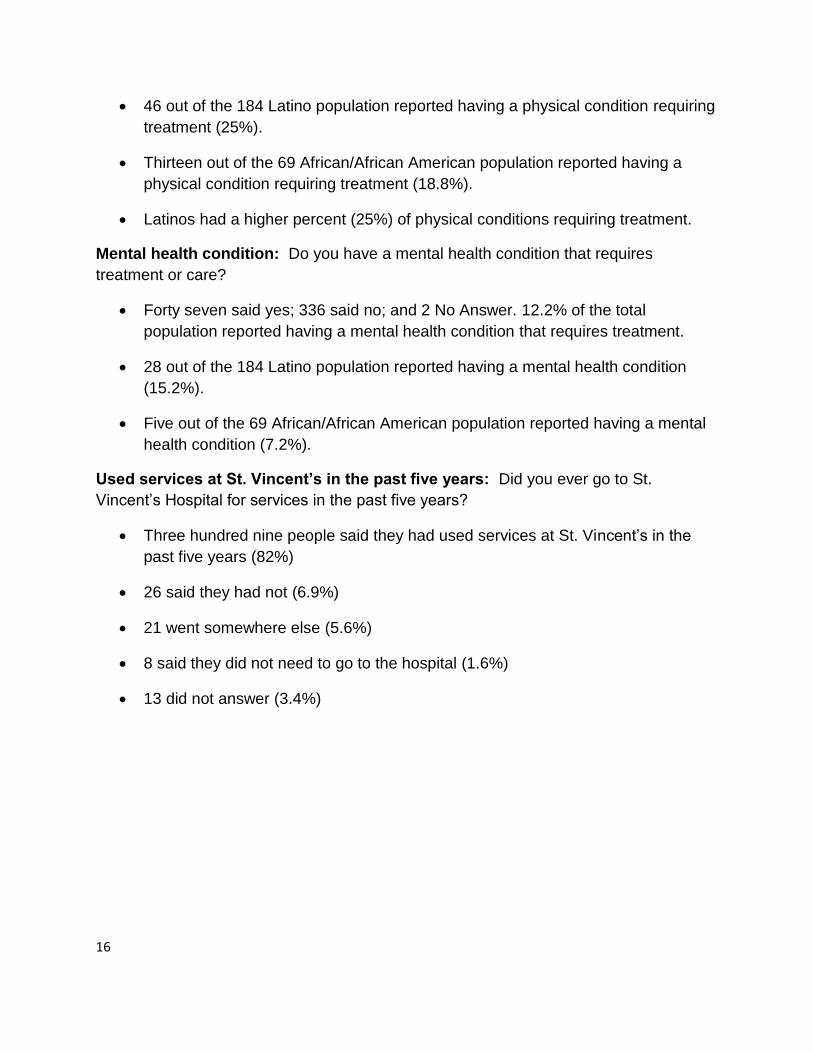
Used services at St. Vincent’s in the past five years: Did you ever go to St.
Vincent’s Hospital for services in the past five years?
Three hundred nine people said they had used services at St. Vincent’s in the
past five years (82%)
26 said they had not (6.9%)
21 went somewhere else (5.6%)
8 said they did not need to go to the hospital (1.6%)
13 did not answer (3.4%)
17
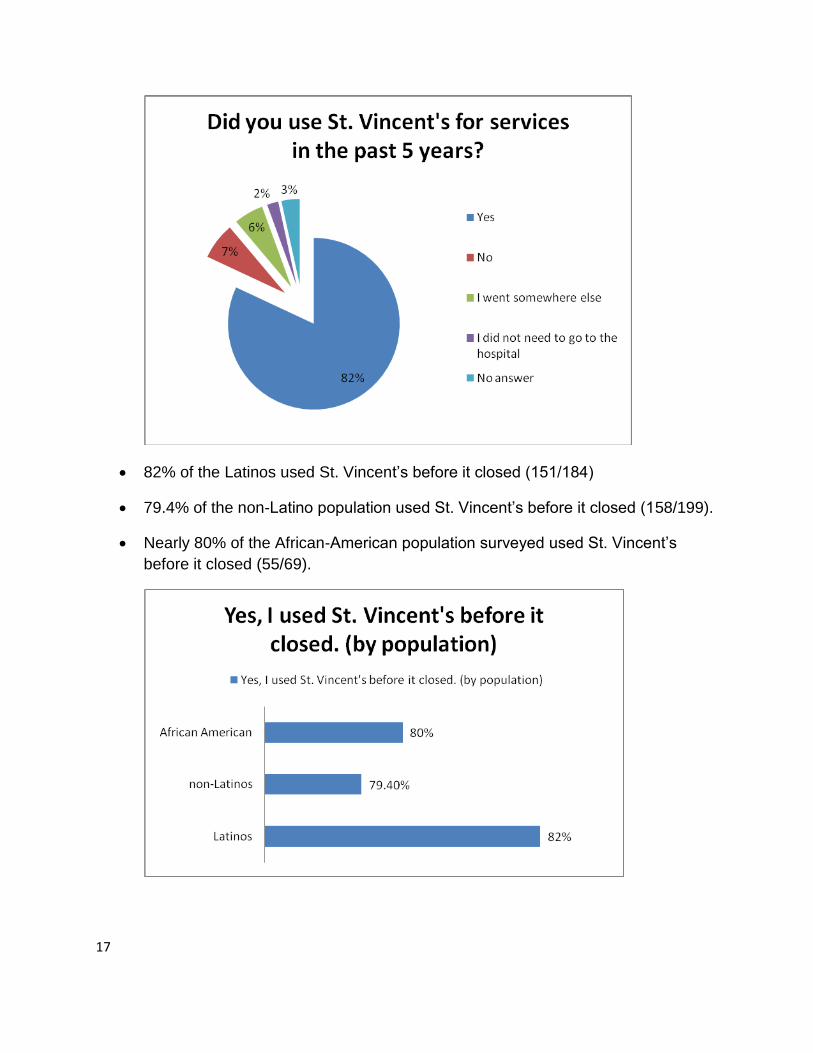
82% of the Latinos used St. Vincent’s before it closed (151/184)
79.4% of the non-Latino population used St. Vincent’s before it closed (158/199).
Nearly 80% of the African-American population surveyed used St. Vincent’s
before it closed (55/69).
18
Which services at St. Vincent’s were used (with possible multiple responses):
Two hundred twenty one people used the Emergency Room (57.1%)
203 used inpatient care (52.5%)
73 used the outpatient clinic (18.9%)
23 outpatient surgery (5.9%)
3 mental health (0.8%)
1 cancer care (0.3%)
1 HIV clinic (0.3%)
38 No Answers. (9.8%)
67.4% of the Latinos used inpatient services at St. Vincent’s before it closed
(124/184)
46.4% of the Black population surveyed used the inpatient services (32/69) and
53.6% used the Hospital’s Emergency Room services (37/69 before it closed
Inpatient services were used more heavily by the Latinos surveyed.
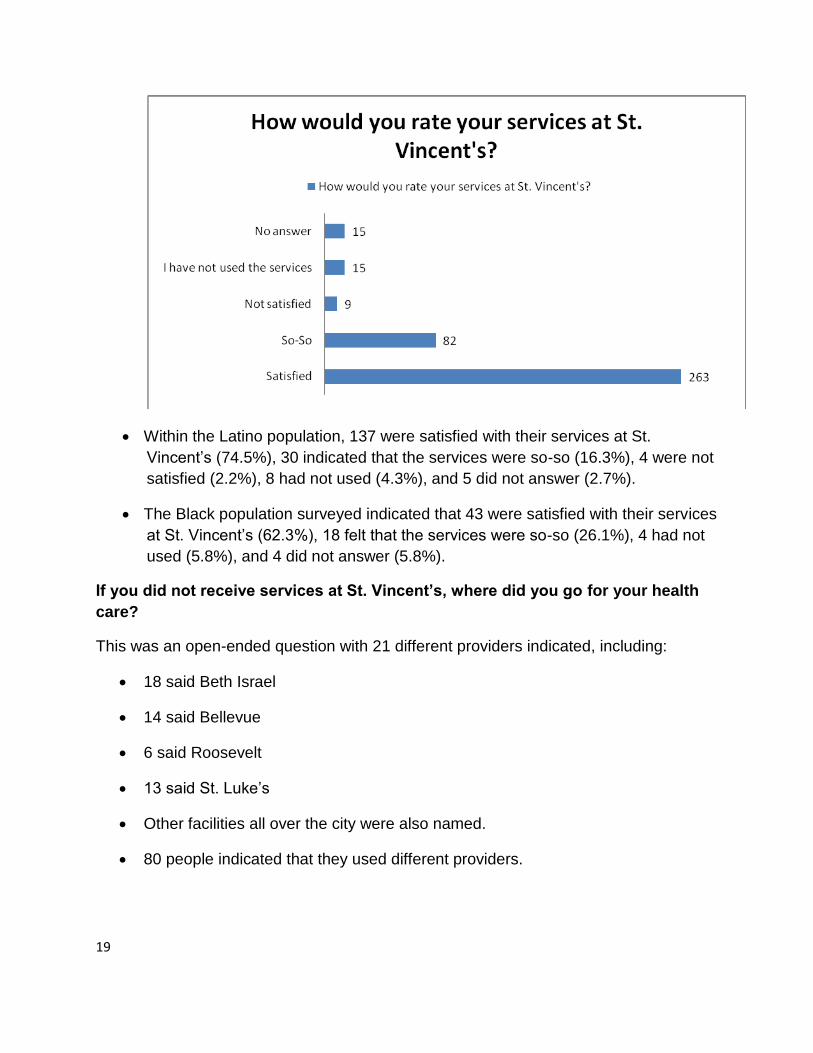
How would you rate your services at St. Vincent’s?
263 people indicated that they were satisfied
82 said the services were so-so
9 said they were not satisfied
16 said they had not used the services
15 there was No Answer.
19
Within the Latino population, 137 were satisfied with their services at St.
Vincent’s (74.5%), 30 indicated that the services were so-so (16.3%), 4 were not
satisfied (2.2%), 8 had not used (4.3%), and 5 did not answer (2.7%).
The Black population surveyed indicated that 43 were satisfied with their services
at St. Vincent’s (62.3%), 18 felt that the services were so-so (26.1%), 4 had not
used (5.8%), and 4 did not answer (5.8%).
If you did not receive services at St. Vincent’s, where did you go for your health
care?
This was an open-ended question with 21 different providers indicated, including:
18 said Beth Israel
14 said Bellevue
6 said Roosevelt
13 said St. Luke’s
Other facilities all over the city were also named.
80 people indicated that they used different providers.

20
Do you have a private doctor who was affiliated with St. Vincent’s:
101 people said yes (26.3%); 241 said no (62.8%); 39 indicated they do not know
(10.2%); and for 3 there was No Answer (0.8%).
Out of the 184 Latinos, 29.3% have a private doctor affiliated with St. Vincent’s
(54/184) while 59.8% do not (110/184) and 10.9% of this population did not know
whether or not their doctor was affiliated with St. Vincent’s (20/184).
In the Black population surveyed, 15 have a private doctor who was affiliated with
St. Vincent’s (21%), 47 did not (69%), and 7 did not know (10%).
Do you still get to see the same private doctor for your medical care:
180 said yes (47%); 186 said no (48.6%); for 17 there was No Answer (4.4%).
Out of the 184 Latinos, 39.1% still get to see the same private doctor (72/184)
while 57.6% do not (106/184) and 3.3% of this population did not answer (6/184).
African Americans: Yes: 35 (50.7%); No: 30 (43.5%); No answer: 4 (5.8%).
43.5% of the Black population surveyed does not see the same private doctor for
their medical care since the closing of St. Vincent’s Hospital.
If so, does he/she have an affiliation at a new hospital:
89 said yes (23.3%); 167 said no (43.7%); 95 said they do not know (24.9%); and
31 there was No Answer (8.1%).
Out of the 184 Latinos, 24.5% said that their doctor has an affiliation at a new
hospital (45/184) while 40.2% said that he/she does not (74/184) and 29.3% of
this population did not know whether their doctor was affiliated with a new
hospital (54/184) and 6% did not answer (11/184).
African Americans: Yes: 15 (21.7%); No: 30 (43.5%); Don’t know: 18 (26%); No
answer: 6 (8.7%). Most of the physicians seen by the Black population surveyed
do not have an affiliation at a new hospital since the closing of St. Vincent’s.
Which hospital:
29 said Beth Israel
8 said Roosevelt
10 said St. Luke’s
21
5 said Bellevue
5 said Downtown
2 said Jacobi
2 said Lenox Hill
310 people had No Answer.
Is your doctor affiliated with a community health center/clinic:
226 said no; 27 said yes; 16 did not know; 116 had No Answer. 7% of the total
population surveyed has a doctor affiliated with a community health center/clinic
(27/385), while 58.7% do not (226/385). 30% indicated that they did not know
(16/385) and 30.1% did not answer (116/385).
Out of the 184 Latinos, 8.2% have a doctor affiliated with a community health
center/clinic (15/184) while 58.2% do not (107/184) and 4.3% of this population
did not know whether or not their doctor was affiliated with a community health
center/clinic (8/184) and 29.3% did not answer (54/184).
African Americans: Yes: 4 (5.8%); No: 38 (55.1%); Don’t know: 1 (1.4%); No
answer: 26 (37.7%) Most of the physicians seen by the African American
population are not affiliated with a community health center/clinic.
Which health center/clinic:
343 had No Answer; and the rest named several different facilities; but only one was a
health center—union health center.
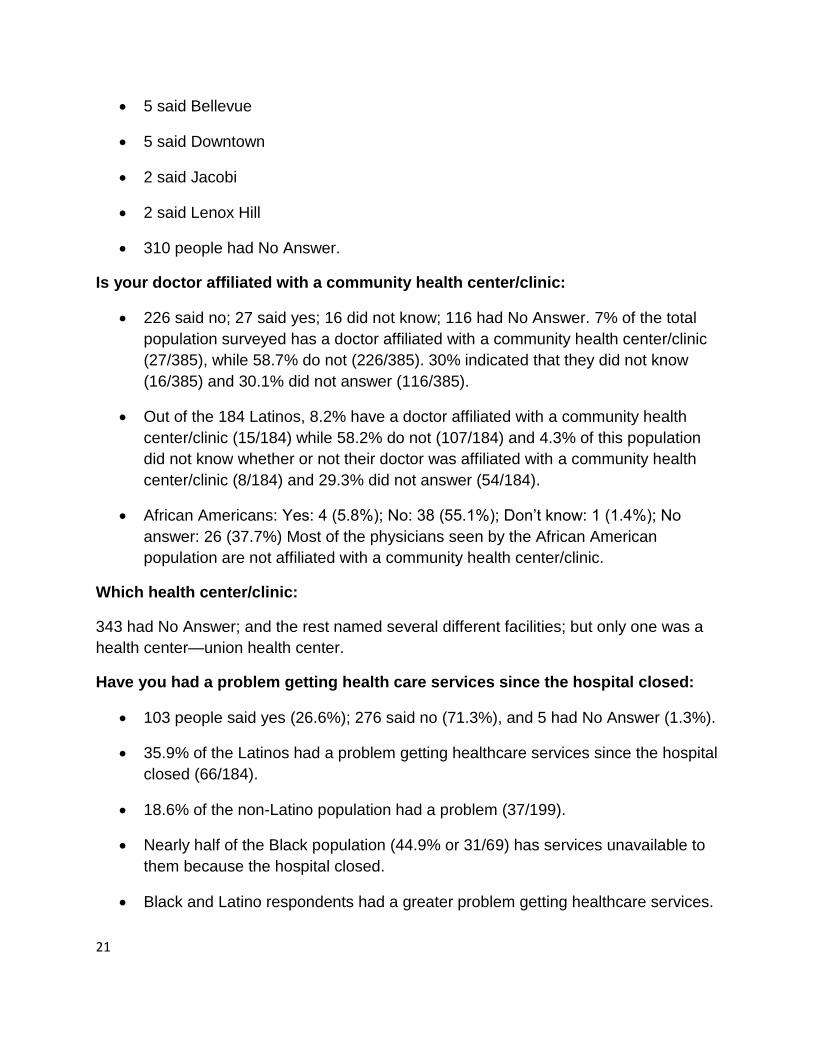
Have you had a problem getting health care services since the hospital closed:
103 people said yes (26.6%); 276 said no (71.3%), and 5 had No Answer (1.3%).
35.9% of the Latinos had a problem getting healthcare services since the hospital
closed (66/184).
18.6% of the non-Latino population had a problem (37/199).
Nearly half of the Black population (44.9% or 31/69) has services unavailable to
them because the hospital closed.
Black and Latino respondents had a greater problem getting healthcare services.
22
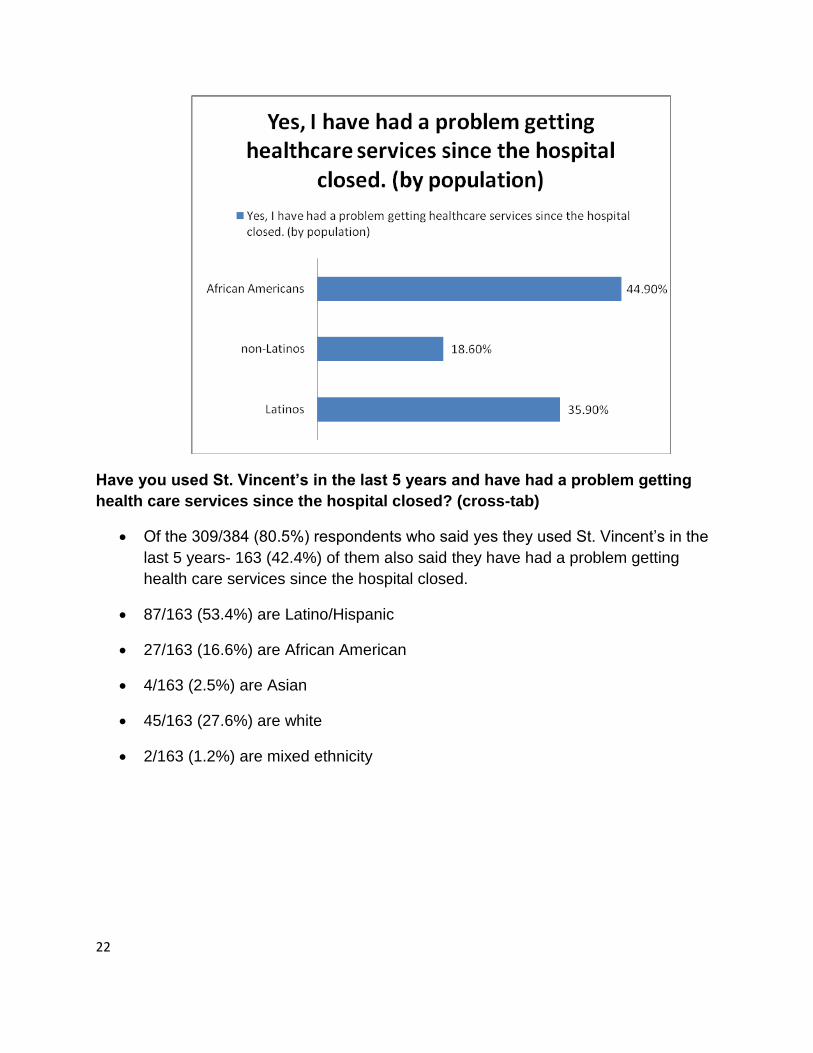
Have you used St. Vincent’s in the last 5 years and have had a problem getting
health care services since the hospital closed? (cross-tab)
Of the 309/384 (80.5%) respondents who said yes they used St. Vincent’s in the
last 5 years- 163 (42.4%) of them also said they have had a problem getting
health care services since the hospital closed.
87/163 (53.4%) are Latino/Hispanic
27/163 (16.6%) are African American
4/163 (2.5%) are Asian
45/163 (27.6%) are white
2/163 (1.2%) are mixed ethnicity
23
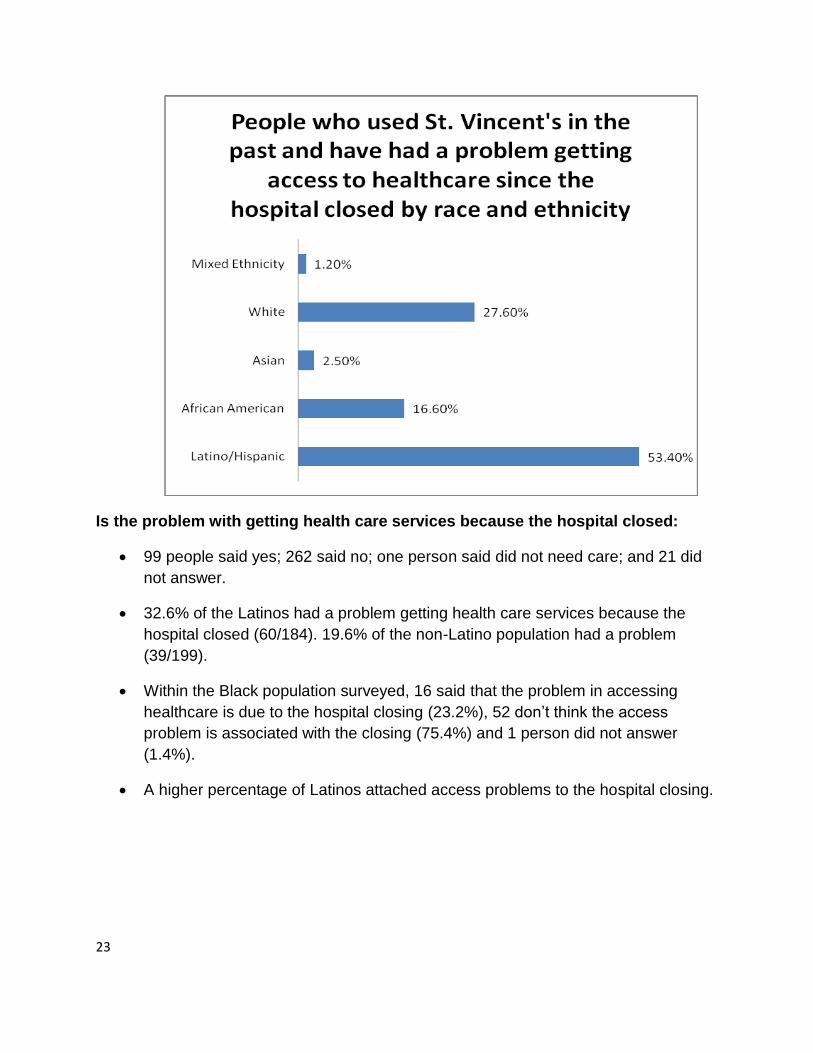
Is the problem with getting health care services because the hospital closed:
99 people said yes; 262 said no; one person said did not need care; and 21 did
not answer.
32.6% of the Latinos had a problem getting health care services because the
hospital closed (60/184). 19.6% of the non-Latino population had a problem
(39/199).
Within the Black population surveyed, 16 said that the problem in accessing
healthcare is due to the hospital closing (23.2%), 52 don’t think the access
problem is associated with the closing (75.4%) and 1 person did not answer
(1.4%).
A higher percentage of Latinos attached access problems to the hospital closing.
24
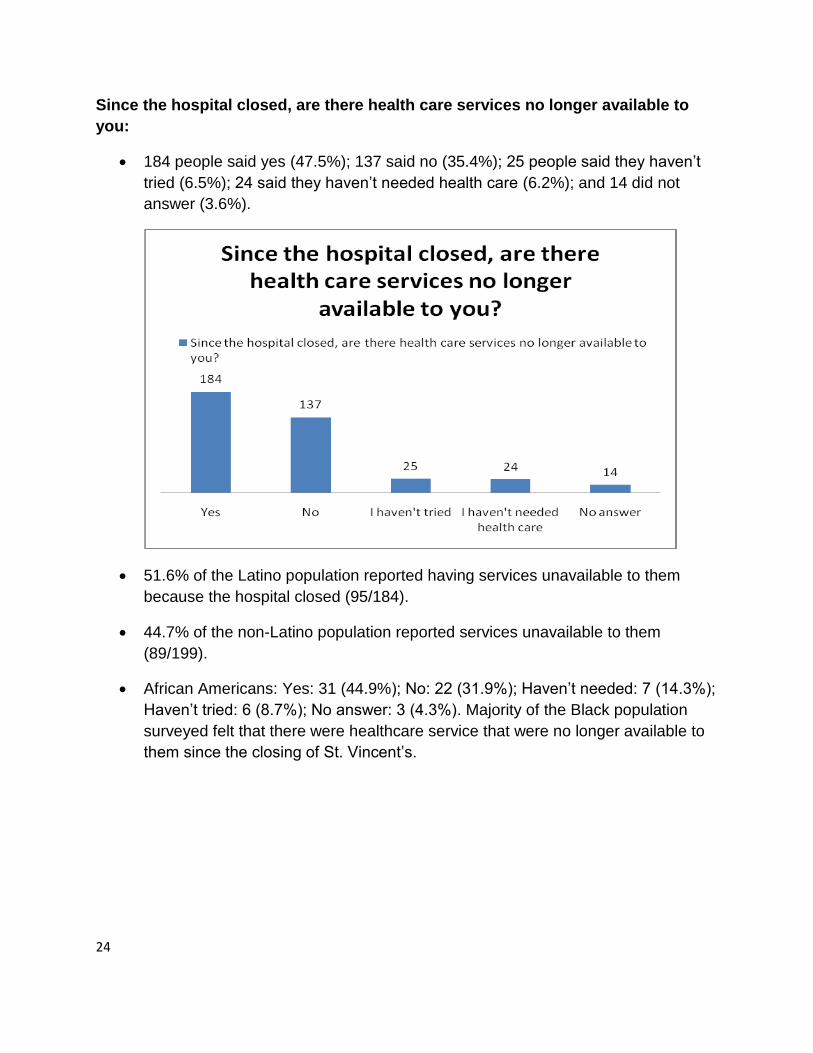
Since the hospital closed, are there health care services no longer available to
you:
184 people said yes (47.5%); 137 said no (35.4%); 25 people said they haven’t
tried (6.5%); 24 said they haven’t needed health care (6.2%); and 14 did not
answer (3.6%).
51.6% of the Latino population reported having services unavailable to them
because the hospital closed (95/184).
44.7% of the non-Latino population reported services unavailable to them
(89/199).
African Americans: Yes: 31 (44.9%); No: 22 (31.9%); Haven’t needed: 7 (14.3%);
Haven’t tried: 6 (8.7%); No answer: 3 (4.3%). Majority of the Black population
surveyed felt that there were healthcare service that were no longer available to
them since the closing of St. Vincent’s.

25
Please tell us about your experience: This is reported separately.
Were you able to get access to your medical records after the hospital closed:
135 people said yes; 110 said no; 134 said they did not try; for four people there
was no answer. 35.3% of the population (135/382) was able to get access to
medical records after the hospital closed; whereas, 28.6% was not (110/382).
Of the 184 Latinos, 63 were able to access their medical records (34.2%), 56
were not able to access their medical records (30.4%). 63 out of the 184 Latinos,
had not tried to access their medical records (34.2%).
In the Black population surveyed, 25 were able to access their medical records
(36.2%), 19 were not (27.5%), and 25 didn’t try (36.2%).
A high percentage of Black and Latino respondents were not able to access their
medical records.
Were you able to find a new place for care that is accessible:
144 said yes; 99 said no; 128 said they did not try; and 12 had no answer. 37.6%
of the population (144/383) was able to find a new place for care that is
accessible; whereas, 25.8% was not (99/383), 33.4% said that they did not try
(128/383), and 3.1% had no answer (12/383).
26
Of the 184 Latinos, 64 were able to find a new place for care (34.8%), 60 were
not able to do so (32.6). 56 out of the 184 Latinos, had not tried to find a new
place to get care (30.4%) and 4 did not answer (2.2%).
African Americans: Yes: 38 (55.1%); No: 12 (17.4%); Didn’t try: 17 (24.6%); No
answer: 2 (2.9%)
If you needed medicine, were you able to fill your prescriptions:
286 people said yes, 79 said no; 9 didn’t try; and 10 had no answer. 74.5% of the
population (286/384) was able to fill prescriptions after the hospital closed;
whereas, 20.6% was not (79/384), 2.3% said that they hadn’t tried (9/384) and
2.6% did not answer (10/384).
Of the 184 Latinos, 127 were able to fill prescriptions (69%), and 49 were not
able to fill prescriptions (26.6%). 6 out of the 184 Latinos, had not tried to fill
prescriptions (3.3%) and 2 did not answer (1.1%).
African Americans: Yes: 55 (79.7%); No: 10 (14.5%); No answer: 4 (5.8%)
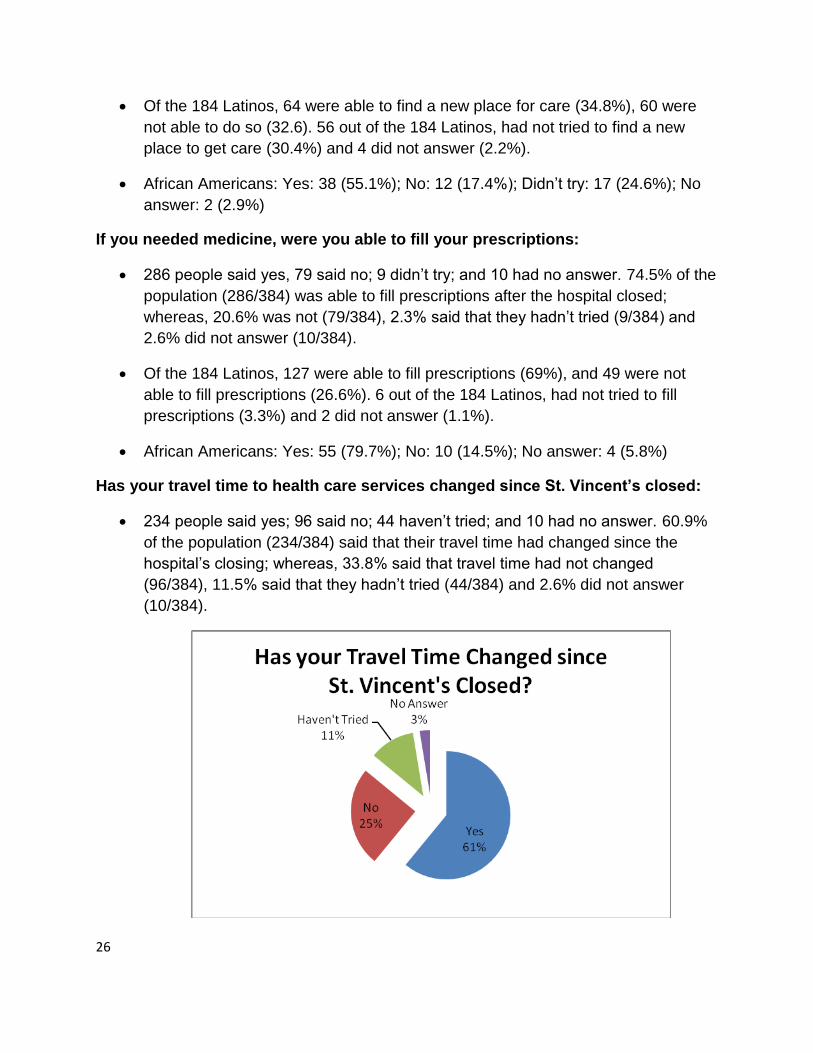
Has your travel time to health care services changed since St. Vincent’s closed:
234 people said yes; 96 said no; 44 haven’t tried; and 10 had no answer. 60.9%
of the population (234/384) said that their travel time had changed since the
hospital’s closing; whereas, 33.8% said that travel time had not changed
(96/384), 11.5% said that they hadn’t tried (44/384) and 2.6% did not answer
(10/384).
27
Of the 184 Latinos, 109 said that their travel times had changed (59.2%), and 46
said that travel times did not change (25%). 25 out of the 184 Latinos, had not
tried to travel for care (13.6%) and 4 did not answer (2.2%).
African Americans: Over half (62.3% or 43/69) reported that travel time to access
health care changed since the closure of St. Vincent’s.
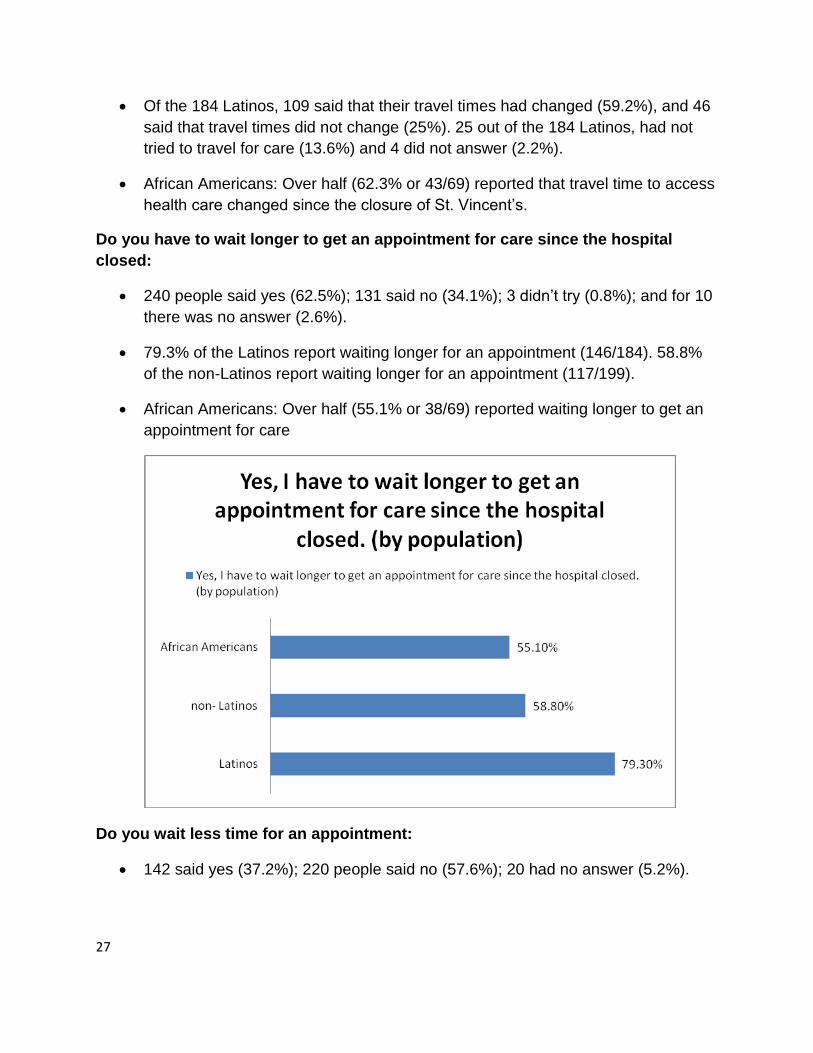
Do you have to wait longer to get an appointment for care since the hospital
closed:
240 people said yes (62.5%); 131 said no (34.1%); 3 didn’t try (0.8%); and for 10
there was no answer (2.6%).
79.3% of the Latinos report waiting longer for an appointment (146/184). 58.8%
of the non-Latinos report waiting longer for an appointment (117/199).
African Americans: Over half (55.1% or 38/69) reported waiting longer to get an
appointment for care
Do you wait less time for an appointment:
142 said yes (37.2%); 220 people said no (57.6%); 20 had no answer (5.2%).
28
Of the 184 Latinos, 74 said that they had to wait less time for an appointment,
(40.2%) and 102 said that they did not have to wait less time for an appointment,
(55.4%) and 8 did not answer (4.3%).
Black population: 36 said no (52.2%), 31 said yes (44.9%), and 2 did not answer
(2.9%)
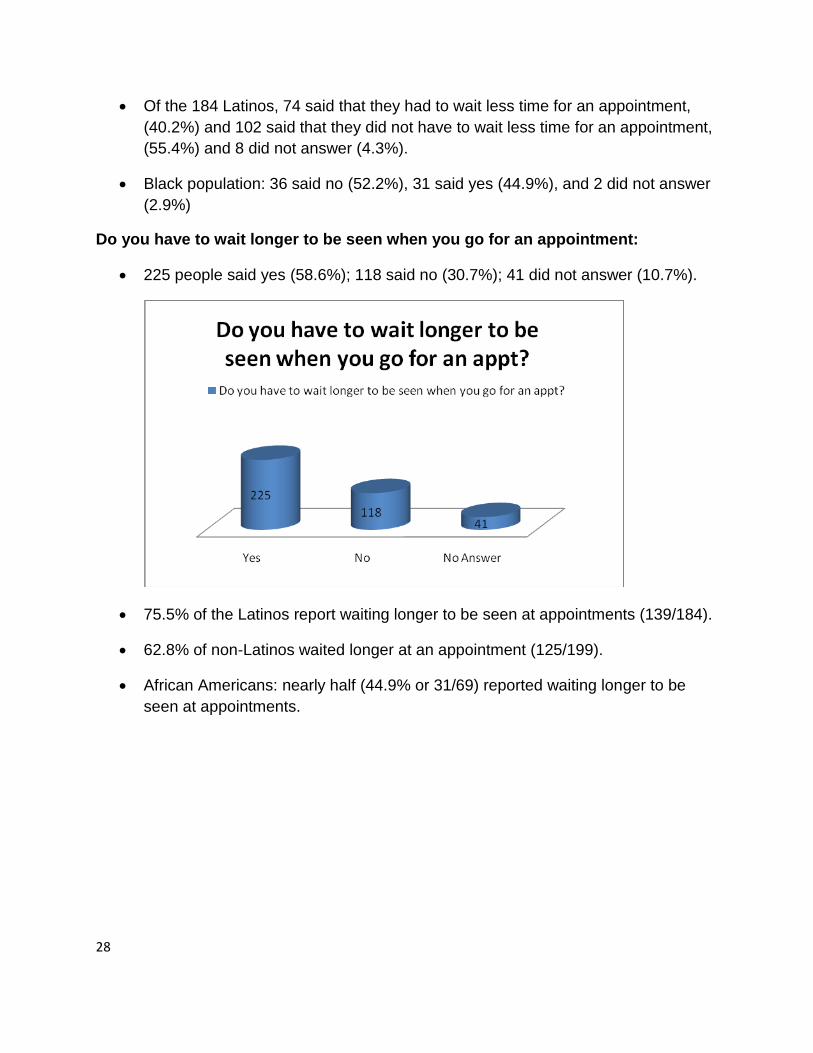
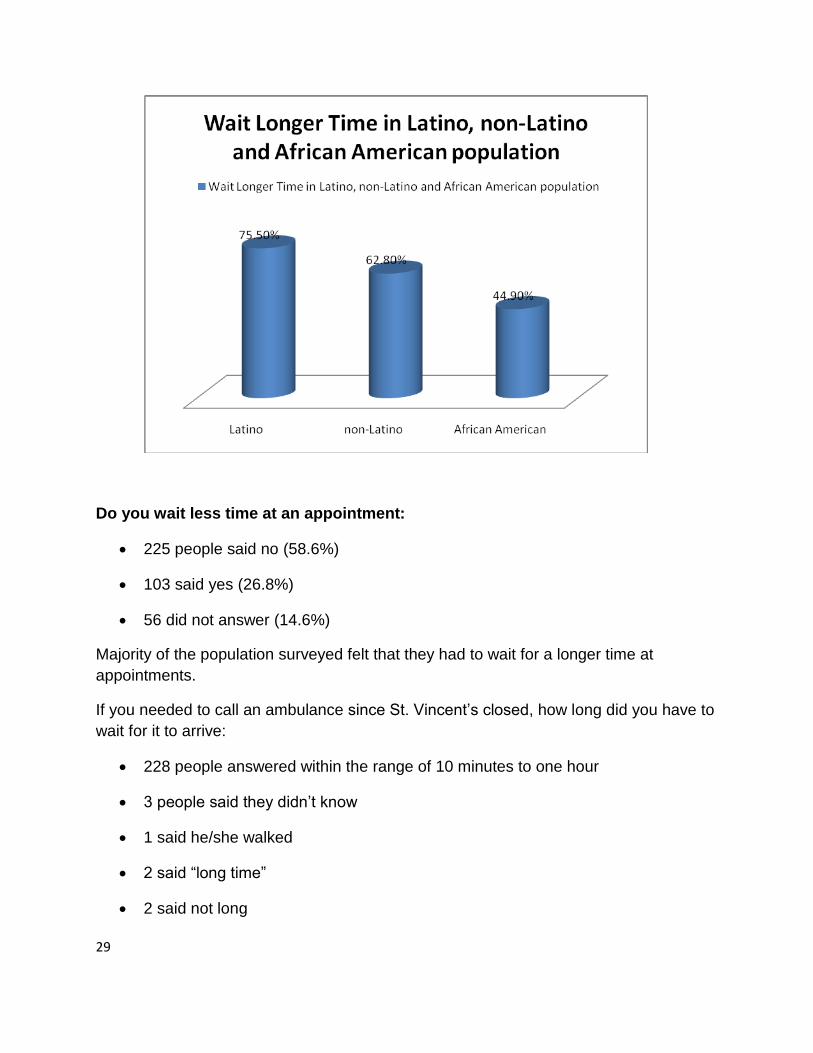
Do you have to wait longer to be seen when you go for an appointment:
225 people said yes (58.6%); 118 said no (30.7%); 41 did not answer (10.7%).
75.5% of the Latinos report waiting longer to be seen at appointments (139/184).
62.8% of non-Latinos waited longer at an appointment (125/199).
African Americans: nearly half (44.9% or 31/69) reported waiting longer to be
seen at appointments.
29
Do you wait less time at an appointment:
225 people said no (58.6%)
103 said yes (26.8%)
56 did not answer (14.6%)
Majority of the population surveyed felt that they had to wait for a longer time at
appointments.
If you needed to call an ambulance since St. Vincent’s closed, how long did you have to
wait for it to arrive:
228 people answered within the range of 10 minutes to one hour
3 people said they didn’t know
1 said he/she walked
2 said ―long time‖
2 said not long
30
65 did not answer.
If you needed to go to an Emergency Room for care since St. Vincent’s closed,
how long did you have to wait to be seen:
The range of responses was from 15 minutes to 4-5 hours. With:
131 saying one hours
90 saying 2-3 hours
17 saying 4-5 hours.
Other said a while, long time, all day, not wait and not long.
52 people did not answer this question.
Responses to the two Open- Ended Questions:
People were asked to tell about their experience since the closing of the hospital.
There were 75 written responses to this question.
Some of the comments included:
―Commute is longer for sick patients‖
―Hard to travel to any other hospital‖
―Have to find somewhere else to go‖
―My consulting services have ended‖
―Need help to monitor my diabetes‖
―Need hospital for HIV‖
―The nutrition services are gone‖
Is there anything else that you want to tell us about your current experience with
health care services since St. Vincent’s closed:
The responses will be evaluated in three different categories: a request for services;
problems; and want/need a hospital. Some of the comments included:
―Don’t want to attend any other hospital‖
―Fear of getting to hospital on time and not knowing which hospital I will be taken to‖
―I am more nervous because I have to travel‖
―If something does happen result may be more extensive than need be‖
―Mother is 86 does not feel comfortable without hospital near by‖
―Please give new hospital to the neighborhood‖
―The distance to go for an emergency is too far.‖