Embed Size (px)
Citation preview
Qualitative Data Analysis Workshop
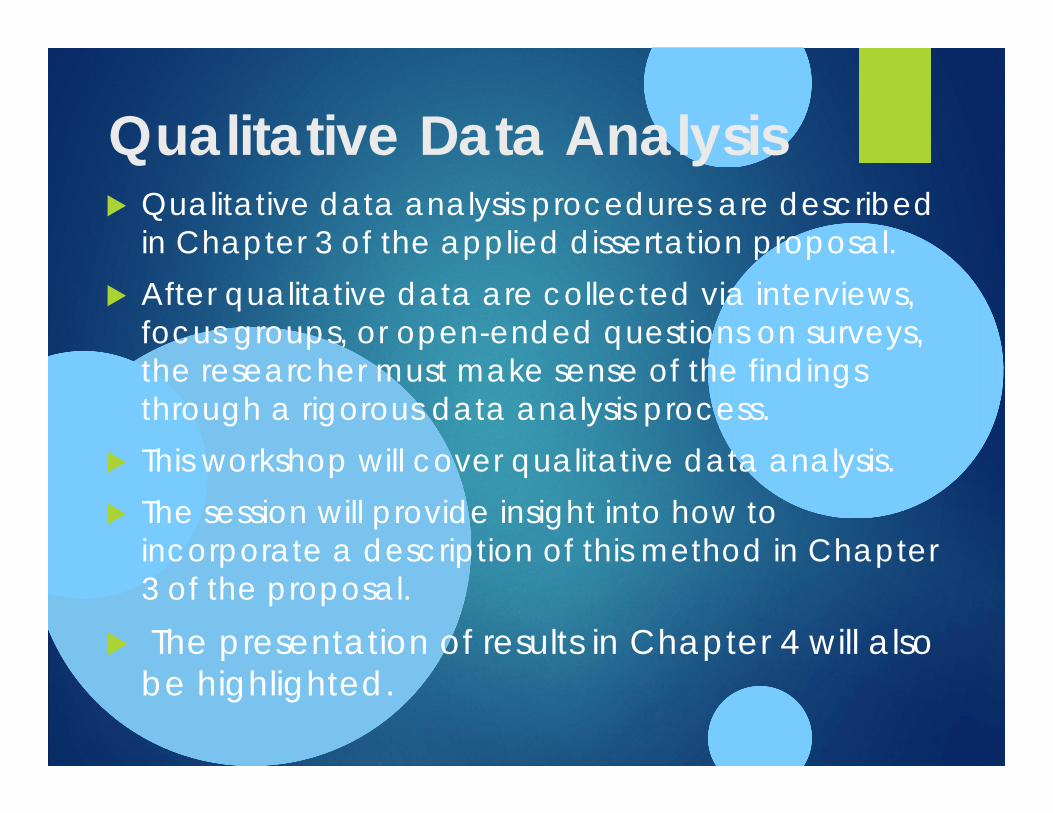
Qualitative Data Analysis Qualitative data analysis procedures are described
in Chapter 3 of the applied dissertation proposal. After qualitative data are collected via interviews,
focus groups, or open-ended questions on surveys, the researcher must make sense of the findings through a rigorous data analysis process.
This workshop will cover qualitative data analysis. The session will provide insight into how to
incorporate a description of this method in Chapter 3 of the proposal.
The presentation of results in Chapter 4 will also be highlighted.
Chapter 3: MethodologyAim of the StudyQualitative Research ApproachParticipantsData Collection ToolsProcedures Data AnalysisEthical ConsiderationsTrustworthinessPotential Research BiasLimitations
Chapter 4: Findings
With an ethnographic approach, the findings may be reported in a smooth and flowing description narrative. The aim of the narrative is to portray a full context of the experiences and the culture of research participants as observed and analyzed.
With a phenomenological approach, the findings will be reported differently. Examples might include descriptions of (a) experiential themes, (b) the essences of experience, and (c) relationships among essences.
Overview
What is qualitative data analysis?
How do I conduct qualitative data analysis and present results?
Defining Qualitative Data
Words Feelings Actions Rituals Experiences Perspectives Impressions Events Artifacts Symbols
Defining Qualitative Data Sources
Interviews and Transcripts
Observations and Field Notes
Documents
Pictures and Images
Audio and Visual Recordings

Defining Qualitative Data Analysis
Qualitative data analysis is the rigorous process of selecting qualitatively distinct data, articulating the qualitative meaning ascribed to those units, and commenting on the qualitative similarities and differences noted between and among these distinct units of data.

Defining Qualitative Data Analysis (cont.)The goal of qualitative data analysis is to describe, explain, and/or interpret qualitative patterns by using words, numbers, matrices, pictures, sounds, or other forms of representation.
No Findings (Not Research)
Presenting data as if they were the findings
Reproducing interview data, case histories, or collected stories in a reduced form with minimal or no interpretation of those data
Containing no analysis and no interpretation
(Sandelowski & Barroso, 2003, pp. 909‐910)
The “Nuts and Bolts” Codes, Categories, and Themes
Analysis
Memos
Evidence
Style
Decide How You Will Code
Look at the tradition. Are you going to have pre-existing categories (to
support the literature)? Identify what type of coding you will use (this
depends on your tradition). Are you going to use software?
Example of Coding
Open coding: First, you look at your data. Read the data over and over again. Next, you create labels to establish meaning from the things people are saying. You call these labels categories. It is like summarizing what you see happening. You look at words that participants are saying and you start labeling them. Categories emerge though the text; the categories will have meaning. Meaning will come from these explanations.
Tips for Open Coding Read the data carefully. Read and reread
the transcripts. Identify key statements in order to form
categories. Assign categories; these categories or codes
should relate to the significant statements. After you name the codes, you organize the
related statement under its appropriate code. This is referred to as open coding.
Coding
Identify the type of coding you will use; for example,
Axial coding: Looks at the relationships among the open codes. You have to look at what is common between the codes. What connections do you see? What influences these connections? Look for the conditions that make it happen, the context in which it is part of, and the strategies that are used to accomplish it? Last, what are the consequences of these strategies?
Tips for Axial Coding
After identifying the categories, the researcher rereads the transcripts to look for significant statements that fit under these categories. Then the researcher continues to read these significant statements over and over to find other codes that explain these significant statements. An explanation of these statement will emerge.
Further codes may also be developed in this stage.
Coding Continues…
• Selective coding: You are looking for core variables that make up all the data together. Then you look at the transcript and look for coding data that connects to these core variables.
• There are many types of coding you can use.
Codes, Categories, and Themes
Articulating the relationship between meaning and data (codes, categories, themes)
Internal integrity (i.e., Is there a high degree of homogeneity across the individual codes or across the coded units within the categories?)
External integrity (i.e., Is there a high degree of heterogeneity or differentiation between the array of homogeneous codes, categories, or themes?) (Chenail, 2008)
Codes, Categories, and Themes (cont.) Exhaustive system of codes, categories, and
themes (i.e., no significant and meaningful feature of the phenomenon under study falls outside of the array)
Dual planes of focus: horizontality (i.e., category‐to‐category relationships) and verticality (i.e., category‐to‐phenomena relationships)
(Chenail, 2008)
Codes, Categories, and Themes (cont.) Origination (i.e., Where does the responsibility
reside for the creation of the codes/categories?)
Verification (i.e., How are the codes/categories justified?) (Constas, 1992)
Codes, Categories, and Themes (cont.) Nomination (i.e., What are the sources of names
for codes and categories?)
Timing (i.e., sharing when decisions were made‐‐before the data collection began, after the data are collected, or throughout the data collection process)
(Constas, 1992)
Analysis
Making sense of the codes, categories, and themes in context (i.e., research question and literature)
Shifting from information to knowledge
Asking yourself the question, “What have I learned?”
Memos
Memos are notes in which we make transparent the meaning of our codes, categories, themes, and analysis.
Memos are the start of the analysis and the results.
Memos create our audit trails.
Evidence
Data as star
Juxtaposition
Exemplars for every assertion, pronouncement, or declaration (Chenail, 1995)
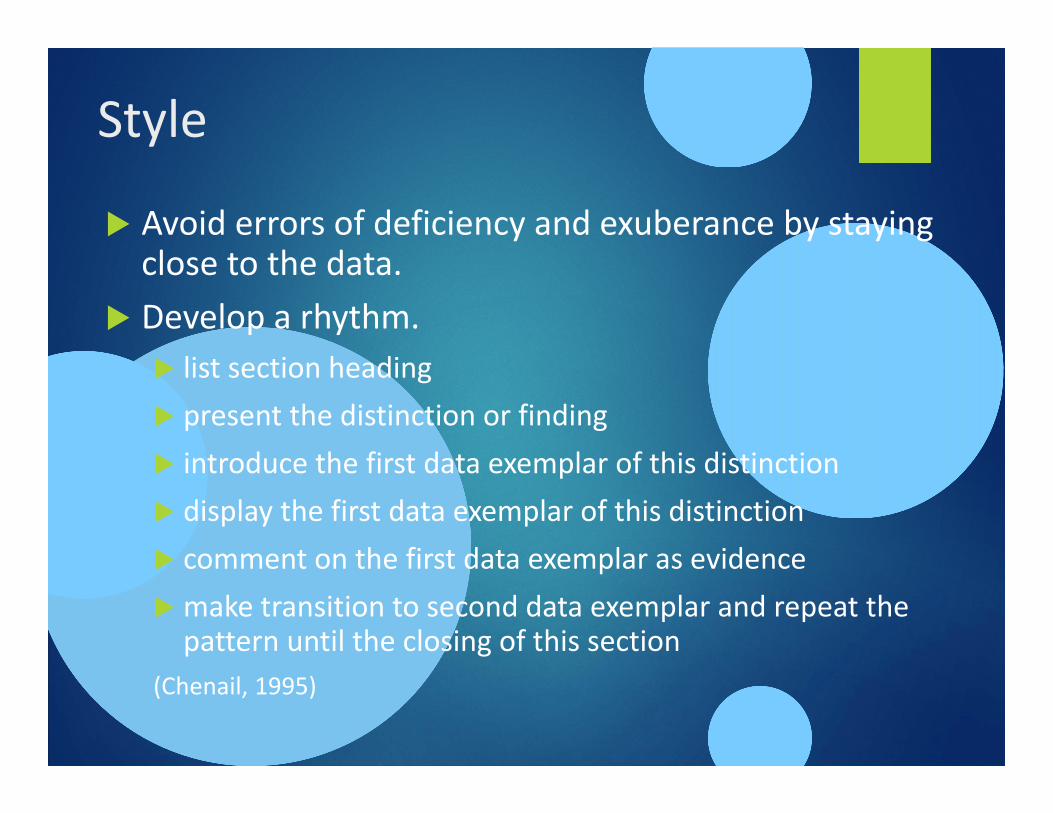
Style
Avoid errors of deficiency and exuberance by staying close to the data.
Develop a rhythm. list section heading present the distinction or finding introduce the first data exemplar of this distinction display the first data exemplar of this distinction comment on the first data exemplar as evidencemake transition to second data exemplar and repeat the pattern until the closing of this section
(Chenail, 1995)
Relationships
Relationship between data collection and data analysis
Relationship between data analysis and writing up results
Quality Control: Validating Your Data
Instrumentation
Piloting
Transparency
Audit Trails
Constant Comparison
Member Checking
Peer or Expert Debriefing
Multiple Coders
Exemplars
Themes Verification
Things to Remember
Maintain Coherence and Build Confidence
Stay Focused on the Research Question
The Role and Place of the Literature
Technology

Themes
Explain the themes that emerged. Verify the themes. Relate the themes back to the research
questions. Did you answer your questions? Did any new themes emerge? Relate everything back to your framework.
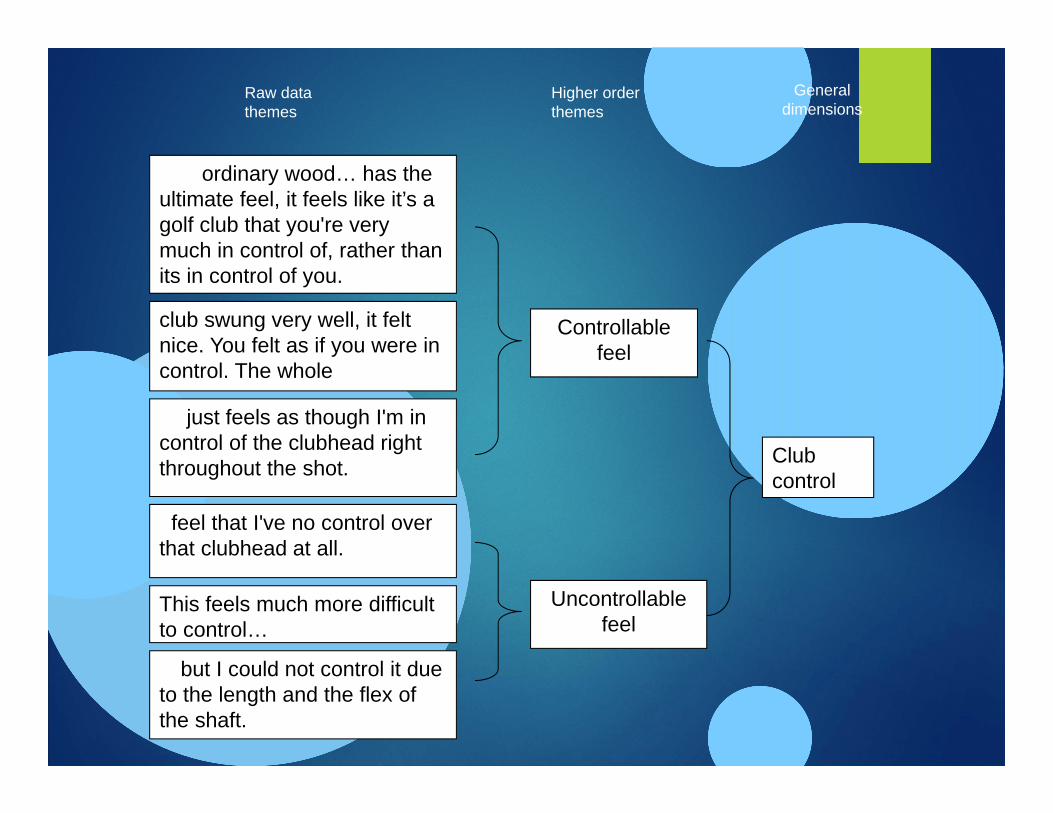
The ordinary wood… has the ultimate feel, it feels like it’s a golf club that you're very much in control of, rather than its in control of you.
club swung very well, it felt nice. You felt as if you were in control. The whole
… just feels as though I'm in control of the clubhead right throughout the shot.
I feel that I've no control over that clubhead at all.
This feels much more difficult to control…
…but I could not control it due to the length and the flex of the shaft.
Controllable feel
Uncontrollable feel
Club control
Raw data themes
Higher order themes
General dimensions

Resources
https://prpost.wordpress.com/2013/07/22/an-example-of-how-to-perform-open-coding-axial-coding-and-selective-coding/
http://learningstore.uwex.edu/assets/pdfs/G3658-12.PDF
Examples
https://www.utexas.edu/academic/ctl/assessment/iar/programs/report/focus-QualCode.php
http://onlineqda.hud.ac.uk/Intro_QDA/phpechopage_titleOnlineQDA-Examples_QDA.php
http://www.qualitative-research.net/index.php/fqs/article/view/1886/3528
http://www.cjlt.ca/index.php/cjlt/article/view/174/170
http://provalisresearch.com/products/qualitative-data-analysis-software/
References
Chenail, R. J. (1995). Presenting qualitative data. The Qualitative Report, 2(3). Retrieved from http://www.nova.edu/ssss/QR/QR2‐3/presenting.html
Chenail, R. J. (2008). Categorization. In L. M. Given (Ed.), The SAGE encyclopedia of qualitative research methods (Vol. 1, pp. 72‐73). Thousand Oaks, CA: SAGE.
Chenail, R. J. (2012). Conducting qualitative data analysis: Managing dynamic tensions within. The Qualitative Report, 17, 1‐6. Retrieved from
http://www.nova.edu/ssss/QR/QR17/chenail‐tensions.pdf
References (cont.)
[Qualitative data analysis slides courtesy of Ron Chenail]
Constas, M. A. (1992). Qualitative analysis as a public event: The documentation of category development procedures. American Educational Research Journal, 29, 253‐266.
Moustakas, C. (1994). Phenomenological research methods. Thousand Oaks, CA: SAGE.
Sandelowski, M., & Barroso, J. (2003). Classifying the findings in qualitative studies. Qualitative Health Research, 13(7), 905‐923.
Resources
Online QDA: http://onlineqda.hud.ac.uk/index.php
The Qualitative Report and The Weekly Qualitative Report: http://www.nova.edu/ssss/QR/
Foss, S. K., &Waters, W. (2003). Coding & analysis of qualitative data. Retrieved from http://www.abdsurvivalguide.com/News/020603.htm