Embed Size (px)
Citation preview
Laurie Prange (Prange-Martin)
Qualitative Data Visualization: Presenting Non-Numerical Data
Laurie Prange (Prange-Martin)
PhD Candidate Aalborg University
SCOPe: Science Community of Practice Yukon
5 October 2017
Laurie Prange (Prange-Martin)
Introduction
This is an introduction to presenting non-numerical qualitative data for
researchers who need to give a presentation, write a report, or build
an online exhibit.
Laurie Prange (Prange-Martin)
About the Presenter
• Laurie Prange (Prange-Martin) is a PhD Candidate in the Business Economics Programme at Aalborg University in Denmark.
• Dissertation defense Winter 2018 (expected)
• Studying how and why new industries emerge in remote regions – case study of Yukon ICT sector
• Previously librarian and instructor at Yukon College
Laurie Prange (Prange-Martin)
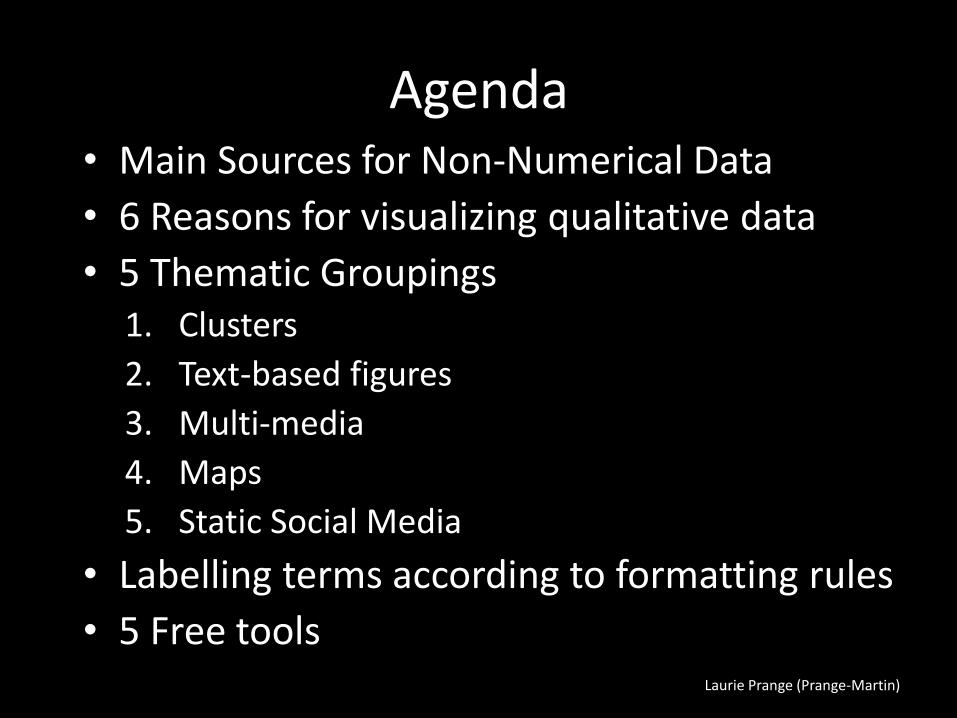
Agenda • Main Sources for Non-Numerical Data
• 6 Reasons for visualizing qualitative data
• 5 Thematic Groupings 1. Clusters
2. Text-based figures
3. Multi-media
4. Maps
5. Static Social Media
• Labelling terms according to formatting rules
• 5 Free tools
Laurie Prange (Prange-Martin)
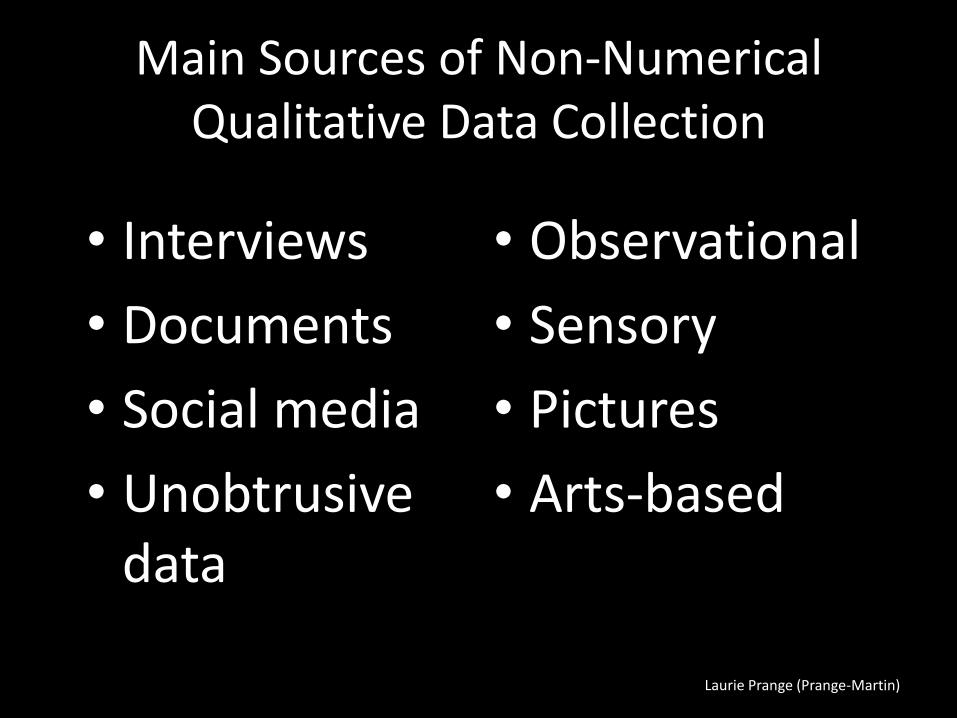
Main Sources of Non-Numerical Qualitative Data Collection
• Interviews
• Documents
• Social media
• Unobtrusive data
• Observational
• Sensory
• Pictures
• Arts-based
Laurie Prange (Prange-Martin)
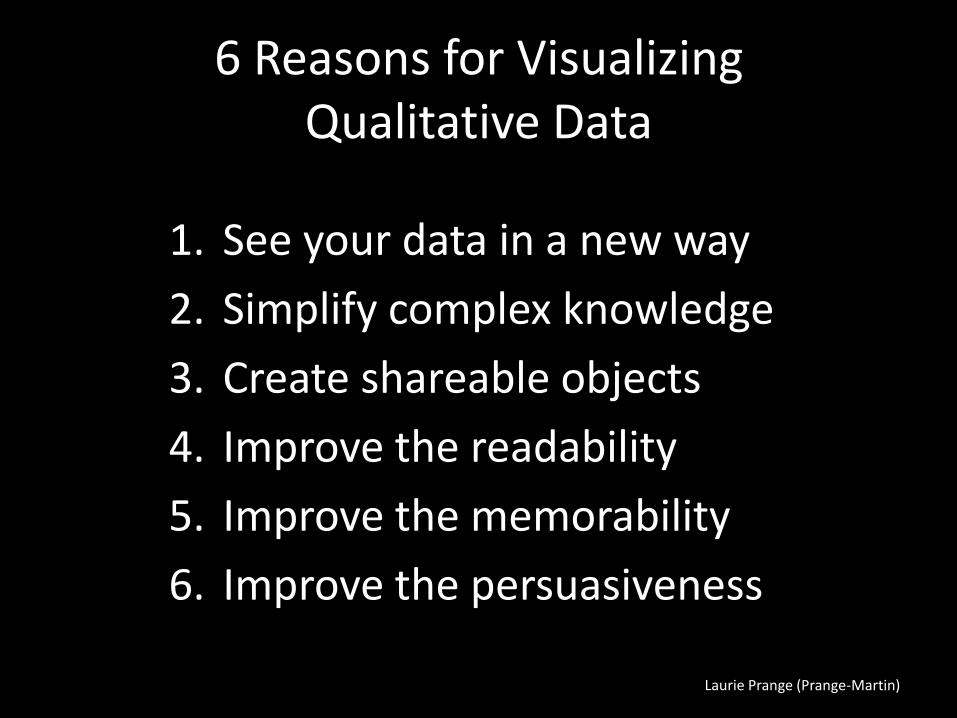
6 Reasons for Visualizing Qualitative Data
1. See your data in a new way
2. Simplify complex knowledge
3. Create shareable objects
4. Improve the readability
5. Improve the memorability
6. Improve the persuasiveness
Laurie Prange (Prange-Martin)
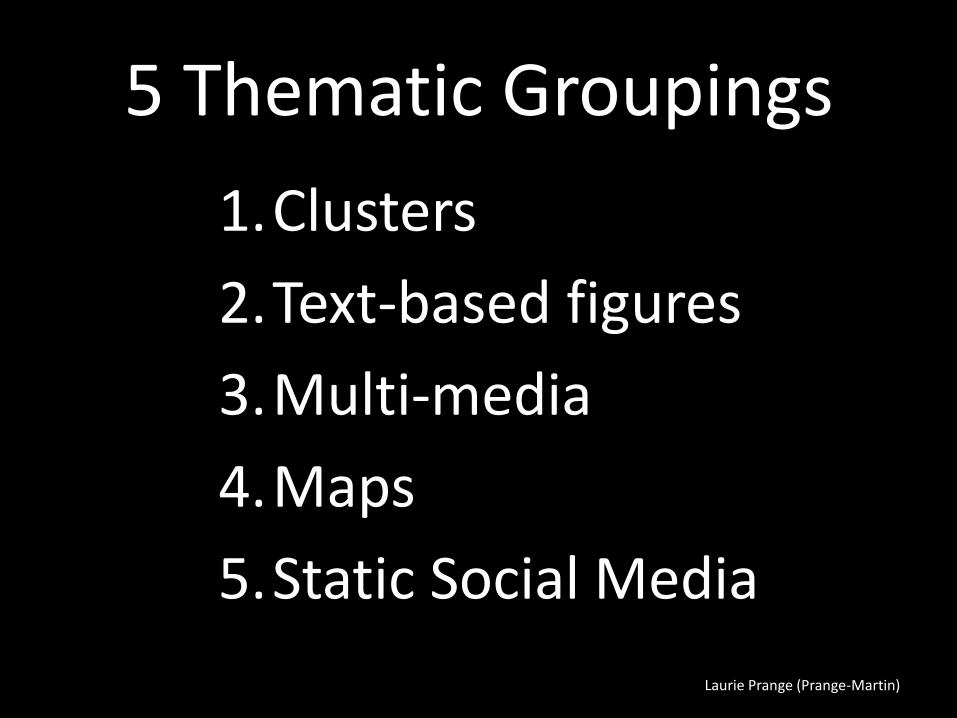
5 Thematic Groupings
1.Clusters
2.Text-based figures
3.Multi-media
4.Maps
5.Static Social Media
Laurie Prange (Prange-Martin)
Cluster
A visual diagram to express the ideas, relationships, and thinking of the author.
Note: “Mind map” is a registered
trademark term to Tony Buzan and the Buzan Organization.
http://www.buzan.com.au
Laurie Prange (Prange-Martin)
1. Clusters
• Mindmap (single)
• Mindmap (grouping concepts, not always inter-related)
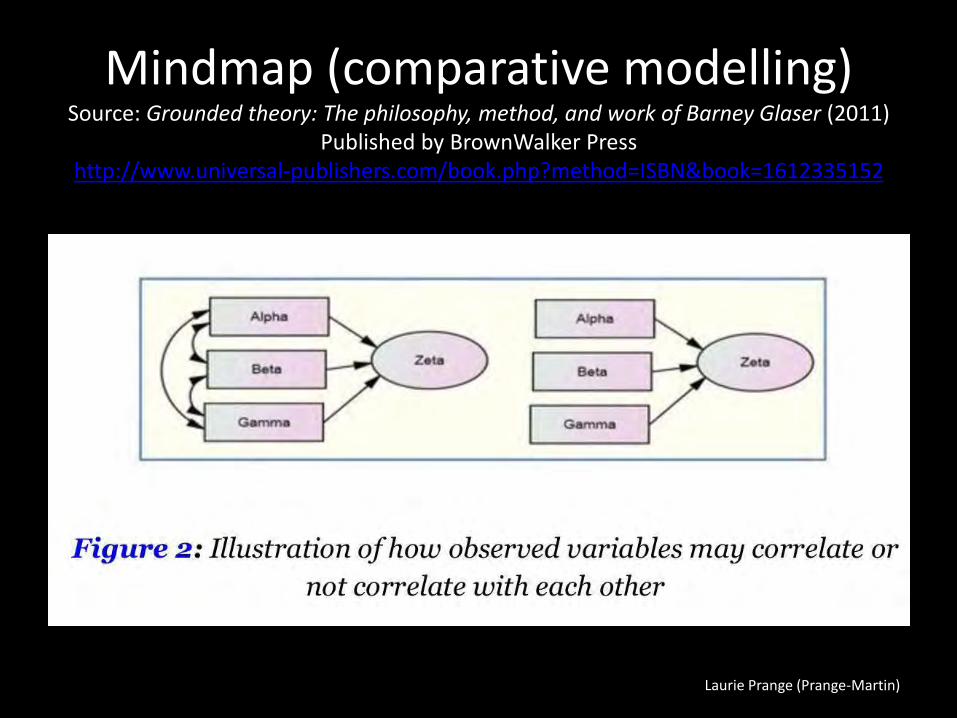
• Mindmap (comparative modelling)
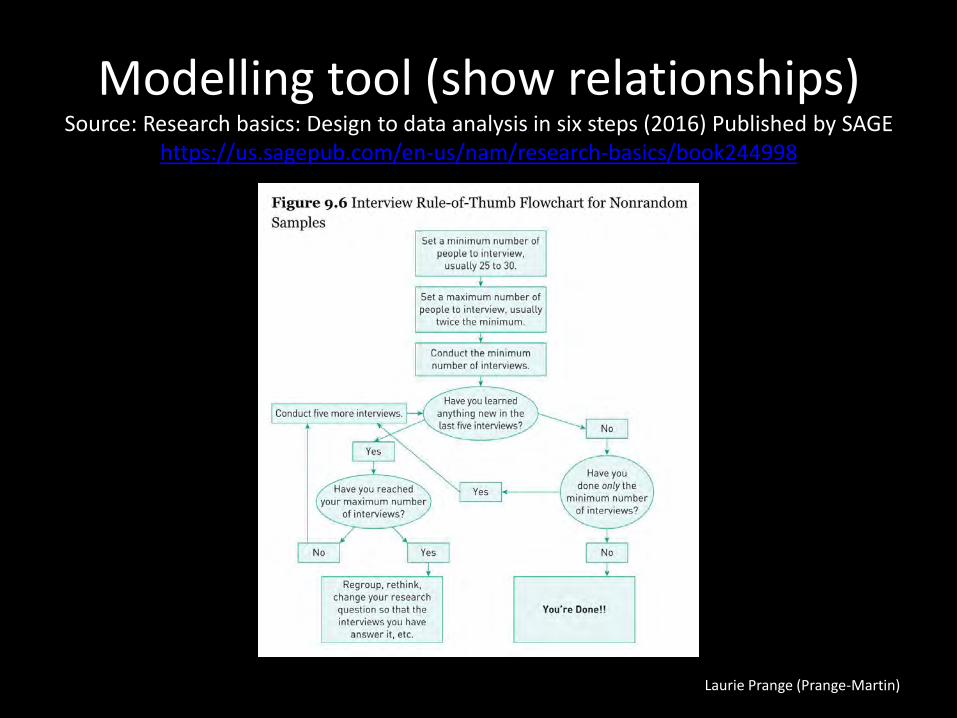
• Modelling tool (show relationships)
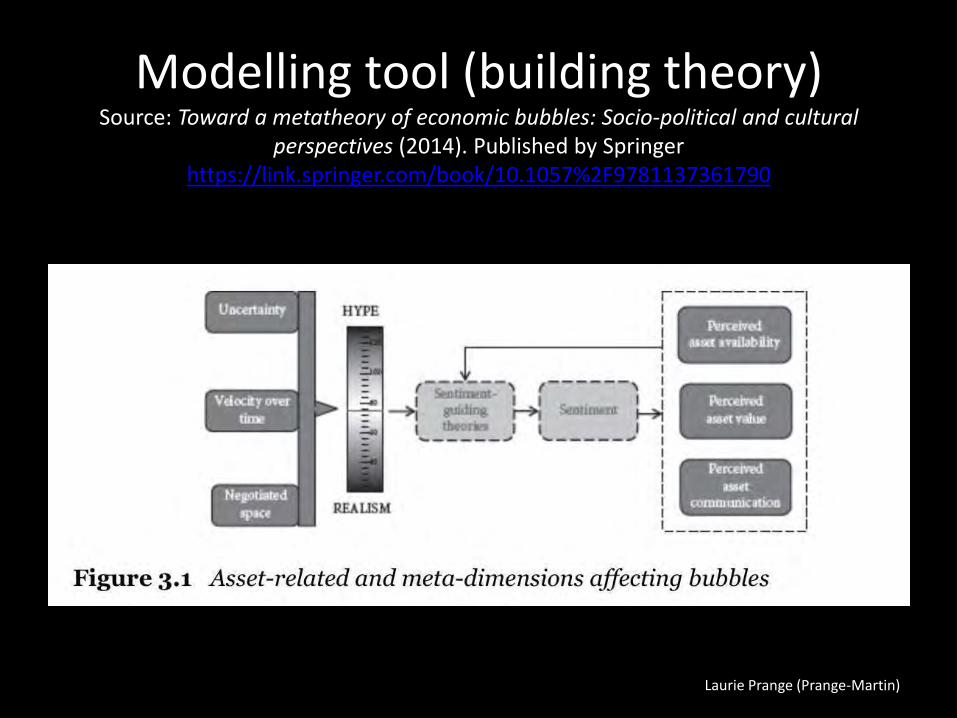
• Modelling tool (building theory)
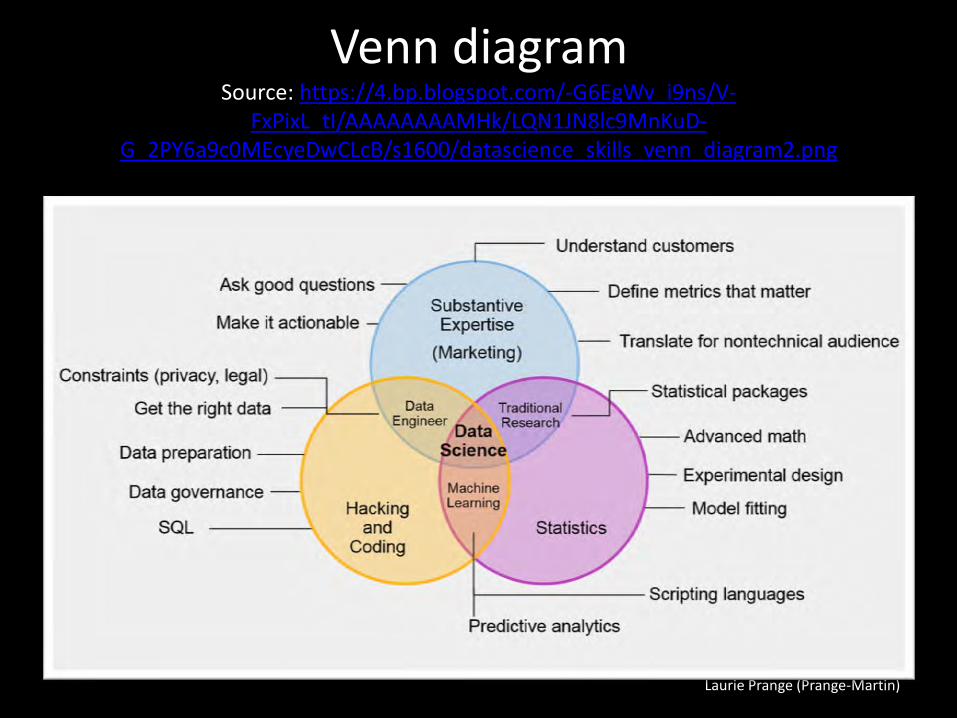
• Venn diagram
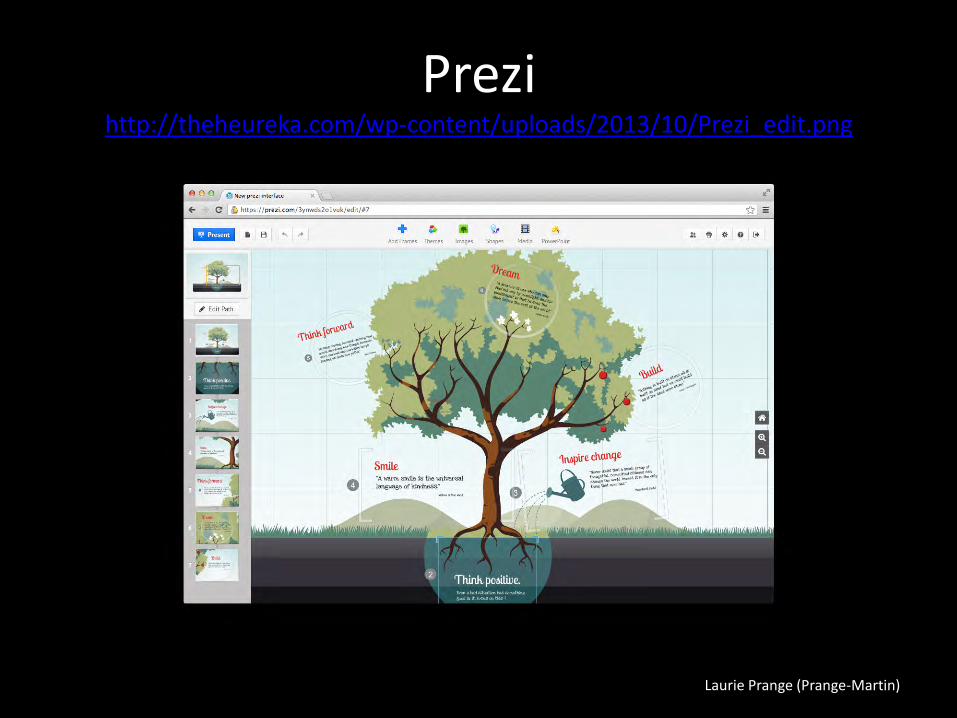
• Prezi
Laurie Prange (Prange-Martin)
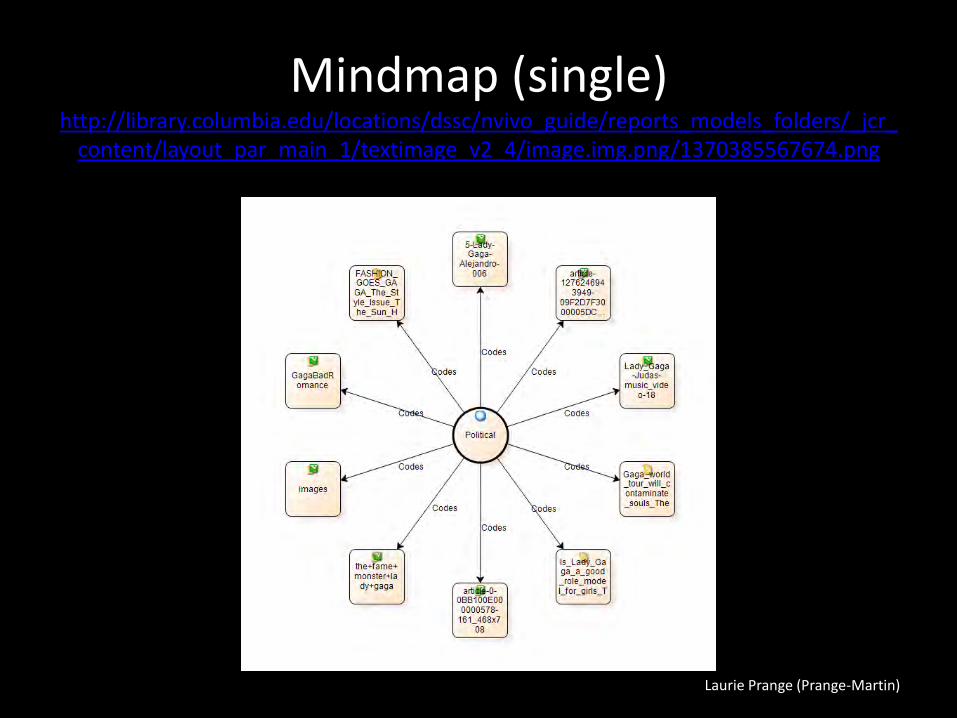
Mindmap (single) http://library.columbia.edu/locations/dssc/nvivo_guide/reports_models_folders/_jcr_
content/layout_par_main_1/textimage_v2_4/image.img.png/1370385567674.png
Laurie Prange (Prange-Martin)
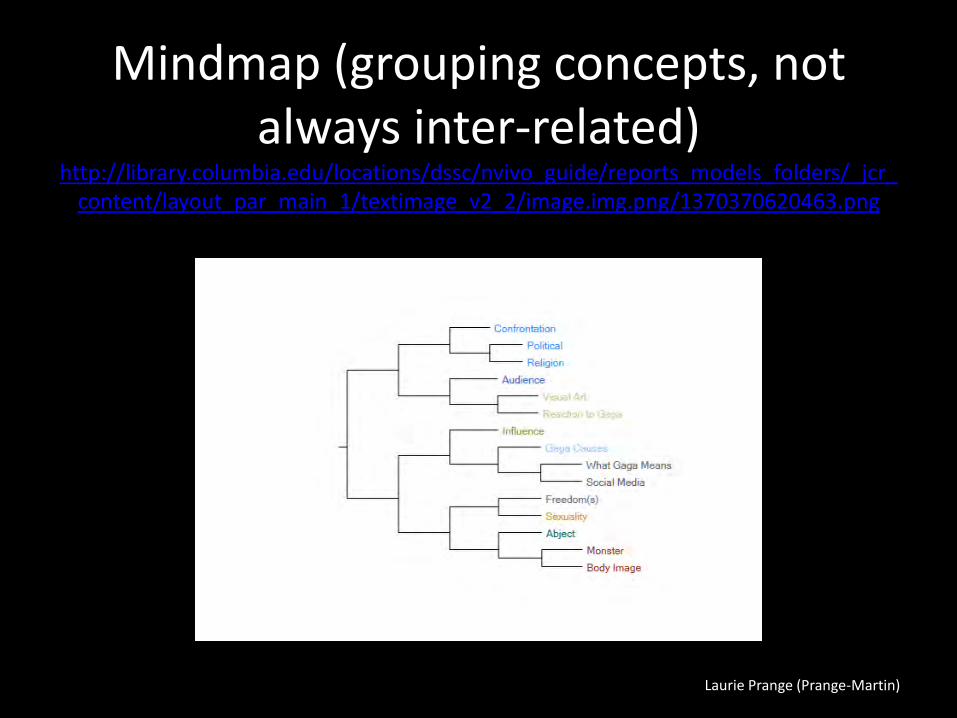
Mindmap (grouping concepts, not always inter-related)
http://library.columbia.edu/locations/dssc/nvivo_guide/reports_models_folders/_jcr_content/layout_par_main_1/textimage_v2_2/image.img.png/1370370620463.png
Laurie Prange (Prange-Martin)
Mindmap (comparative modelling) Source: Grounded theory: The philosophy, method, and work of Barney Glaser (2011)
Published by BrownWalker Press http://www.universal-publishers.com/book.php?method=ISBN&book=1612335152
Laurie Prange (Prange-Martin)
Modelling tool (show relationships) Source: Research basics: Design to data analysis in six steps (2016) Published by SAGE
https://us.sagepub.com/en-us/nam/research-basics/book244998
Laurie Prange (Prange-Martin)
Modelling tool (building theory) Source: Toward a metatheory of economic bubbles: Socio-political and cultural
perspectives (2014). Published by Springer https://link.springer.com/book/10.1057%2F9781137361790
Laurie Prange (Prange-Martin)
Venn diagram Source: https://4.bp.blogspot.com/-G6EgWv_i9ns/V-
FxPixL_tI/AAAAAAAAMHk/LQN1JN8lc9MnKuD-G_2PY6a9c0MEcyeDwCLcB/s1600/datascience_skills_venn_diagram2.png
Laurie Prange (Prange-Martin)
Prezi http://theheureka.com/wp-content/uploads/2013/10/Prezi_edit.png
Laurie Prange (Prange-Martin)
Text-Based Figure
A diagram that incorporates text to express, represent, or
communicate information, ideas, or concepts.
Laurie Prange (Prange-Martin)
2. Text-Based Figures
• Word Cloud
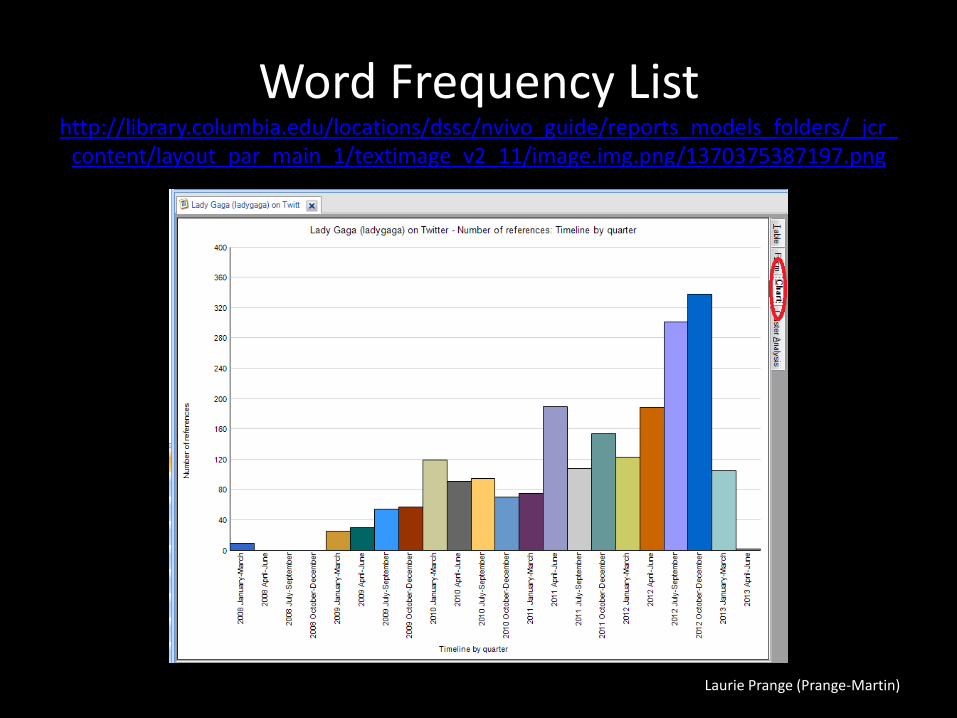
• Word Frequency List
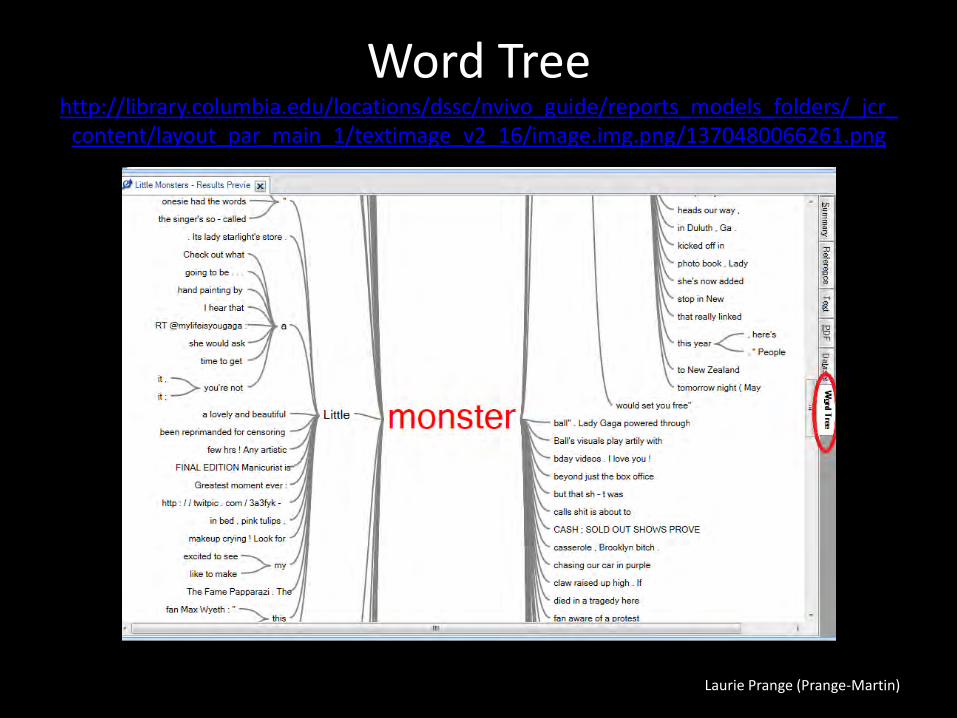
• Word Tree
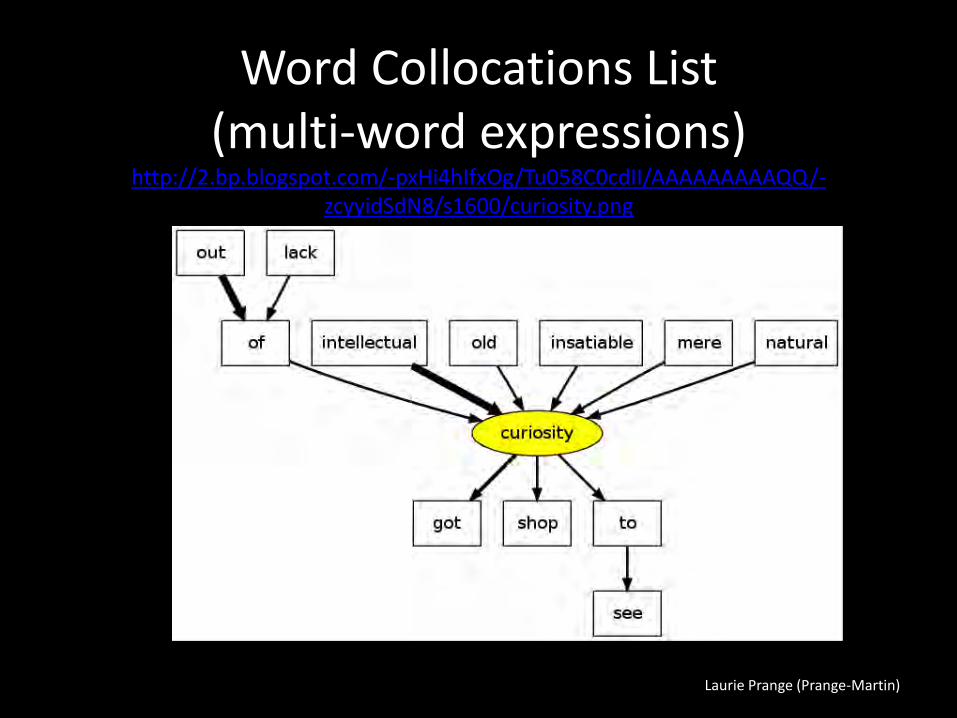
• Word Collocations List (multi-word expressions)
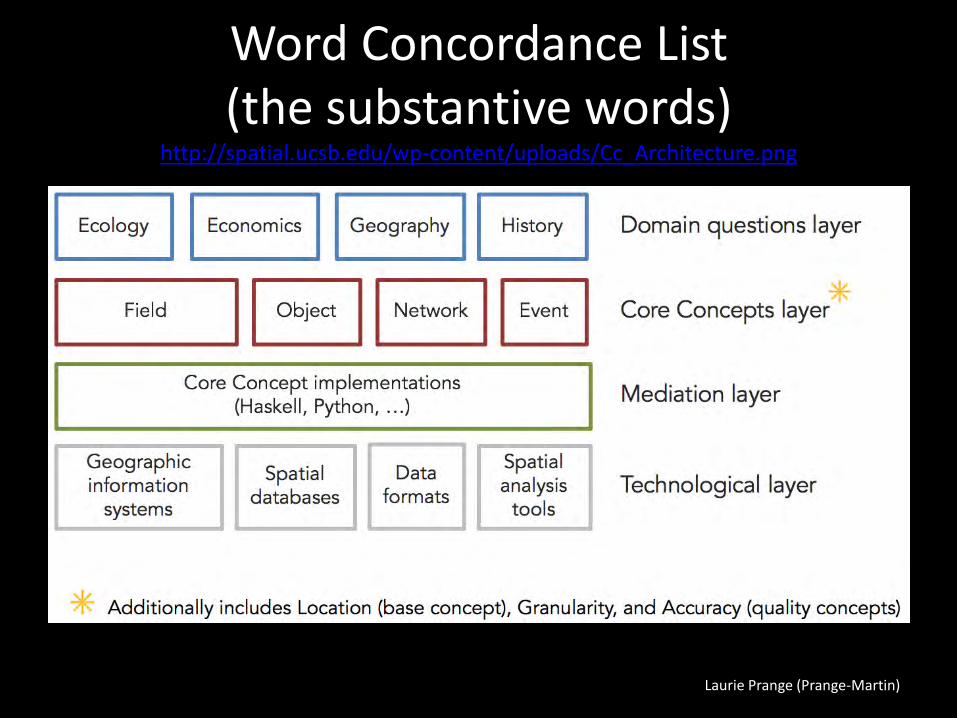
• Word Concordance List (the substantive words)
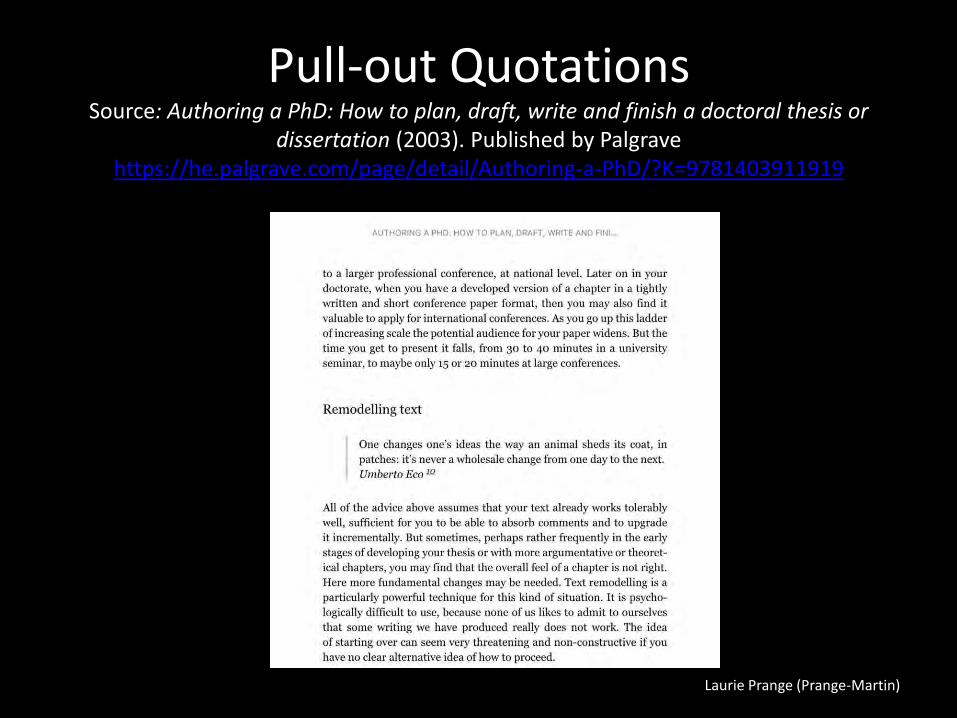
• Pull-out Quotations
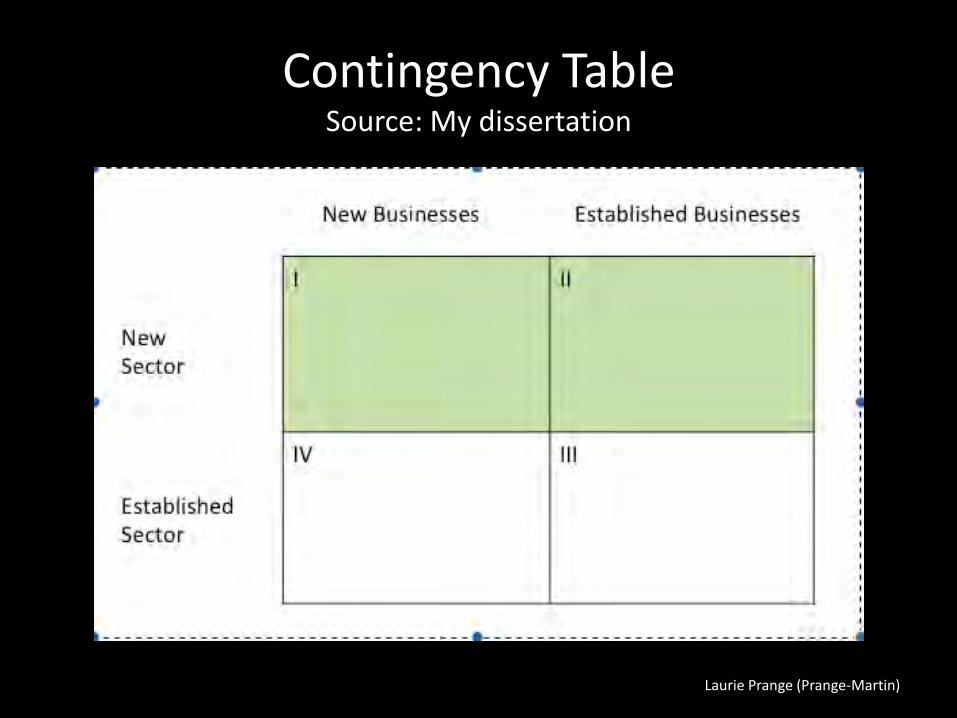
• Contingency Table
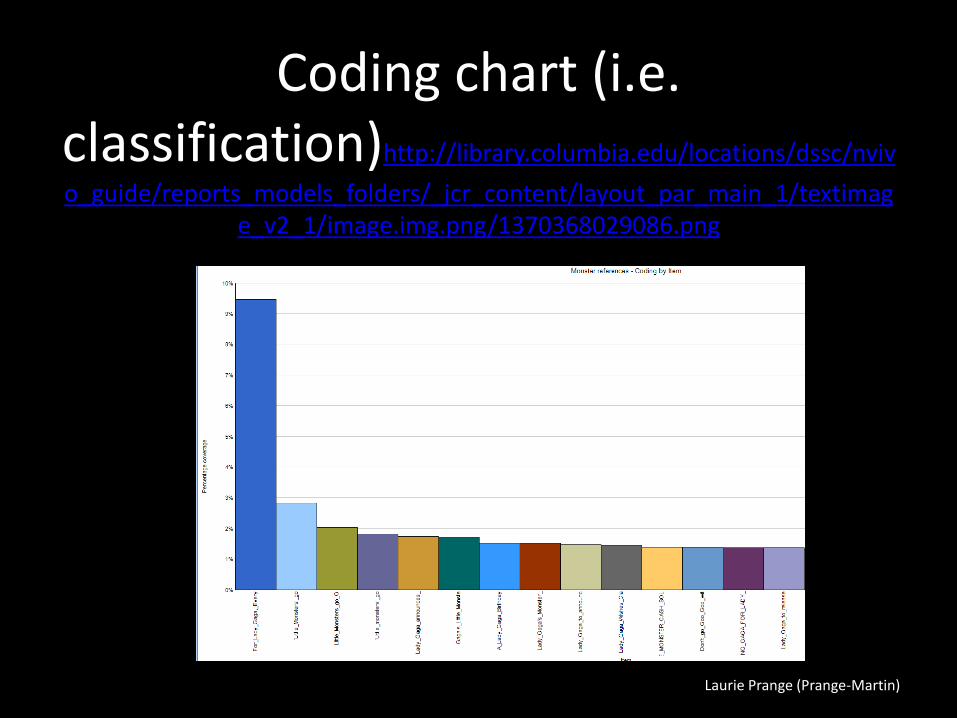
• Coding chart (i.e. classifications)
Laurie Prange (Prange-Martin)
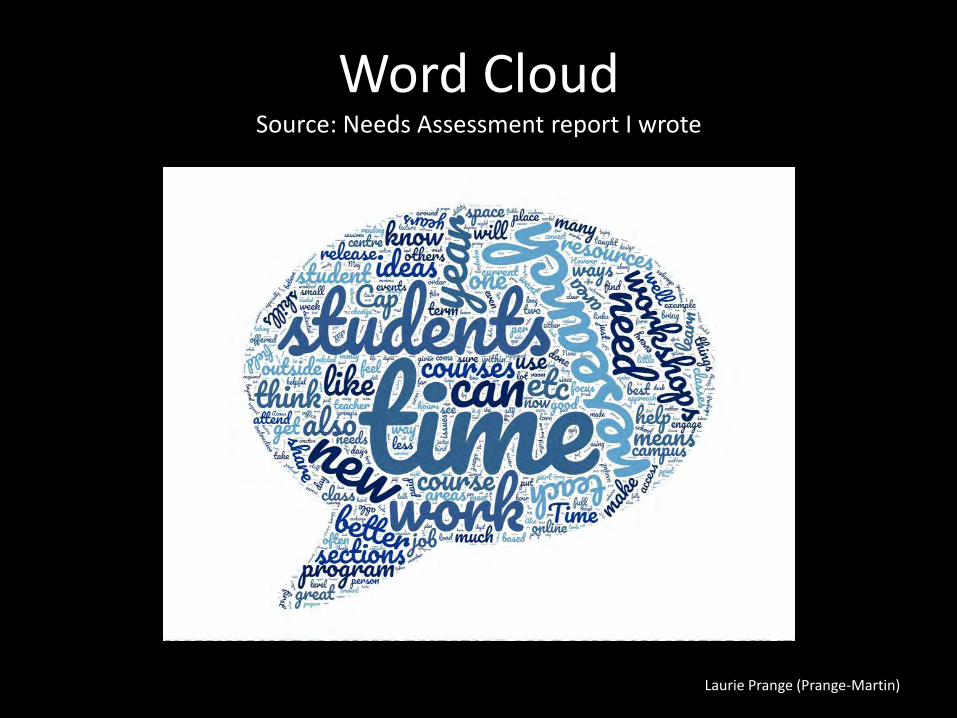
Word Cloud Source: Needs Assessment report I wrote
Laurie Prange (Prange-Martin)
Word Frequency List http://library.columbia.edu/locations/dssc/nvivo_guide/reports_models_folders/_jcr_
content/layout_par_main_1/textimage_v2_11/image.img.png/1370375387197.png
Laurie Prange (Prange-Martin)
Word Tree http://library.columbia.edu/locations/dssc/nvivo_guide/reports_models_folders/_jcr_
content/layout_par_main_1/textimage_v2_16/image.img.png/1370480066261.png
Laurie Prange (Prange-Martin)
Word Collocations List (multi-word expressions)
http://2.bp.blogspot.com/-pxHi4hIfxOg/Tu058C0cdII/AAAAAAAAAQQ/-zcyyidSdN8/s1600/curiosity.png
Laurie Prange (Prange-Martin)
Word Concordance List (the substantive words)
http://spatial.ucsb.edu/wp-content/uploads/Cc_Architecture.png
Laurie Prange (Prange-Martin)
Pull-out Quotations Source: Authoring a PhD: How to plan, draft, write and finish a doctoral thesis or
dissertation (2003). Published by Palgrave https://he.palgrave.com/page/detail/Authoring-a-PhD/?K=9781403911919
Laurie Prange (Prange-Martin)
Contingency Table Source: My dissertation
Laurie Prange (Prange-Martin)
Coding chart (i.e. classification)http://library.columbia.edu/locations/dssc/nviv
o_guide/reports_models_folders/_jcr_content/layout_par_main_1/textimage_v2_1/image.img.png/1370368029086.png
Laurie Prange (Prange-Martin)
Multi-Media
Alternatives to the text-only or traditional forms of expression to communicate ideas, concepts, or
information.
Laurie Prange (Prange-Martin)
3. Multi-Media
• Photographs (static)
• Photographs (change over time)
• Illustrations
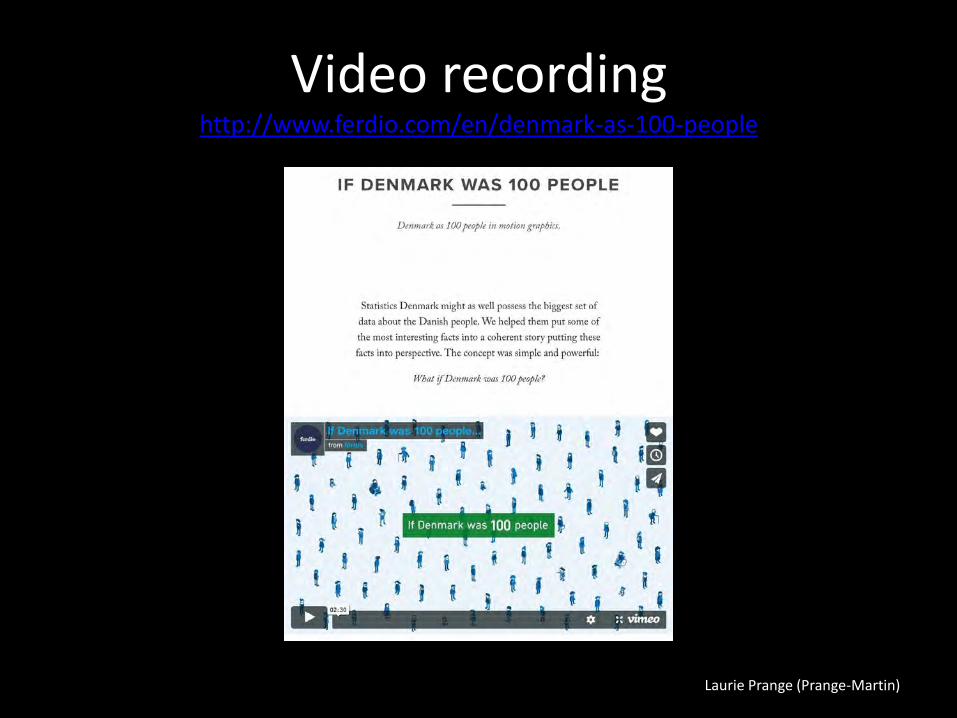
• Video recording
• Audio recording
• Live streaming (video or sound)
• Live performance (theatre, dance, music, etc.)
• Fine Arts expression (sculpture, textiles, etc.)
Laurie Prange (Prange-Martin)
Photographs (static)
Energy, Mines, and Resources Library SkyLine Air Photo Locator
• http://www.emr.gov.yk.ca/library/skyline.html
• Yukon aerial photographs
Laurie Prange (Prange-Martin)
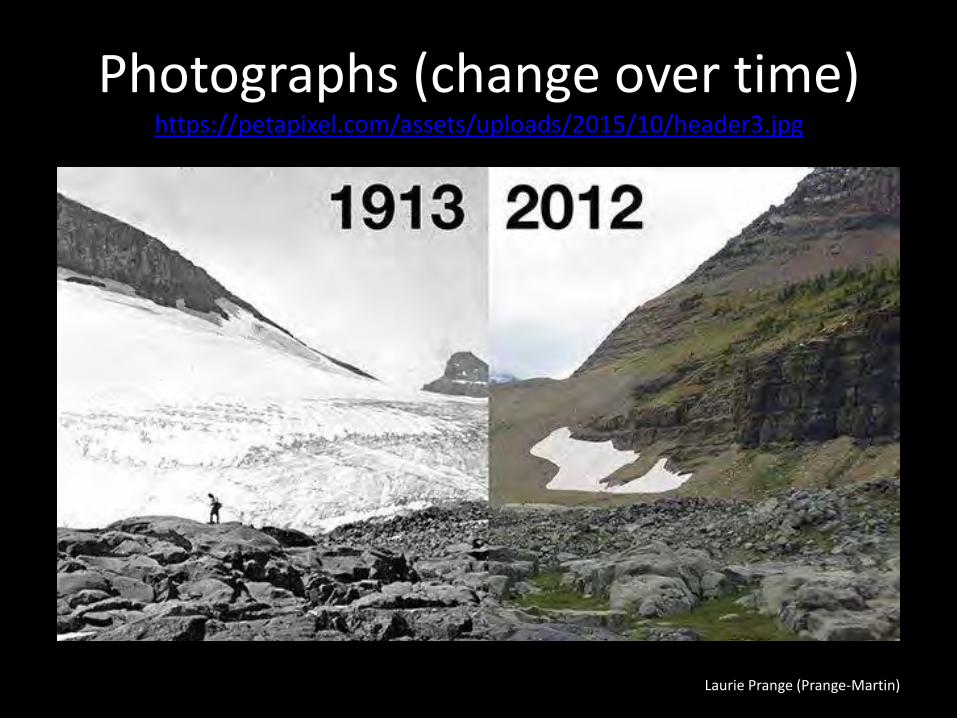
Photographs (change over time) https://petapixel.com/assets/uploads/2015/10/header3.jpg
Laurie Prange (Prange-Martin)
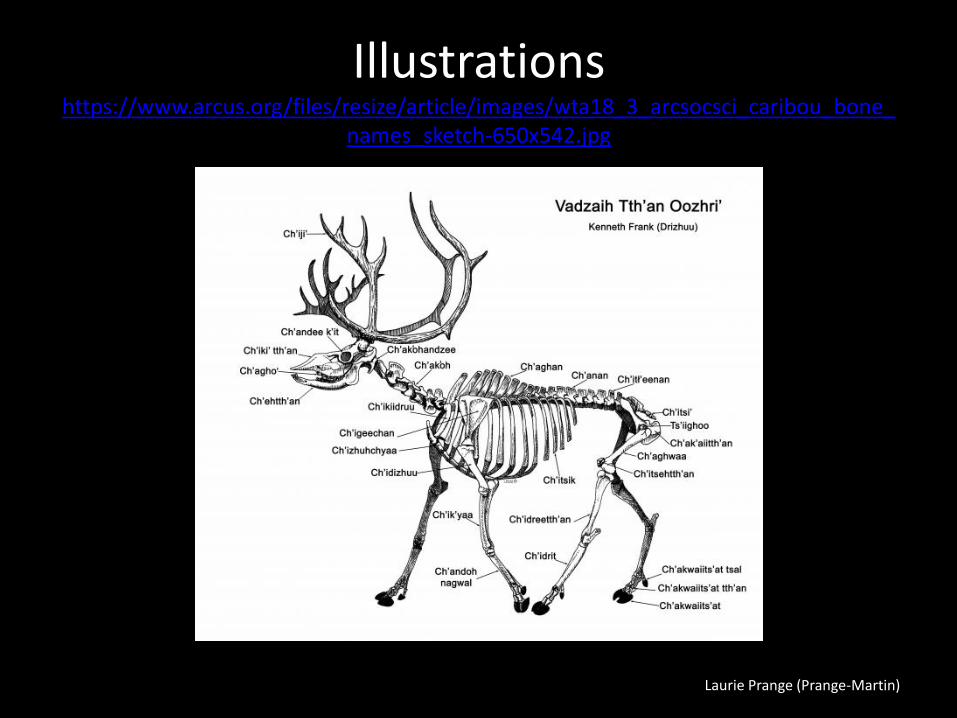
Illustrations https://www.arcus.org/files/resize/article/images/wta18_3_arcsocsci_caribou_bone_
names_sketch-650x542.jpg
Laurie Prange (Prange-Martin)
Video recording http://www.ferdio.com/en/denmark-as-100-people
Laurie Prange (Prange-Martin)
Audio recording
The Library of Congress has many collections of audio recordings. One example: Voices from the Days of Slavery
• https://memory.loc.gov/ammem/collections/voices/
• Recordings from 1932 to 1975 of 23 interviewees who were born into slavery
• Totalling nearly seven hours of recorded interviews
Laurie Prange (Prange-Martin)
Live streaming / Live performance
PhD in Performance Studies at University of Alberta • In addition to the written Dissertation, there is
the Performance Practice component. https://www.ualberta.ca/drama/graduate-programs/phd-in-performance-studies/performance-practice – 90 studio hours (2:1 preparation time) – Theatre project (as playwright, major acting role,
director, stage manager, designer, dramaturg, translator or equivalent)
– Or TWO more minor responsibilities (supporting role, assistant director, assistant dramaturg, assistant…)
Laurie Prange (Prange-Martin)
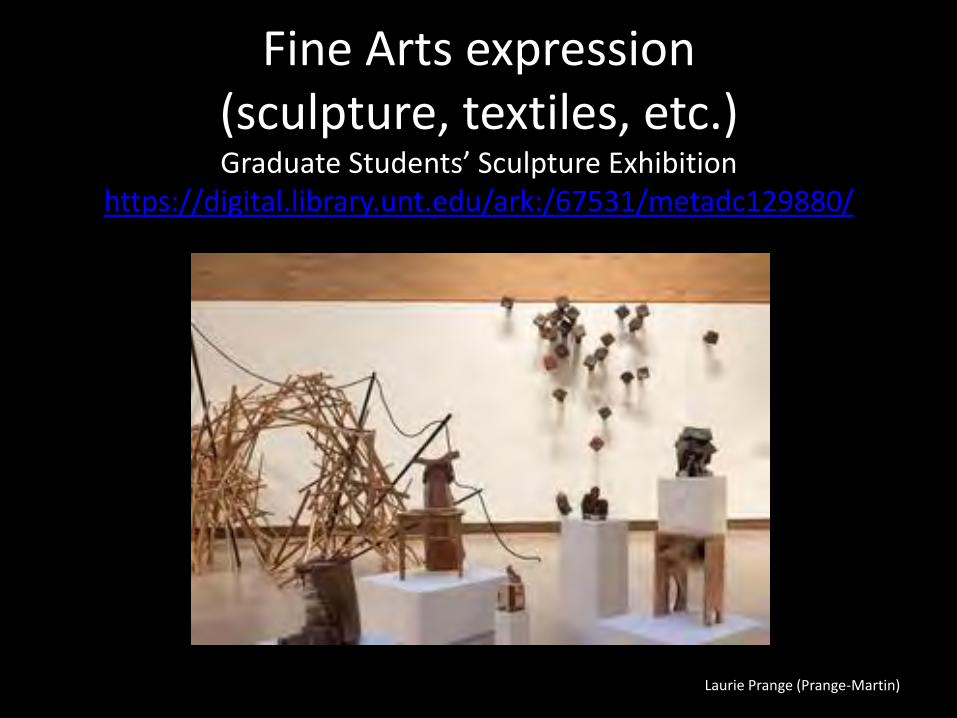
Fine Arts expression (sculpture, textiles, etc.) Graduate Students’ Sculpture Exhibition
https://digital.library.unt.edu/ark:/67531/metadc129880/
Laurie Prange (Prange-Martin)
Map
A diagram expressing the surveyed physical features of a geographical area or a figure
with sequenced points.
Laurie Prange (Prange-Martin)
4. Maps
• Heat map
• Raster map (zoom in and out)
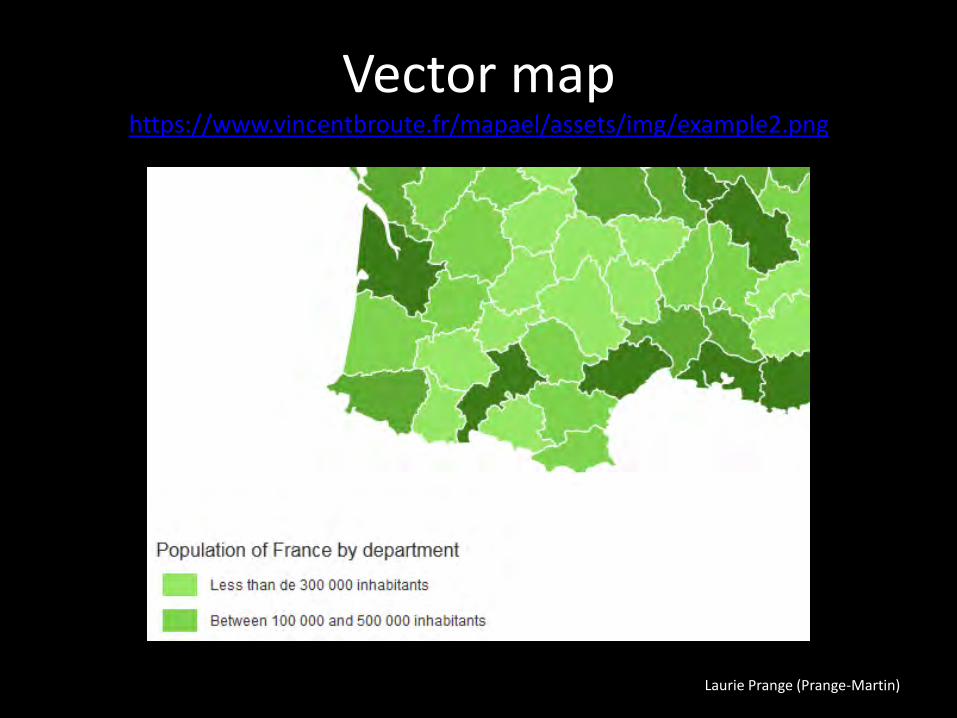
• Vector map (database of points that form the map)
Laurie Prange (Prange-Martin)
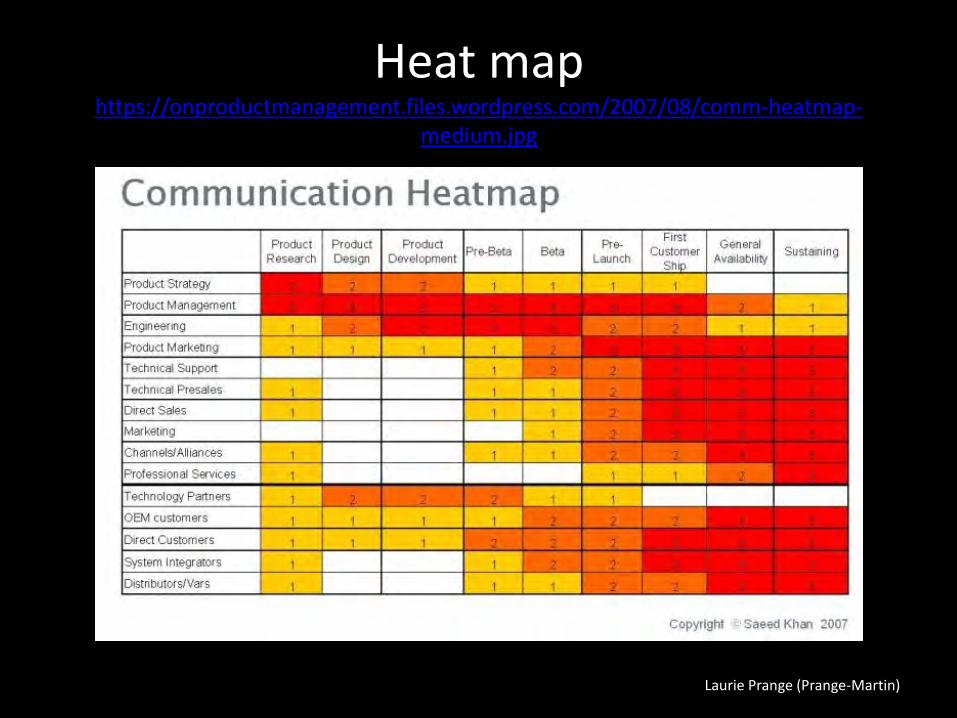
Heat map https://onproductmanagement.files.wordpress.com/2007/08/comm-heatmap-
medium.jpg
Laurie Prange (Prange-Martin)
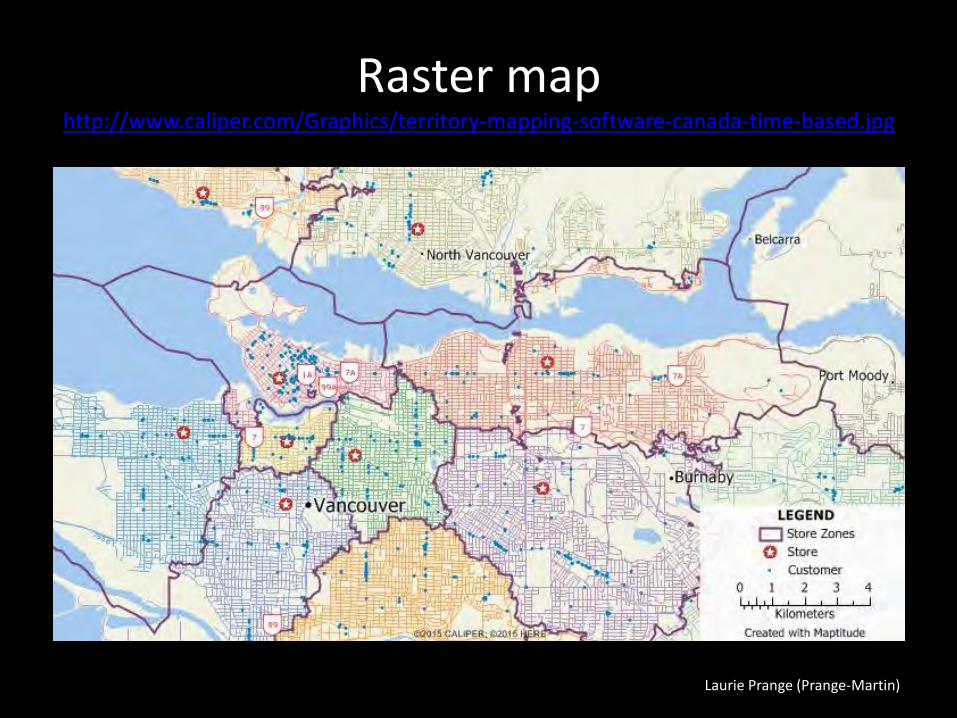
Raster map http://www.caliper.com/Graphics/territory-mapping-software-canada-time-based.jpg
Laurie Prange (Prange-Martin)
Vector map https://www.vincentbroute.fr/mapael/assets/img/example2.png
Laurie Prange (Prange-Martin)
Static Social Media
Shareable content for use in social media with no interactivity, which is usually originally from a more formal source.
Laurie Prange (Prange-Martin)
5. Static Social Media
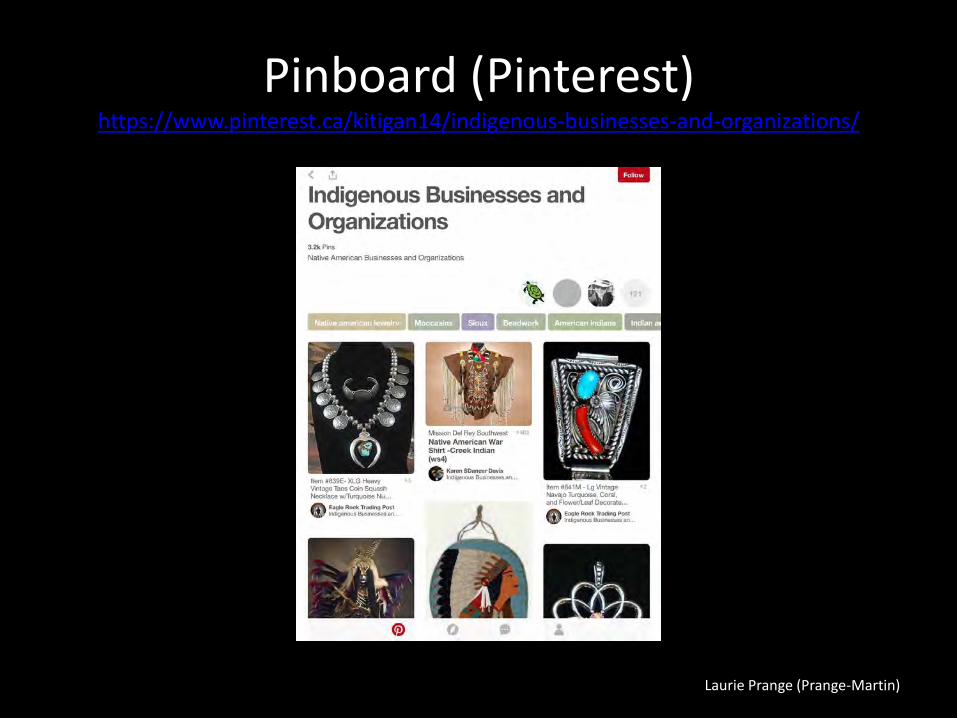
• Pinboard (Pinterest)
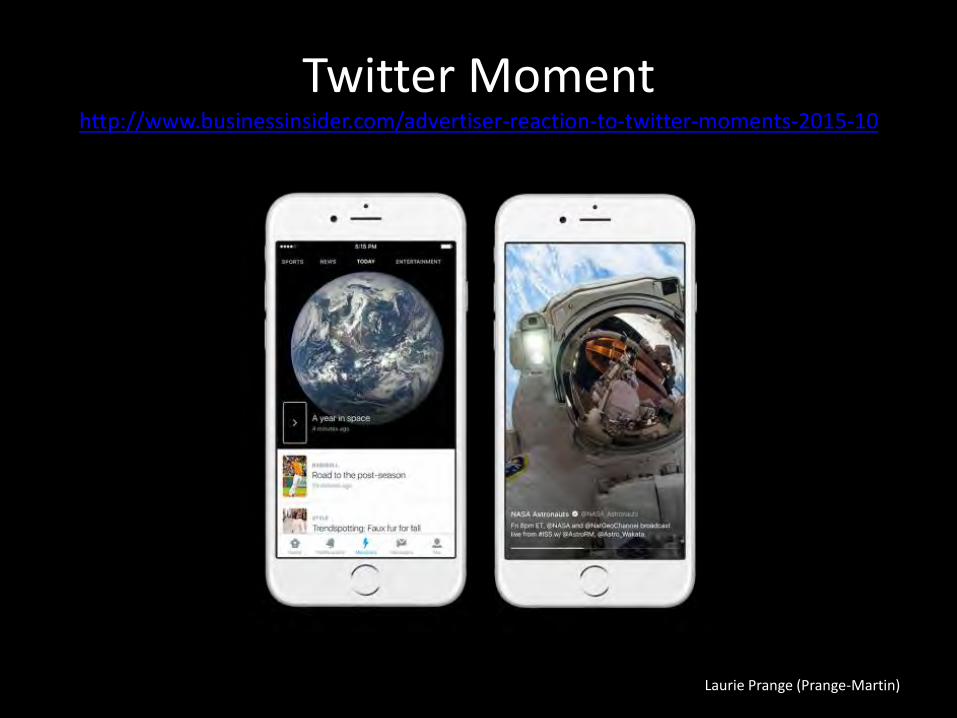
• Moment (Twitter)
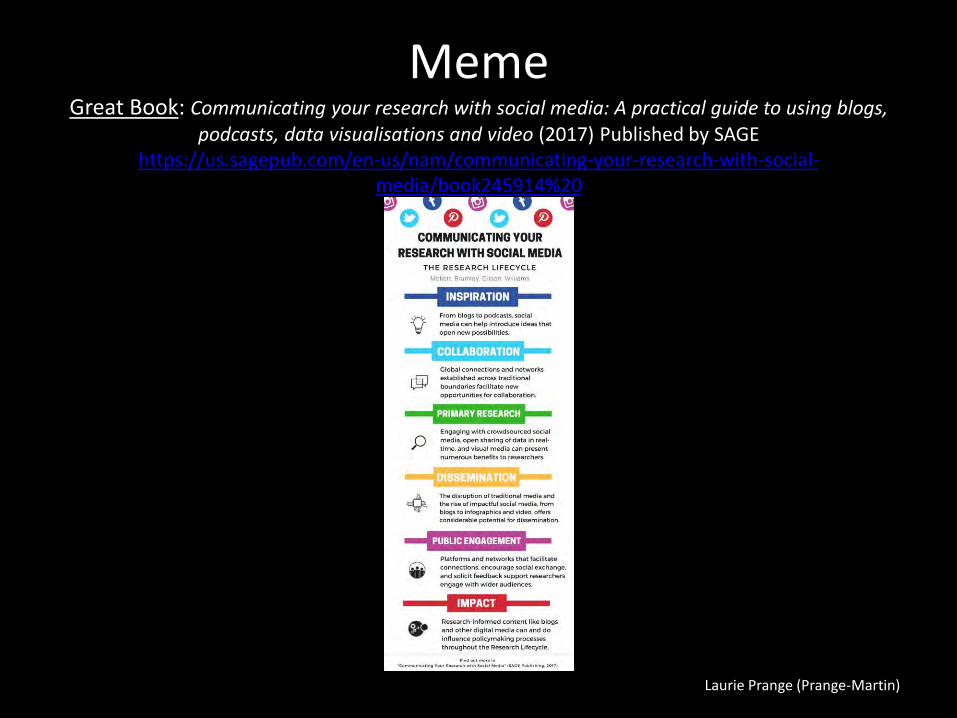
• Meme (Instagram, Facebook, Weibo, etc.)
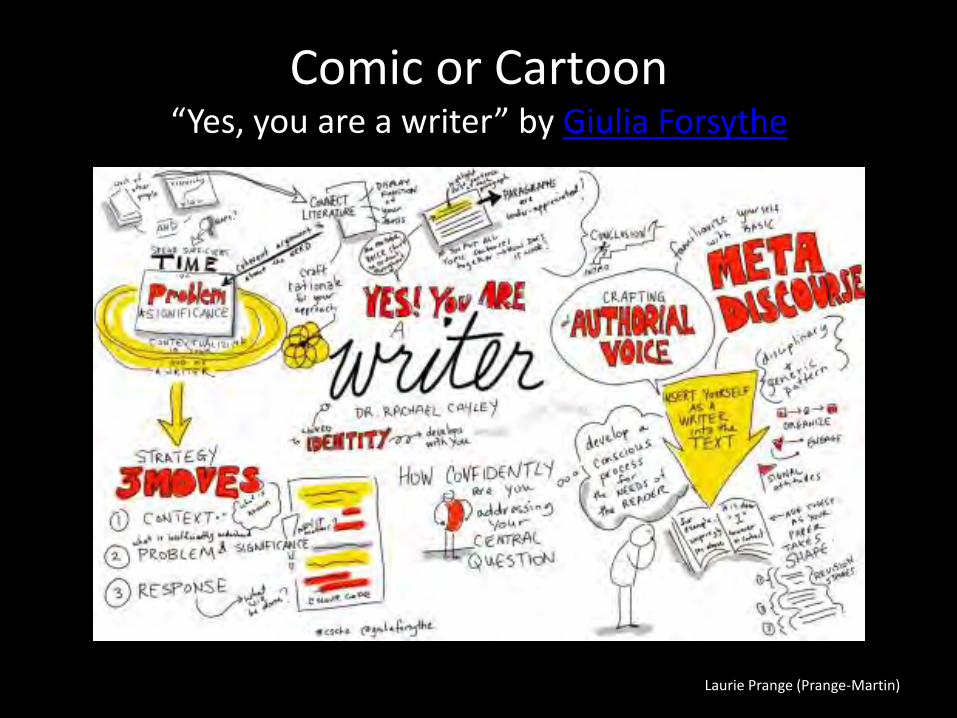
• Comic or Cartoon
Laurie Prange (Prange-Martin)
Pinboard (Pinterest) https://www.pinterest.ca/kitigan14/indigenous-businesses-and-organizations/
Laurie Prange (Prange-Martin)
Twitter Moment http://www.businessinsider.com/advertiser-reaction-to-twitter-moments-2015-10
Laurie Prange (Prange-Martin)
Meme Great Book: Communicating your research with social media: A practical guide to using blogs,
podcasts, data visualisations and video (2017) Published by SAGE https://us.sagepub.com/en-us/nam/communicating-your-research-with-social-
media/book245914%20
Laurie Prange (Prange-Martin)
Comic or Cartoon “Yes, you are a writer” by Giulia Forsythe
Laurie Prange (Prange-Martin)
According to formatting rules, how do we label these visualizations?
Laurie Prange (Prange-Martin)
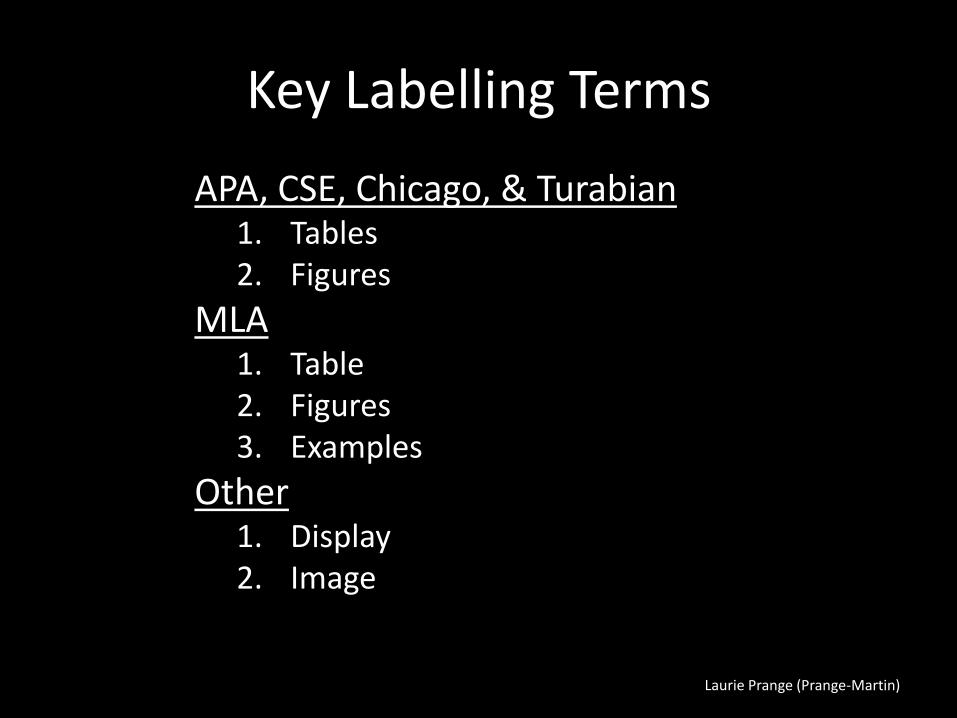
Key Labelling Terms
APA, CSE, Chicago, & Turabian 1. Tables 2. Figures
MLA 1. Table 2. Figures 3. Examples
Other 1. Display 2. Image
Laurie Prange (Prange-Martin)
5 Free Tools For qualitative data analysis
and visualization
Laurie Prange (Prange-Martin)
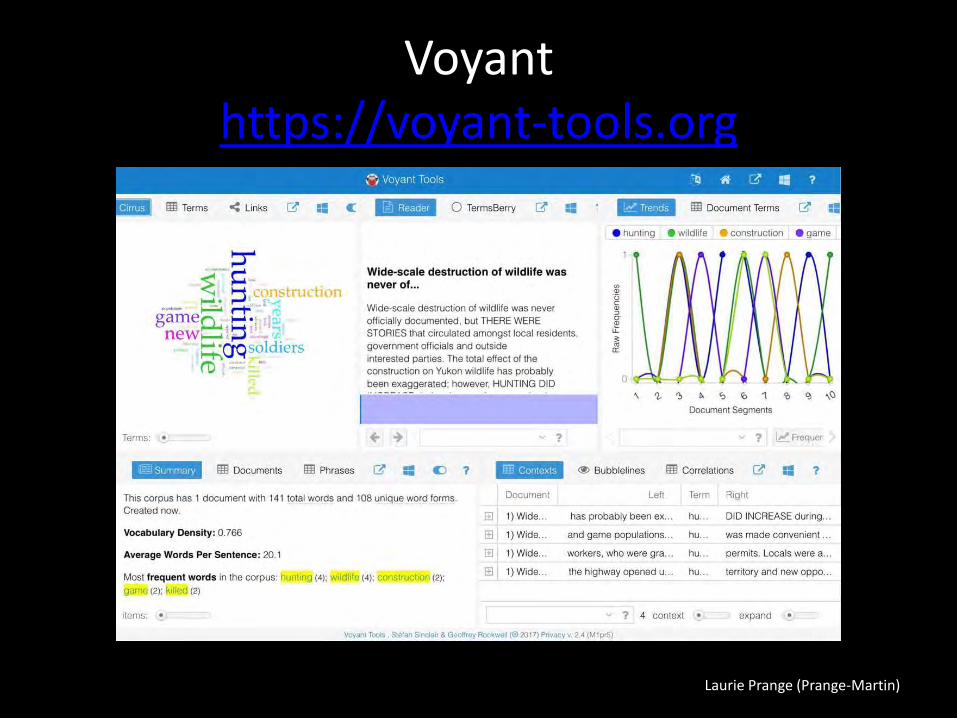
Voyant https://voyant-tools.org
Laurie Prange (Prange-Martin)
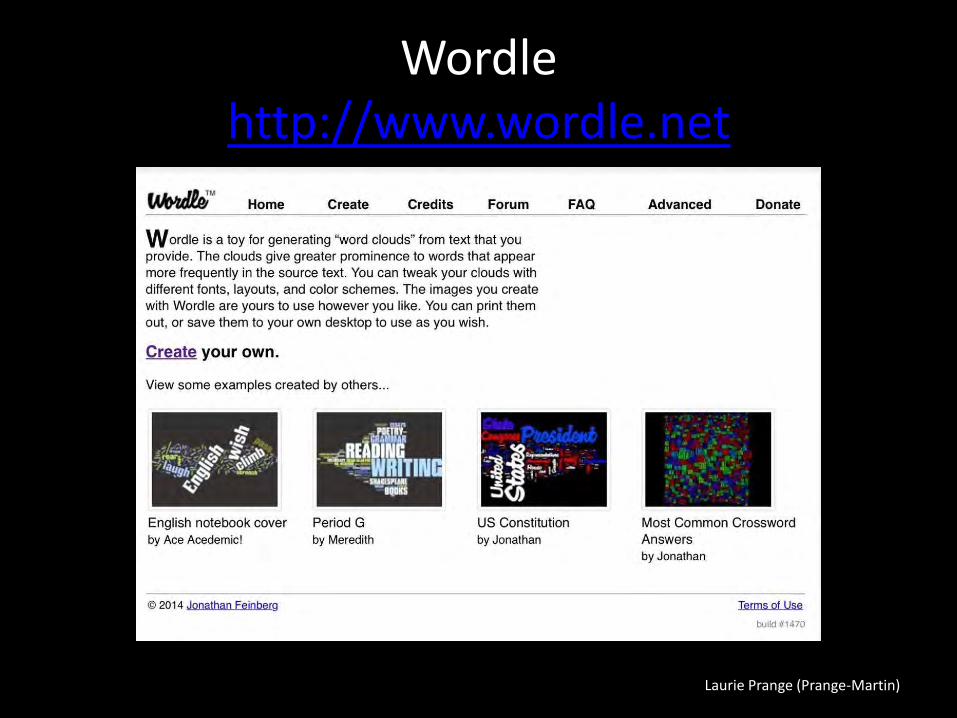
Wordle http://www.wordle.net
Laurie Prange (Prange-Martin)
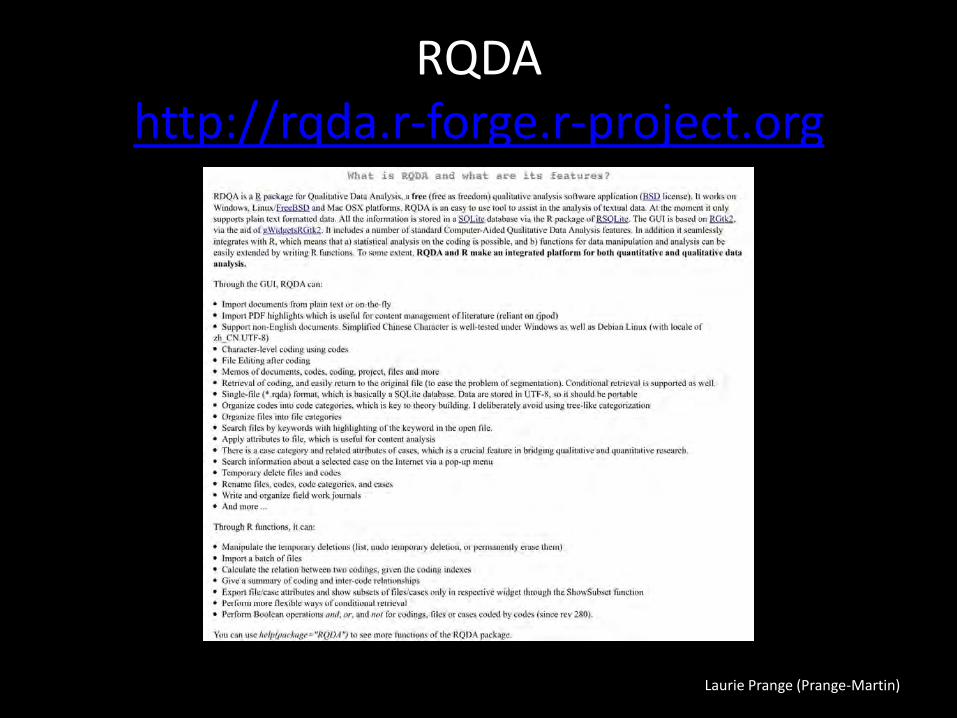
RQDA http://rqda.r-forge.r-project.org
Laurie Prange (Prange-Martin)
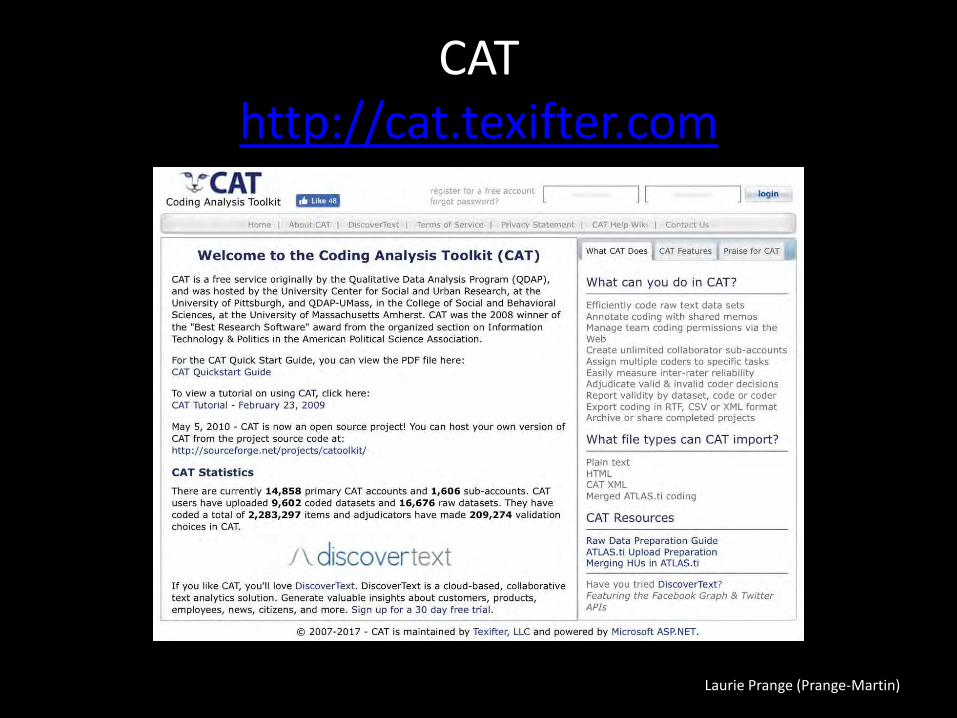
CAT http://cat.texifter.com
Laurie Prange (Prange-Martin)
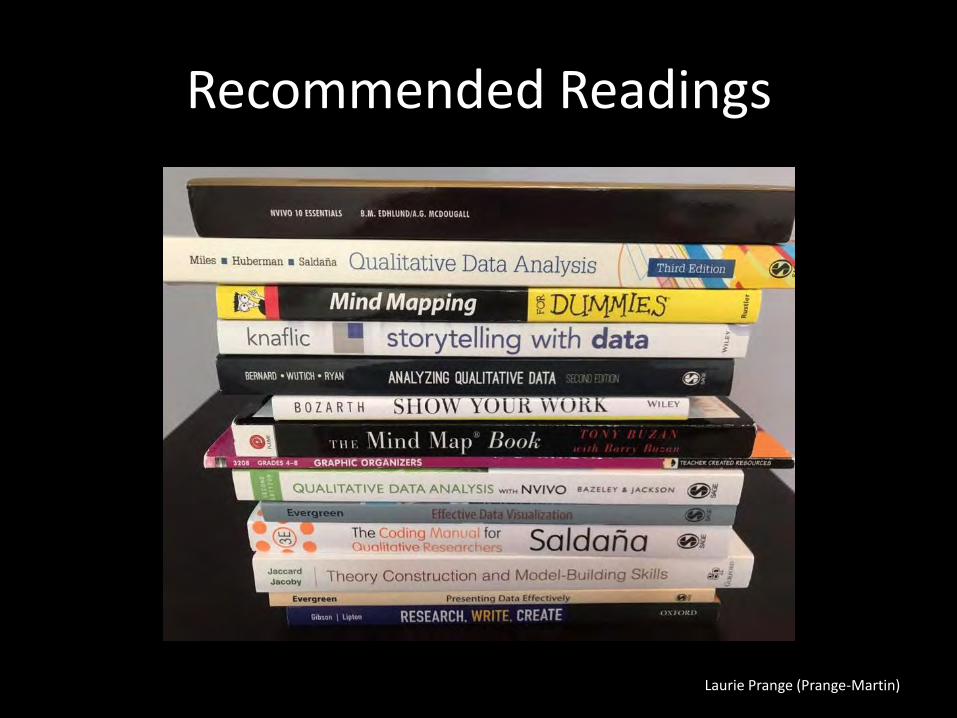
Recommended Readings
Laurie Prange (Prange-Martin)
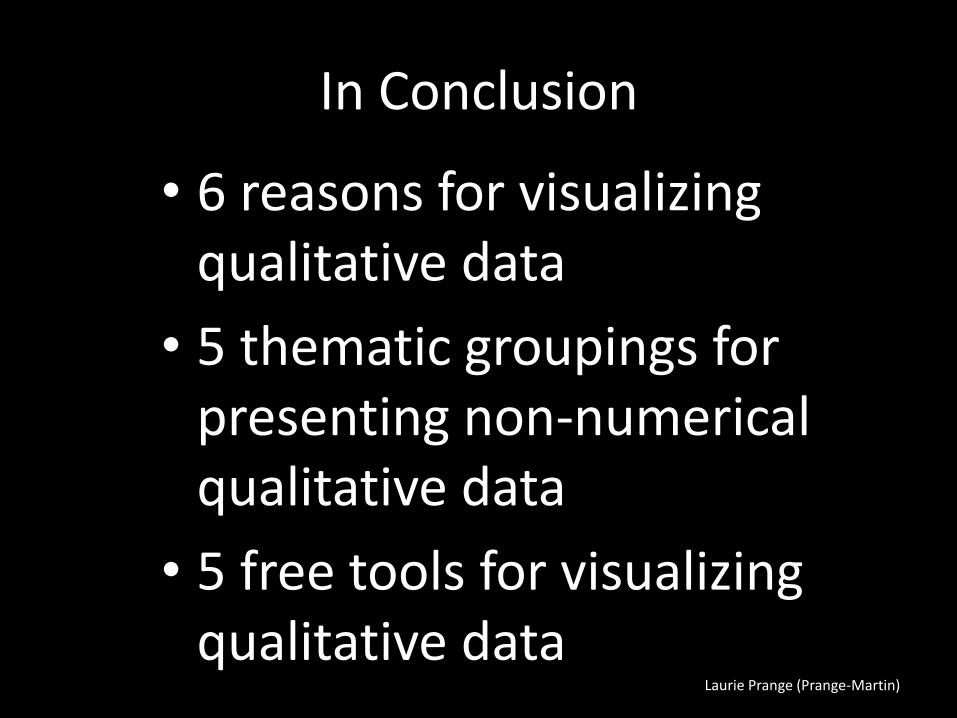
In Conclusion
• 6 reasons for visualizing qualitative data
• 5 thematic groupings for presenting non-numerical qualitative data
• 5 free tools for visualizing qualitative data
Laurie Prange (Prange-Martin)
The End
Laurie Prange (Prange-Martin)
https://www.linkedin.com/in/laurieprangemartin/