Embed Size (px)
Citation preview
Qualitative vs Quantitative research
&Multilevel methods
How to include context in your research
April 2005Marjolein Deunk
Content
• What is qualitative analysis and how does it differ from quantitative analysis?
• How to combine qualitative and quantitative research?
• Statistics: multilevel models
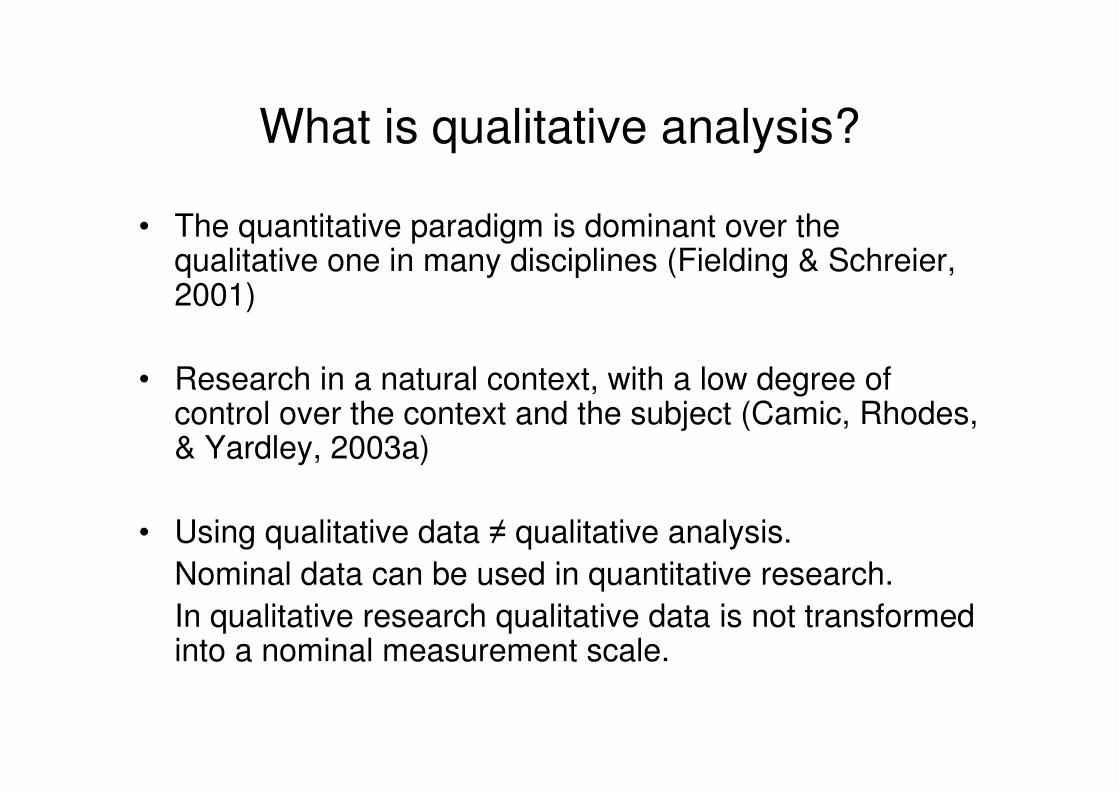
What is qualitative analysis?
• The quantitative paradigm is dominant over the qualitative one in many disciplines (Fielding & Schreier, 2001)
• Research in a natural context, with a low degree of control over the context and the subject (Camic, Rhodes, & Yardley, 2003a)
• Using qualitative data � qualitative analysis. Nominal data can be used in quantitative research. In qualitative research qualitative data is not transformed into a nominal measurement scale.
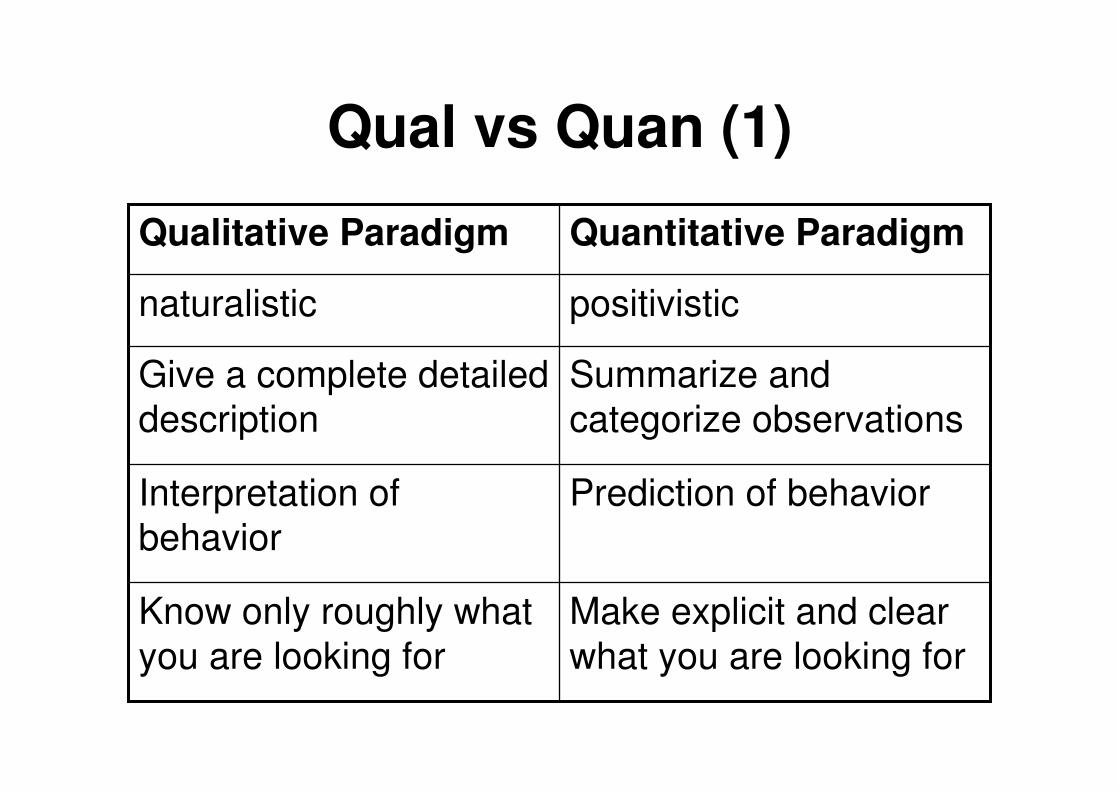
Qual vs Quan (1)
Prediction of behavior Interpretation of behavior
Make explicit and clear what you are looking for
Know only roughly what you are looking for
Summarize and categorize observations
Give a complete detailed description
positivisticnaturalistic
Quantitative ParadigmQualitative Paradigm
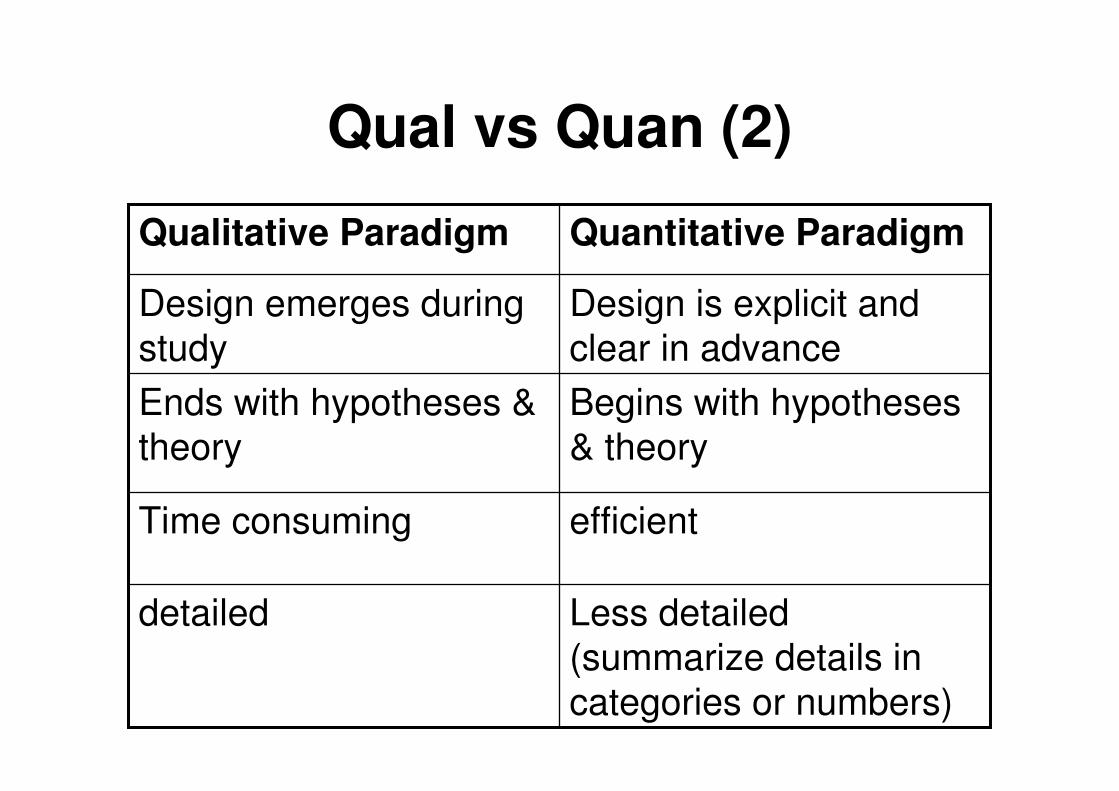
Qual vs Quan (2)
efficient Time consuming
Less detailed (summarize details in categories or numbers)
detailed
Begins with hypotheses & theory
Ends with hypotheses & theory
Design is explicit and clear in advance
Design emerges during study
Quantitative ParadigmQualitative Paradigm
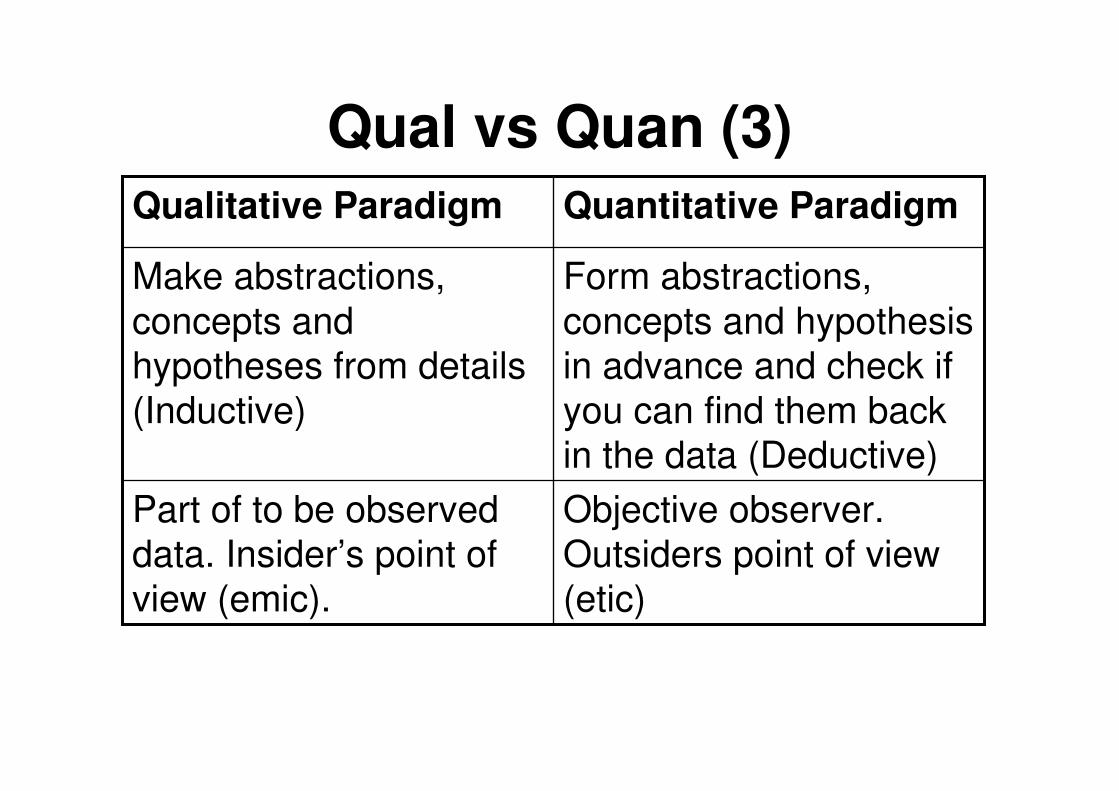
Qual vs Quan (3)
Objective observer. Outsiders point of view (etic)
Part of to be observed data. Insider’s point of view (emic).
Form abstractions, concepts and hypothesis in advance and check if you can find them back in the data (Deductive)
Make abstractions, concepts and hypotheses from details (Inductive)
Quantitative ParadigmQualitative Paradigm
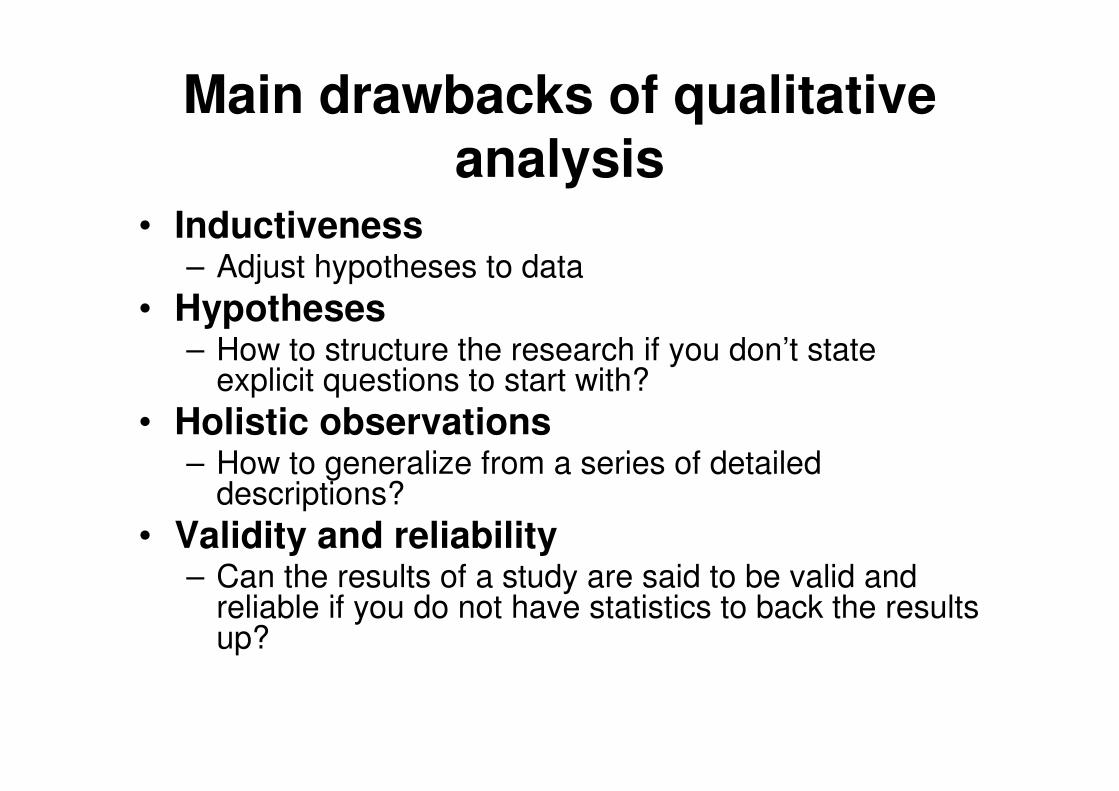
Main drawbacks of qualitative analysis
• Inductiveness– Adjust hypotheses to data
• Hypotheses– How to structure the research if you don’t state
explicit questions to start with?• Holistic observations
– How to generalize from a series of detaileddescriptions?
• Validity and reliability– Can the results of a study are said to be valid and
reliable if you do not have statistics to back the results up?
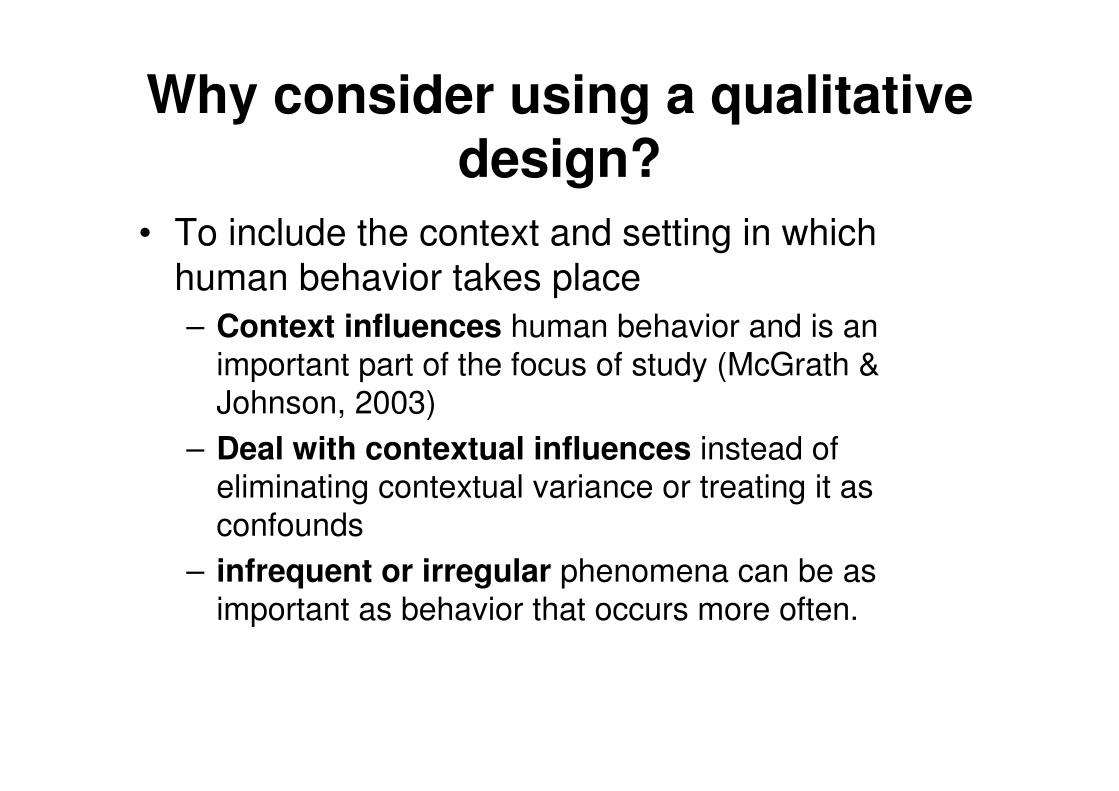
Why consider using a qualitative design?
• To include the context and setting in which human behavior takes place – Context influences human behavior and is an
important part of the focus of study (McGrath & Johnson, 2003)
– Deal with contextual influences instead of eliminating contextual variance or treating it as confounds
– infrequent or irregular phenomena can be as important as behavior that occurs more often.
What kind of data do you get with qualitative analysis?
• Descriptive • Patterns/categories are described based
on the descriptive data • Data is not transformed to numerical data
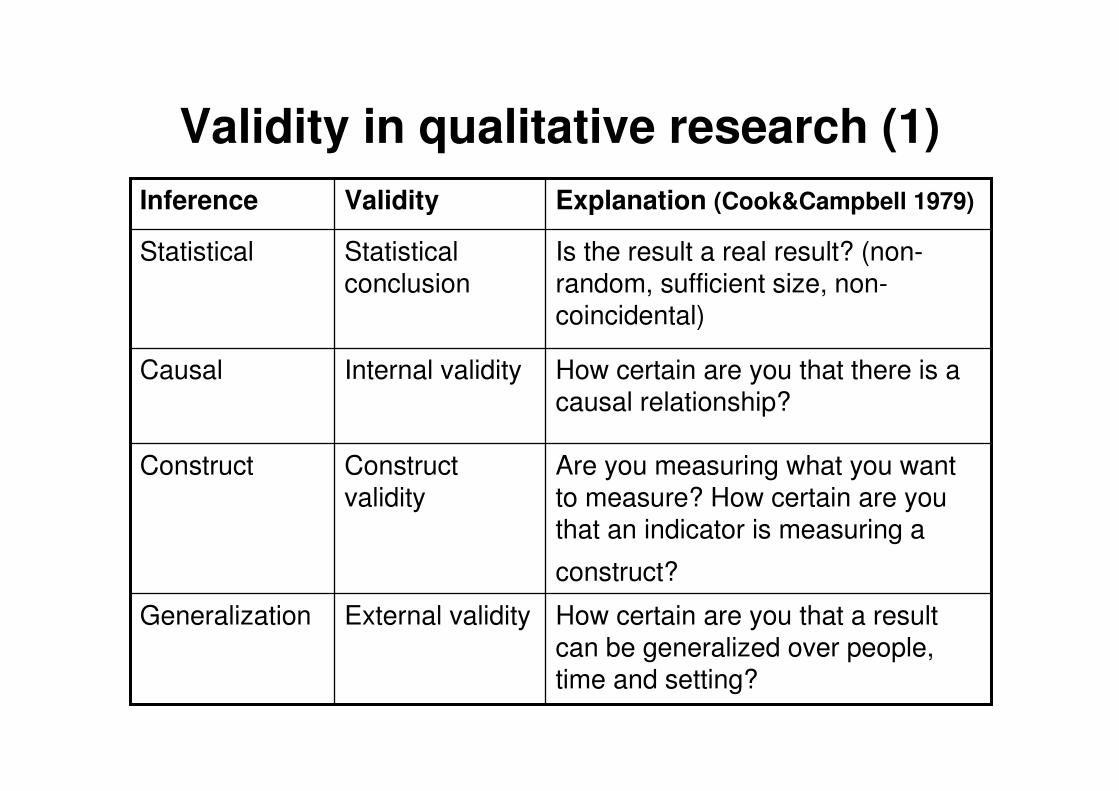
Validity in qualitative research (1)
Are you measuring what you want to measure? How certain are you that an indicator is measuring a
construct?
Construct validity
Construct
How certain are you that a result can be generalized over people, time and setting?
External validityGeneralization
How certain are you that there is a causal relationship?
Internal validityCausal
Is the result a real result? (non-random, sufficient size, non-coincidental)
Statisticalconclusion
Statistical
Explanation (Cook&Campbell 1979)ValidityInference
Validity in qualitative research (2)
• Since qualitative research is descriptive and patterns are not recoded into numerical variables, statistical inferences can not be made.
• Internal, external and construct validity can be determined (Lund, 2005).
Q: What if you want statistical validity?
A: Combine qual with quan methods.
– multi-method approach (triangulation) – One way to do this:
1. qualitative research: observe, describe, find patterns and categories
2. quantitative research: label categories with numbers, use statistics
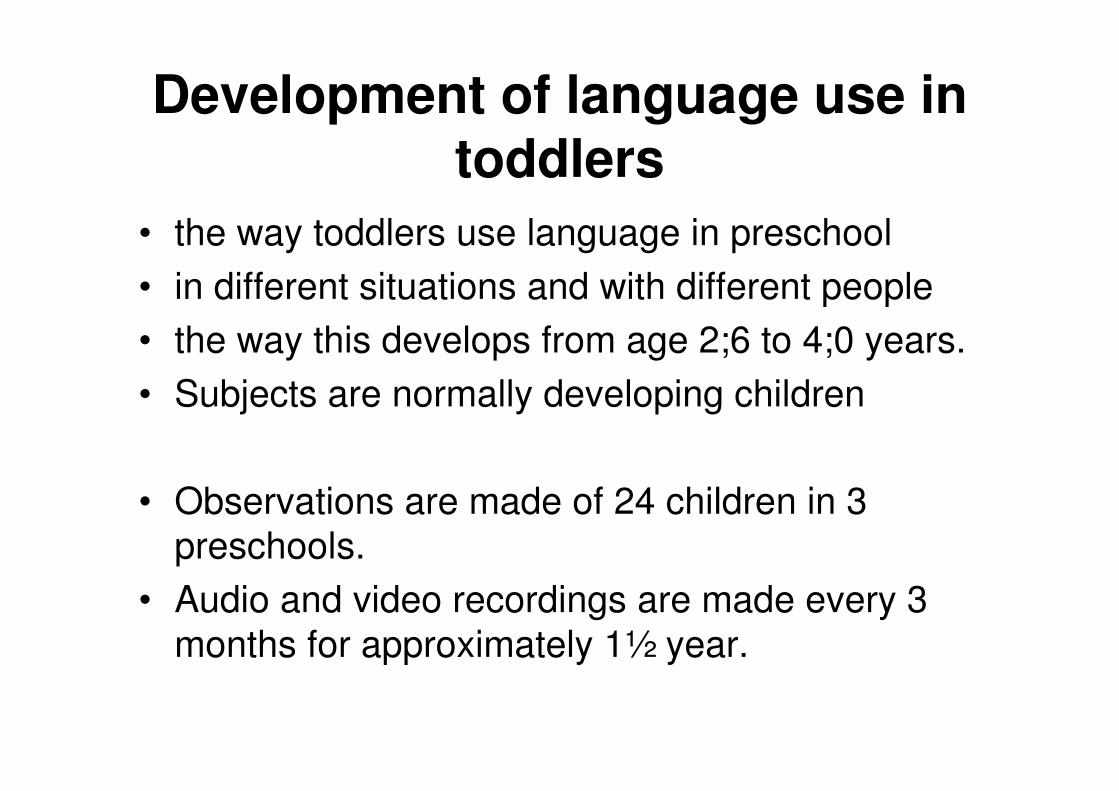
Development of language use in toddlers
• the way toddlers use language in preschool• in different situations and with different people • the way this develops from age 2;6 to 4;0 years. • Subjects are normally developing children
• Observations are made of 24 children in 3 preschools.
• Audio and video recordings are made every 3 months for approximately 1½ year.
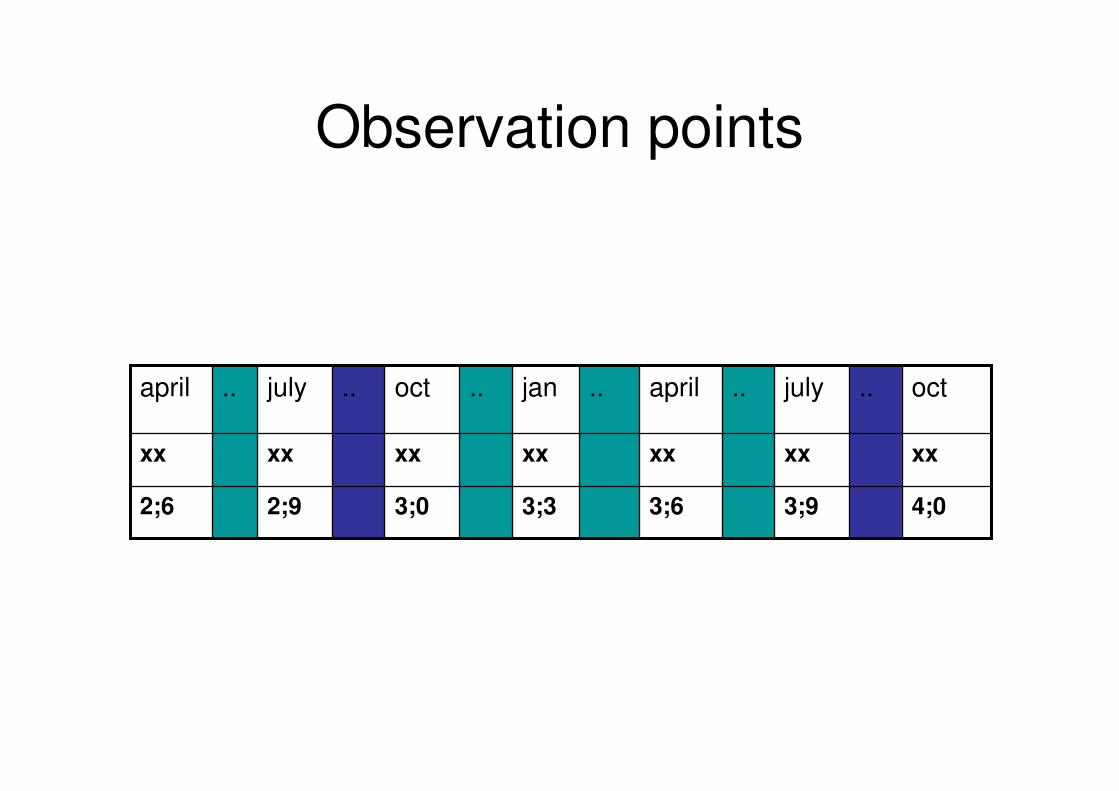
Observation points
xxxxxxxxxxxxxx
4;03;93;63;33;02;92;6
oct..july..april..jan..oct..july..april
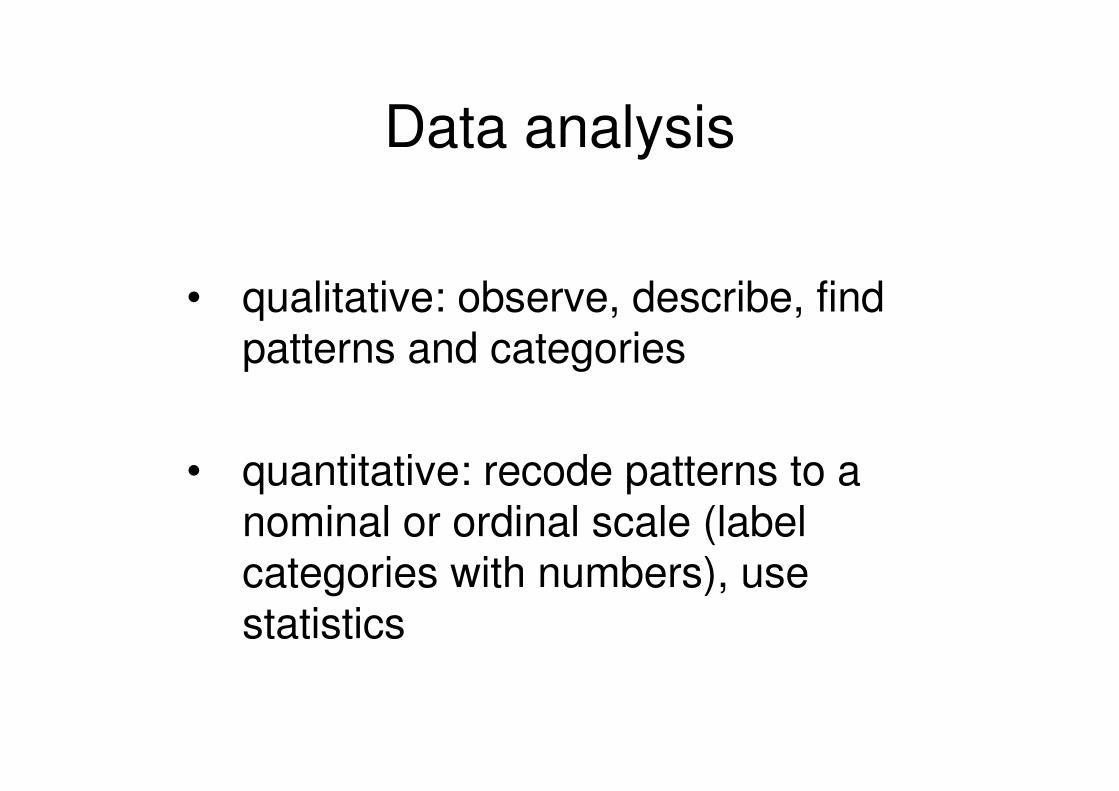
Data analysis
• qualitative: observe, describe, find patterns and categories
• quantitative: recode patterns to a nominal or ordinal scale (label categories with numbers), use statistics
General questions
• Development over time• Inter subject variability: how do children
differ from each other? • Intra subject variability: How much
variability is there within a child?• Distinguish between progress and
achievement. Compare growth curves.
Complications
• The qualitative approach leads to a detailed description of each individual child. Individual situations and behaviors of the subjects are emphasized. In other words, the study consists of multiple case-studies, instead of one group study.
• Children are in different preschools and have different teachers. This can influence their language use in the preschool. How do you account for these influences?
Multilevel analysis
• “Multilevel analysis is a general term referring to statistical methods appropriate for the analysis of data sets comprising several types of unit of analysis.” (Snijders, 2003)
• To account for the influence of school on the development of children, view the children as nested into schools.
• In my study: 24 toddlers belong to one of 3 preschools– Level 1 units: toddlers– Level 2 units: schools
Advantages multilevel models (MLM)
• emphasizes not only the individual but also the social context
• accounts for populations with a hierarchical, nested structure
• can be used with repeated measures, also in the case of missing data (Plewis, 1998)
• Allow covariates to be measured discrete or continuous at each level
• Allow outcomes to be discrete or continuous (Raudenbush, 1994)
Key terms of MLM
• Hierarchy: Organization from detailed to global levels
• Level: Part in hierarchy, consisting of a collection of units of one type. The most detailed level is level 1.
• Unit: Element belonging to a level• Nesting: Collection of units belonging to a level
• Error/residu: Unexpected variance • Intercept: true initial status• Slope: growth rate
Nesting (1)
• Multilevel methods account for data that is nested in higher order data.
• Nesting means that a unit belongs to a category, which is a unit of another category higher in the hierarchy. – For example: a student belongs to a class, the
class belongs to a school, the school belongs to an educational movement.
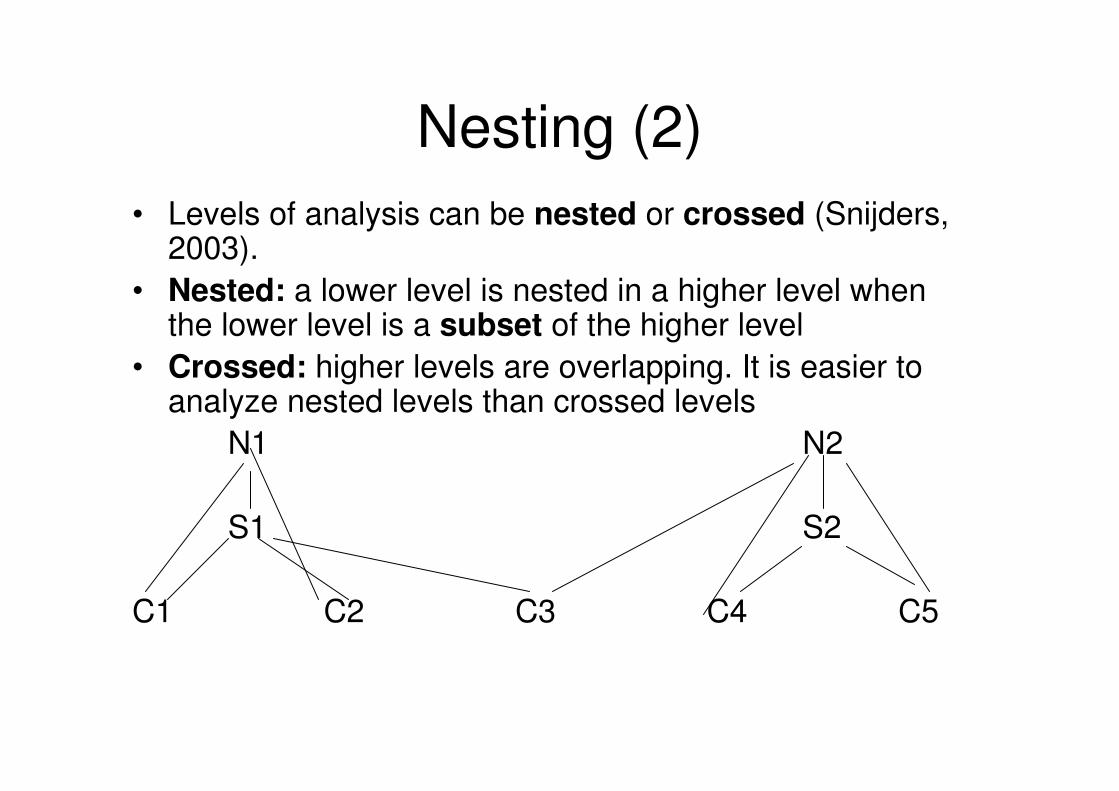
Nesting (2)• Levels of analysis can be nested or crossed (Snijders,
2003). • Nested: a lower level is nested in a higher level when
the lower level is a subset of the higher level• Crossed: higher levels are overlapping. It is easier to
analyze nested levels than crossed levelsN1 N2
S1 S2
C1 C2 C3 C4 C5
Hierarchical Linear Model (HLM)
• The main model of multilevel analysis
• Variant of regression analysis
• Designed for hierarchically structured data.
Features HLM
• Extension of General Linear Model (GLM)• Errors (residuals) at every level• Independent variables can be defined at any of
the levels• Can show interaction effects between levels.
– express how context (macro level) affects relations between variables on the individual level (micro level).
– For example, indicate how much college context (Z) influences the effect of individual achievement (X) on later income (Y) (Snijders, 2003).
Assumptions of HLM
• hierarchical data• one dependent variable measured at
lowest level• independent variables measured at all
existing levels
Example equation HLM (1)
• Question: How do annual incomes of university graduates 15 years after graduation depend on academic achievement in university?– Y = current income– X = average grade – i = graduate student– j = university
• Students are nested in universities• (Example from (Snijders, 2003)
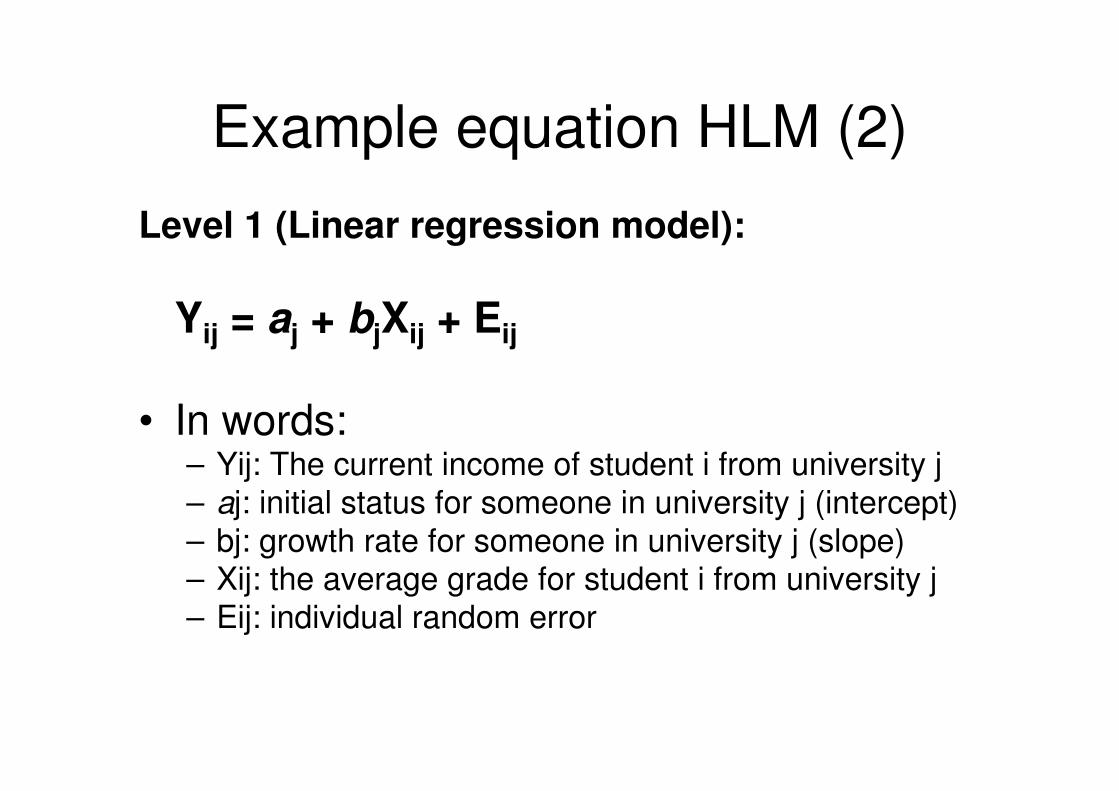
Example equation HLM (2)
Level 1 (Linear regression model):
Yij = aj + bjXij + Eij
• In words:– Yij: The current income of student i from university j– aj: initial status for someone in university j (intercept) – bj: growth rate for someone in university j (slope) – Xij: the average grade for student i from university j– Eij: individual random error
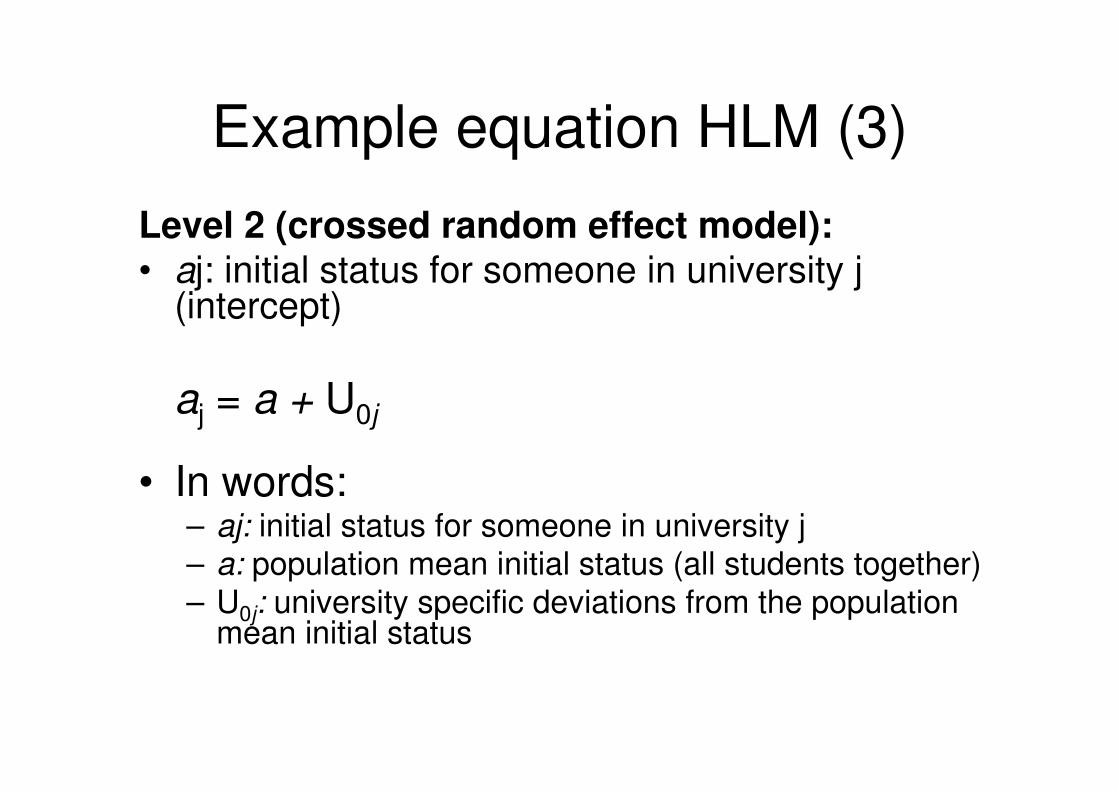
Example equation HLM (3)
Level 2 (crossed random effect model):• aj: initial status for someone in university j
(intercept)
aj = a + U0j
• In words:– aj: initial status for someone in university j – a: population mean initial status (all students together)– U0j: university specific deviations from the population
mean initial status
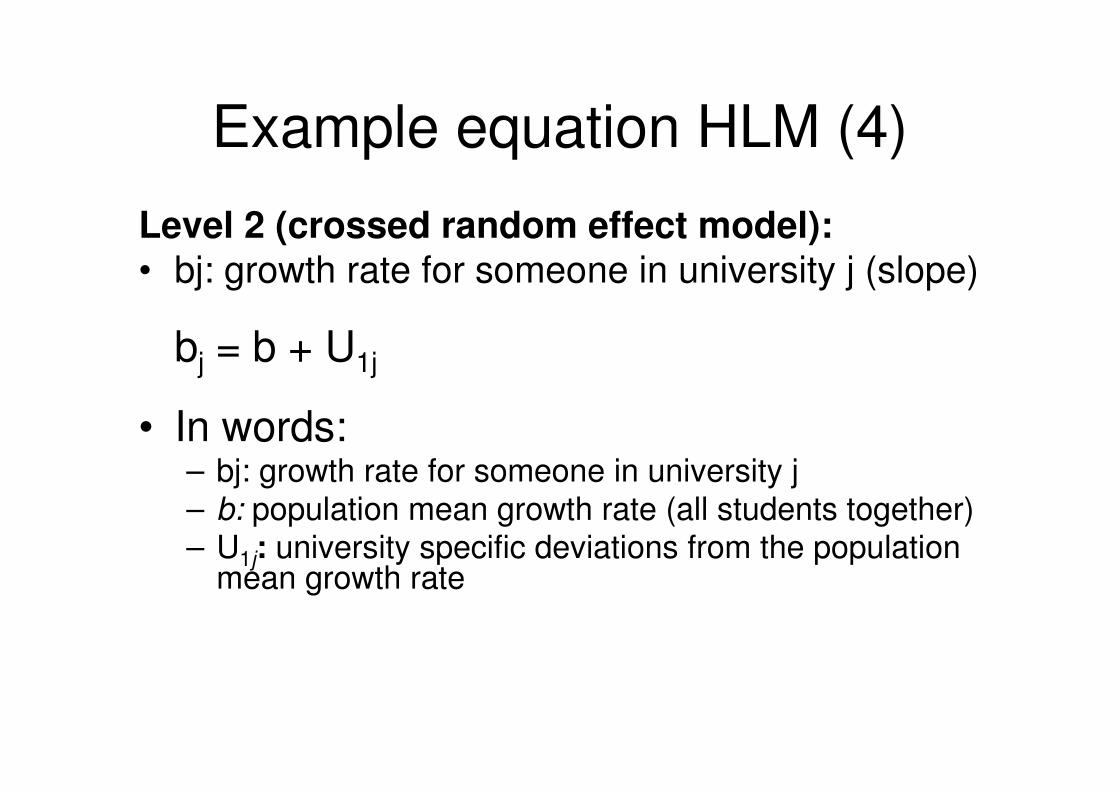
Example equation HLM (4)
Level 2 (crossed random effect model):• bj: growth rate for someone in university j (slope)
bj = b + U1j
• In words:– bj: growth rate for someone in university j – b: population mean growth rate (all students together)– U1j: university specific deviations from the population
mean growth rate
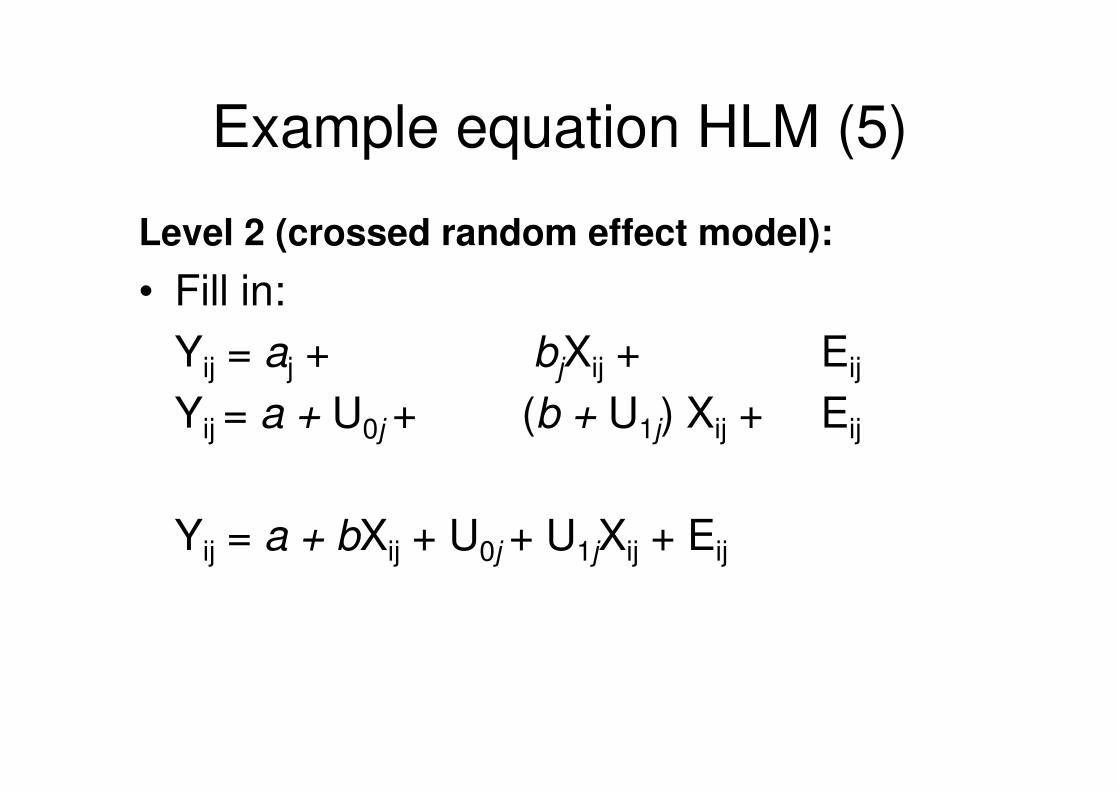
Example equation HLM (5)
Level 2 (crossed random effect model):
• Fill in: Yij = aj + bjXij + Eij
Yij = a + U0j + (b + U1j) Xij + Eij
Yij = a + bXij + U0j + U1jXij + Eij
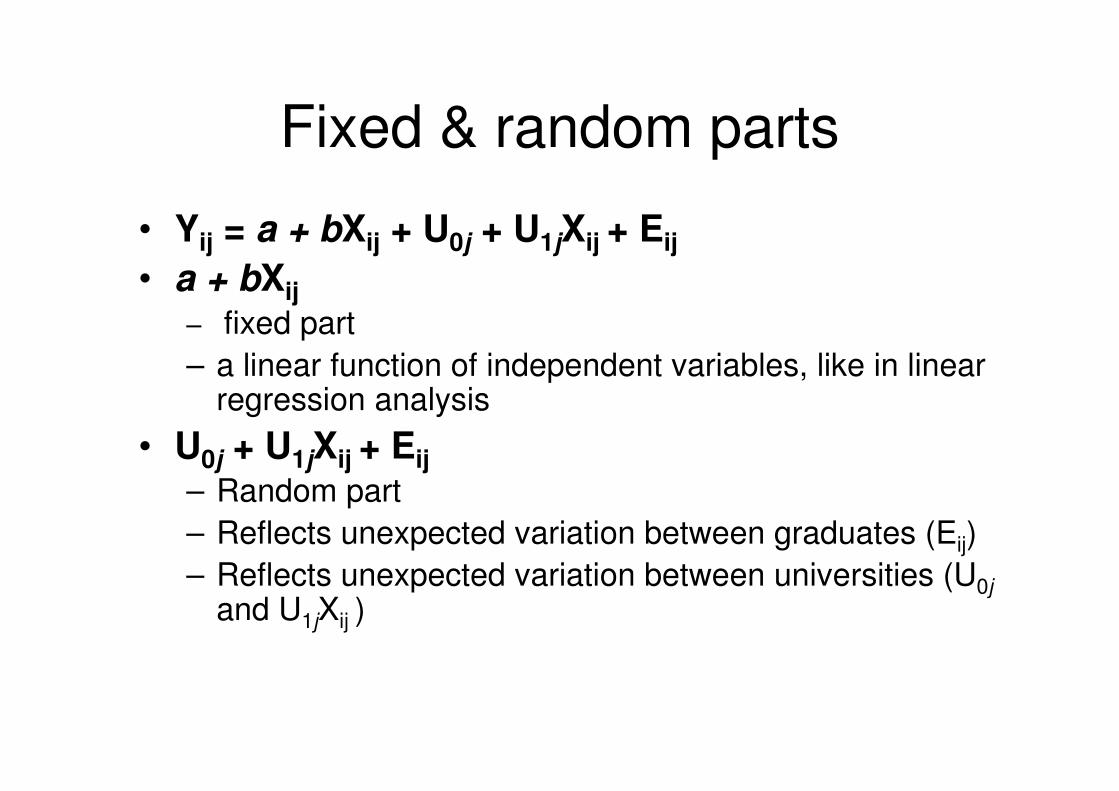
Fixed & random parts
• Yij = a + bXij + U0j + U1jXij + Eij
• a + bXij– fixed part– a linear function of independent variables, like in linear
regression analysis• U0j + U1jXij + Eij
– Random part – Reflects unexpected variation between graduates (Eij) – Reflects unexpected variation between universities (U0j
and U1jXij )
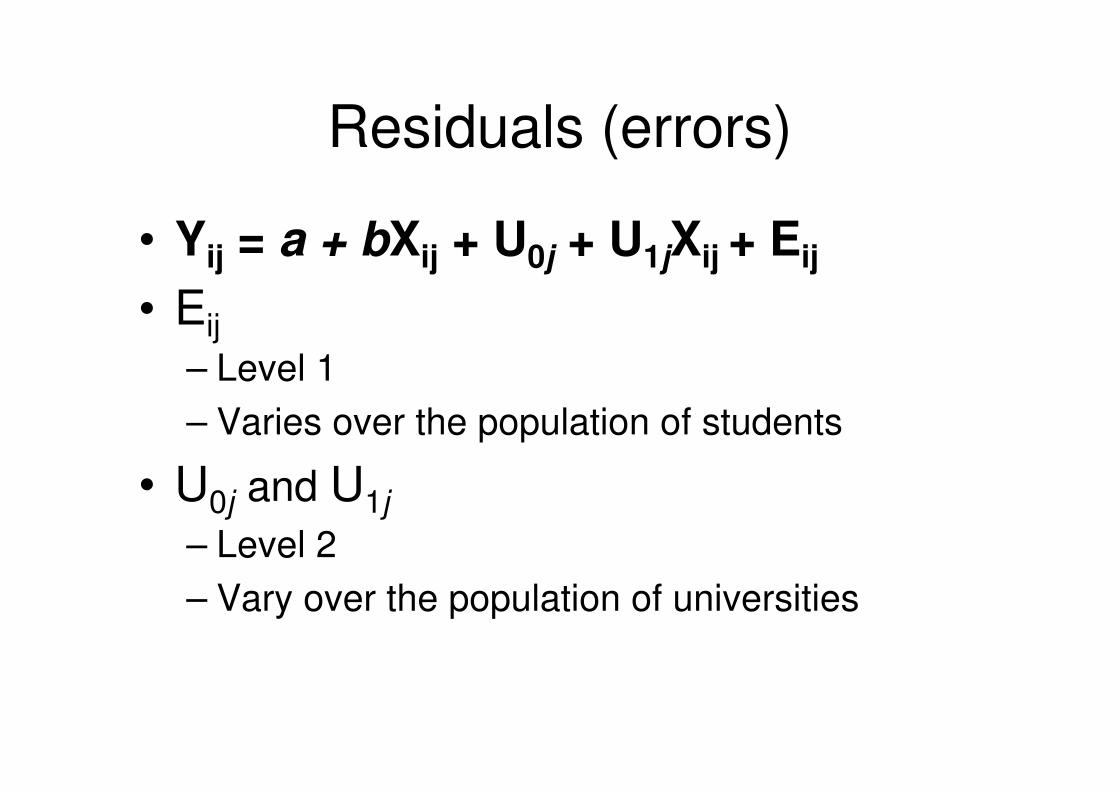
Residuals (errors)
• Yij = a + bXij + U0j + U1jXij + Eij
• Eij– Level 1– Varies over the population of students
• U0j and U1j– Level 2– Vary over the population of universities
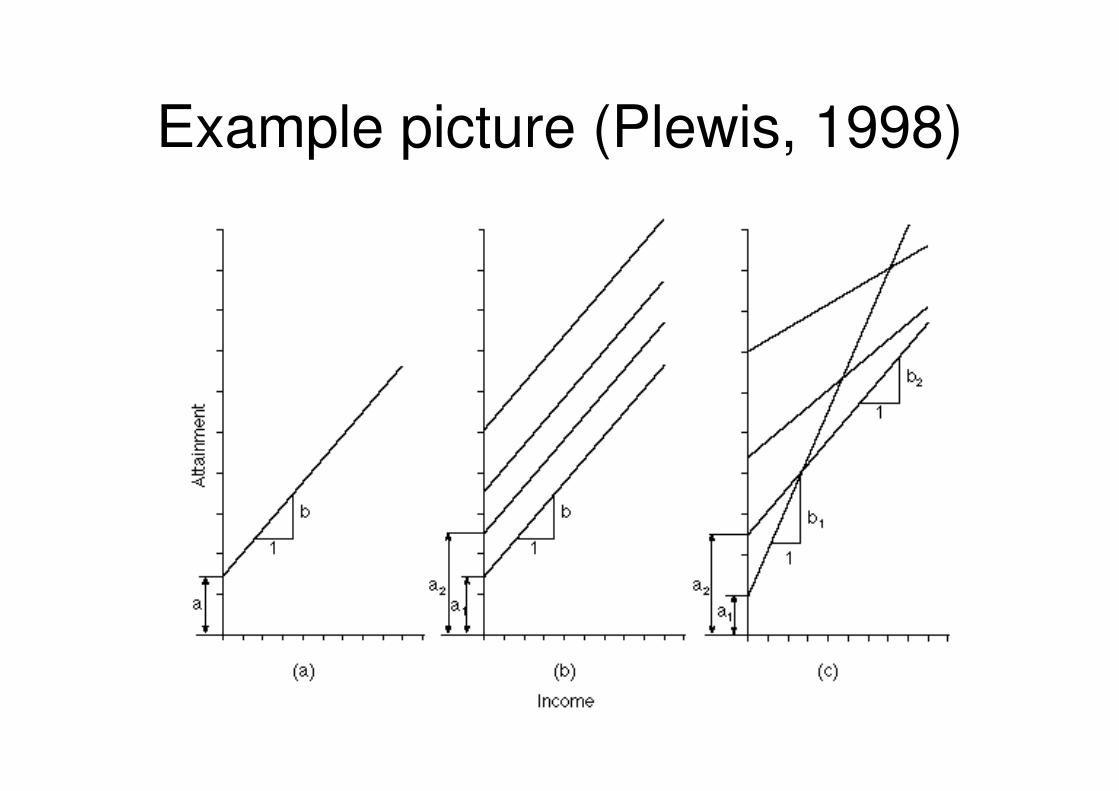
Example picture (Plewis, 1998)
Repeated measures (1)
• By nesting the children in the schools, you account for the effect of school on the child’s performance
• Longitudinal study: – For every child there are repeated measures. – Data points in a child are dependent. – Data points can be seen as nested in the children
Level 1: repeated measuresLevel 2: childrenLevel 3: preschools
Repeated measures (2)
Advantage:– not necessary for every child to have the
same amount of data points. In other words missing data is no problem.
Repeated measures (3)
Dependence on time:• Longitudinal data has a meaningful
numerical time variable (e.g. age). • Crucial relationship between dependent
variable and time variable• However, often the dependence on time is
nonlinear. – use nonlinear transformation– use nonlinear models.
nonlinear versions of HLM
• If : – you can not assume that relations are linear – you can not assume that residuals are
normally distributed– variables are dichotomous– Variables are discrete (fixed set of values, no
values in between)– <30 units per level
Eg Bayesian hierarchical model
Web infoQualitative research • Forum Qualitative Sozialforschung/Forum: Qualitative
Social Research http://www.qualitative-research.net/fqs/fqs-eng.htm
Multilevel models• http://multilevel.ioe.ac.uk/publref/newsletters.html• Prof Snijders, RuG http://stat.gamma.rug.nl/snijders/• Prof Hox, UU http://www.fss.uu.nl/ms/jh/index.htm