Embed Size (px)
Citation preview

Quality and Efficiency of Diabetes Care in Sweden National Performance Assessment 2011

You may quote text from the National Board of Health and Welfare in, for example, educational material provided at cost price, providing you state the source. You may not however use the text in any commercial context. The National Board of Health and Welfare has the sole right to decide how this work shall be used, in accordance with the Act (1960:729) on copyright in literary and artistic works (the Copyright Act). Pictures, photographs and illustrations are also protected by the Copyright Act and their use requires the permission of the author. Article no 2014-3-18 Published www.socialstyrelsen.se, mars 2014

Preface
The National Board of Health and Welfare is amongst others responsible for knowledge-based guidance of health and social services towards good care for all. For this purpose several tools are used including evidence-based national guidelines and performance indicators, open indicator-based comparisons and national performance assessments, as well as public dissemination of results of such assessments.
During 2011, the National Board of Health and Welfare undertook a national assessment of the quality and efficiency of Swedish diabetes care. This report comprises conclusions and recommendations, as well as open indicator-based comparisons of some particularly important areas for improvement. It is based on a previous assessment on diabetes care in county councils and municipalities. This report is included in the National Performance Assessment series which already contains assessment of cardiac care and stroke care.
Diabetes is a serious illness, which may lead to premature death caused by cardio-vascular disease. As part of its efforts to improve diabetes care, the National Board of Health and Welfare published the National Guidelines for Diabetes Care in the January 2010. The National Guidelines provide a set of evidence-based best practices for diabetes screening, prevention and treatment, as well as patient education. The National Guidelines primarily concerns diabetes care provided by county councils, however diabetes care also affects municipalities. For this reason, the National Board of Health and Welfare has assessed performance of both county council and municipal diabetes care.
This report primarily targets decision-makers at various levels: politicians, civil servants and managers in health and social care. It may also be useful to other stakeholders such as patient organisations, end-user organisations, health care professionals and media.
The assessment was based on data collected via several questionnaires, the National Board of Health and Welfare's National Health Data Registers, and two national quality registers within the field of diabetes care - the National Diabetes Register (NDR) and the Swedish Renal Registry (SRR). Representatives of the quality registers have read the draft reports and contributed with valuable comments. Special thanks to the representatives of these registers as without their cooperation it would not have been possible to undertake this assessment.
The assessment was carried out by a team comprising of Christina Broman (Project Manager), Cecilia Dahlgren, Michael Fabel, Max Koster, Caroline Loof and Tsega Muzollo (all of the National Board of Health and Welfare). Outside experts included Christian Berne, Soffia Gudbjornsdottir, Tony Holm, Stefan Jansson, Unn-Britt Johansson, Janeth Leksell and Katarina Steen Carlsson. Editor for the National Performance Assessment series is

Rosita Claesson Wigand. Marie Lawrence (Head of Unit for Performance Assessment) together with Mona Heurgren (Head of Unit for Efficiency and Quality Studies) and Lena Weilandt (Head of Unit for National Guidelines) acted as Steering Committee for the project.
Lars-Erik Holm Director-General National Board of Health and Welfare

Contents
Preface ...................................................................................................................... 3 Summary .................................................................................................................... 7 Introduction .............................................................................................................. 9
Terms of reference .............................................................................................. 9 Focus on diabetes care ..................................................................................... 9 Objectives and limitations ...............................................................................10 Target group .......................................................................................................10 Collaboration .....................................................................................................11 Outline of the report .........................................................................................11
Conclusions and Recommendations ............................................................... 13 Intensify care for persons with HbA1c levels above 73 mmol/mol ..........13 Review procedures in order to reduce amputation rates ........................14 Screen more persons for urinary albumin excretion ...................................14 Provide advice and support to encourage physical activity ..................14 Assist more people with diabetes to quit smoking .....................................15 Provide group-based and culturally-adapted patient education .........15 Use established classifications and coding systems as to improve monitoring and evaluation ..............................................................................16 Does Swedish diabetes care meet the requirements of Good Care? ..17
Overview of Results .............................................................................................. 20 What is Diabetes? ................................................................................................. 23
Different types ....................................................................................................23 Incidence, prevalence and mortality ...........................................................24 Diabetes prevalence rising globally ..............................................................24
Diabetes Care ....................................................................................................... 25 Indicator-based Comparisons ........................................................................... 26
Process and outcome indicators – a selection ..........................................26 Amputation above the ankle (A2) ................................................................27 HbA1c target above 73 mmol/mol (B2) .......................................................29 Screening of urinary albumin excretion (C3) ...............................................32 Physical activity (D1) .........................................................................................34 Non-smokers among persons with diabetes (D2) .......................................38
Further Analysis ...................................................................................................... 41 Diabetes care structures (F1, F2a, F2b) .........................................................41 Pharmaceutical treatment ..............................................................................45

Patient reported outcome (F01, F02, F03, F04) ............................................ 46 References .............................................................................................................. 48 Annex 1: Project Organisation ............................................................................ 49 Annex 2: Methodology ........................................................................................ 51 Annex 3: List of Process and Outcome Indicators .......................................... 55 Annex 4: Graphical Presentations ...................................................................... 56

Summary
Summary
The National Board of Health and Welfare's performance assessment of Swedish diabetes care shows that health care providers comply well with the National Guidelines for Diabetes Care 2010. In many areas, diabetes care show positive results and trend data indicate steady improvements. For instance usage of diabetes drugs as well as usage of test strips to measure blood sugar levels, generally speaking, follows the recommendations in the Guidelines. More persons with diabetes also reach the target level for LDL-cholesterol and blood pressure, and more patients undergo regular foot examinations and retinopathy screening. However there are a few areas where county councils and municipalities can improve their diabetes care. These are mainly areas of care where there are significant differences between county councils and municipalities.
Health care providers, both hospital-based diabetes clinics and primary health care units, can improve diabetes care by:
Intensifying the care for persons with diabetes with a HbA1c level of •more than 73 mmol/mol for instance by more frequent visits to diabetes nurses and physicians in order to reduce the proportion of persons with HbA1c level above 73 mmol/mol (Indicator B2).
Reviewing their procedures and making more use of multi-•disciplinary foot teams if they belong to those with the highest amputation rates (Indicator A2).
Screening more persons with diabetes for urinary albumin excretion •(Indicator C3) in order to earlier detect and prevent kidney damage.
Providing advice and support, as well as prescribing exercise as •treatment to help increase the proportion of people with diabetes who regularly undertake physical activity (Indicator D1).
Offering effective smoking-cessation methods to reduce the •proportion of smokers among persons with diabetes (Indicator D2), especially among younger persons with Type 2 diabetes.
Offering group-based patient education by staff trained in adult •learning approaches in order to improve patients’ self-care (Indicator F1, Indicator F2a).
Offering culturally-adapted patient education to persons with •different cultural backgrounds with the aim to improve patients’ self-care (Indicator F2b).
Using established classifications and coding systems for registration •of diagnosis and interventions in order to improve monitoring and evaluation of diabetes care.
QUALITY AND EFFICIENCY OF DIABETES CARE IN SWEDEN NATIONAL BOARD OF HEALTH AND WELFARE
7

Summary
Diabetes care is also provided by the municipalities as they are responsible for short-term and long-term special housing, domestic assistance for persons living in their own housing and home-based curative health care provided by nurses and auxiliary staff employed by the municipality. Municipalities can improve diabetes care by:
• Providing specific diabetes care training and further education for their staff as to enhance their knowledge.
• Improving their written routines concerning delegation as to prevent mistakes related to drugs and insulin dosages.
• Testing knowledge before delegation as to prevent mistakes. • Introducing updated diabetes care programmes based on current,
evidence-based recommendations for diabetes care as to ensure that care is provided on equal terms for all patients.
The above recommendations are intended to facilitate the county councils’, hospitals/health units’ and municipalities’ regular work aimed at improving diabetes care. Our purpose is to highlight areas where the quality did not reach a desired level in the country as a whole. However, individual municipalities, county councils and hospitals/health units may already have reached a sufficiently high level in one or more of the indicators.
The National Board of Health and Welfare will in particular monitor performance of the indicators on which their recommendations are made, as well as monitoring other indicators. This will be done in connection with the next assessment of diabetes care, which will be initiated in a few years’ time. Future performance assessment will also include analysis of socio-economic aspects. By then the municipalities, county councils and hospitals with weaker results will have been able to improve their results.
8 QUALITY AND EFFICIENCY OF DIABETES CARE IN SWEDEN NATIONAL BOARD OF HEALTH AND WELFARE

Introduction
Introduction
Terms of reference The National Board of Health and Welfare is responsible for monitoring and evaluation of health and social services, as well as reporting on the status of and developments within such services. The Health and Medical Services Act (1982:763) states that the objective of health and medical care is good health and health care on equitable terms for the entire population. In order to fulfil this objective, health and medical care must meet the requirement for good care. According to the law, good care should be evidence-based and effective, safe, patient-centred, efficient and equitable, and be provided in a timely manner.
The National Board of Health and Welfare is also responsible for setting and developing knowledge-based policy and guidance. For this purpose several tools are used including evidence-based national guidelines and performance indicators, open indicator-based comparisons and national performance assessments of different types of care, as well as public dissemination of results of such assessments.
This report is based on a national assessment of diabetes care, measuring compliance with the National Guidelines for Diabetes Care which the National Board of Health and Welfare published in 2010 [1].
The report is included in the National Performance Assessment series which already contains assessment of cardiac care [2] and stroke care [3]. During the course of the next two years, the Board intends to undertake national performance assessments of psychiatric care and dental care, as well as for care of dementia, cancer and musculoskeletal diseases.
Focus on diabetes care There are around 365,000 persons with diabetes living in Sweden [4]. Ap-proximately 15% of them have Type 1 diabetes and are treated mainly in special diabetes clinics, some of which are hospital-based. 85 percent have Type 2 diabetes and they are mainly treated in the primary health care ser-vices, though more complicated cases may be cared for in the diabetes clin-ics. The annual incidence of Type 1 diabetes increases every year. Despite an increase in obesity in the population, there has been no incidence increase in Type 2 diabetes.
The National Guidelines for Diabetes Care 2010 are intended as support for decision-makers in the county councils so that they can steer towards high quality and efficient health care services using transparent and systemat-ic priorities [1]. The Guidelines are also intended to enable the introduction of new methods and the elimination of ineffective or harmful practices in an orderly manner.
QUALITY AND EFFICIENCY OF DIABETES CARE IN SWEDEN NATIONAL BOARD OF HEALTH AND WELFARE
9

Introduction
The Guidelines contain 185 recommendations for diabetes care in the areas of screening, prevention and lifestyle habits, control of blood sugar levels, prevention of cardiovascular diseases, treatment and care, prevention of diabetes complications and pregnancy. The Guidelines cover both adult Type 1 and Type 2 diabetes but not care of children and adolescents with diabetes.
In 2011, the National Board of Health and Welfare also published National Guidelines for Methods of Preventing Disease [5]. These Guidelines include recommendations on methods and approaches that health care professionals can use to assist patients change their lifestyle habits. These recommen-dations can give further guidance on methods to be implemented in the diabetes care. However, these Guidelines had not been published at the time when the performance assessment of diabetes care was undertaken.
Objectives and limitations This report is an assessment of county council structures, processes, out-comes and costs, and municipal structures for diabetes care. In this report, the National Board of Health and Welfare highlights the areas of diabetes care that need improvement and recommends measures to be taken. The objective of this report is to openly compare and assess the performance of Swedish diabetes care on the basis of the following questions:
• Does Swedish diabetes care comply with the recommendations in the National Guidelines?
• Does Swedish diabetes care fulfil the requirements for a Good Care, i.e. is diabetes care evidence-based and effective, safe, patient-centred, efficient and equitable, and provided in a timely manner?
The assessment is based on data from 2010 and earlier. Therefore the prima-ry objective is not to assess how the National Guidelines published in 2010 have been implemented, but to establish a baseline as to measure against in the future. Hence in future assessment it will be possible to evaluate the im-pact of the Guideline on diabetes care structures, processes, outcomes and costs. For some outcome indicators, the National Board of Health and Wel-fare has set target levels to measure results against.
The assessment has been limited to the treatment of adults with diabetes, as the recommendations of the National Guidelines do not concern care of children and adolescents with diabetes. Neither is diet for persons with diabetes included. In this report, hospital –based out-patient diabetes clinics for adults are referred to as diabetes clinics.
Target group This assessment primarily targets decision-makers at various levels: politi-cians, civil servants and managers in health and social care. It may also be useful to other stakeholders such as patient organisations, end-user organisa-tions, health care professionals and media. The intention is also that the re-
10 QUALITY AND EFFICIENCY OF DIABETES CARE IN SWEDEN NATIONAL BOARD OF HEALTH AND WELFARE

Introduction
port will contribute to the public debate on the quality and efficiency of dia-betes care.
Collaboration The assessment was undertaken by a working group which collaborated with the National Diabetes Register (NDR) and the Swedish Renal Register (SNR). The project plan was presented to the National Coordination Group for Knowledge-based Management (NSK).and to various stakeholders (Swedish Diabetes Association, Swedish Association of Nurses in Diabetes Care, Swedish Association of General Practice, Swedish Association for Chiropodists in Diabetes Care, Swedish Association of Diabetology, Swedish Internal Medical Association, National Association Nurse Practitioners), who were asked to give their views on the material. A large number of persons both within and outside the National Board of Health and Welfare have contributed in different ways to this assessment.
Outline of the report The report begins with the chapter Conclusions and Recommendations. This chapter presents the National Board of Health and Welfare’s conclusions and recommendations based in the findings from the assessment of the perfor-mance of diabetes care provided by county councils and municipalities, as well as on the further in-depth analysis presented in this report. An Overview of the Results is also provided in table with brief comments to each indicator.
The following chapter describes the different types of diabetes, as well as the incidence, prevalence and mortality rates in Sweden and globally. Thereafter the reader is briefly introduced to the organisation of diabetes care in Sweden.
In the chapter titled Indicator-based Comparisons the results considered particularly notable are presented. Figures and comments are provided for each indicator. Data is presented at national, county council and hospital level. Gender and age segregated data is presented where relevant.
The indicator-based open comparisons are followed by some Further Analysis. The section on Diabetes Care Structures is based on a survey of hospital-based diabetes clinics and primary health care units mapping staff competence, educational and organisational aspects of diabetes care. An analysis of the consumption and costs of pharmaceutical treatment based on data from the Prescribed Drug Register is also included. Finally, some developmental work on Patient-Reported Outcome Measures (PROMs) related to quality of diabetes care, self-care ability, diabetes as an obstacle in daily life and safety is presented.
The Annex 1 includes a list of project participants and others who have contributed in undertaking this performance assessment. Annex 2 describes the methodology used in the indicator-based comparisons including data collection methods and data sources, as well as various data analysis aspects. Annex 3 lists all the process and outcome indicators. Annex 4 contains
QUALITY AND EFFICIENCY OF DIABETES CARE IN SWEDEN NATIONAL BOARD OF HEALTH AND WELFARE
11

Introduction
graphical presentations related to the indicators included in the assessment. Mainly trend data is included and where relevant gender-segregated data is also presented.
12 QUALITY AND EFFICIENCY OF DIABETES CARE IN SWEDEN NATIONAL BOARD OF HEALTH AND WELFARE

Conclusions and Recommendations
Conclusions and Recommendations
In this chapter, the National Board of Health and Welfare presents a number of conclusions and recommendations about diabetes care based on the col-lected and analysed data. These selected recommendations and conclusions concern the areas of diabetes care where none, or only a few county councils or hospitals/health units achieved the desired results and areas where the assessment highlighted considerable differences between county councils and between hospitals/health units. The National Board of Health and Welfare has also identified areas for improvement in municipal health and medical care, emphasising areas where the municipalities did not fully comply with the recommendations in the National Guidelines.
The recommendations below are intended to facilitate the county councils’, hospitals/health units’ and municipalities’ regular work aimed at improving diabetes care. Our aim is to highlight areas where the quality did not reach a desired results in the country as a whole. However, individual municipalities, county councils and hospitals/health units may already have reached a sufficiently high level in one or more of the indicators.
The National Board of Health and Welfare will in particular monitor performance of the indicators on which their recommendations are made. The next assessment of diabetes care will be initiated in a few years’ time. By then the municipalities, county councils and hospitals with weaker results will have been able to improve their results.
Intensify care for persons with HbA1c levels above 73 mmol/mol It is alarming that the high-risk group with HbA1c above 73 mmol/mol has increased over the years (Indicator B2). A high HbA1c level leads to a great-ly increased risk of diabetes complications. This highlights the necessity of additional health care measures to be taken for those concerned. With in-creased focus from both the individual and the health care providers it is pos-sible to reduce high HbA1c levels, which can significantly improve progno-ses for these patients. Long intervals between visits to diabetes nurses and physicians can be devastating for the chances of achieving better control of blood sugar levels.
Health care providers can improve diabetes care by:
• Intensifying the care for persons with diabetes with a HbA1c level of more than 73 mmol/mol for instance by more frequent visits to diabetes nurses and doctors in order to reduce the proportion of persons with HbA1c level above 73 mmol/mol (B2).
QUALITY AND EFFICIENCY OF DIABETES CARE IN SWEDEN NATIONAL BOARD OF HEALTH AND WELFARE
13

Conclusions and Recommendations
Review procedures in order to reduce amputation rates Diabetes can cause slow-healing foot ulcers which, in some severe cases, can lead to the necessity of amputating the foot above the ankle. Such amputa-tions can be avoided or postponed with good care and regular foot examina-tions. Multi-disciplinary foot teams have proven to be successful in cases of serious foot problems, and the multidisciplinary approach does reduce the number of amputations. Overall the number of amputations due to diabetes is reducing (Indicator A2). However, there is a significant and unacceptable difference in amputation rates between county councils. In some situations, however, surgery is inevitable. Most persons who undergo major amputa-tions are elderly and frail individuals with multiple complicating conditions, and for them an amputation can be a life-saving measure.
Health care providers can improve diabetes care by:
• Reviewing their procedures and making more use of multi-disciplinary foot teams if they belong to the group with the highest amputation rates (A2).
Screen more persons for urinary albumin excretion Renal failure is a common and potentially serious complication of diabetes. Kidney damage among persons with diabetes is characterised by increased excretion of protein in the urine. One early sign of kidney damage is excre-tion of small, but measurable, amounts of albumin in the urine, called micro albuminuria. At this early stage it is necessary to take effective measures to reduce blood pressure and improve control of blood sugar levels in order to reduce the risk of severe kidney damage. It is therefore worrying that the proportion of persons with diabetes who are annually screened for albumin excretion in the urine has decreased over the years (Indicator C3).
Health care providers can improve diabetes care by:
• Screening more persons with diabetes for urinary albumin excretion (C3).
Provide advice and support to encourage physical activity There is a strong link between regular physical activity and reduced risk of cardiovascular disease, Type 2 diabetes, obesity and premature death. Sadly the proportion of individuals with diabetes engaged in physical activity regu-larly, at least three times per week, has decreased since 2008 (Indicator D1). The proportion of people who are physically active also varied significantly between the county councils.
14 QUALITY AND EFFICIENCY OF DIABETES CARE IN SWEDEN NATIONAL BOARD OF HEALTH AND WELFARE

Conclusions and Recommendations
Health care providers can improve diabetes care by:
• Providing advice and support, as well as prescribing exercise as treatment to help increase the proportion of people with diabetes who regularly undertake physical activity (D1).
Assist more people with diabetes to quit smoking Smoking cessation is one of the most important preventive measures to re-duce the risk of diabetes complications. Already 5-10 years after having stopped smoking, morbidity and mortality in people without diabetes is re-duced. The effect has not been studied specifically for people with diabetes but the benefits of quitting smoking are probably at least as good. Among persons with diabetes treated in the primary health care services the propor-tion of smokers has increased slightly over the years (Indicator D2). The proportion of smokers among young people with Type 2 diabetes is high.
Health care providers can improve diabetes care by:
• Offering effective smoking-cessation methods to reduce the proportion of smokers among persons with diabetes (D2).
Provide group-based and culturally-adapted patient education Self-care is a vital part of diabetes care. In order to achieve optimal treatment results, diabetes care should offer group-based patient education conducted by staff possessing in-depth knowledge of diabetes and competence in adult learning methods (Indicator F1, Indicator F2a). In addition patient education should be culturally adapted to each individual’s cultural background (Indi-cator F2b). Diabetes clinics offered group-based patient education to a great-er extent than primary health care units. Nearly 70% of the diabetes clinics offered group-based education for people with Type 1 diabetes and 40% of-fered similar training for people with Type 2 diabetes. Only, 20 percent of the primary care units had any group-based patient education. Only a limited number of diabetes clinics (3%) and primary health care units (5%) organised culturally-adapted patient education, remarkable results as people from many different cultures live in Sweden today.
Health care providers can improve diabetes care by:
• Offering group-based patient education by staff trained in adult learning approaches to a greater extent (F1, F2a).
• Offering culturally-adapted patient education to people for persons with different cultural backgrounds (F2b).
Provide staff training, improve routines for delegation and introduce updated diabetes care programmes in municipalities
QUALITY AND EFFICIENCY OF DIABETES CARE IN SWEDEN NATIONAL BOARD OF HEALTH AND WELFARE
15

Conclusions and Recommendations
Diabetes care is also provided by the municipalities as they are responsible for short-term and long-term special housing, domestic assistance for persons living in their own housing and home-based health and medical care provided by nurses and auxiliary staff employed by the municipality. Such municipal staff also needs special training in diabetes care, yet only about 40% of the municipalities offered training or continuing education for their staff. Many municipal care facilities employed nurses without special diabetes care training. In 70% of the municipalities the auxiliary nurses had no further training in diabetes care.
Most municipalities (90%) had written routines for delegation of diabetes care, most of these municipalities also made sure that staff had the correct knowledge when delegating tasks. However, supervisory visits undertaken by the National Board of Health and Welfare have shown that delegation routines were not monitored as should be. Moreover self-reported cases of mistakes, so called Lex Maria-cases, related to drug and insulin dosages do happen, therefore applying knowledge test before delegation of task is imperative. Finally, municipal care programmes for diabetes care were in many municipalities found to be outdated or non-existent, resulting in patients receiving different types of care depending who was looking after them. Only one-third of the municipalities had more recent diabetes care programmes based on evidence-based knowledge.
When a person with diabetes enters the municipal health system, the various organisations involved must use clearly-defined procedures so that the patient is guaranteed good continuous diabetes care. Therefore, good collaboration between the municipality, primary health care and specialist care is essential when it comes to training and care programmes.
Municipalities can improve diabetes care by:
• Providing specific diabetes care staff training and further education. • Improving their written routines concerning delegation. • Testing knowledge before delegation. • Introducing updated diabetes care programmes based on current,
evidence-based recommendations for diabetes care.
Use established classifications and coding systems as to improve monitoring and evaluation Health care providers register for example secondary diagnoses and interven-tions differently. Consequently it is not fully possible to compare register-based data for consumption and costs of diabetes care between county coun-cils and between hospitals. However, there are established classification and code systems for the registration of secondary diagnoses and interventions. With more uniform registration practises monitoring and evaluation of diabe-tes care could improve.
Health care providers can improve diabetes care by:
16 QUALITY AND EFFICIENCY OF DIABETES CARE IN SWEDEN NATIONAL BOARD OF HEALTH AND WELFARE

Conclusions and Recommendations
• Using established classifications and coding systems for registration of diagnosis and interventions in order to improve monitoring and evaluation of stroke care.
Does Swedish diabetes care meet the requirements of Good Care? According to the Swedish Health and Medical Act of 1982, Good Care should be evidence-based and effective, safe, patient-centred, efficient and equitable, and be provided in a timely manner. Hence Good Care comprises six dimensions reflecting various aspects of quality of care as well as effi-ciency. On the basis of the results of this performance assessment it is partly possible to assess whether Swedish diabetes care meet the requirements for a Good Care.
However, it should be noted that the indicators included in this assessment do not cover all aspects of Good Care. For instance more indicators describing patient-related outcome would be needed. Such data should preferably be collected via registers so that data can be analysed over time.
Another difficulty with analysing if Swedish health care providers are providing Good Diabetes Care is that most of the indicators used involve more than one dimension. For example, the same indicator may reflect effectiveness, and safety of care. For this reason the section merely provides a brief overview of the six dimensions of diabetes care.
Evidence-based and effectiveness Evidence-based and effective health care means that care is based on scien-tific knowledge and on proven experience, and is designed to meet the indi-vidual patient's needs in the best possible manner.
The majority of the indicators presented in this report are based on evidence-based and effective care. The indicators included are reflecting the recommendations in the National Guidelines for diabetes care, which in turn are based on scientific knowledge.
In many respects, Swedish diabetes care does live up to the recommendations in the Guidelines and in many areas diabetes care has improved in recent years. For example the number of amputations above the ankle has decreased year after year. However, there is a significant difference in amputation rates between county councils and regions. Retinal screening works well in Sweden and the differences between county councils are relatively small. The proportion of people with diabetes achieving a blood pressure level below 130/80 mmHg increased during the period 2006-2010. This improvement is most visible among people with Type 1 diabetes.
However, there are also areas within diabetes care that need improvement. One such example is the proportion of people with diabetes who undertake regular physical activity at least three times per week. There are currently differences between county councils and between medical clinics and primary care units. The level in the country as a whole is well below the
QUALITY AND EFFICIENCY OF DIABETES CARE IN SWEDEN NATIONAL BOARD OF HEALTH AND WELFARE
17

Conclusions and Recommendations
desired level, meaning that the county councils and hospitals do not follow the recommendation in the Guidelines sufficiently.
Diabetes care in Sweden is to a large extent evidence-based and effective, and trends are looking favourable. However in some areas it is desirable for the pace of improvement to accelerate.
Safety Safety means that health-care related injuries are avoided by proactive risk preventive work.
Swedish diabetes care can be considered safe. That said, it is not complete-ly free from the risks that individual treatments, or lack of individual treat-ments, may generate. It is necessary to continue targeted patient safety work in order to ensure further improvements and increased safety levels for per-sons with diabetes. The Guidelines recommend intensive treatment for peo-ple with Type 1 and Type 2 diabetes with no known cardiovascular disease in order to achieve optimal blood sugar levels. Those receiving the intensive treatment require careful monitoring and frequent checks are especially im-portant (blood pressure, foot status, lipids, HbA1c level, any microalbuminu-ria, waist size and weight).
Patient-centeredness Patient centred health care means that care is provided with respect and sen-sitivity to the individual's specific needs, expectations and values, and that these are taken into account in clinical decisions.
Diabetes care should be patient-focused. One way of achieving this goal is to offer patient education that is provided with respect and sensitivity to each patient's needs. Patient education on self-care is important as people with diabetes make many important decisions about the management of their dis-ease every day. The goal of this education is to show people with diabetes how they can maintain well-functioning self-care with good control of risk factors for ill health, while maintaining good quality of life. Patient education may be performed individually or in groups. The patient reported outcome measures show that certain areas of diabetes care could be improved.
Equity Equitable health care means that care is accessible and distributed equally to everyone who needs it.
The Guidelines recommend that care providers take into account each individual's cultural patterns and adapt care and education accordingly. However, culturally-adapted patient education hardly occurs at all, even though this measure has been awarded a high priority level in the Guidelines. As people from many different cultures live in Sweden today tailored patient education is crucial for the success of diabetes care.
This assessment has considered various aspects of equity. Gender and age perspectives as well as geographical differences have been analysed in this assessment and results have been highlighted. In future assessment socio-economic aspects will also be analysed.
18 QUALITY AND EFFICIENCY OF DIABETES CARE IN SWEDEN NATIONAL BOARD OF HEALTH AND WELFARE

Conclusions and Recommendations
Efficiency Efficient health care ensures that available resources are used wisely to achieve set goals. This means care and treatment are designed and adminis-tered in collaboration between healthcare stakeholders based on the degree of seriousness of the condition and cost effectiveness of the measures.
Measuring the efficiency of care requires comparative data on quality and costs. Such data is lacking. Firstly, there are no national registers for diabetes care consumption and costs at primary health care level. Secondly, both sec-ondary diagnoses and interventions are registered differently in different county councils. There are established classifications and coding systems for registration of diagnosis and interventions: if applied properly in the health care services, data needed for monitoring and evaluation of diabetes care would improve.
The report does however describe some areas of cost-effective treatment choices. The National Board of Health and Welfare has analysed consump-tion and costs of diabetes medication. The data shows changes in drug use and the use of test strips over time. The changes correspond, in many ways, to the recommendations in the National Guidelines.
Generally speaking, the National Board of Health and Welfare would like to emphasise that, when county councils and hospitals comply with the rec-ommendations in the Guidelines, resources are utilised efficiently, as patients receive the right care and additional care for complications is avoided.
Timeliness Timely health care means that no patient should have to wait an unreasonable period of time for the treatment, care or help he or she needs.
The National Board of Health and Welfare has not studied any aspects of timeliness in this performance assessment. Hence no conclusions can be drawn regarding this dimension of diabetes care quality.
QUALITY AND EFFICIENCY OF DIABETES CARE IN SWEDEN NATIONAL BOARD OF HEALTH AND WELFARE
19

Conclusions and Recommendations
Overview of Results
The table below gives an overview of the results per indicator in the country as a whole. For each indicator a verbal comment follows. Annex 4 contains graphical presentations for all indicators except indicators F and F0, which are found in the chapter Further Analysis.
Indicator Variation Overall Judgement
A Outcome of diabetes care A1 Cardio-vascular mortality ● A2 Amputation above the ankle ●●● A3 Diabetic patients with end stage renal failure (renal insufficiency) ●●● ― A4 Intrauterine foetal death and neonatal mortality ― ― A5 Severe congenital malformation and chromosomal abnormalities ― ― A6 Presence of diabetic retinopathy ― ―
B Effectiveness B1 HbA1c-target < 52 mmol/mol ●● B2 HbA1c > 73 mmol/mol ●●● B3 Blood pressure target < 130/80 mm Hg ● B4 Blood pressure > 140/90 mm Hg ● B5 LDL cholesterol target < 2.5 mmol/l ● B6 Presence of macroalbuminuria ●
C Treatment C1 Foot examination ● C2 Retinopathy screening ● C3 Screening for urinary albumin excretion ●●● C4 Treatment with metformin ● ―
D Lifestyle D1 Physical activity ●● D2 Non-smokers among persons with diabetes ●●
E Avoidable hospitalisation E1 Avoidable hospital admissions ●● ―
F* Diabetes care structures F1 Trained diabetes nurse ― ― F2a Group-based patient education ― ― F2b Culturally-adapted patient education ― ―
F0* Patient reported outcome F01 Perceived quality of diabetes care ― ― F02 Perceived self-care ability ― ― F03 Perception of diabetes as an obstacle in life ― ― F04 Perceived feeling of safety ― ― *Indicators F and F0, based on survey data, are not included in Annex 4, but in the chapter Further Analysis.
Variation Overall Judgement ● small variation Good result ●● average variation Medium good result ●●● large variation Less good result ― Not possible to evaluate ― Not possible to evaluate
20 QUALITY AND EFFICIENCY OF DIABETES CARE IN SWEDEN NATIONAL BOARD OF HEALTH AND WELFARE

Conclusions and Recommendations
A1 – Cardio-vascular mortality People with diabetes experience a two to three times incidence rate of falling ill with or dying from a cardiovascular disease compared with the population in general. Cardiovascular deaths among persons with diabetes treated with pharmaceuticals have decreased. A2 - Amputation above the ankle Total number of amputations above the ankle in the country has decreased over time. However, there are unacceptable differences in amputation rates between county councils. A3 - Diabetic patients with end stage renal failure (renal insufficiency) The number of people with diabetes is increasing, yet the need for uremia treatment is decreasing. This applies mainly to persons with Type 1 diabetes. A4, A5 - Intrauterine foetal death and neonatal mortality, and severe congenital malformations and chromosomal abnormalities Pregnancy outcome for women with diabetes and those who develop diabetes during pregnancy is continuously improving in Sweden. International comparisons show that pregnancy outcome for Swedish women with a pre-existing history of diabetes are among the most favourable in the world. A6 – Presence of diabetic retinopathy Since registration in the National Diabetes Register is incomplete, it is not possible to draw any conclusions on diabetic retinopathy. Uniform classifications are needed in order to improve registration of data as this indicator is vital to diabetes care. B1 – HbA1c-target < 52 mmol / mol Fewer persons with diabetes reach the target level for blood sugar. Fewer men than women reach the target level. B2 - HbA1c > 73 mmol/mol A high HbA1c level leads to a greatly increased risk of diabetes complications. The proportion of persons with diabetes with an HbA1c level above 73 mmol/mol has increased. Long intervals between visits to diabetes nurses or doctors can be devastating to improved control of blood sugar levels. B3, B4 - Blood pressure target < 130/80 mmHg and Blood pressure > 140/90 mmHg The proportion of persons with diabetes achieving a blood pressure level below 130/80 mmHg has increased. The proportion of persons with diabetes with a blood pressure above 140/90 mmHg has decreased. Variation is relatively large between different county councils. B5 - LDL cholesterol target < 2.5 mmol/l There is a slight increase of total number of people who reach the target level. More men than women reach the target level. However, there was a relatively large variation between county councils. B6 – Presence of macro albuminuria The proportion of persons without presence of albuminuria has been stable over time. C1 - Foot examination The proportion of persons with diabetes who undergo a simple foot examination has increased over time. The results are generally good at hospital and county council levels. C2 – Retinopathy screening Retinal screening works well in Sweden and differences between county councils are relatively small.
QUALITY AND EFFICIENCY OF DIABETES CARE IN SWEDEN NATIONAL BOARD OF HEALTH AND WELFARE
21

Conclusions and Recommendations
C3 – Screening of urinary albumin excretion Renal failure is a potentially serious complication of diabetes. The proportion of persons with diabetes who were screened for albumin excretion in their urine has decreased in recent years. There was also large difference between county councils. C4 – Treatment with Metformin Metformin is the first-line treatment for Type 2 diabetes. There was a variation in Metformin treatment between the county councils. D1 - Physical activity There is a strong link between regular physical activity and reduced risk of cardiovascular disease, Type 2 diabetes, obesity and premature death. County councils differed greatly in terms of the proportion of persons with diabetes who were physically active. D2 - Non-smokers among persons with diabetes Smoking cessation is one of the most important measures to reduce risk of diabetes complications. The proportion of smokers varied widely between county councils, and had increased slightly over the years among persons treated in the primary health care services. E1 – Avoidable hospital admissions If people with diabetes receive good out-patient care, then "unnecessary" hospital admissions can be avoided. During the last few years, the number of persons with avoidable hospital admissions has decreased. However, there was a significant variation between county councils. F1 – Diabetes trained nurse The survey showed that almost all hospital-based diabetes clinics, where mainly adults with diabetes are treated, had diabetes trained nurses employed. Most primary health care units had at least one diabetes trained nurse employed. F2a, F2b – Group-based patient education Hospital-based diabetes clinics offered group-based patient education to a greater extent than primary health care units. Culturally-adapted patient education was offered by a small number of diabetes clinics and health care units. F01, F02, F03, F04 – Patient Reported Outcome Results from a pilot project on patient reported outcome showed that most persons with type 1 and 2 diabetes were satisfied with their diabetes care, however many persons with type 1 diabetes perceived diabetes as an obstacle in life. Persons with type 1 diabetes were also less happy with their self-care ability and worried more about complications, feeling less safe with their diabetes.
22 QUALITY AND EFFICIENCY OF DIABETES CARE IN SWEDEN NATIONAL BOARD OF HEALTH AND WELFARE

What is Diabetes?
What is Diabetes?
Different types Diabetes is a serious illness which can lead to premature death caused by cardio-vascular diseases. The most common types of diabetes are diabetes mellitus Type 1 and diabetes mellitus Type 2. Persons with Type 1 or Type 2 diabetes have elevated blood sugar (glucose) levels, but the underlying caus-es are different for the two types of diabetes [1]. Long-term diabetes compli-cations include cardio-vascular diseases, diabetic retinopathy where eyesight is affected, kidney failure which may require dialysis and poor circulation of limbs leading to amputations.
In 1997, the American Diabetes Association classified diabetes into differ-ent categories. This classification was modified by the WHO in 1999. The classification is based on the causes of the disease and identifies four differ-ent types: Type 1 diabetes, Type 2 diabetes, other specific diabetes types and gestational (pregnancy) diabetes. Clinically, different glucose levels can be identified, from normal glucose tolerance to hyperglycaemia. Diabetes can be divided into three different levels: non-insulin dependence; insulin depend-ence for hyperglycaemia control and insulin dependence for survival [6].
Diabetes mellitus Type 1 is basically caused by an absolute insulin defi-ciency due to destruction of islet cells in the pancreas. Persons with Type 1 diabetes have fewer insulin producing islet cells in their pancreas already when the disease starts [6]. A few years after symptom on-set, these cells disappear and the person will be totally dependent on insulin treatment. The destruction of the islet cells is caused by an autoimmune reaction, whereby the body produces antibodies against them.
In diabetes mellitus Type 2 (formerly known as adult-onset diabetes) is a metabolic disorder that is characterised by high blood glucose in the context of insulin resistance (reduced effect of insulin) and relative insulin deficien-cy. The classic symptoms are excess thirst, frequent urination and constant hunger. The most common risk factors are overweight or obesity, physical inactivity, diet composition and genetic factors. Approximately, 20-25 % of the Swedish population is genetically predisposed for Type 2 diabetes [6]. However, overweight is the most influential risk factor for Type 2 diabetes.
Gestational Diabetes Mellitus (GDM) is a condition in which women without previously diagnosed diabetes exhibit high blood glucose levels dur-ing pregnancy. GDM generally has few symptoms and it is therefore diag-nosed by screening during pregnancy. If a woman gains weight heavily in the years before falling pregnant, the risk for GDM also increases. The risk of getting GDM is 17 percent for pregnant women with overweight or obesity, compared with 1-3 percent for women with normal weight [4]. Undiagnosed and untreated GDM can lead to the same complications for the mother as if she had diabetes before the pregnancy. GDM can also lead to an unusual high birth weight of the newborn.
QUALITY AND EFFICIENCY OF DIABETES CARE IN SWEDEN NATIONAL BOARD OF HEALTH AND WELFARE
23

What is Diabetes?
Incidence, prevalence and mortality There are around 365,000 persons with diabetes in Sweden. Approximately 40,000 of them have Type 1 diabetes [4]. Every year around 700 children in the age group 0-14 years get Type 1 diabetes. The annual incidence increases for every year. In 2007, the incidence was 42 per 100,000 children and year. The prevalence was 350 per 100,000 children. For the age group 15-34, the number of new cases is 400 per year [6]. There are also approximately 30,000 persons living in Sweden but who were born outside the Nordic coun-tries who are treated for diabetes. Many of them originate from countries where diabetes is epidemic [1].
There are around 325,000 persons who have Type 2 diabetes. Type-2 dia-betes makes up 85-90 percent of cases of diabetes with the other 10 percent primarily due to diabetes mellitus Type 1 and gestational diabetes [4]. De-spite the fact that the proportion of overweight and obese in the population has increased in recent years, there has been no incidence increase in Type 2 diabetes, which has been seen in Type 1 diabetes.
Today people live longer with diabetes therefore the prevalence is now es-timated at 5 percent among women and 7 percent among men in Sweden [4]. More women than men have Type 2 diabetes. However the gender difference disappears when women’s higher average age is taken into account.
Diabetes is the most common cause of death among the endocrine diseas-es. Among women diabetes mortality has been stable over the years with 16-17 per 100,000 deaths, while the mortality among men has increased from 21 per 100,000 deaths in 1987 to 25 per 100,000 deaths in 2010 [7].
Diabetes prevalence rising globally Globally, Type 1 diabetes among adults is estimated to comprise 5-10 per-cent of all persons with diabetes. Most countries have data on Type 1 diabe-tes for persons up to the age of 15. Above this age it is difficult to differenti-ate between Type 1 diabetes and Type 2 diabetes. Consequently it is also hard to estimate incidence rates. Type 2 diabetes can also be treated with insulin. In addition, Type 1 diabetes can appear as Type 2 diabetes, meaning that blood glucose levels slowly deteriorates and finally make the persons completely insulin dependent. This type of diabetes is called Latent Autoim-mune Diabetes of Adults (LADA), also referred to as diabetes Type 1.5.
The International Diabetes Federation (IDF) has estimated that there are about 284 million people with diabetes worldwide in the age group 20-79 years. Most of them, 85-90 percent, have type 2 diabetes. Most likely the numbers will increase with approximately 54 percent until the year 2030 and the diabetes population will reach 438 million. The greatest increases are expected in Africa (98%), South-east Asia (72%) and Middle- and South America (65%). The expected increase in Europe is smaller, with a rise of 20 percent leading to a European diabetes population of about 66 millions in the year 2030 [8].
24 QUALITY AND EFFICIENCY OF DIABETES CARE IN SWEDEN NATIONAL BOARD OF HEALTH AND WELFARE

Diabetes Care
Diabetes Care
Persons with Type 1 diabetes receive care primarily from out-patient diabetes clinics in hospitals, while persons with Type 2 diabetes are mostly cared for in the primary health care services. Diabetes clinics may also deal with more complex cases of Type 2 diabetes. Most diabetes clinics are organised within a hospital’s medicine or endocrine unit. The number of out-patient visits to diabetes clinics varies but most clinics had between 100 and 500 visits during the first quarter of 2011. Only a few had less than 100 visits according to a survey undertaken by the National Board of Health and Welfare in 2011.
There are about 1,200 primary health care units in Sweden [9]. Primary health care services can be provided by the county council, private providers or some other provider such as individuals, companies owned by the county council, foundations, cooperatives or various organisations. In recent years, the number of private providers has increased. During the first quarter of 2011, around half of the primary health care units had 200-400 diabetes patients (survey, National Board of Health and Welfare).
Diabetes care is often provided by multi-professional teams. A diabetes team may include physicians, trained diabetes nurses, dieticians, podiatrists, counsellors and physiotherapists.
Physicians who work in diabetes clinics are either diabetologists or endocrinologists. In 2008, there were only 179 authorised diabetologists and endocrinologists working in the Swedish health sector, and their distribution across the country was uneven [10].
Registered nurses with additional university education in diabetology play an important role in the diabetes care. These nurses are employed in both diabetes clinics and in the primary health care services. Patient-education is an important part of diabetes care. The objective with such education is to teach patients to manage their own care on a daily basis and to recognise risk factors in order to maintain a good quality of life. Many hospital-based diabetes clinics and some primary health care clinics offer group-based patient-education. Consequently, specialised diabetes nurses responsible for patient-education must not only have specific diabetes knowledge, but must also have competence in adult learning approaches.
Diabetes care is also provided by the municipalities. Municipalities are responsible for social services including short-term and long-term special housing for instance for elderly and disabled. Municipalities are also responsible for various types of domestic assistance for people living in their own housing. Many persons also receive home-based curative health care provided by nurses and auxiliary staff employed by the municipalities. Some of the persons, who do receive assistance from the municipalities, also have diabetes, although it is not possible to estimate the actual number of persons concerned.
QUALITY AND EFFICIENCY OF DIABETES CARE IN SWEDEN NATIONAL BOARD OF HEALTH AND WELFARE
25

Indicator-based Comparisons
Indicator-based Comparisons
Process and outcome indicators – a selection This chapter highlights a selection of indicators – both process and outcome indicators - namely those underlying the recommendations. The indicators are divided into five categories:
Outcome of diabetes care 6 indicators A. Effectiveness 6 indicators B. Treatment 4 indicators C. Lifestyle 2 indicators D. Avoidable hospitalisation 1 indicator E.
The letter in the name of the indicator shows which category the indicator belongs to. Thus Indicator A02 falls into category A – Outcome of diabetes care. There are 19 indicators in total, out of which five are presented in this report. Data is presented at three different levels - national, county council and hospital levels – where such data is relevant and available. Gender and age segregated data is presented where differences were found. Annex 4 con-tains graphical presentations for all 19 indicators. Annex 4 contains graphical presentations for all indicators, except F and F0. Indicators F and F0 are found in the chapter Further Analysis.
The presentations are usually based on the latest available data. However, with an aim to improve the statistical certainty, data from several years was used in some cases. Statistical uncertainty (the influence of chance) is illus-trated in by a confidence interval. Smaller county councils or hospitals have comparatively few cases in various categories, resulting in greater uncertain-ty in their results and therefore also in greater confidence intervals. Due to higher statistical uncertainty, smaller county councils and hospitals are more often found at the top or bottom of the ranking while the reverse is true for larger hospitals and the three largest county councils. If a hospital has fewer than 70 reported cases its results are not included in the diagrams.
There are several factors that may confound results and make them diffi-cult to interpret, for example differences in age structure and co-morbidity among persons with diabetes. In order to increase comparability, the National Board of Health and Welfare has for some indicators standardised for age where it may influence results. In some cases, data is presented for a limited age group.
26 QUALITY AND EFFICIENCY OF DIABETES CARE IN SWEDEN NATIONAL BOARD OF HEALTH AND WELFARE
Indicator-based Comparisons
Amputation above the ankle (A2) Diabetes can cause slow-healing foot ulcers, which in severe cases can lead to foot amputation above the ankle. Between 50% and 70% of all amputa-tions of the lower extremities (trauma and tumours exempted) concern peo-ple with diabetes. At least 75% of all diabetes-related amputations are pre-ceded by a wound below the ankle. Diabetes-related amputations above the ankle are associated with significant morbidity, high mortality rate, severe disability and high costs. Such amputations could be prevented or postponed with proper care and regular inspection of the feet. Multidisciplinary foot teams have proven to be successful in cases of serious foot problems and this approach reduces the number of amputations. The National Guidelines rec-ommends that persons with diabetes regularly have their feet examined as a preventive measure (Priority 2 out of 10). Furthermore, the Guidelines em-phasises that persons with slow-healing ulcers should have their feet taken care by multidisciplinary teams (priority 1 out of 10).
Results During the period 2007-2010 the number of amputations above the ankle per 100 000 persons with pharmaceutical-treated diabetes aged 40 and older de-creased (Figure A2, Sweden). The county councils performed between 195 and 433 amputations per 100 000 persons with pharmaceutical-treated diabe-tes (Figure A2, County Council).
Conclusions The trend is, overall, encouraging with a reduction of major amputations due to diabetes. However there are unacceptable differences in amputation rates between county councils. As early as 1998, SPRI (the former medical care and social care planning and rationalisation institute) and the Medical Re-search Council (MFR) issued detailed advice on how diabetic foot problems should be prevented and treated in order to obtain more uniform treatment of such ulcers. The significant variations between county councils and regions show that uniformity is lacking, although the total amputation rate has de-creased. There are reasons to recommend that the health care providers with the highest amputation rates review their procedures and make more use of multidisciplinary foot teams as to provide proper care.
In some situations, however, this surgery is inevitable. Most people who undergo major amputations are elderly with multiple complicating illnesses, and for them amputation can be a life-saving measure.
QUALITY AND EFFICIENCY OF DIABETES CARE IN SWEDEN NATIONAL BOARD OF HEALTH AND WELFARE
27

Indicator-based Comparisons
0
100
200
300
400
500
600
700
2010200920082007 Year
Source: Patient Register and Prescribed Drug Register .
Figure A2. Amputation above the ankle Number of amputations above the ankle per 100,000 persons with diabetes treated with pharmaceuticals in the ages 40 years and older.
Per 100 000 persons
0 100 200 300 400 500 600 700
GotlandVasternorrland
HallandVastra Gotaland
VastmanlandOrebro
UppsalaGavleborgVarmland
SWEDENBlekinge
StockholmNorrbottenKronobergJonkoping
OstergotlandKalmar
JamtlandSkane
VasterbottenDalarna
Sormland
Per 100 000 persons
Figure A2. Amputation above the ankle
Source: Patient Register and Prescribed Drug Register .
195 196 220 225 225 226 240 251 257 263 266 270 272 283 291 291 299 316 327 352 363 433
Number of amputations above the ankle per 100,000 persons with diabetes treated with pharmaceuticals in the ages 40 years and older, 2007-2010.
28 QUALITY AND EFFICIENCY OF DIABETES CARE IN SWEDEN NATIONAL BOARD OF HEALTH AND WELFARE

Indicator-based Comparisons
HbA1c target above 73 mmol/mol (B2) A high HbA1c level leads to a greatly increased risk of diabetes complica-tions. This indicator is intended to identify the high risk group with HbA1c levels above 73 mmol/mol, a group which should be as small as possible, and to encourage additional health care measures to be taken for them. With ef-forts from the people concerned and measures taken by the health care pro-viders it should be possible to reduce high HbA1c levels. This can signifi-cantly improve the future prognosis for the patients. High levels often decrease quantitatively more than lower levels, consequently the gains from interventions that reduce HbA1c for the individual person may have major beneficial effects.
Results During the period 2006-2010, the proportion of people with diabetes with an HbA1c level above 73 mmol/mol increased (Figure B2, Sweden). The pro-portion was highest in the age group under 30 years old. This applied for persons treated both in the primary care services and in hospital based diabe-tes clinics (Figure B2 Sweden, per age group).
The proportion of persons with Type 2 diabetes treated in the primary health care services who had an HbA1c level above 73 mmol/mol varied in the county councils, from 6-11% percent (Figure B2, Primary health care). For persons with type 1 diabetes treated in medicine clinic at hospitals, the proportion was 14-31% (Figure B2 Hospitals).
Men with Type 2 diabetes had poorer control of blood sugar levels than women, while high HbA1c levels were more common among women with Type 1 diabetes than among men.
For persons with Type 2 diabetes, the differences were relatively minor between different providers in the primary health care services, but the range was remarkably large between county councils as regards to persons with Type 1 diabetes.
Conclusions It is alarming that the group with a high risk of complications from diabetes has increased over the years. These persons may need special attention for instance more frequent visits to specialised diabetes nurses and physicians. Long intervals between visits can deter the chances of achieving better con-trol of blood sugar levels. Within the primary health care services, the pro-portion with high HbA1c levels is fairly small. However, one problem for both diabetes clinics and primary care services is that the proportion is high-est among young people who risk being exposed to high glucose levels for a long period of time and therefore they are increasing their risk of severe complications. Meanwhile, the proportion of individuals with high HbA1c levels in older age groups has decreased, but it is unclear whether this is due to better control of blood sugar levels or due to premature death caused by diabetes complications. In order to answer this question, it would be neces-sary to undertake a specific analysis of this material.
QUALITY AND EFFICIENCY OF DIABETES CARE IN SWEDEN NATIONAL BOARD OF HEALTH AND WELFARE
29

Indicator-based Comparisons
Special measures are necessary for this group of patients who have inade-quate control of their blood sugar levels, especially among patients attending diabetes clinics as more than 20 % of the persons with diabetes had an HbA1c level of above 73 mmol/mol.
0
5
10
15
20
25
20102009200820072006
Percent
Year
Type 1 diabetes, treated in diabetes clinics, hospitalsType 2 diabetes, treated in diabetes clinics, hospitalsType 2 diabetes, treated in primary health care services
Source: NDR – National Diabetes Register.
Figure B2. HbA1c-target > 73 mmol/mol Proportion of persons with diabetes with HbA1c > 73mmol/mol who were treated in hospitals or in primary health care services.
26,6
23,2 21,3
11,4
15,6
6,6
23,8
7,7
0
5
10
15
20
25
30
Type 1 diabetes, treated in diabetes clinics,hospitals
Type 2 diabetes, treated in primary health careservices
Percent
< 30 30-64 65-80 >80
Proportion of persons with diabetes with HbA1c > 73mmol/mol who were treated in hospitals or in primary health care services, per age group, 2010.
Figure B2. HbA1c-target > 73 mmol/mol
Source: NDR – National Diabetes Register.
30 QUALITY AND EFFICIENCY OF DIABETES CARE IN SWEDEN NATIONAL BOARD OF HEALTH AND WELFARE

Indicator-based Comparisons
0 10 20 30 40 50
VasternorrlandStockholm
VasterbottenVastmanland
NorrbottenOrebro
VarmlandKronoberg
SWEDENDalarnaHallandKalmar
GotlandBlekinge
JamtlandSkane
GavleborgUppsala
Vastra GotalandSormland
JonkopingOstergotland
Percent
Figure B2. HbA1c-target > 73 mmol/mol
Source: NDR – National Diabetes Register.
6 6 7 8 8 8 8 8 8 8 8 8 9 9 9 9 9 9
10 10 11 11
Proportion of persons with diabetes with HbA1c > 73mmol/mol who were treated in primary health care services, 2010.
0 10 20 30 40 50
OrebroSormlandJamtlandVarmland
NorrbottenDalarnaKalmar
VastmanlandVasternorrland
UppsalaSkane
VasterbottenBlekingeSWEDEN
GavleborgKronobergStockholm
Vastra GotalandOstergotland
JonkopingGotlandHalland
Percent
Figure B2. HbA1c-target > 73 mmol/mol
Source: NDR – National Diabetes Register.
14 17 17 20 20 20 21 21 22 22 23 23 23 23 24 24 24 24 24 25 28 31
Proportion of persons with diabetes with HbA1c > 73mmol/mol who were treated in hospitals, 2010.
QUALITY AND EFFICIENCY OF DIABETES CARE IN SWEDEN NATIONAL BOARD OF HEALTH AND WELFARE
31

Indicator-based Comparisons
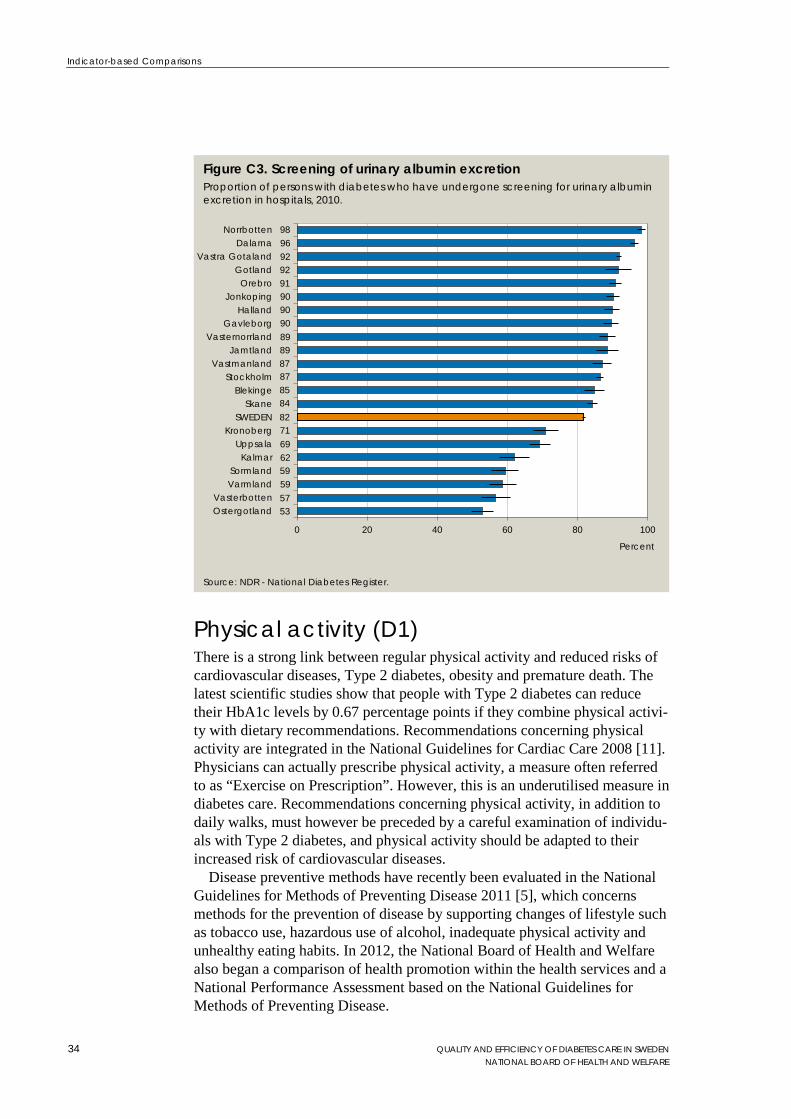
Screening of urinary albumin excretion (C3) Renal failure is a common, and potentially serious, complication of diabetes. Kidney damage among persons with diabetes is characterised by an increase in excretion of protein in the urine. An early sign of kidney damage is excre-tion of small, but measurable, amounts of albumin in the urine, called micro albuminuria. At this early stage, effective measures should be taken to reduce blood pressure and improve control of blood sugar levels in order to prevent severe kidney damage. Consequently an annual screening of albumin levels in the urine has for a long period of time been part of diabetes care. Previous-ly urinary albumin excretion was analysed using the total amount of urine excreted or collected during a 24-hour period or during a night. However, patient compliance to the method of urine collection is lower than using test strips to analyse samples of urine. Therefore in Sweden in recent years a switch has been made to analysing samples of urine and measuring the ratio of albumin and creatinine, which is a well-validated method. Screening of urinary albumin excretion using test strips has been awarded a priority level 1, the highest priority in the National Guidelines.
Results During the period 2006-2010, the proportion of persons with diabetes who were screened for urinary albumin excretion decreased (Diagram C3, Swe-den). For persons with Type 2 diabetes treated in the primary health care services in 2010, the proportion was 58-87 % (Diagram C3 Primary health care services). For persons with Type 1 diabetes treated in hospitals, the pro-portion was 53-98 % (Diagram C3 Hospitals).
Conclusions The reduction of the proportion of annually screened persons with diabetes is worrying. The reason may be that the period between visits to physicians has increased for patients. Several county councils undertake urinary albumin excretion screening only at physician’s appointment as the patient may need a prescription depending on the result of the test.
The difference between county councils and hospitals is unacceptably large for this important screening test.
32 QUALITY AND EFFICIENCY OF DIABETES CARE IN SWEDEN NATIONAL BOARD OF HEALTH AND WELFARE

Indicator-based Comparisons
0102030405060708090
100
20102009200820072006
Percent
Year
Type 1 diabetes, treated in diabetes clinics, hospitalsType 2 diabetes, treated in diabetes clinics, hospitalsType 2 diabetes, treated in primary health care services
Source: NDR - National Diabetes Register.
Figure C3. Screening of urinary albumin excretion Proportion of persons with diabetes who have undergone screening for urinary albuminexcretion (in hospitals or in primary health care services).
0 20 40 60 80 100
KalmarKronoberg
VastmanlandStockholm
VasternorrlandSkane
SormlandVasterbotten
BlekingeOstergotland
JonkopingSWEDENHalland
GavleborgNorrbottenVarmland
UppsalaVastra Gotaland
JamtlandOrebro
GotlandDalarna
Percent
Figure C3. Screening of urinary albumin excretion
Source: NDR - National Diabetes Register.
87 86 85 83 83 82 80 80 77 76 73 72 72 72 70 68 67 66 65 60 58 58
Proportion of persons with diabetes who have undergone screening for urinary albumin excretion in primary health care services, 2010.
QUALITY AND EFFICIENCY OF DIABETES CARE IN SWEDEN NATIONAL BOARD OF HEALTH AND WELFARE
33
Indicator-based Comparisons
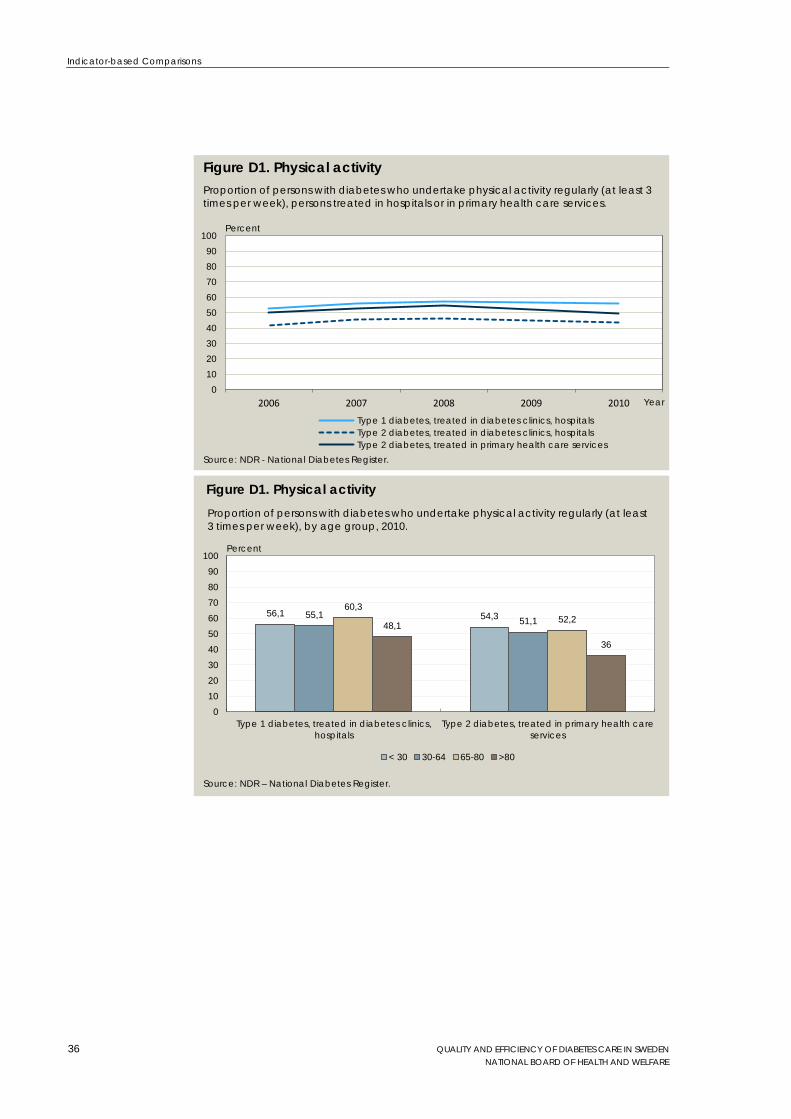
Physical activity (D1) There is a strong link between regular physical activity and reduced risks of cardiovascular diseases, Type 2 diabetes, obesity and premature death. The latest scientific studies show that people with Type 2 diabetes can reduce their HbA1c levels by 0.67 percentage points if they combine physical activi-ty with dietary recommendations. Recommendations concerning physical activity are integrated in the National Guidelines for Cardiac Care 2008 [11]. Physicians can actually prescribe physical activity, a measure often referred to as “Exercise on Prescription”. However, this is an underutilised measure in diabetes care. Recommendations concerning physical activity, in addition to daily walks, must however be preceded by a careful examination of individu-als with Type 2 diabetes, and physical activity should be adapted to their increased risk of cardiovascular diseases.
Disease preventive methods have recently been evaluated in the National Guidelines for Methods of Preventing Disease 2011 [5], which concerns methods for the prevention of disease by supporting changes of lifestyle such as tobacco use, hazardous use of alcohol, inadequate physical activity and unhealthy eating habits. In 2012, the National Board of Health and Welfare also began a comparison of health promotion within the health services and a National Performance Assessment based on the National Guidelines for Methods of Preventing Disease.
0 20 40 60 80 100
OstergotlandVasterbotten
VarmlandSormland
KalmarUppsala
KronobergSWEDEN
SkaneBlekinge
StockholmVastmanland
JamtlandVasternorrland
GavleborgHalland
JonkopingOrebro
GotlandVastra Gotaland
DalarnaNorrbotten
Percent
Figure C3. Screening of urinary albumin excretion
Source: NDR - National Diabetes Register.
98 96 92 92 91 90 90 90 89 89 87 87 85 84 82 71 69 62 59 59 57 53
Proportion of persons with diabetes who have undergone screening for urinary albumin excretion in hospitals, 2010.
34 QUALITY AND EFFICIENCY OF DIABETES CARE IN SWEDEN NATIONAL BOARD OF HEALTH AND WELFARE

Indicator-based Comparisons
Results At the beginning of the period 2006-2010, the proportion of persons with diabetes who regularly undertook physical activity increased both among women and men. However, this increase began to decline after 2008. In 2010 in among persons treated in the primary health care services, 50 % regularly undertook physical activity. The corresponding figure for persons treated in hospitals was 56 % for persons with Type 1 diabetes and 44 % for persons with Type 2 diabetes.
In 2010, 40-68 % of the persons with Type 2 diabetes who were treated in the primary health care services undertook some form of physical activity regularly (Diagram D1 Primary health care). The corresponding figure for persons with Type 1 diabetes who were treated in hospitals was 43-77 % (Diagram D1 Diabetes clinics, hospitals). Gender-segregated data for persons treated in the primary health care services showed that in all county councils more men than women undertook physical activity regularly. Among persons with Type 1 diabetes treated in hospitals, more women than men undertook physical activity regularly in 15 of the county councils.
Conclusions Physical activity reduces the risk for several diseases. Sadly, the proportion of physically active patients began to decline after 2008. At least 75% of persons under the age of 80 with Type 1 or 2 diabetes should be physically active. The oldest group often suffer from co-morbidity and other problems therefore it is more difficult to determine a target level for them.
County councils differ to an unjustified degree in their proportions of physically active people. In the primary care services the difference is 28 percentage points between the highest and lowest levels and for medical clinics there is a 34 percentage point variation. For persons treated in the primary health care services, more men than women were physically active in all county councils. These results were remarkable and should be reviewed by the health services.
QUALITY AND EFFICIENCY OF DIABETES CARE IN SWEDEN NATIONAL BOARD OF HEALTH AND WELFARE
35
Indicator-based Comparisons
0102030405060708090
100
20102009200820072006
Percent
Year
Type 1 diabetes, treated in diabetes clinics, hospitalsType 2 diabetes, treated in diabetes clinics, hospitalsType 2 diabetes, treated in primary health care services
Source: NDR - National Diabetes Register.
Figure D1. Physical activity Proportion of persons with diabetes who undertake physical activity regularly (at least 3 times per week), persons treated in hospitals or in primary health care services.
56,1 54,3 55,1 51,1 60,3
52,2 48,1
36
0102030405060708090
100
Type 1 diabetes, treated in diabetes clinics,hospitals
Type 2 diabetes, treated in primary health careservices
Percent
< 30 30-64 65-80 >80
Proportion of persons with diabetes who undertake physical activity regularly (at least 3 times per week), by age group, 2010.
Figure D1. Physical activity
Source: NDR – National Diabetes Register.
36 QUALITY AND EFFICIENCY OF DIABETES CARE IN SWEDEN NATIONAL BOARD OF HEALTH AND WELFARE

Indicator-based Comparisons
0 20 40 60 80 100
Vastra GotalandNorrbottenGavleborgStockholm
UppsalaDalarnaGotlandSWEDEN
VastmanlandOrebro
VasternorrlandBlekinge
VarmlandSkane
OstergotlandKalmar
JamtlandVasterbotten
HallandSormland
JonkopingKronoberg
Percent
Figure D1. Physical activity
Source: NDR - National Diabetes Register.
68 58 57 56 55 55 55 55 53 52 52 52 51 50 50 48 48 47 46 45 42 40
Proportion of persons with diabetes who undertake physical activity regularly (at least 3 times per week), persons treated in primary health care services, 2010.
0 20 40 60 80 100
NorrbottenVastmanland
StockholmGavleborg
SkaneVasternorrland
OrebroHalland
JonkopingSWEDEN
JamtlandSormland
Vastra GotalandVarmland
VasterbottenUppsala
KalmarOstergotland
DalarnaKronoberg
BlekingeGotland
Percent
Figure D1. Physical activity
Source: NDR - National Diabetes Register.
77 72 67 64 63 59 59 58 58 58 57 56 56 56 55 54 53 51 50 49 49 43
Proportion of persons with diabetes who undertake physical activity regularly (at least 3 times per week), persons treated in diabetes clinics in hospitals, 2010.
QUALITY AND EFFICIENCY OF DIABETES CARE IN SWEDEN NATIONAL BOARD OF HEALTH AND WELFARE
37

Indicator-based Comparisons
Non-smokers among persons with diabetes (D2) Smoking cessation is one of the most important preventive measures to re-duce the risk of diabetes complications. Already 5-10 years after a person has stopped smoking, morbidity and mortality among persons without diabetes is reduced: a result that is statistically significant. The effect has not been stud-ied specifically for persons with diabetes but the benefits of quitting smoking are probably at least as good.
Results During the period 2006-2010, the proportion of non-smokers among people with Type 1 and Type 2 diabetes treated in hospitals was largely unchanged. Among persons with diabetes treated in the primary health care services, the proportion of non-smokers, however, decreased from 87 % in 2006 to 84 % in 2010. This reduction applied to both women and men.
There were more smokers among younger persons with diabetes treated in the primary health care services, than among the older age groups.
In 2010, the proportion of non-smokers among persons with diabetes who were treated in the primary health care services was 77-88 % (Figure D2 Primary health care). The corresponding figure for persons with Type 1 dia-betes treated in hospitals was 79-92 % (Figure D2 Diabetes clinics, hospi-tals). The proportion of smokers differed remarkably between county coun-cils and the span was, for example, 8-21 % for Type 1 diabetes. The variation was similar for persons with Type 2 diabetes. In the primary health care ser-vices, the proportion of non-smokers was the same among women and men, while there were fewer women who were non-smokers among people with Type 1 diabetes at medical clinics.
Conclusions The proportion of smokers has increased slightly among diabetes patients treated in the primary health care services. Given that the Guidelines' objec-tive is zero tolerance, these results are disappointing. The proportion of smokers among young people with Type 2 diabetes is high. This is a group of patients with potentially long residual life, where smoking cessation is espe-cially important.
Smoking brings extensive costs along with it, especially for persons with diabetes where there is an additional risk for diabetes-specific complications. Consequently the county councils need to focus on effective and in some cases also more resource-intensive, smoking-cessation methods.
38 QUALITY AND EFFICIENCY OF DIABETES CARE IN SWEDEN NATIONAL BOARD OF HEALTH AND WELFARE

Indicator-based Comparisons
80
85
90
95
100
20102009200820072006
Percent
Year
Type 1 diabetes, treated in diabetes clinics, hospitalsType 2 diabetes, treated in diabetes clinics, hospitalsType 2 diabetes, treated in primary health care services
Source: NDR - National Diabetes Register.
Figure D2. Non-smokers among persons with diabetes Proportion of non-smokers among persons with diabetes treated in hospitals or in primary health care services.
85,7 70,8 86,1 75,9 90,5 87,2 97,6 95,5 0
102030405060708090
100
Type 1 diabetes, treated in diabetes clinics,hospitals
Type 2 diabetes, treated in primary health careservices
Percent
< 30 30-64 65-80 >80
Proportion of non-smokers among persons with diabetes treated in hospitals and in primary health care services, by age group, 2010.
Figure D2. Non-smokers among persons with diabetes
Source: NDR – National Diabetes Register.
QUALITY AND EFFICIENCY OF DIABETES CARE IN SWEDEN NATIONAL BOARD OF HEALTH AND WELFARE
39

Indicator-based Comparisons
0 20 40 60 80 100
KronobergStockholm
VastmanlandSkane
OstergotlandSWEDEN
OrebroSormlandVarmland
KalmarGavleborg
Vastra GotalandGotlandUppsala
NorrbottenVasternorrland
JonkopingBlekinge
JamtlandHalland
VasterbottenDalarna
Percent
Figure D2. Non-smokers among persons with diabetes
Source: NDR - National Diabetes Register.
88 88 87 87 87 87 86 86 86 85 85 85 85 85 85 84 84 84 83 81 80 77
Proportion of non-smokers among persons with diabetes treated in primary health care services, 2010.
0 20 40 60 80 100
KalmarKronobergSormlandGotland
VarmlandBlekinge
VastmanlandSkane
OstergotlandOrebro
VasterbottenStockholm
UppsalaSWEDEN
NorrbottenHalland
JamtlandVasternorrland
JonkopingDalarna
Vastra GotalandGavleborg
Percent
Figure D2. Non-smokers among persons with diabetes
Source: NDR - National Diabetes Register.
92 91 90 90 88 87 87 87 87 86 86 86 85 85 84 84 84 84 83 81 80 79
Proportion of non-smokers among persons with diabetes treated in diabetes clinics in hospitals, 2010.
40 QUALITY AND EFFICIENCY OF DIABETES CARE IN SWEDEN NATIONAL BOARD OF HEALTH AND WELFARE

Further Analysis
Further Analysis
Diabetes care structures (F1, F2a, F2b) Several recommendations in the National Guidelines for Diabetes Care 2010 are of particular importance for the structures of the health services. For in-stance the National Guidelines recommends multi-disciplinary teams, group-based patient-education, culturally adapted patient-education and specific support to patients to manage their diabetes. The Guidelines also recommend specific intensive treatment for patients with Type 1 and Type 2 diabetes with no known cardio-vascular diseases in order to achieve optimal blood sugar levels. For these recommendations to be followed, Swedish diabetes care must have certain structures in place including available competences and organisational arrangements.
County council diabetes care In order to investigate if such structures were indeed in place, the National Board of Health and Welfare undertook a survey of diabetes clinics in hospi-tals and primary health care units in the county councils. During the spring of 2011 a questionnaire was sent to 92 diabetes clinics, 81 responded (88%). Within the primary health care services, 600 units were randomly selected to be included in the survey. The response rate was 42% (253 of 600).
Diabetes team The National Guidelines recommend diabetes care to be undertaken by mul-ti-disciplinary teams. In diabetes clinics, the specialised physicians and nurs-es play key roles in these teams. Other professionals such as dieticians, podi-atry therapists, counsellors and physiotherapists are found both in primary care and diabetes clinics. Almost all diabetes clinics (95%) had organised diabetes teams. Approximately 85% of the diabetes clinics reported that their diabetes team included a podiatry therapist, while 35 % included a physio-therapist, 90% a dietician and nearly 65% a counsellor.
In the primary health care services 30% of the health units used diabetes teams. Of these, nearly 40% reported that their team included a podiatry therapist. Slightly more than 15% had physiotherapists, nearly 20% had a dietician and around 15% had a counsellor.
Trained diabetes nurses (F1) The National Guidelines recommend that nurses not only ought to have spe-cific university education in diabetes care, but also need an educational background such as university competence in adult learning approaches. This is important as much of the diabetes nurses’ work involve educating patients to take care of their own daily diabetes care.
A trained diabetes nurse is a nurse who has specific university education n diabetes care, worth at least 15 academic credits (approximately 15 weeks of studies) (Indicator F1). During the first quarter of 2011, there were 257
QUALITY AND EFFICIENCY OF DIABETES CARE IN SWEDEN NATIONAL BOARD OF HEALTH AND WELFARE
41

Further Analysis
trained diabetes nurses employed in the hospital-based diabetes clinics. Approximately 38% of the specialised diabetes nurses (97 persons) had 15 academic credits in diabetes care, 47%percent (122 persons) had 16-30 academic credits, 12% (31 persons) 31-60 academic credits, and finally 3% (7 persons) had more than 61 academic credits in diabetes care.
In the first quarter of 2011, in the primary care services nearly 90% of the primary health care units employed at least one specialised diabetes nurse with at least 15 academic credits in diabetes care. In these units primary health care units, 32% had no university education training in pedagogy and adult-learning approaches. Around 16% percent of the diabetes nurses had up to 7.5 academic credits in pedagogy; 34% had 7.6-15 academic credits, 17% had 15.1-31 academic credits, and only a few persons had more than 31 academic credits in pedagogy.
In 60% of the primary health care units, the specialised diabetes nurses estimated that they spent 11-30 hours per week on diabetes care. A minority of them (less than 10 percent) estimated spending more than 41 hours per week on diabetes care. However, the response rate in the primary health care services was only 42 percent therefore these results may not representative for the country as a whole.
Group-based patient education (F2a) Group-based patient education for persons with Type 1 diabetes has been awarded priority level 4 out of 10 in the National Guidelines. Such patient education is offered by the hospital-based diabetes clinics. Group-based pa-tient education for persons with Type 2 diabetes was awarded priority 3 out of 10. Moreover, patient education should be provided by staff trained in adult learning approaches. In fact, the Guidelines state that patient education should not at all be provided by staff without any such competence. The rea-son for this is that training in self-care is vital in diabetes care. The aim is that people with diabetes should know what is necessary in order to manage their own self-care, and thus have good control of risk factors for ill health and be able to maintain a good quality of life. Therefore, staff responsible for patient education should have good levels of knowledge of diabetes and its treatment, and be familiar with the educational methods and approaches used in current adult training programmes.
Diabetes clinics offered group-based patient education to a greater extent than primary health care units. Nearly 70% of the diabetes clinics provided group-based patient education for persons with Type 1 diabetes, and 40% offered training for people with Type 2 diabetes. Of the primary health care units, 20% offered group-based patient education for persons with Type 2 diabetes.
Culturally-adapted patient education (F2b) The National Guidelines also emphasise the need for culturally adapted pa-tient education for persons with diabetes (priority level 4 out of 10). The Guidelines recommend that diabetes care should take into account each indi-vidual’s cultural background and should adapt care and patient-education to them. However, culturally-adapted patient education was offered only by a
42 QUALITY AND EFFICIENCY OF DIABETES CARE IN SWEDEN NATIONAL BOARD OF HEALTH AND WELFARE

Further Analysis
small number of diabetes clinics and primary care units. 3% of diabetes clin-ics offer such training in groups, as well as 5% of primary care units.
Several universities and higher education schools offer specific training programmes on cultural aspects on health care for health care professionals. However, some of these programmes had to be cancelled since there were too few applicants.
Intensive treatment and other services The Guidelines recommend intensive treatment for people with Type 1 and Type 2 diabetes but without cardio-vascular diseases in order to achieve op-timal blood sugar levels. Those receiving such intensive treatment require more careful monitoring.
Most hospital-based diabetes clinics and primary health care units reported that they offered services in line with the National Guidelines. For instance 90 % of the clinics and units offered intensive treatment to control blood sugar levels, preventative foot therapy and support regarding physical activity.
Frequent check-ups In order to achieve the best possible control of blood sugar levels, the Na-tional Guidelines recommend that patients are to be frequently checked for blood pressure, foot status, lipid levels, HbA1c level, urinary microalbuminu-ria, waist size and weight.
The survey showed that diabetes clinics and primary health care units undertook various check-ups on persons with Type 1 and Type 2 diabetes on insulin therapy or a combination of tablets and insulin. In primary health care units, frequent check-ups were also undertaken among the units that participated in the survey. However, the response rate was only 42 percent. The National Board of Health and Welfare noted that people with diabetes received a reasonable number of check-ups of various parameters in both diabetes clinics and in primary care services. By monitoring these parameters, the effects of various therapies can be assessed and care can be optimised for the patient.
Municipal diabetes care In order to map the structures in place for diabetes care in the municipalities, a questionnaire was sent to all municipalities during the spring of 2011. The response rate was 66 percent (212 out of 321). The questionnaires were an-swered by the Chief Community Nurse in each municipality. The Chief Community Nurse is responsible for the health care services in the munici-pality. The objective of this survey was to map the structures for diabetes care in the municipalities. More specifically the following areas were cov-ered in the questionnaire: staff competence and further education and training regarding diabetes care; routines for delegation regarding diabetes treatment and care; and finally availability of care programmes for diabetes.
QUALITY AND EFFICIENCY OF DIABETES CARE IN SWEDEN NATIONAL BOARD OF HEALTH AND WELFARE
43

Further Analysis
Education, further training and competence The survey sought to map if municipalities had nurses with further university education in diabetes care (worth 15 academic credits or more), and if auxil-iary nurses had further training in diabetes care. Such training could be pro-vided by a university or some other training institute.
Approximately 40% of municipalities offered training and continuing edu-cation in diabetes care to their staff. Municipal care and treatment pro-grammes did stress that staff need greater expertise in diabetes care. Howev-er, the proportion of nurses with special expertise in diabetes care varied between municipalities, and between different types of residential care facili-ties in the same municipality. The same applied to auxiliary nurses with ex-pertise in diabetes care. Nationally, around 40% of municipal regular care facilities had no nurse with special competence in diabetes care employed. For permanent special housing the figure was around 50% and in short term accommodation it was close to 70%. In addition, in 70% of municipalities auxiliary nurses had no further training in diabetes care.
Routines for delegation Almost all municipalities, 90 %, had written routines for delegation of diabe-tes care. Of the ones with written routines for delegation, 86 % also carried out knowledge tests before delegation. Some of these municipalities under-took the knowledge tests seldom (13 %) and some of them never tested staff knowledge before delegating a task (11 %). Hence, there were municipalities that did not have written procedures for delegation of diabetes care and did not carry out knowledge tests before delegation.
Many of the Lex Maria cases (self-reporting of incidences) reported by the municipal home-based curative health care services concern mistakes made with drugs and dosages of insulin. The National Board of Health and Welfare has also previously found that routines for delegation were not monitored as should be [12]. The Board therefore emphasises the importance of written procedures for delegation and test of staff knowledge prior to delegation specifically for medical task, such as insulin injections.
Care programmes Only about one-third of the municipalities had specific care programmes for diabetes. Most of these programmes were developed during the years 2008 to 2011, but some municipalities had diabetes care programmes from the early 2000’s. A few (6%) of the municipalities were in the process of developing diabetes care programmes. The diabetes care programmes that were in place were based in the National Guidelines of 1999 or of 2010 or other evidence-based recommendations.
Clearly, not all municipalities had diabetes care programmes in place, and many of them had not been updated recently. Such programmes are important as they can be used to design structured individual treatment plans in collaboration with the relevant physician. Such a treatment plan should contain specific treatment goals, a clear division of tasks between different health care providers, as well as procedures for how often and when the treatment plan will be reviewed.
44 QUALITY AND EFFICIENCY OF DIABETES CARE IN SWEDEN NATIONAL BOARD OF HEALTH AND WELFARE

Further Analysis
Pharmaceutical treatment The National Board of Health and Welfare has analysed diabetes related drug usage with data from the Prescribed Drug Register for the period 2007-2010. The Board found changes in drug use patterns for persons with diabetes as well as in the use of test strips to measure blood sugar, which in many ways is consistent with the recommendations in the National Guidelines for Diabe-tes Care 2010 [1]. These were the key findings:
• In 2010, an additional 43,000 persons took out prescribed oral treatments to control blood sugar levels from pharmacies as compared with 2007 – an increase from 329,000 to 372,000 people.
The proportion of persons who from pharmacies took out at least one •batch of insulin, blood sugar lowering medications or GLP 1 analogues increased from 3.6 % in 2007 to 4 % in 2010. The increased use of medication may be explained by earlier detection of diabetes and the use of intensive therapy, which is in line with the Guidelines. Another explanation could be that the number of persons diagnosed with diabetes increased.
Among persons with diabetes, the use of anti-hypertensive treatment •increased by 3-5%, however the average cost per treated person decreased as a result of lower prices for these drugs. According to the National Diabetes Register (NDR) blood pressure levels among people with diabetes decreased during the same period.
Among persons with diabetes on lipid-lowering treatment, drug •usage increased by 12-15%. However the average cost per person treated decreased as a result of reduced drug prices. This is in line with the Guideline recommendation on prescription of primarily generic drugs.
Total cost of diabetes drugs increased by 16% from SEK 1,097 •million to SEK 1,275 million. The total volume sold via pharmacies increased by 14% from 151 million to 172 million defined daily doses.
The average annual cost per person for diabetes medication increased •by 2% from SEK 3,330 to SEK 3,408.
For persons with Type 2 diabetes, the Guidelines recommend first-line treat-ment with Metformin, as a second choice insulin or sulphonylureas and as a third choice other oral anti-diabetic drugs and GLP 1 analogues. For persons with Type 2 diabetes, the analysis showed the following:
Metformin was by far the most common drug among blood sugar •reducing medications apart from insulin (ATC code A10B). Metformin comprised 73% of the total number of defined daily doses in 2010. However there were significant differences between county councils. Possible explanations for the variations could be different
QUALITY AND EFFICIENCY OF DIABETES CARE IN SWEDEN NATIONAL BOARD OF HEALTH AND WELFARE
45
Further Analysis
levels of treatment and the tendency to transfer to second choice treatments.
During the period 2007-2010 the use of test strips by persons with •only non-pharmaceutical treatment for diabetes decreased as well as among people on blood sugar lowering drugs and GLP 1 analogues in 2010, which is in line with the recommendation in the Guidelines. Persons using insulin treatment, however, used more test strips, which is also in line with Guidelines.
The Annual Report 2010 published by the National Diabetes Register [9] showed that a significant proportion of persons with type 2 diabetes treated in the primary care services did not reach their blood sugar target levels. The National Board of Health and Welfare has therefore analysed the pharmaceu-tical usage in 2008-2010 for the persons who, according to the National Dia-betes Register, had HbA1c levels higher than 63 mmol/mol in 2008. This analysis showed the following:
Of those who did not achieve the desired blood sugar level with the •first hand choice medication (Metformin), 40% moved on to second or third line medication within a year. After two years, half of the patients had changed their drug treatment. The pattern was similar in the 30-64 and 65-79 age groups. These results indicated that diabetes care in general aims for better control of blood sugar levels.
Patient reported outcome (F01, F02, F03, F04) The National Diabetes Register (NDR) has undertaken some developmental work related to Patient Related Outcome Measures (PROMs) concerning patient perception of the quality of diabetes care, perception of self-care abil-ity, perception of diabetes as an obstacle in daily life and perception of safety while living with diabetes. Two pilot studies have been undertaken. Data was collected via questionnaires. The first questionnaire was sent to 4,743 per-sons with diabetes of whom 1,178 had Type 1 diabetes. These persons were treated in 36 different hospitals and health care providers in the Middle and Southern Sweden. The response rate was 64 percent. The second question-naire was sent to 9,607 patients with Type 2 diabetes who were treated in 43 different primary health care units in one county council. The response rate was 51%. Patients’ responses were compiled into an index based on Item Response Theory (IRT). Finally an overall Diabetes Capability Index (DCI) was created. The DCI included three outcome variables (HbA1c, blood pres-sure and lipid levels) and two variables measuring perceived quality of diabe-tes care (Indicator F01), as well as the above mentioned patient reported out-come measures; self-care ability (Indicator F02), diabetes as an obstacle in daily life (Indicator F03) and safety (Indicator F04). The DCI was adjusted or the patient’s gender, age, age of first diabetes symptoms and duration of ill-ness.
46 QUALITY AND EFFICIENCY OF DIABETES CARE IN SWEDEN NATIONAL BOARD OF HEALTH AND WELFARE

Further Analysis
The survey showed that most persons with Type 1 and Type 2 diabetes were satisfied or very satisfied with the diabetes care. However, many, especially people with Type 1 diabetes, perceived diabetes as a constraint in their daily life. They were also less satisfied with diabetes self-care and they worried about the future, especially about low blood sugar levels and developing diabetes complications. Slightly more persons with Type 1 diabetes perceived that they had sufficient knowledge to manage the disease. Persons with Type 2 diabetes were more often satisfied with their self-care, but this might have been because persons with Type 1 diabetes usually require considerably more advanced self-care.
Research has indicated that depression is up to twice as common in persons with Type 1 diabetes than in others. Consequently, in future surveys questions regarding depression should be considered. There is also a need for more studies on how the results can be used to provide the most benefit for patients and in order to suggest appropriate interventions. This preliminary report on PROMs clearly showed the need for a disease-specific instrument to capture health-related quality of life among people with diabetes.
QUALITY AND EFFICIENCY OF DIABETES CARE IN SWEDEN NATIONAL BOARD OF HEALTH AND WELFARE
47

References
References
1. Nationala riktlinjer för diabetes vård 2010 – Stöd för styrning och ledning. Stockholm: Socialstyrelsen/National Board of Health and Welfare, 2010.
2. Open Comparison and Assessment 2009 – Cardiac Care. Stockholm: Socialstyrelsen/National Board of Health and Welfare, 2010.
3. National Performance Assessment 2011 – Quality and Efficiency of Stroke Care in Sweden: Stockholm: Socialstyrelsen/National Board of Health and Welfare, 2013.
4. Folkhälsorapport 2009. Stockholm: Socialstyrelsen/National Board of Health and Welfare, 2009.
5. Nationala riktlinjer för sjukdomsförebyggande metoder 2011 – Stöd för styrning och ledning. Stockholm: Socialstyrelsen/ National Board of Health and Welfare, 2011.
6. Agardh, C-D, Berne C (red), Diabetes. Stockholm: Liber förlag, 2010.
7. Dödsorsaker 2010. Stockholm: Socialstyrelsen/National Board of Health and Welfare, 2011.
8. International Diabetes Federation. IDF Diabetes Atlas. Downloaded October 7, 2011: http://www.idf.org/diabetesatlas/downloads.
9. Nationella Diabetes Registret. Årsrapport , 2010 års resultat. Göte-borg: Nationella Diabetes Registret, 2011. Accessed 2011-09-21: https://www.ndr.pdf/arsrapport NDR 2011.pdf.
10. Tillgång på specialistläkare 2008. Stockholm: Socialstyrel-sen/National Board of Health and Welfare, 2008.
11. Nationella riktlinjer för hjärtsjukvården 2008 – Beslutsstöd för priori-teringar. Stockholm: Socialstyrelsen/ National Board of Health and Welfare, 2008.
12. Nationella riktlinjer för sjukdomsförebyggande metoder 2011 – Stöd för styrning och ledning. Stockholm: Socialstyrelsen/ National Board of Health and Welfare, 2011.
13. Tillsynsrapport 2011. Hälso- och sjukvård och socialtjänst. Stock-holm: Socialstyrelsen/National Board of Health and Welfare, 2011.
48 QUALITY AND EFFICIENCY OF DIABETES CARE IN SWEDEN NATIONAL BOARD OF HEALTH AND WELFARE

Annex 1: Project Organisation
Annex 1: Project Organisation
Steering Committee Marie Lawrence Head of Unit, Unit for Performance Assessment Mona Heurgren Head of Unit, Unit for Efficiency and Quality
Studies Lena Weilandt Head of Unit, Unit for National Guidelines
Project Management Team Christina Broman Project Manager Tony Holm External consultant, guidelines expert Caroline Lööf Researcher
Working Group National Board of Health and Welfare Cecilia Dahlgren Researcher Mikael Fabel Communication officer Max Köster Statistician Tsega Muzollo Statistician
Expert support Christian Berne Professor, Senior Physician Soffia Gudbjörnsdottir Associate Professor, National Diabetes Register Stefan Jansson General Practitioner Unn-Britt Johansson Associate Professor, Registered Nurse Janeth Leksell Lecturer, qualified nurse Katarina Steen Carlsson PhD, research associate health economics
Other participants National Board of Health and Welfare Eva Fröberg Researcher/questionnaire construction Karin Gottvall Researcher Lena Janzon Statistician Andrejs Leimanis Researcher Marie Linder Statistician Björn Nilsson Researcher Lennart Ringstrom Researcher/questionnaire construction Filippa Svensson Production manager Lisbeth Serden Researcher Kerstin Westergren Statistician
QUALITY AND EFFICIENCY OF DIABETES CARE IN SWEDEN NATIONAL BOARD OF HEALTH AND WELFARE
49

Annex 1: Project Organisation
Other Örjan Sandgren Production of figures, EDITA Health Care Qual-
ity Registers Soffia Gudbjornsdottir Registrar of National Diabetes Register, NDR K-G Prütz Registrar of Swedish Renal Register, SNR Ann-Marie Svensson National Diabetes Register, NDR
50 QUALITY AND EFFICIENCY OF DIABETES CARE IN SWEDEN NATIONAL BOARD OF HEALTH AND WELFARE

Annex 2: Methodology
Annex 2: Methodology
In order to assess the quality and efficiency of diabetes care in Sweden, the National Board of Health and Welfare has openly compared the structures, processes and outcome of care provided by county councils and hospitals. The Board also openly compared municipal structures for diabetes care. Data was collected from national registers and via questionnaires.
Data Sources – national registers and health care quality registers Data sources included national registers administered by the National Board of Health and Welfare including the Patient Register, the Cause of Death Register, the Prescribed Drug Register, the Medical Birth Register, as well as two national health care quality registers, namely the National Diabetes Reg-ister (NDR) and the Swedish Renal Registry (SRR).
Hospitals and county councils are by law obliged to report data to national registers, but can choose to report data to health care quality registers, and patients can decline to have their data registered. However, health care quality registers have the ambition to comprehensively cover all care and all patients within their respective areas.
The National Patient Register covers approximately 1.5 million in-patient cases and nearly 10 million out-patient hospital visits (not primary health care visit) annually. As all in-patient case (primary diagnosis, secondary diagnosis and interventions) are registered using ICD-codes co-morbidities can also be studied. When this assessment was undertaken, the National Patient Register contained data until the end of 2009.
The Cause of Death Register contains data on persons who were registered in Sweden at the time of death. When this assessment was undertaken the Cause of Death Register contained data from the years 1961 to 2009. Every year all deaths are registered in the register. Between 90,000 and 95,000 deaths are registered yearly. In 2009, 1.2%of the persons who died did not have a death certificate. Hence their cause of death was unknown. Diabetes is the most common cause of death with the group endocrine diseases.
The Prescribed Drug Register includes all pharmaceuticals that have been prescribed and that have been sold via pharmacy. Data is updated every month. Every year approximately 90 million drugs are sold and registered. Pharmaceuticals used in in-patient care and drugs sold without prescriptions are not included in the register. The Prescribed Drug Register does not include any diagnosis, therefore the cause for using a particular drug treatment is not known.
The Medical Birth Register started in 1973 and contains data on pregnancies, births and new born babies, reported by antenatal clinics and maternity wards. Data include information on previous pregnancies, name of
QUALITY AND EFFICIENCY OF DIABETES CARE IN SWEDEN NATIONAL BOARD OF HEALTH AND WELFARE
51
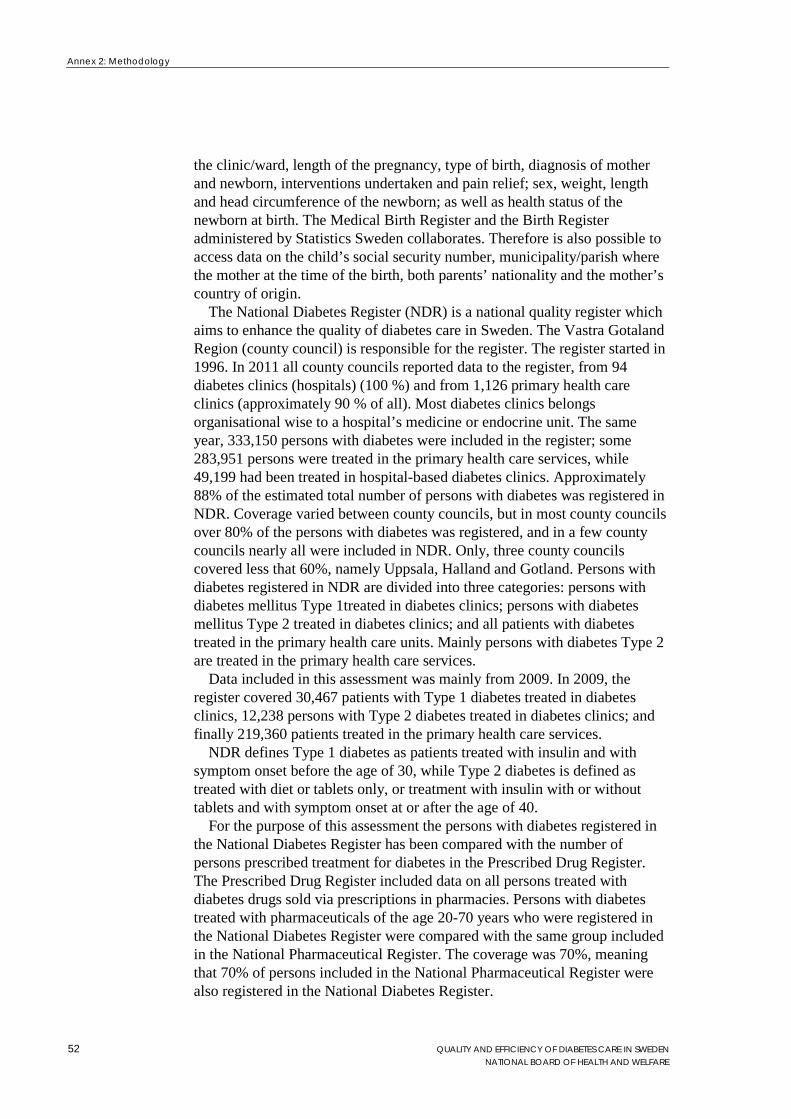
Annex 2: Methodology
the clinic/ward, length of the pregnancy, type of birth, diagnosis of mother and newborn, interventions undertaken and pain relief; sex, weight, length and head circumference of the newborn; as well as health status of the newborn at birth. The Medical Birth Register and the Birth Register administered by Statistics Sweden collaborates. Therefore is also possible to access data on the child’s social security number, municipality/parish where the mother at the time of the birth, both parents’ nationality and the mother’s country of origin.
The National Diabetes Register (NDR) is a national quality register which aims to enhance the quality of diabetes care in Sweden. The Vastra Gotaland Region (county council) is responsible for the register. The register started in 1996. In 2011 all county councils reported data to the register, from 94 diabetes clinics (hospitals) (100 %) and from 1,126 primary health care clinics (approximately 90 % of all). Most diabetes clinics belongs organisational wise to a hospital’s medicine or endocrine unit. The same year, 333,150 persons with diabetes were included in the register; some 283,951 persons were treated in the primary health care services, while 49,199 had been treated in hospital-based diabetes clinics. Approximately 88% of the estimated total number of persons with diabetes was registered in NDR. Coverage varied between county councils, but in most county councils over 80% of the persons with diabetes was registered, and in a few county councils nearly all were included in NDR. Only, three county councils covered less that 60%, namely Uppsala, Halland and Gotland. Persons with diabetes registered in NDR are divided into three categories: persons with diabetes mellitus Type 1treated in diabetes clinics; persons with diabetes mellitus Type 2 treated in diabetes clinics; and all patients with diabetes treated in the primary health care units. Mainly persons with diabetes Type 2 are treated in the primary health care services.
Data included in this assessment was mainly from 2009. In 2009, the register covered 30,467 patients with Type 1 diabetes treated in diabetes clinics, 12,238 persons with Type 2 diabetes treated in diabetes clinics; and finally 219,360 patients treated in the primary health care services.
NDR defines Type 1 diabetes as patients treated with insulin and with symptom onset before the age of 30, while Type 2 diabetes is defined as treated with diet or tablets only, or treatment with insulin with or without tablets and with symptom onset at or after the age of 40.
For the purpose of this assessment the persons with diabetes registered in the National Diabetes Register has been compared with the number of persons prescribed treatment for diabetes in the Prescribed Drug Register. The Prescribed Drug Register included data on all persons treated with diabetes drugs sold via prescriptions in pharmacies. Persons with diabetes treated with pharmaceuticals of the age 20-70 years who were registered in the National Diabetes Register were compared with the same group included in the National Pharmaceutical Register. The coverage was 70%, meaning that 70% of persons included in the National Pharmaceutical Register were also registered in the National Diabetes Register.
52 QUALITY AND EFFICIENCY OF DIABETES CARE IN SWEDEN NATIONAL BOARD OF HEALTH AND WELFARE

Annex 2: Methodology
The Swedish Renal Register (SRR) started in January 2007 when several registers decided to start a joint register. The register is administered by Swedish Nephrology Association and Swedish Transplant Association. Patients with chronic renal insufficiency are included in the register. The register aims to ensure that treatment guidelines are complied with. In 2009, 390 kidney transplants were registered in SRR, while only 376 were included in the National Patient Register. The comparison of data entered in both registers showed that 373 of these operations were registered in both registers (hence 94.9%). Consequently, 373 operations were performed, and the coverage for the National Patient Register was 96%, while that of the Swedish Renal Register was 99%.
Data entered into the above mentioned registers are based on a Unique Patient Identifier (UPI), the social security number which all residents of Sweden have. The UPI makes it possible to co-run data from different registers over time.
Data analysis In order to eliminate differences in results caused by differences in ages, data has (when indicated in the diagrams) been standardised for age. The National Diabetes Register population of 2010 was used as standard population. For standardisation among the general population, the average population of 2000 was used as standard population. For estimations of incidence and prevalence among persons treated with diabetes drugs, the standard population of 2010 was used.
Data sources – questionnaire Data was also collected via questionnaires. One questionnaire was sent to diabetes clinics in hospitals and in primary health care units, and one was sent to Chief Community Nurses in municipalities. Both questionnaires were sent via email to the respondents.
During the spring of 2011, the National Board of Health and Welfare undertook a survey of diabetes clinics in hospitals and primary health care units. The questionnaire was sent to 92 diabetes clinics, 81 responded (88 %). Within the primary health care services, 600 health units were randomly selected to be included in the survey. The response rate was 42% (253 of 600).The aim of the survey was to map the structure of diabetes care in terms of organisational aspects, available competences and other specific aspects related to the National Guidelines.
During the spring of 2011, a questionnaire was sent to all municipalities, 321 in total. The response rate was 66% (212 out of 321). The questionnaires were answered by the Chief Community Nurse in each municipality. The Chief Community Nurse is responsible for the health care services in the municipality. The objective with this survey was to map the structures for diabetes care in the municipalities. More specifically the following areas were covered in the questionnaire: staff competence and further training
QUALITY AND EFFICIENCY OF DIABETES CARE IN SWEDEN NATIONAL BOARD OF HEALTH AND WELFARE
53

Annex 2: Methodology
regarding diabetes care; routines for delegation regarding diabetes treatment and care; and finally availability of care programmes for diabetes.
54 QUALITY AND EFFICIENCY OF DIABETES CARE IN SWEDEN NATIONAL BOARD OF HEALTH AND WELFARE

Annex 3: List of Process and Outcome Indicators
Annex 3: List of Process and Outcome Indicators
Indicator A Outcome of diabetes care A1 Cardio-vascular mortality A2 Amputation above the ankle A3 Diabetic patients with end stage renal failure (renal
insufficiency) A4 Intrauterine foetal death and neonatal mortality A5 Severe congenital malformation and chromosomal
abnormalities A6 Presence of diabetic retinopathy B Effectiveness B1 HbA1c-target < 52 mmol/mol B2 HbA1c > 73 mmol/mol B3 Blood pressure target < 130/80 mm Hg B4 Blood pressure > 140/90 mm Hg B5 LDL cholesterol target < 2.5 mmol/l B6 Presence of macroalbuminuria C Treatment C1 Foot examination C2 Retinopathy screening C3 Screening for urinary albumin excretion C4 Treatment with metformin D Lifestyle D1 Physical activity D2 Non-smokers among persons with diabetes E Avoidable hospitalisation E1 Avoidable hospital admissions F* Diabetes care structures F1 Trained diabetes nurse F2a Group-based patient education F2b Culturally-adapted patient education F0* Patient reported outcome F01 Perceived quality of diabetes care F02 Perceived self-care ability F03 Perception of diabetes as an obstacle in life F04 Perceived feeling of safety
QUALITY AND EFFICIENCY OF DIABETES CARE IN SWEDEN NATIONAL BOARD OF HEALTH AND WELFARE
55

Annex 4: Graphical presentation
Annex 4: Graphical Presentations
0100200300400500600700800900
1 000
200920082007 Year Women Men Total
Source: Cause of Death Register and Prescribed Drug Register
Figure A1, SWEDEN Death due to cardio-vascular diseases among persons with diabetes treated with pharmaceutials, per 100,000 persons treated for diabetes. Age-standardised data.
Per 100 000 persons
0
50
100
150
200
250
300
350
400
2010200920082007 Year
Source: Patient Register and Prescribed Drug Register
Figure A2, SWEDEN Number of amputations above the ankle per 100,000 persons with diabetes treated with pharmaceuticals in the ages 40 yars and older. Age-standardised data.
Per 100 000 persons
56 QUALITY AND EFFICIENCY OF DIABETES CARE IN SWEDEN NATIONAL BOARD OF HEALTH AND WELFARE

Annex 4: Graphical Presentation
020406080
100120140160180200
2010200920082007 Year
Women Men Total
Source: Swedish Renal Registry and Prescribed Drug Register
Figure A3, SWEDEN Number of first-time patients in uremia treatment per 100,000 persons with diabetes treated with pharmaceuticals (incidence). Age-standardised data.
Per 100 000 persons
0102030405060708090
100
20102009200820072006
Percent
Year
Type 1 diabetes, treated in diabetes clinics, hospitalsType 2 diabetes, treated in diabetes clinics, hospitalsType 2 diabetes, treated in primary health care services
Source: NDR – National Diabetes Register
Figure B1, SWEDEN Proportion of persons with diabetes with HbA1c < 52 mmol/mol who were treated in hospitals or primary health care services.
QUALITY AND EFFICIENCY OF DIABETES CARE IN SWEDEN NATIONAL BOARD OF HEALTH AND WELFARE
57

Annex 4: Graphical presentation
0102030405060708090
100
20102009200820072006
Percent
Year
Type 1 diabetes, treated in diabetes clinics, hospitalsType 2 diabetes, treated in diabetes clinics, hospitalsType 2 diabetes, treated in primary health care services
Source: NDR – National Diabetes Register
Figure B2, SWEDEN Proportion of persons with diabetes with HbA1c > 73mmol/mol who were treated in hospitals or in primary health care services.
0102030405060708090
100
20102009200820072006
Percent
Year
Type 1 diabetes, treated in diabetes clinics, hospitalsType 2 diabetes, treated in diabetes clinics, hospitalsType 2 diabetes, treated in primary health care services
Source: NDR – National Diabetes Register
Figure B3, SWEDEN Proportion of persons with diabetes who reached the blood pressure target < 130/80 mm Hg (persons treated in hospitals or in the primary health care services).
58 QUALITY AND EFFICIENCY OF DIABETES CARE IN SWEDEN NATIONAL BOARD OF HEALTH AND WELFARE

Annex 4: Graphical Presentation
0102030405060708090
100
20102009200820072006
Percent
Year
Type 1 diabetes, treated in diabetes clinics, hospitalsType 2 diabetes, treated in diabetes clinics, hospitalsType 2 diabetes, treated in primary health care services
Source: NDR – National Diabetes Register
Figure B5, SWEDEN Proportion of LDL cholesterol < 2.5 mmol/l among persons with diabetes treated in hospitals or in the primary health care services.
0102030405060708090
100
20102009200820072006
Percent
Year
Type 1 diabetes, treated in diabetes clinics, hospitalsType 2 diabetes, treated in diabetes clinics, hospitalsType 2 diabetes, treated in primary health care services
Source: NDR – National Diabetes Register
Figure B6, SWEDEN Proportion of persons with diabetes without macroalbuminuria (u-albuminuria < 200 ug/min) (persons treated in hospitals or in the primary health care services).
QUALITY AND EFFICIENCY OF DIABETES CARE IN SWEDEN NATIONAL BOARD OF HEALTH AND WELFARE
59
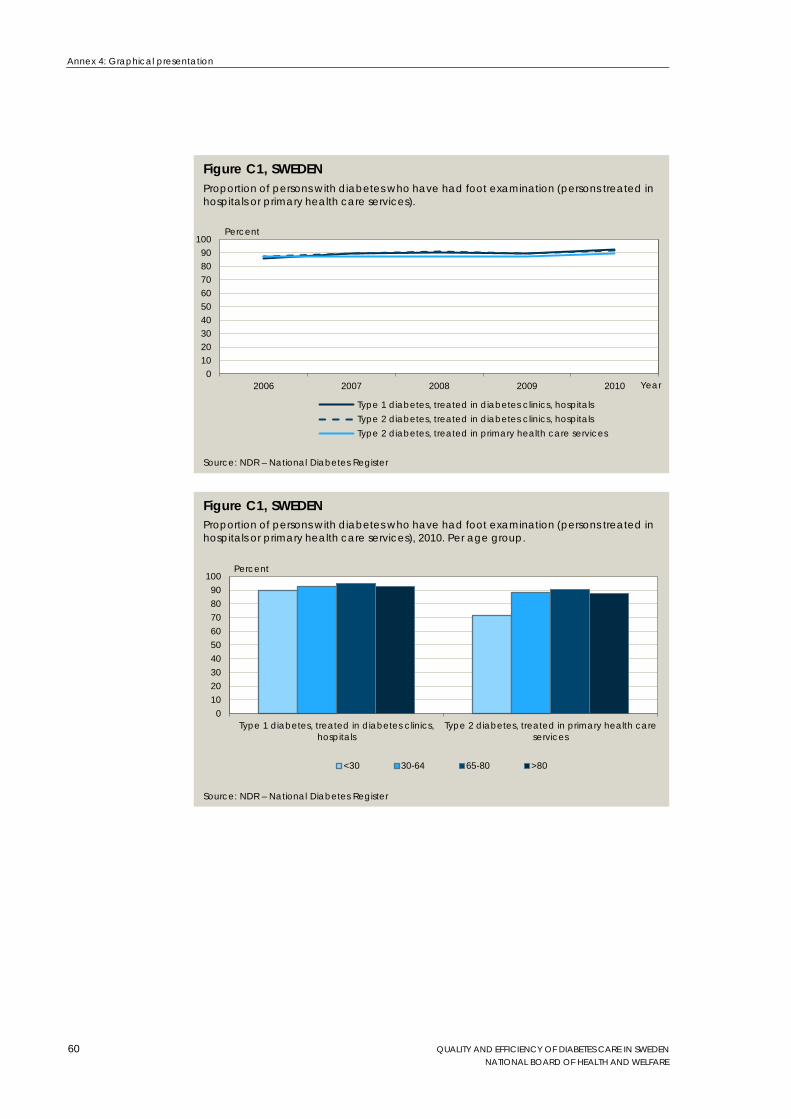
Annex 4: Graphical presentation
0102030405060708090
100
20102009200820072006
Percent
Year
Type 1 diabetes, treated in diabetes clinics, hospitalsType 2 diabetes, treated in diabetes clinics, hospitalsType 2 diabetes, treated in primary health care services
Source: NDR – National Diabetes Register
Figure C1, SWEDEN Proportion of persons with diabetes who have had foot examination (persons treated in hospitals or primary health care services).
0102030405060708090
100
Type 1 diabetes, treated in diabetes clinics,hospitals
Type 2 diabetes, treated in primary health careservices
Percent
<30 30-64 65-80 >80
Source: NDR – National Diabetes Register
Figure C1, SWEDEN Proportion of persons with diabetes who have had foot examination (persons treated in hospitals or primary health care services), 2010. Per age group.
60 QUALITY AND EFFICIENCY OF DIABETES CARE IN SWEDEN NATIONAL BOARD OF HEALTH AND WELFARE

Annex 4: Graphical Presentation
0 20 40 60 80 100
Vastra GotalandOrebro
DalarnaUppsala
VastmanlandSWEDEN
KalmarStockholmSormland
VasternorrlandGavleborg
VasterbottenVarmland
SkaneJonkoping
HallandNorrbotten
JamtlandOstergotland
BlekingeKronoberg
Gotland
Percent
Figure C1, County council
Source: NDR – National Diabetes Register
100 100 99 99 98 98 98 97 96 96 96 95 95 94 93 92 92 92 91 86 85 85
Proportion of persons with type 1 diabetes who have had foot examination (persons treated in hospitals), 2010.
0 20 40 60 80 100
Vastra GotalandVasterbotten
DalarnaUppsala
VastmanlandSWEDEN
OstergotlandOrebroKalmarSkane
GavleborgHalland
JamtlandStockholm
BlekingeJonkoping
VasternorrlandVarmland
NorrbottenSormlandGotland
Kronoberg
Percent
Figure C1, County council
Source: NDR – National Diabetes Register
100 97 96 96 95 95 95 94 94 94 92 91 91 91 90 90 89 89 87 85 85 77
Proportion of persons with diabetes who have had foot examination (persons treated in primary health care services), 2010.
QUALITY AND EFFICIENCY OF DIABETES CARE IN SWEDEN NATIONAL BOARD OF HEALTH AND WELFARE
61

Annex 4: Graphical presentation
0102030405060708090
100
201020092008
Percent
Year
Type 1 diabetes, treated in diabetes clinics, hospitals. The past two years
Type 2 diabetes, treated in diabetes clinics, hospitals. The past three years
Type 2 diabetes, treated in primary health care services. The past three years
Source: NDR – National Diabetes Register
Figure C2, SWEDEN Proportion of persons with diabetes who have undergone retinopathy screening during the past two years for diabetes mellitus type 1 (in hospitals) and during the past three years if diabetes mellitus type 2 (in hospitals or primary health care services).
0102030405060708090
100
20102009200820072006
Percent
Year
Type 1 diabetes, treated in diabetes clinics, hospitalsType 2 diabetes, treated in diabetes clinics, hospitalsType 2 diabetes, treated in primary health care services
Source: NDR – National Diabetes Register
Figure C3, SWEDEN Proportion of persons with diabetes who have undergone screening for urinary albuminexcretion (in hospitals or in primary health care services).
62 QUALITY AND EFFICIENCY OF DIABETES CARE IN SWEDEN NATIONAL BOARD OF HEALTH AND WELFARE
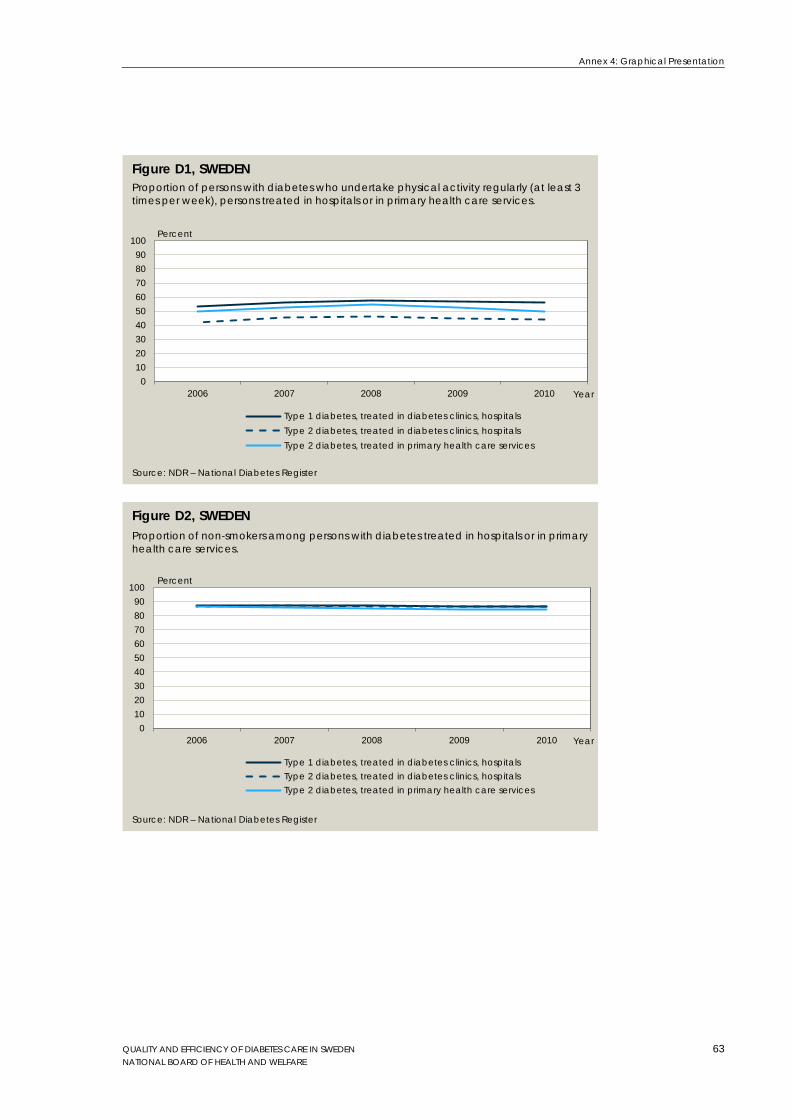
Annex 4: Graphical Presentation
0102030405060708090
100
20102009200820072006
Percent
Year
Type 1 diabetes, treated in diabetes clinics, hospitalsType 2 diabetes, treated in diabetes clinics, hospitalsType 2 diabetes, treated in primary health care services
Source: NDR – National Diabetes Register
Figure D1, SWEDEN Proportion of persons with diabetes who undertake physical activity regularly (at least 3 times per week), persons treated in hospitals or in primary health care services.
0102030405060708090
100
20102009200820072006
Percent
Year
Type 1 diabetes, treated in diabetes clinics, hospitalsType 2 diabetes, treated in diabetes clinics, hospitalsType 2 diabetes, treated in primary health care services
Source: NDR – National Diabetes Register
Figure D2, SWEDEN Proportion of non-smokers among persons with diabetes treated in hospitals or in primary health care services.
QUALITY AND EFFICIENCY OF DIABETES CARE IN SWEDEN NATIONAL BOARD OF HEALTH AND WELFARE
63

Annex 4: Graphical presentation
6 000
6 100
6 200
6 300
6 400
6 500
6 600
6 700
6 800
6 900
7 000
200920082007 Year
Women Men Total
Source: Patient Register and Prescribed Drug Register .
Figure E1. Avoidable hospital admissions Avoidable hospital admissions per 100,000 persons with diabetes treated with pharmaceuticals. Age standardised.
Per 100,000 persons
64 QUALITY AND EFFICIENCY OF DIABETES CARE IN SWEDEN NATIONAL BOARD OF HEALTH AND WELFARE