Embed Size (px)
Citation preview
1

2
Quality Assurance Project Plan Salem Sound Coastwatch Clean Beaches and Streams Program
Table of Contents
Section Subject Page Number 1 Title Page 1
2 Table of Contents 2
3 Distribution List 4
4 Project Organization 5
5 Problem Identification / Background 7
6 Project Goals & Objectives 10
7 Data Quality Objectives for Measurement Data 10
8 Training Requirements 12
9 Documentation and Records 12
10 Sampling Process Design 13
11 Sampling Methods Requirements 15
12 Sample Handling and Custody Requirements 16
13 Analytical Methods Requirements 17
14 Quality Control Requirements 18
15 Instruments 18
16 Supplies 18
17 Data Management 19
Data Acquisition and Verification 19
Data Usage and Reporting 19
19. References 20

3
Table of Contents (cont’d)
APPENDICES
Appendix A. Salem Sound Watershed Map Appendix B. Salem Sound Waterbody Classification Map Appendix C. MA Division of Marine Fisheries Shellfish Resource Areas Map Appendix D. Salem Sound Shoreline Survey and Source Identification (SSASI) Site List (1993) Appendix E. Clean Beaches and Streams Network Contact List Appendix F. Sample Beaches and Streams Report (Summer, 2004 and Summer, 2005) Appendix G. Salem Sound Coastwatch Volunteer Water Quality Training Materials Appendix H. Salem Sound Coastwatch Water Quality Monitoring Data Sheet Appendix I. Biomarine and US EPA Chain of Custody/Data Sheets Appendix J. Biomarine, Inc. QA/QC/SOP Manual, and DEP Certification Appendix K. EPA Laboratory QA/QC/SOP Manual/Guidelines Appendix L. Salem Sound Coastwatch Clean Beaches and Streams Brochure Appendix M. Signature page from original QAPP, May 2001 and revised QAPP May 2005
4
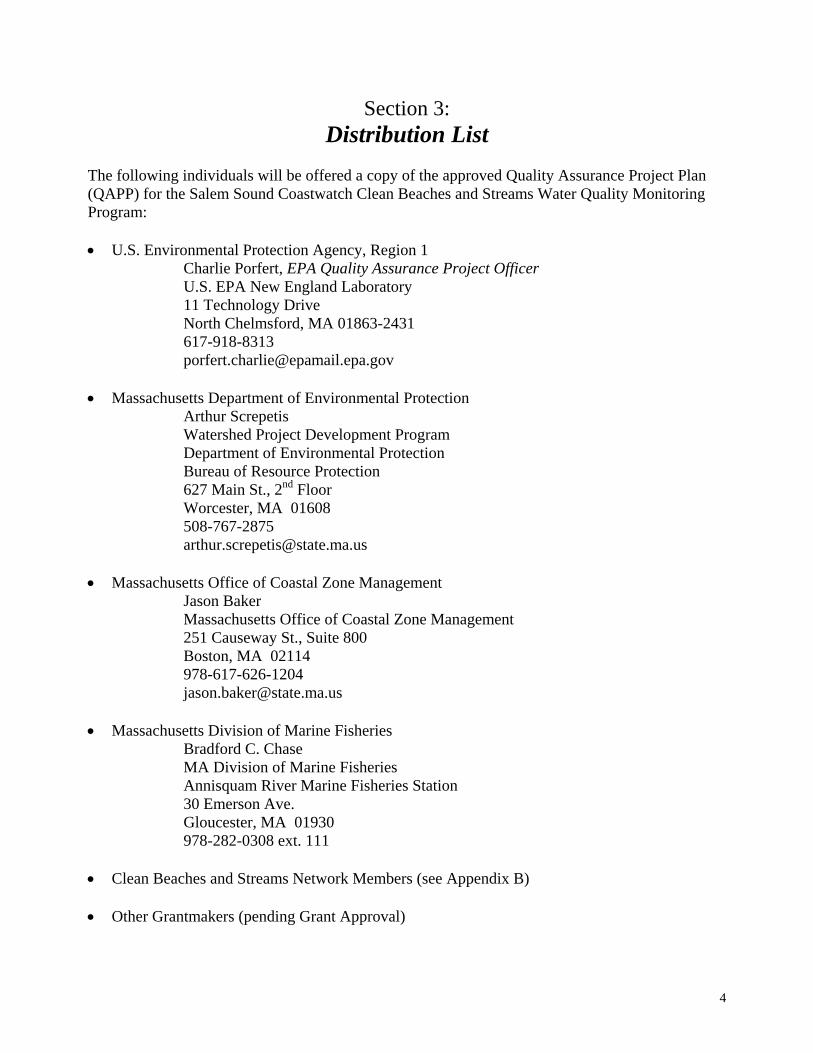
Section 3: Distribution List
The following individuals will be offered a copy of the approved Quality Assurance Project Plan (QAPP) for the Salem Sound Coastwatch Clean Beaches and Streams Water Quality Monitoring Program: • U.S. Environmental Protection Agency, Region 1
Charlie Porfert, EPA Quality Assurance Project Officer U.S. EPA New England Laboratory 11 Technology Drive North Chelmsford, MA 01863-2431 617-918-8313 [email protected]
• Massachusetts Department of Environmental Protection Arthur Screpetis Watershed Project Development Program Department of Environmental Protection Bureau of Resource Protection 627 Main St., 2nd Floor Worcester, MA 01608 508-767-2875 [email protected]
• Massachusetts Office of Coastal Zone Management Jason Baker Massachusetts Office of Coastal Zone Management 251 Causeway St., Suite 800 Boston, MA 02114 978-617-626-1204 [email protected]
• Massachusetts Division of Marine Fisheries
Bradford C. Chase MA Division of Marine Fisheries Annisquam River Marine Fisheries Station 30 Emerson Ave. Gloucester, MA 01930 978-282-0308 ext. 111
• Clean Beaches and Streams Network Members (see Appendix B) • Other Grantmakers (pending Grant Approval)

Section 4: Project Organization
The Clean Beaches and Streams Program (CB&SP) will collect and analyze water samples throughout the coastline of the Salem Sound Watershed following the programmatic goals of Salem Sound Coastwatch. The CB&SP includes a group of partners involved in the collection, sharing, and utilization of the information collected by this program. This group, known as the Clean Beaches and Streams Network (CB&SN), consists of citizens, students, volunteers, advisors, municipal officials, and state and federal agency staff throughout the region (Figure 4.1). The roles of each group are summarized in this section. Table 4.1: CB&SP Organizational Chart
Clean Beaches and Streams Program (CB&SP)
Project Advisors: (Jan P. Smith)
(Dr. Alan Young) Project Manager: (Barbara Warren)
Data Coordinator / QA Officer: (Susan Yochelson)
Samplers: SSCW Staff and Volunteers
Biomarine Laboratory*
EPA Region 1 Laboratory(Charlie Porfert, QA Officer;
Maureen Hliton, Microbiologist)
Data Sharing / Reporting
QAPP Review: DEP, Arthur Screpetis
Data Management: SSCW Staff
(Barbara Warren and Clean Beaches & Streams Network
Members)
Salem Sound Coastwatch (SSCW)
� Sampling Locations Salem Sound Coastwatch water quality monitoring program sampling locations are selected with three goals in mind:
• Investigation and tracking of pollution sources to shellfish beds, eelgrass beds, and other ecologically important nearshore habitats;
5

6
• Assessment of pollution sources to public swimming areas, popular recreational fishing areas, and other areas of particular recreational importance;
• Identification and characterization of municipal infrastructure in need of repair and assessment of areas of recent repair.
Additional considerations for sampling location selection include:
Quality and priority of the site resources (e.g. density of shellfish or use of a swimming beach); Historical and current water quality and flow data at a site; Additional observations at a site (e.g. BOH beach testing data and citizen and field
observations); and Safety and accessibility of the site.
Project Schedule Salem Sound Coastwatch will begin biweekly monitoring efforts each year in April/May and conduct them throughout the summer through September/October, provided grant funding for laboratory analysis and project coordination allow. On an ongoing basis, Salem Sound Coastwatch will review sampling data for contaminant sources to determine the need for new or additional sampling sites. In the spring of each year, SSCW will meet with members of the Clean Beaches and Streams Network to discuss sampling coordination and the upcoming sampling season. SSCW will conduct a volunteer training workshop in May each year and follow up in the following weeks as described in Section 8, Training Requirements.

7
Section 5 Problem Identification and Background
Organizational Background Salem Sound Coastwatch (SSCW) is a coastal watershed association that works cooperatively with citizens, local governments, businesses and non-profit organizations from the communities of Marblehead, Salem, Peabody, Danvers, Beverly and Manchester to enhance and protect the environmental quality of Salem Sound and its watershed. SSCW is dedicated to taking cooperative action to protect and enhance the environmental quality of Salem Sound with an emphasis on public health, coastal habitat, and commercial and recreational natural resources. Salem Sound Coastwatch began in 1990, under the name Salem Sound 2000, as a grassroots effort on the part of several citizens and businesses to raise the profile of Salem Sound as a natural, recreational and aesthetic resource in the region. From its early beginnings as an educational and water quality monitoring effort, SSCW has grown into a 501(c)(3) non-profit organization with hundreds of members and volunteers. SSCW also acts as one of the five local governance committees (LGCs) for the Massachusetts Bays National Estuary Program to implement the Comprehensive Conservation Management Plan (CCMP). Salem Sound Watershed Salem Sound is a coastal embayment that is surrounded by approximately 47 miles of coastline from Gale’s Point in Manchester to Marblehead Neck, MA. The watershed is located within the municipal boundaries of Marblehead, Salem, Peabody, Danvers, Beverly, and Manchester and is part of the larger North Coastal Basin (Figure 1). The Sound supports multiple uses including a large number of recreational boaters, over twenty waterfront parks and beaches, and commercial and recreational fishing. Shipbuilding and tanning were the prominent industries in the region from the 1700s to the 1960s and the watershed’s rivers were historically repositories for raw sewage and heavy metal tannery wastes. The passage of the Federal Clean Water Act (CWA) and the beginning of primary sewage treatment in 1979 followed by secondary sewage treatment in 1997 have improved water quality in the Sound dramatically. However, water quality in Salem Sound is still degraded and does not consistently meet State water quality standards. The waters of Salem Sound are classified as either SA or SB, depending on the proximity to the South Essex Sewerage District (SESD) wastewater outfall near Great Haste (Appendix B). The waters of Salem Harbor including those near the SESD outfall are class SB. Class SB waters “are designated as a habitat for fish, other aquatic life and wildlife and for primary and secondary contact recreation. In approved areas, they shall be suitable for shellfish harvesting with depuration (Restricted Shellfish Areas). These waters shall have consistently good aesthetic value” (314 CMR Section 4.05). The rest of Salem Sound including Manchester, Beverly and Salem harbors as well as the Bass, Crane, Porter, Waters, Forest and Danvers Rivers are class SA waters (Appendix B). Class SA waters “are designated as an excellent habitat for fish, other aquatic life and wildlife and for primary and secondary contact recreation. In approved areas they shall be suitable for shellfish harvesting without depuration (Open Shellfish Areas). These waters shall have excellent aesthetic value “(314 CMR Section 4.05). Salem Sound is not meeting any of the above designated uses. Shellfish beds in Salem Sound have remain closed for over 35 years due primarily to pathogen contamination from storm drain discharges, vessel discharges, and urban runoff (DWPC, 1992). Based on regional Board of Health beach testing data, several public bathing beaches regularly exceed the bathing beach standard of 104 CFU/100mL for Enterococcus and/or 200 CFU/100mL for fecal coliform. Still more sites exceed them, particularly after rain events. The

8
most recent published MA Department of Environmental Protection (DEP) assessment, “North Coastal Watershed 1997/1998 Water Quality Assessment Report”, finds that most of the segments assessed in the Salem Sound system do not support one or more designated uses including primary contact, shellfishing, and aesthetics (DEP, 2000). Sources of present day water quality impairment include numerous non-point sources related to the dense development of the watershed and point sources from two major permitted wastewater discharges to the Sound as well as other smaller discharges. One important source of non-point source pollution is stormwater that often includes the improper conveyance of raw sewage to the coast via area storm drain systems. This pollution is due in part to the aging and faulty infrastructure in this historic area. Over the last eleven years, SSCW’s volunteer water quality monitoring program has identified numerous problem drains that flow onto public bathing beaches posing potential health risks. Salem Sound Coastwatch is working with municipalities to try to remediate these sources through its Clean Beaches and Streams Program. Clean Beaches and Streams Program History Since 1993, one of SSCW’s flagship programs has been its volunteer water quality monitoring program. The general goals of SSCW’s on-going water quality monitoring program are to:
• Identify non-point pollution sources to Salem Sound; • Communicate this information to the appropriate municipal staff and officials; • Develop technically sound funding proposals for remediation efforts; • Collect baseline monitoring data and track improvements due to remediation efforts; • Provide meaningful avenues for citizen participation; and • Educate the general public about non-point source pollution.
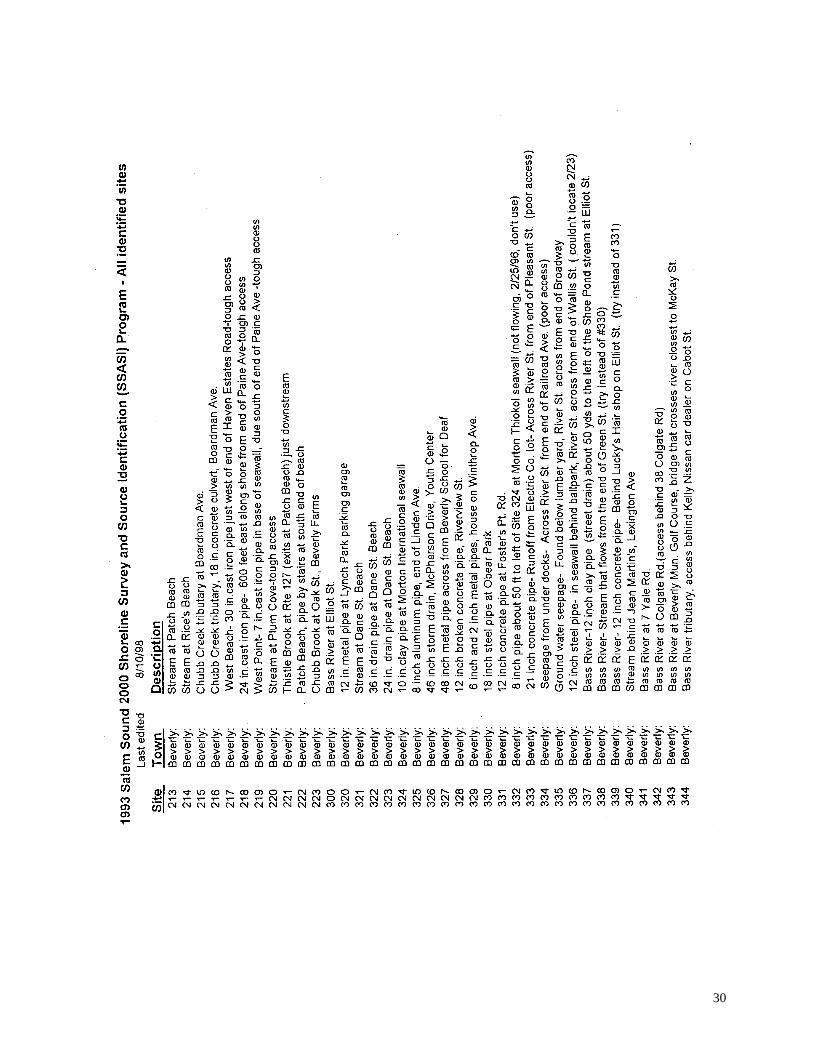
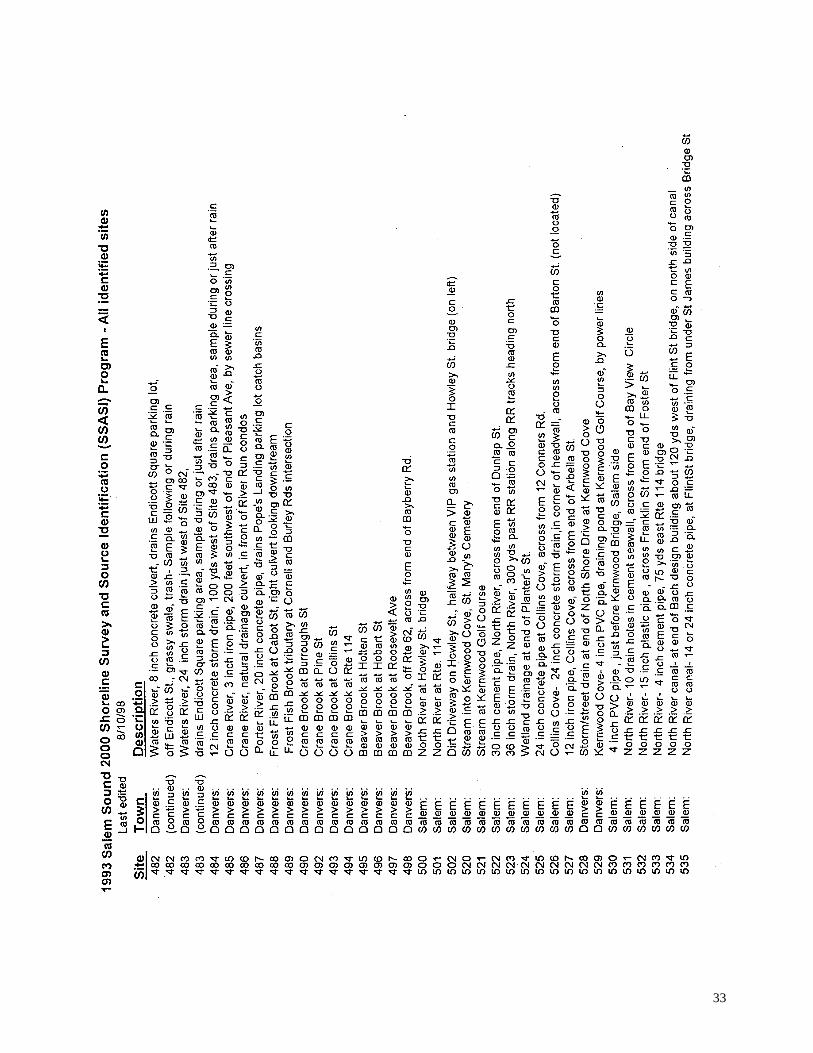
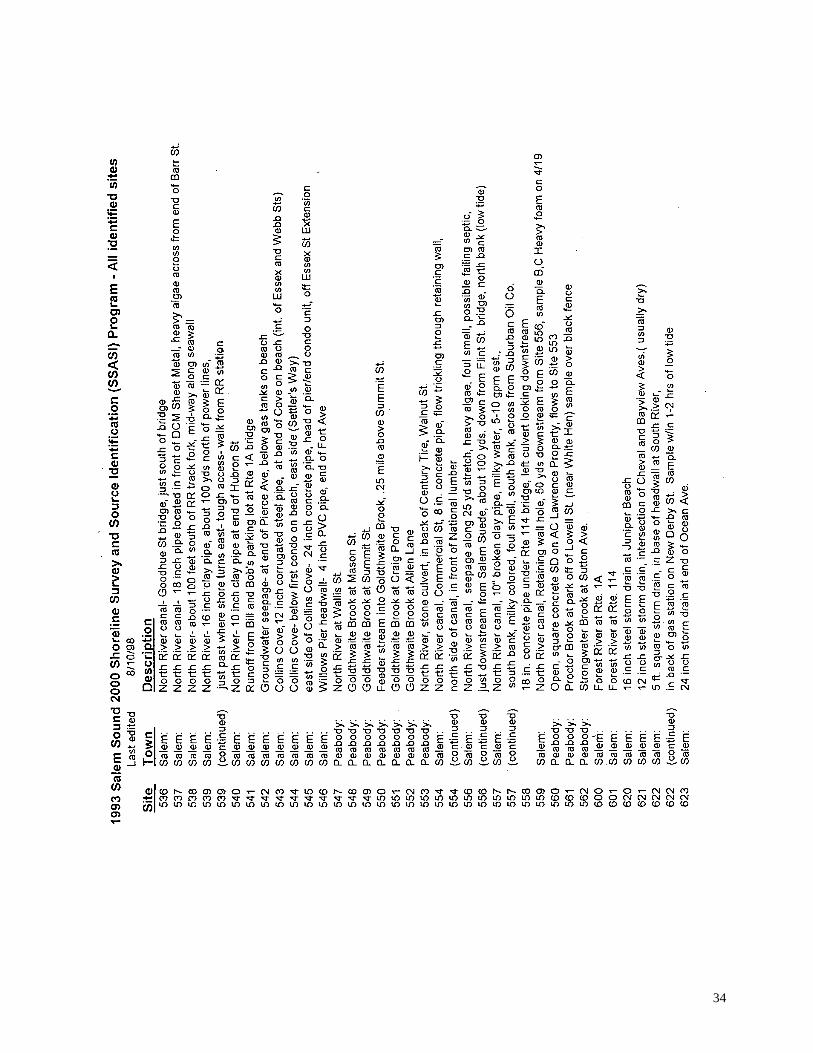
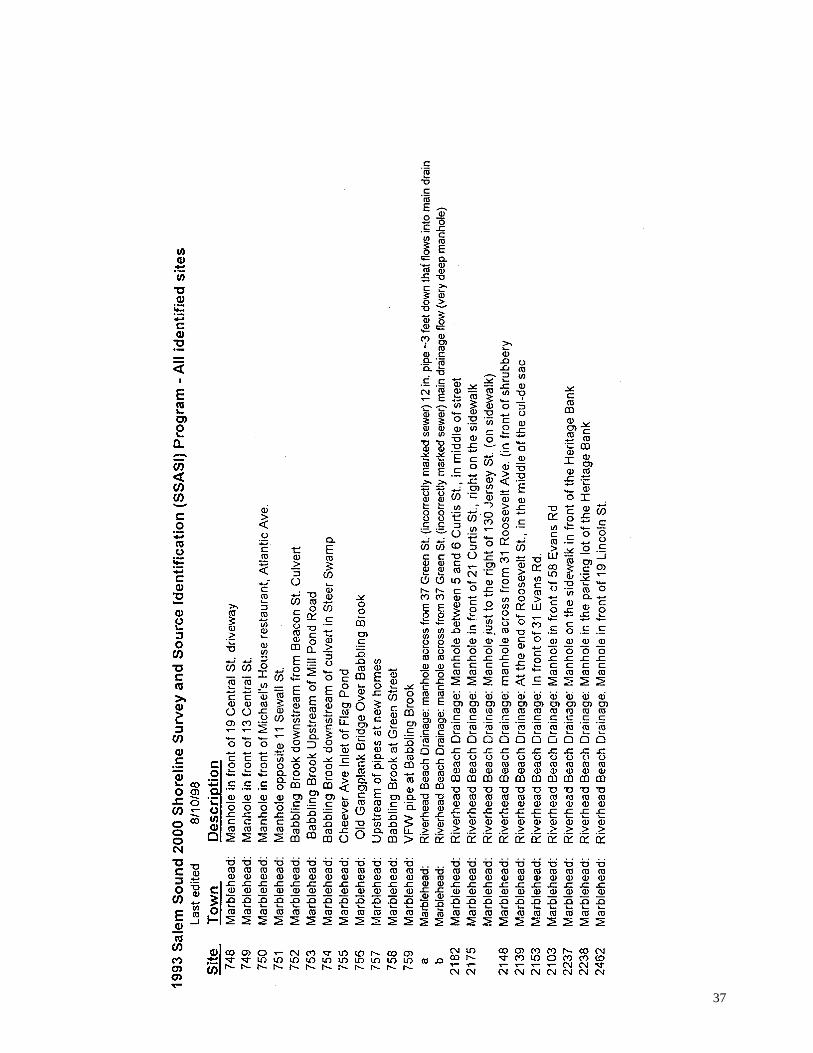
The SSCW water quality monitoring program began in 1993 with the Shoreline Survey and Source Identification (SSASI) program. The SSASI program kicked off with a citizen survey of the 47-mile shoreline of Salem Sound to identify sources of pathogen contamination conducted in the summer of 1993. The shoreline survey employed over 100 trained volunteers and recorded detailed information on all observed potential pollution sources to the Sound. Based on the shoreline survey, approximately 300 potential sources of water pollution were documented (Appendix D). Due to the highly urban character of the watershed and its very old and poorly maintained infrastructure, fecal coliform bacteria, an indicator of human and animal waste, was initially selected as the parameter of primary concern for the water quality monitoring program. Prior to 2003, fecal coliform remained the focal parameter within this sampling program
Following the SSASI program and prioritization of identified nonpoint sources, a citizen water quality monitoring program was established in 1993. Twenty-five trained volunteer monitors took as many as 30 samples weekly from roughly 100 sites for analysis of fecal coliform bacteria. Between September 1993 and July 1996, Salem Sound Coastwatch volunteers collected over 2,500 water samples that were analyzed for fecal coliform bacteria. To support this sampling effort and involve local educational institutions, SS2000 and Endicott College developed the Monitoring and Analysis Program (MAP) which included establishing a working bacteriological analysis laboratory for fecal coliform bacteria within the existing biological laboratory facilities at Endicott College in Beverly. Samples were also analyzed at the Massachusetts Division of Marine Fisheries (DMF) laboratory at Cat Cove and, later, at the Annisquam River lab in Gloucester as well as the South Essex Sewage District (SESD) laboratory in Salem. During the original SSASI program, data were used at the municipal level by Salem Sound area Boards of Health primarily for enforcement of local health codes by identifying unsafe swimming conditions, leaking or failing septic systems and illegal sewer tie-ins to municipal storm drain systems. The SSASI program

9
coordinator also worked closely with Salem Sound area Departments of Public Works (DPW) by identifying problem pathogen sources; providing technical contacts; and conducting upstream surveys of rivers and streams that consistently tested with elevated pathogen levels. Through meetings, data presentation, and active follow up work, the SSASI program was able to remediate numerous sources by working with these municipal departments, particularly in Danvers, Marblehead and Salem (e.g. Appendix A). Beginning in 1997 and building on the original SSASI work, the program began collecting flow data in addition to continuing to document dry weather fecal coliform contamination. Flow data were collected on several major Salem Sound tributaries including Sawmill Brook in Manchester and the North River in Salem/Peabody. Fecal coliform testing continued with an emphasis on remediation and documentation of sources to shellfish resource areas. Due to the more limited availability of laboratory analysis after the first few years of the program, fewer samples were collected on a biweekly basis and monitoring sites were prioritized based on the sensitivity of the receiving waterbody and/or the flow and concentration of the pathogen source. In 1999, SSCW launched a new program to better focus its monitoring effort on pollution sources of the greatest concern to the community and to better utilize its results to trigger local action, the Clean Beaches and Streams Program. The Clean Beaches and Streams Program initially focused primarily on public health risks posed by pollution sources at swimming beaches and, secondarily, on sources of pollution to shellfish resource areas. In 1999 and 2000, twenty-five of thirty-two selected sampling locations in these categories were targeted for sampling and analysis on a biweekly basis. In addition to fecal coliform bacteria, selected samples were also analyzed for Enterococcus due to the finding by several important scientific organizations, including the U.S. Environmental Protection Agency (US EPA), that the Enterococcus group is a better indicator of potential public health risk of waterborne disease than fecal coliform bacteria in marine waters. SSCW phased into a program that tested for Enterococcus levels, as it had increasingly become the standard employed by the US EPA, MA Department of Public Health, and other regulatory agencies as a microbial indicator of sewage pollution to determine the potential for public health risks through dispersal of pathogenic organisms. During these transition years, SSCW tested for both fecal coliform and Enterococcus levels in samples collected. Beginning in 2004, SSCW tested exclusively for Enterococcus. In June, 1999, SSCW also established the Clean Beaches and Streams Network (CB&SN), a regional network of local Departments of Public Works (DPW) and Boards of Health (BOH) staff, and other local managers to focus on these issues (Appendix E). A cooperative data exchange has taken place throughout the years since. SSCW distributes its monitoring data to the CB&SN on a biweekly basis and acquires the BOH beach water testing results either from the BOH or the State managed web-based repository for beach testing results. Using these data, SSCW compiles and distributes a Beaches and Streams Report on a biweekly basis in the summer to the CB&SN, local press contacts, and political officials, and posts the report on the SSCW web site (Appendix F). To date, several thousand (over 4,000) samples have been collected by trained volunteers and staff at sources around the Sound and analyzed for fecal coliform/Enterococcus bacteria. This monitoring program has succeeded in identifying and quantifying many of the major sources of fecal coliform/Enterococcus bacteria flowing into Salem Sound. SSCW has worked closely with regional municipalities to remediate raw sewage entering the Sound through the storm drain system. The City of Salem alone has remediated an estimated 70,000 gallons per day (gpd) of raw sewage flows since 1994. Through public education and media coverage, awareness of the public health risks associated with stormwater and improper sewage connections is growing. Yet, additional work is still needed as water quality remains degraded around Salem Sound due to pathogen pollution and other contaminants.
10
The Clean Beaches and Streams program water quality monitoring data have also been used by the Massachusetts Department of Environmental Protection (DEP) to target their pollution source monitoring in the Salem Sound region. Based on their data, DEP has issued notices of non-compliance (NON) to the cities of Beverly and Salem (Fall, 2000) for exceedences of the bacteria standard at several storm water outfall locations in proximity to bathing beach areas. Through the CB&SN, Salem Sound Coastwatch has worked with the municipalities, DEP, MA Office of Coastal Zone Management (CZM), Massachusetts Bays Program (MBP), and US) to provide monitoring assistance and grant support to remediate these sources.
Section 6
Project Goals & Objectives The primary objective of the Clean Beaches and Streams Program water quality monitoring is to identify sources of pathogen pollution to Salem Sound, particularly illicit sewage discharges and faulty sewer and stormwater systems, and promote their remediation. Some of the highest priority sites relate to potential public health risk. To this end, three areas of interest for this investigation are:
• Assessment and public notification of pollution sources to public swimming areas; • Investigation and tracking of pollution sources to shellfish beds; and • Confirmation of repairs in municipal infrastructure and investigation of areas needing repair.
The Clean Beaches and Streams Program also has other goals related to public education and outreach. Additional goals of the program include:
Training local water quality volunteers to educate them and encourage coastal stewardship; Educating local beachgoers about potential health risks and available water quality data; Increasing public awareness of water quality problems and citizens’ role in prevention ; Leveraging local, State, and Federal monies to remediate pollution sources; and Raising awareness of stormwater pollution and prevention strategies at the municipal level.
Section 7 Data Quality Objectives for Measurement Data
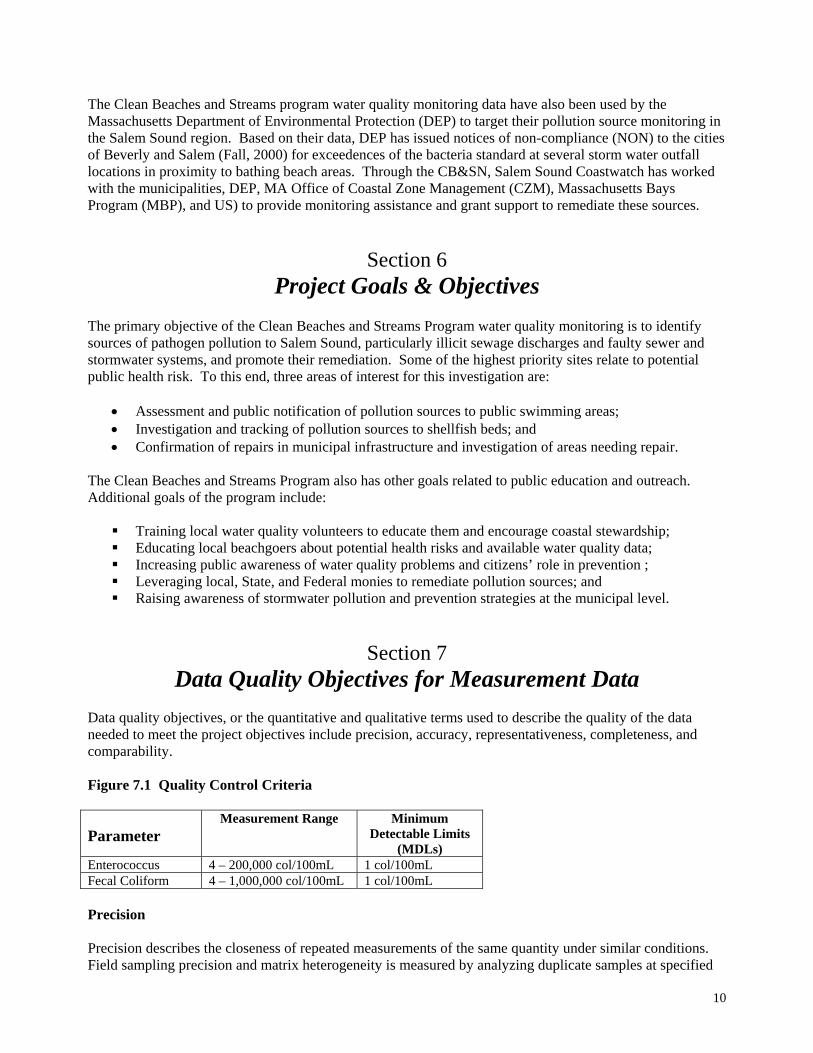
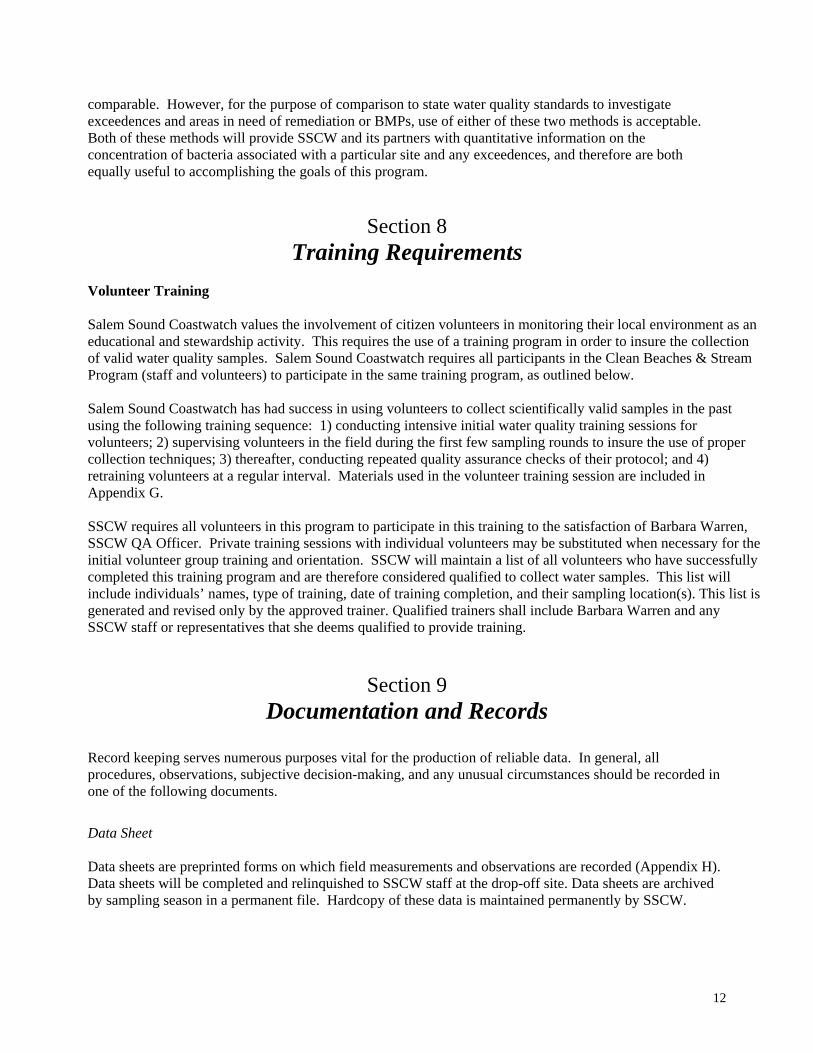
Data quality objectives, or the quantitative and qualitative terms used to describe the quality of the data needed to meet the project objectives include precision, accuracy, representativeness, completeness, and comparability. Figure 7.1 Quality Control Criteria
Parameter Measurement Range Minimum
Detectable Limits (MDLs)
Enterococcus 4 – 200,000 col/100mL 1 col/100mL Fecal Coliform 4 – 1,000,000 col/100mL 1 col/100mL Precision Precision describes the closeness of repeated measurements of the same quantity under similar conditions. Field sampling precision and matrix heterogeneity is measured by analyzing duplicate samples at specified

11
frequencies. An additional method exists for evaluating laboratory-specific precision. First, replicate sample preparations or analyses of reference samples indicate individual chemist or analyst precision. Typical measurements of precision include the percent difference for two data points and the standard deviation or relative percent standard deviation for more than two data points. The percent relative standard deviation (i.e., the coefficient of variation) normalizes the standard deviation as a percentage of the mean, which enables the application of quality control criteria and enhances the comparability of otherwise disparate standard deviation measurements. For each parameter analyzed, the QA objectives for precision have been determined from: 1) published historical data; 2) method validation studies; 3) laboratory experience with similar samples; and/or 4) project-specific requirements, such as those stipulated in the approved methodology. Failure to achieve the precision criteria requires corrective action. Accuracy Accuracy is the agreement between a measurement and the true value. Two methods exist for measuring accuracy. First, spiked samples (laboratory fortified matrix samples) indicate procedural accuracy. Second, blind spiked samples purchased from an approved commercial vendor (Performance Evaluations) ensure inter-laboratory accuracy. Blanks can be used to assure the absence of an artificial interference. Where possible, blanks assure that measured parameters represent the chemical properties of the field sample. Failure to achieve the condition of "no interference above a significant threshold" requires the initiation of corrective action. The measurement of accuracy is percent recovery between the analytical and the true values. Failure to achieve the accuracy criteria requires the initiation of corrective action. Representativeness Representativeness is the extent to which discrete measurements accurately describe an environmental condition. Site selection is designed primarily to ensure representativeness. Sites along the coast of Salem Sound’s embayments and tributaries represent the overall character of these water bodies provide the data necessary for comparing conditions in a given river, harbor, or bay. This strategy permits the assessment of impacts on Salem Sound from the individual tributaries. Sites on the tributaries have been chosen to identify detectable water quality problems. Evidence of a potential pollution source will require further investigation. Analytical data should represent the properties of the sample regardless of matrix heterogeneity of the sample. Where appropriate, thorough mixing of the sample prior to sample analysis promotes representativeness. In addition, analytical techniques should utilize the largest sample size possible to minimize the effect of matrix heterogeneity. Completeness Salem Sound Coastwatch anticipates a completeness range of 90 to 100 percent of the planned samples for collection. The reduced percentage estimate considers potential limitations to sample collection for safety reasons and reduced laboratory capacity. Comparability The Salem Sound Coastwatch monitoring program ensures comparability in samples by following standard, accepted monitoring protocols for sample collection and analysis. Volunteers are trained on these standard procedures and are supervised for the first few sampling rounds to insure proper technique. Salem Sound Coastwatch recognizes that the two different analytical methods for Enterococcus bacteria, membrane filtration and Enterolert (used by EPA New England Laboratory) may not be directly
12
comparable. However, for the purpose of comparison to state water quality standards to investigate exceedences and areas in need of remediation or BMPs, use of either of these two methods is acceptable. Both of these methods will provide SSCW and its partners with quantitative information on the concentration of bacteria associated with a particular site and any exceedences, and therefore are both equally useful to accomplishing the goals of this program.
Section 8 Training Requirements
Volunteer Training Salem Sound Coastwatch values the involvement of citizen volunteers in monitoring their local environment as an educational and stewardship activity. This requires the use of a training program in order to insure the collection of valid water quality samples. Salem Sound Coastwatch requires all participants in the Clean Beaches & Stream Program (staff and volunteers) to participate in the same training program, as outlined below. Salem Sound Coastwatch has had success in using volunteers to collect scientifically valid samples in the past using the following training sequence: 1) conducting intensive initial water quality training sessions for volunteers; 2) supervising volunteers in the field during the first few sampling rounds to insure the use of proper collection techniques; 3) thereafter, conducting repeated quality assurance checks of their protocol; and 4) retraining volunteers at a regular interval. Materials used in the volunteer training session are included in Appendix G. SSCW requires all volunteers in this program to participate in this training to the satisfaction of Barbara Warren, SSCW QA Officer. Private training sessions with individual volunteers may be substituted when necessary for the initial volunteer group training and orientation. SSCW will maintain a list of all volunteers who have successfully completed this training program and are therefore considered qualified to collect water samples. This list will include individuals’ names, type of training, date of training completion, and their sampling location(s). This list is generated and revised only by the approved trainer. Qualified trainers shall include Barbara Warren and any SSCW staff or representatives that she deems qualified to provide training.
Section 9 Documentation and Records
Record keeping serves numerous purposes vital for the production of reliable data. In general, all procedures, observations, subjective decision-making, and any unusual circumstances should be recorded in one of the following documents.
Data Sheet Data sheets are preprinted forms on which field measurements and observations are recorded (Appendix H). Data sheets will be completed and relinquished to SSCW staff at the drop-off site. Data sheets are archived by sampling season in a permanent file. Hardcopy of these data is maintained permanently by SSCW.

13
Chain of Custody Form Chain of custody (COC) forms will be completed for each sample shipped to a fixed laboratory for analysis (Appendix I). Copies of these forms are archived permanently in the SSCW office. The original chain of custody forms will be retained and archived by the appropriate laboratory. Laboratory specific COC forms may be substituted for SSCW COC provided all relevant information can be recorded easily. Equipment Checklist The equipment checklist is a preprinted form used to track the materials distributed to Volunteer Samplers during the sampling season (Appendix G). Volunteers will complete equipment checklists upon receipt of the sampling kit. Equipment checklists are maintained indefinitely. New forms will be completed following each annual equipment inspection. Procedure Checklist The Procedure Checklist lists all the steps to be followed in chronological order by the water quality monitor during each sampling event (Appendix G). All monitors are given a procedure checklist. This acts as an additional quality control.
Section 10
Sampling Process Design For much of the history of Salem Sound Coastwatch’s water quality monitoring program, the focus has been on pathogen pollution sources. These data reveal a complex story about stormwater pollution in this area. Dry weather flows at some beaches reveal small quantities of highly contaminated water flowing onto public bathing areas. During rain, bacteria counts at these drainages are typically lower, indicating that the runoff is actually diluting the pathogen load that is more concentrated during dry weather. At other locations, dry weather flows reveal low bacteria counts. During rain events, bacteria counts at these locations typically increase, indicating that runoff carries a pathogen load of potential concern. Remediation strategies for these two types of sources differ. In one case, with the more dramatic pathogen counts during dry weather flow, the data indicate the possible presence of an illicit sewer connection, damaged sewer lines, or failing septic system. In the other case, stormwater remediation strategies such as treatment prior to discharge through swales or other methods and prevention, using techniques such as storm drain stenciling, street sweeping, etc., may help reduce the pathogen load. Since the initiation of this water quality monitoring program, Salem Sound Coastwatch has identified a large number of concentrated pathogen sources due to illicit connections, damaged sewer lines, and failing septic systems and has worked with municipalities to remediate these. A number of sources with very significant pathogen loads remain and, therefore, Salem Sound Coastwatch will continue, to sample at a regular interval in an attempt to document these sources. Sampling Locations Twenty-four sampling locations will be selected for monitoring each sampling season from the outfall pipes and streams along the Salem Sound coastline (see Appendix D). For the majority of the time, the same sampling locations will be routinely sampled throughout the summer on a biweekly schedule. Sampling locations may be moved or changed when conducting source identification work or to confirm reported high

14
concentrations. Additional or follow-up monitoring at upstream locations will be performed as potential sources are documented/identified at any regularly sampled site. At the beginning of each new sampling season, SSCW will evaluate the previous year’s results and select twenty-four sites based in part on past contamination levels. Discharge sampling sites are chosen and prioritized based on the sensitivity of the receiving waters and/or the concentration and flow of bacteria at the site, as documented by previous testing. Factors included in the evaluation of sensitivity of the receiving waters include the site’s proximity to public bathing beaches, and its proximity to shellfish beds, eelgrass beds, or popular recreation fishing areas. The dry weather flow rate at a sampling site is also considered as a factor in selecting sites. At the time of site selection and at each sampling, samplers will make a qualitative observation of the flow at that point in time. These subjective, dry-weather flow ratings will be in one of the following categories; N = no flow, T = trickling flow, S = some water evident which is stagnant, F = steady, continuous flow. In addition, for samples taken at outfall pipes, samplers will indicate level of flow at time of sample using a circle diagram on their field data sheet (see Appendix H). For sampling sites which repeatedly yield bacteria levels above the EPA acceptable standards for marine waters (greater than 104 CFU/100mL), additional sampling will be conducted at upstream locations. This additional investigation will be aimed at identifying and quantifying sources or hotspots of bacterial contamination that may be contributing to the bacteria levels observed at the end discharge point. This information will be provided to local DPW and BOH officials to facilitate remediation at these locations. Water Sample Collection by Trained Volunteers Collection of water quality samples for the Clean Beaches and Streams Program will be conducted by a Field Scientist and/or trained volunteers. The Field Scientist will coordinate and lead the monitoring effort, including sample collection, coordination of volunteers and laboratories, training of volunteers, and pickup and transportation of samples to the laboratories. Currently, Salem Sound Coastwatch has thirteen trained volunteers who actively participate in sample collection. These volunteers have been working with the program for at least one year and, in some cases, over ten years. Each volunteer is assigned a specific station or set of stations based on proximity to his/her home and available transportation. Each volunteer collects one or more samples during a specified time that coincides with a two-hour window around low tide on the sampling day. Sampling within the two-hour time period within low tide allows for collection of samples at pipes that are underwater at high tide. Volunteers place their samples immediately on ice in a cooler and transport the cooler to the Salem Sound Coastwatch office or keep it with them at their homes until the Field Scientist comes to pick up the sample(s) for transportation to the laboratory. In either case, the sample will be moved to the SSCW cooler, as containing ice, for transport to the laboratory. The Field Scientist will be responsible for transporting the samples to the laboratory within the specified holding time (6 hours maximum). Samples will be maintained at 4 degrees C at all times. Collection Schedule Water quality samples are collected on a regular schedule every two weeks from April/May until September/October based on the time of low tide, availability of the laboratories, and available funding. Samples are usually collected during the morning hours in order to allow time for sample collection and delivery to the laboratories by early afternoon so that the samples may be processed immediately that day. Samples are collected regardless of weather, with the exception of potentially risky weather situations. National Weather Service (NWS) data collected at the Beverly airport and available from the NWS website ( www.nws.noaa.gov/er/box) are used to track rainfall in the days prior to sampling and on the day of sampling. In addition, weather observations are recorded on the Salem Sound Coastwatch Water Quality Sampling Sheet (Appendix H).

15
Criteria for “Wet” or “Dry” Based on these rainfall data, samples are categorized as either “wet” or “dry” samples for the purpose of data analysis and usage. Samples collected on a day with less than 0.2” rain on the day of sampling (prior to sample collection) or less than 0.5” of rain within three days preceding sampling are considered “dry” weather samples. Samples collected on a day with more than 0.2” of rain on the day of sampling (prior to sample collection) or more than 0.5” within three days preceding sampling are considered “wet” weather samples. SSCW recognizes that the “wet” weather samples do not reflect “first flush” conditions of a rainstorm; however, they are useful for determining the relative bacterial loading of specific sources during “dry” vs. “wet” weather. Other Considerations As some of the sampling sites may include pipes that are underwater at high tide, SSCW recognizes that samples collected at or near low tide at these locations may still include residual tidal water that may be contaminated. SSCW further recognizes that this occurrence could affect the results of bacterial testing of samples form these locations. This possibility will be included in discussions with municipal officials concerning any elevated bacterial levels identified by this sampling program and will be investigated accordingly.
Section 11 Sampling Methods Requirements
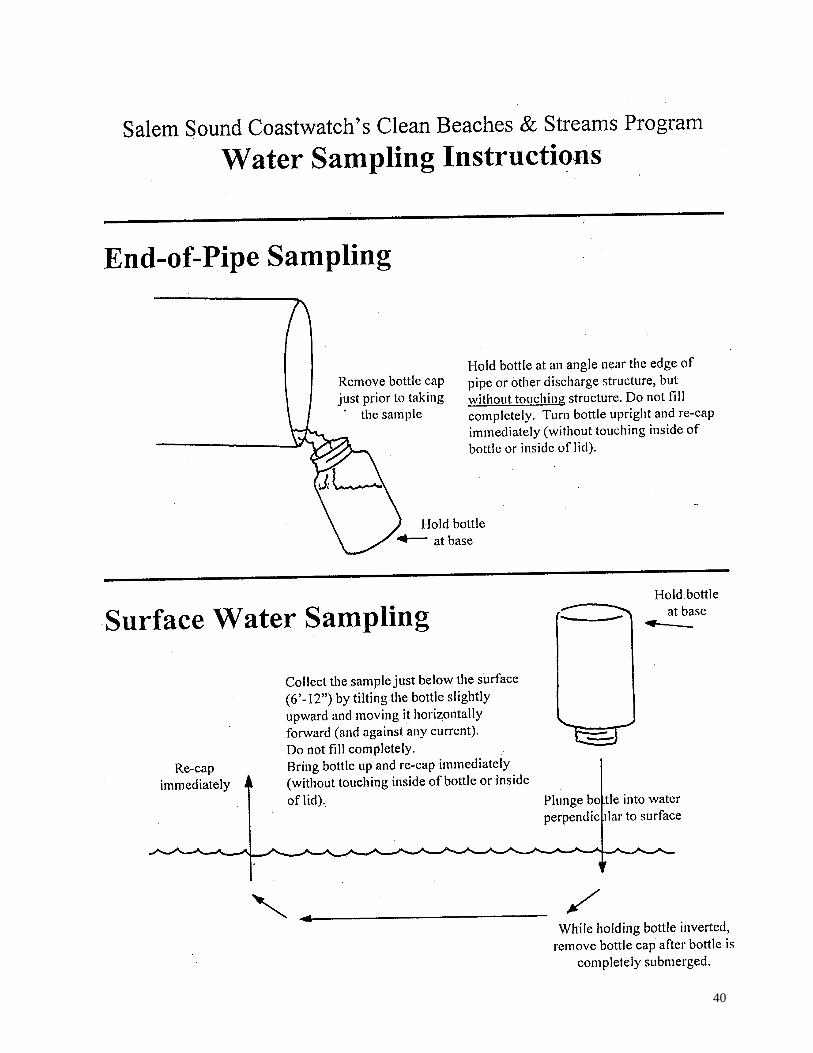
Sample Collection The methodology used for sample collection is adapted from Standard Methods for the Examination of Water and Wastewater, 17th ed., materials prepared by the MA Division of Marine Fisheries, and Volunteer Estuary Monitoring: A Methods Manual, EPA 842-B-93-004 (1993). Water samples for the analysis of Enterococcus bacteria will be collected in either sterile, reusable polypropylene screw-top, or sterile, disposable polypropylene flip-top containers. Salem Sound Coastwatch will be responsible for purchasing or otherwise obtaining these sterile vials. Samplers will wear new, unused disposable gloves to collect each sample. Each sampling container is marked with the sampling site ID number, the date, and the time of collection. This information is also recorded on the Salem Sound Coastwatch Water Quality Monitoring Data Sheet (Appendix H). Information on the sample collector, weather, sample turbidity, flow, and any observations that give more information about water quality (e.g. presence of ducks or dogs, floating debris, or colors or odors in the water) will also be recorded on the sample sheet. Two different collection methods will be used depending on whether the samples are being collected from a waterbody or from a pipe. Samples will not be collected from a completely stagnant pool. Water must be flowing or part of a larger system, in the case of coastal waters, in order to collect a sample. Materials used in training volunteers on these techniques can be found in Appendix G. Sampling locations that cannot be easily and safely accessed by hand will be sampled using a hand-held extension pole. This pole will extend the reach of the sampler, who will otherwise collect the sample using the methods described below.

16
Stream/River/Coastal Collection Method: Samples collected from a flowing river or stream, or a coastal waterbody, will be collected by holding the sampling bottle by the base and plunging it straight down into the water to a depth of approximately 6 inches. The sampler must take care not to disturb any underlying sediment either by standing in the water or with the sampling container. If the sampler must stand in the water in order to collect the sample, the sampler should stand downstream of where the sample will be taken and allow time for any disturbed sediments to settle or wash downstream before collecting the sample. While holding the bottle inverted in the water, the sampler will open the container without touching the rim or inside of the cap. In a single, continuous motion, the sampler will then rotate the bottle to horizontal so that it points into the flow of the current, move it horizontally until it is mostly full, and swing it up toward the surface of the water until it breaks the surface. Ideally, this motion will be conducted to leave approximately one-inch air space (above the 100mL fill line) in the sampling container. However, if the sample container is full, enough water will be poured out to leave a one-inch air space in the bottle. This will allow the sample to be shaken in the lab prior to analysis to insure homogeneity and, thus, representativeness. The lid will then be replaced securely without touching either the rim of the bottle or the inside of the lid. Pipe Collection Method Samples collected from a flowing pipe will be collected by holding the bottle into the flow without touching any part of the pipe. If the pipe has a swinging cover on it, the sampler will lift the cover with one hand and allow the pipe to flow for at least one minute or until any sediment or debris that has built up behind the cover is washed away. Once this is done, the sampler will hold the uncapped sample bottle into the pipe flow taking care not to touch the bottle to any part of the pipe. The bottle will be held in the flow until it is nearly full, leaving a one-inch space in the container.
Section 12 Sample Handling and Custody Requirements
Sample Storage and Transport Once a sample is collected (as per Section 11), the lid secured, and the bottle labeled, the sample bottle will be immediately placed in a cooler for storage and transport to a laboratory. The cooler will contain ice packs or ice placed in sealed plastic bags to prevent melting ice from contaminating the samples. Importance of placing the sample immediately on ice will be stressed to the volunteer monitors. The SSCW cooler will contain a thermometer. The SSCW QA Officer will inspect the thermometer at departure to the laboratory to ensure that samples are being stored at 4°C. Samples not maintained at or below 4°C will be discarded without testing. Transportation of samples to a laboratory will occur within six (6) hours of sample collection. In the event that this holding time is exceeded, samples will be discarded without testing. Chain-of-Custody Sampling containers will each be labeled with the sampling site number and date. This information along with additional observations including time of sampling will be recorded on the Salem Sound Coastwatch Water Quality Monitoring Data Sheet. The Field Scientist and/or each trained volunteer will be responsible for guaranteeing the integrity of the samples from the time of collection until the time of pickup for transport to the laboratory. The Field Scientist will be directly responsible for all of the samples that s/he collects and all samples once s/he picks them up for transport to the laboratory. The Field Scientist is responsible for transporting all water samples to the laboratory for analysis. The Field Scientist will complete a chain of custody form specific to each laboratory (Appendix I) which specifies the samples collected, date and time

17
of collection, analyses requested, and other information specified by the laboratory. Upon arrival, the Laboratory Manager or other authorized laboratory personnel will sign the “received by” section of the data sheet to designate that they have taken custody and responsibility for the samples from that point in time.
Section 13
Analytical Methods Requirements Analytical Procedures Water samples will be analyzed for Enterococcus counts to reflect recent advances in water quality monitoring for the protection of public health and current Federal and State guidelines for the harvesting of shellfish and protection of bathers. Analysis will be conducted by either of two different certified laboratories: Biomarine, Inc., located in Gloucester, MA, or the U.S. Environmental Protection Agency (US EPA) Laboratory in Chelmsford, MA., depending on available laboratory capacity. EPA Laboratory The laboratory will follow the Ecosystem Assessment Unit Ecology Monitoring Team Laboratory Quality Assurance Plan, which provides guidelines to ensure reliability and validity of their work. Compliance with the Ecosystem Assessment Unit Ecology Monitoring Team Laboratory Quality Assurance Plan is coordinated and monitored by the Biology Quality Assurance Officer (QAO)- Dave McDonald. Laboratory blanks are run with each Enterococcus sample set. Sample data is reported as qualified if the lab blank shows any contamination. All laboratory procedures are documented in writing as either Standard Operating Procedures (SOP) or Method Procedures (MP) which is edited and controlled by the Microbiologist QAO. Dave McDonald or his designee will review and approve the release of the microbiology data reports. U.S. EPA New England Laboratory’s Analytical methods and SOPs are described in Appendix K. Biomarine, Inc Biomarine, Inc. is a private for-profit laboratory certified by the MA DEP for analysis of potable water. The analytical method used for fecal coliform bacteria analysis is the membrane filtration method 9222 D in Standard Methods (19th ed., 1995). The analytical method used for Enterococcus analysis is method 9230C in Standard Methods (19th ed., 1995). John Marletta is the owner and laboratory manager. The Biomarine, Inc. QA/QC and Standard Operating Procedures (SOP) Manuals, Lab Manager qualifications, and laboratory certification materials are included in Appendix J.

18
Section 14 Quality Control Requirements
Quality Control Samples Samples collected for quality control (QC) for this monitoring effort will include duplicate samples. Duplicates are to be collected at the same location, in separate containers simultaneously, or as close in time as physically possible. Field duplicates will comprise five percent (5%) of the total samples collected during each sampling round. Thus, all of the QC samples together will likely comprise five percent (5%) of the samples. Typically, 20-24 samples are collected during each sampling round/date, with one additional QC sample Although EPA does not require duplicate samples, SSCW believes that the collection of 5% QC samples has value to foster precision and accuracy in this bacterial sampling program. In addition to the QA/QC measures and practices employed by SSCW, the US Environmental Protection Agency and Biomarine, Inc. both operate standard quality assurance (QA) programs in their laboratories.
Section 15 Instruments
Samples will be primarily collected directly by hand in the manner described in Section 11, Sampling Methods Requirements, and will not require any instrumentation. Sampling locations that cannot be easily and safely accessed by hand will be sampled using a hand-held extension pole. This pole will extend the reach of the sampler, who will otherwise collect the sample using the methods described in Section 11. A standard, portable mercury-free thermometer will be used in SSCW’s sample transport cooler. Laboratory Instrumentation The laboratories have provided a list of laboratory instruments and their preventative maintenance and calibration procedures (see Appendices J and K). Use of alternative methods or instrumentation is not permitted without the consent of the Project Manager. Serial numbers, calibration records, and maintenance records must be provided to the Project Manager if requested without charge.
Section 16 Supplies
Supplies required for SSCW’s Clean Beaches & Streams Program include sterile plastic containers and disposable plastic gloves. The containers will be either sterile, reusable polypropylene screw-top, or sterile, disposable polypropylene flip-top containers (100 mL). Salem Sound Coastwatch will be responsible for purchasing or otherwise obtaining these sterile vials. SSCW will also maintain an adequate supply of disposable gloves, both latex and non-latex, for samplers to wear while sampling. SSCW will provide each monitor with data sheets and all necessary equipment.
19
Section 17 Data Management
Data Acquisition and Verification Field data sheets for each sampling event will be collected and reviewed by the Field Scientist and Program Manager to insure that all data fields have been filled in and important comments included. The volunteers will give all data sheets to the Field Scientist at the time of sample pick-up. The Field Scientist will insure that all data sheets are collected and that the information is complete and valid and correctly transferred to the chain-of-custody forms. Upon receipt of testing results from the laboratory, data will be entered into an Excel database and compiled in a legible form for distribution to the Clean Beaches and Streams Network (Appendix E). The SSCW QA Officer will review the data for quality assurance and accuracy prior to public dissemination. Data Usage and Reporting The Clean Beaches and Streams Program has several goals related to public education and outreach including 1) raising awareness by local Boards of Health and Departments of Public Works staff of water pollution sources to public bathing beaches and shellfish beds and promoting their remediation; and 2) increasing public awareness of potential health risks due to water pollution sources and educating the public about its role in stormwater pollution. To this end, water quality data obtained through the Clean Beaches and Streams monitoring program will be compiled and mailed to each of the Clean Beaches and Streams Network (CB&SN) members, including the Board of Health and Department of Public Works staff from the six Salem Sound communities (Appendix E). Data will also be compiled biweekly during the summer into the Beaches and Streams Report which will summarize SSCW water quality results and BOH beach testing data around Salem Sound. The Beaches and Streams Reports are distributed to local newspapers, political leaders, the CB&SN, and local Town/City Halls. The Beaches and Streams Reports will also be posted on the Salem Sound Coastwatch website, www.salemsound.org. Salem Sound Coastwatch has published a public education brochure (Appendix L) as part of the Clean Beaches and Streams Program. In addition, an effort will be made this year to get local newspapers to cover data reports and findings in a timely manner. The data collected will also support: ⇒ Storm Drain Stenciling Initiatives; ⇒ Targeted grant writing and technical assistance to municipalities for Best Management Practices; ⇒ Development and implementation of municipal Phase II stormwater management plans; ⇒ Municipal planning and conservation efforts; ⇒ Efforts to reopen shellfish beds on a conditional or restricted basis; and ⇒ Public education efforts directed at reducing stormwater pollution. In addition to the bi-weekly data reports produced and distributed within this program, SSCW will produce an annual report. This annual report will summarize the findings of the year’s monitoring, present related data collected by other entities, including data collected by the watershed’s municipalities at local swimming beaches, highlight any local initiatives or projects stemming form the this program, and provide site-specific recommendations for addressing any issues identified by the monitoring. This report will also include a discussion of the quality check (QC) results. The annual report will be freely available to the public, and will be distributed throughout the CB&SP Network, to any project funders, and will be posted on SSCW website (www.salemsound.org).

20
Section 19 References
References Cleaves, Sam, 1994. Salem Sound 2000/Endicott College Monitoring and Analysis Program for Sources of
Fecal Coliform Flowing into Salem Sound, MA. Prepared for U.S. EPA Region I and the Massachusetts Bays National Estuary Program. 1 August.
Cleaves, Sam and Christine Jones, 1993. Quality Assurance Plan for Fecal Coliform Testing of the Waters
of Salem Sound from Manchester-by-the-Sea to Marblehead. Prepared for U.S. EPA Region I and the Massachusetts Bays National Estuary Program. 6 August.
DEP (MA Department of Environmental Protection), Division of Watershed Management, 2000. North
Coastal Watershed 1997/1998 Water Quality Assessment Report. DWM Control No. 17. Report No. 93-AC-1. May.
DWPC (Massachusetts Division of Water Pollution Control), 1992. Commonwealth of Massachusetts
Summary of Water Quality. Massachusetts Department of Environmental Protection. Publication No. 17276. November.
EPA (U.S. Environmental Protection Agency), 1993. Volunteer Estuary Monitoring: A Methods Manual.
Office of Water. EPA 842-B-93-004. Sokulsky, Jeremy, 1997. Quality Assurance Project Plan for Salem Sound 2000 Adopt-a-Stream Program
for Determining Sources and Loads of Fecal Coliform to Waters within the Salem Sound Watershed. Prepared for U.S. EPA Region I. 16 June.
Standard Methods for the Examination of Water and Wastewater, 17th ed., 1989. Standard Methods for the Examination of Water and Wastewater, 19th ed., 1995.

21
Appendix A.
Salem Sound Watershed Map

22
23
Appendix B.
Salem Sound Waterbody Classification Map

24

25
Appendix C.
MA Division of Marine Fisheries Shellfish Resource AreasMap (2000)

26

27
28
Appendix D.
Salem Sound Shoreline Survey and Source Identification (SSASI) Site List, 1993

29
30

31

32
33
34

35

36
37

38
Appendix E.
Clean Beaches and Streams Network Contact List
Salem Sound Coastwatch Barbara Warren, Executive Director Susan Yochelson, Outreach Coordinator (ph) 978-741-7900 (ph) 978-741-7900 (fax) 978-741-0458 (fax) 978-745-0458 [email protected] [email protected] Municipal Contacts Marblehead Department of Engineering Water & Sewer Commission Department of Public Health (Doug Saal, Director) (Dana Snow, Superintendent) (Wayne Attridge, Director) (ph) 781-631-1529 (ph) 781-631-2694 (ph) 781-631-0212 (fax) 781-631-2617 (fax) 781-275-1002 Salem Department of Public Services Department of Public Health (Bruce Thibideou, City Engineer) (Joanne Scott, Director) (Ph) 978-745-9595 (ph) 978-741-1800 (fax) 978-745-5877 (fax) 978-748-9705 Peabody Department of Public Services Department of Human Services (Dick Carnevale, Director) (Bernie Horowitz/Karl Jansons, Sanitary Inspectors) (ph) 978-532-3000 (ph) 978-532-3000 (fax) 978-535-3754 Danvers Department of Public Works Department of Public Health (Rick Rogers, Director) (Peter Mirandi, Director) (ph) 978-777-2668 (ph) 978-777-0001 (fax) 978-774-5623 (fax) 978-762-0215 Beverly Department of Engineering Department of Public Health Department of Public Services (Frank Killilea, Director) (Bill Burke, Director) (Mike Collins, Director) (ph) 978-921-6000 (ph) 978-921-8591 (ph) 978-921-6057 (Fax) 978-921-6003 (fax) 978-922-5695 Manchester Department f Public Works Department of Public Health (Bob Moroney, Director) (John Jacobi, Director) (ph) 978-526-1242 (ph) 978-526-7385 (fax) 978-526-2001
39
Appendix F.
Salem Sound Coastwatch Volunteer Water Quality Training Materials
40

Six Tips for Water Quality Sampling for Enterococcus Bacteria
1) PROTECT yourself when you sample. ♦ Wear gloves – change them between stations. ♦ Make sure you have safe access to the collection site. ♦ Wash hands thoroughly immediately after you finish collecting all samples. 2) SELECT a good sampling location. ♦ Sample as close to source as possible. ♦ As far out in the main channel or flowing water as possible – no standing water or stagnant
water. ♦ If a pipe, sample at the end of the pipe without touching the pipe. 3) COLLECT a valid water quality sample. ♦ Collect your sample in the 2- hour window around low tide. ♦ Do not collect a sample if the sampling site is even partially covered by the tide. ♦ Keep the sampling container closed until immediately before you collect the water. sample – if
it accidentally opens before this, recycle it and use another one . ♦ Hold the bottom of the sample container while sampling. ♦ Scoop up sample away from your body and into the stream current. ♦ During collection, take care not to touch the rim, inside of the lid, or inside of the container
in any way – if so, just recycle that container and get a new one. ♦ Avoid any sediment, sand, or organic matter in the sample – beware of kicking up sediment as
you sample. ♦ Keep 1 inch of air space in the top of the container. 4) DOCUMENT sampling effort in detail on the sampling sheet. ♦ Label the sampling container with the site number, date, time of collection. ♦ Fill out the sampling sheet as completely as possible with your name, date, TIME, site number,
flow, turbidity, weather, etc. ♦ Write down observations you make that might influence the sample result (e.g., many
waterfowl at the location, dog feces seen in the vicinity of the site, more flow than normal, ice on water, etc.).
5) STORE sample in an ice chest. ♦ Place sample immediately on ICE in a cooler that is maintained at or below 4° C or 39° F. ♦ Do not store samples in a refrigerator or cooler used for food (if using a cooler for multiple
uses, clean with diluted bleach after storing samples in it). 6) DELIVER samples to pickup location in a timely manner. ♦ Make sure lids are on tight and they are upright during transport.
41

42
Salem Sound Coastwatch Clean Beaches & Stream Program 2005
Materials Checklist:
Latex Gloves Cooler with Ice
Sterile Plastic Sampling Containers (and extras)
Sampling Sheets and Pencil(s) – note that pencils are better for note-taking since they won’t run in the rain like a pen
Waterproof Markers (for labeling site number, date and time)
Thermometer for measuring temperature of cooler (maintain at or below 4° C or 39° F)
Directions to the site(s) if needed
Rubber boots (optional, you may need these depending on site)
Sampling must be conducted within 2 hours of low tide and dropped off at the SSCW office before 10:00 AM unless other arrangements have been made. Water Sampling Schedule
DATE LOW TIDE* COLLECTION TIME Tuesday 5/24 6:17 AM 6:00 – 8:17 AM Tuesday 6/7 6:24 AM 6:00 – 8:24 AM Tuesday 6/21 5:56 AM 6:00 – 7:56 AM Tuesday 7/5 5:23 AM 6:00 – 7:23 AM Tuesday 7/26 9:54 AM 7:54 – 9:30 AM Tuesday 8/9 8:46 AM 6:46 – 9:30 AM Tuesday 8/23 8:36 AM 6:36 – 9:30 AM Tuesday 9/6 7:35 AM 6:00 – 9:30 AM Tuesday 9/20 7:20 AM 6:00 – 9:20 AM
*Based on Salem tide schedule (www.maineharbors.com) Please let us know in advance if you are unable to make a collection day. Contact Info:
Barbara Warren – Home 978-744-5477 E-mail: [email protected] Office: 978-741-7900
_____________________________________________________________________________

43
Appendix G.
Salem Sound Coastwatch Water Quality Monitoring Data Sheet

Site # Bottlle # Time FlowAmount of flow
from pipe Turbidity Color of flow Odor
N S T F Y N
N S T F Y N
N S T F Y N
N S T F Y N
N S T F Y N
N S T F Y N
N S T F Y N
Low Tide:
Note: For "Flow" and "Turbidity", please circle the appropriate letter. For "Amount of flow from pipe", draw a line to indicate level of flow.
Salem Sound Coastwatch Bacteria Monitoring Data Form Date: Town/City:
Salem Sound Coastwatch, 201 Washingotn St. #9, Salem MA 01970. phone: 978-741-7900
For office use:
FLOW: N = no water, S = some water which is stagnant, T = trickling flow, F = steady, continuous flow
Sample(s) Collected By:
Weather: Precipitation (circle one): none light rain heavy rain snow
TURBIDITY: N = not turbid [clear, transparent] Y = turbid water [opaque, lack of transparency because of chemicals, suspended particles (sediments), or density of microbiological organisms.]
Comments
Comments:
Checked by: Time:
Comments
44

45
Appendix H.
Sample Beaches and Streams Report Summer, 2004 Summer, 2005
SALEM SOUND COASTWATCH
Protecting the Coastal Habitats of the Salem Sound Watershed with the Communities of Manchester, Beverly, Danvers,
Peabody, Salem, and Marblehead.
Salem Sound Clean Beaches and Streams Program
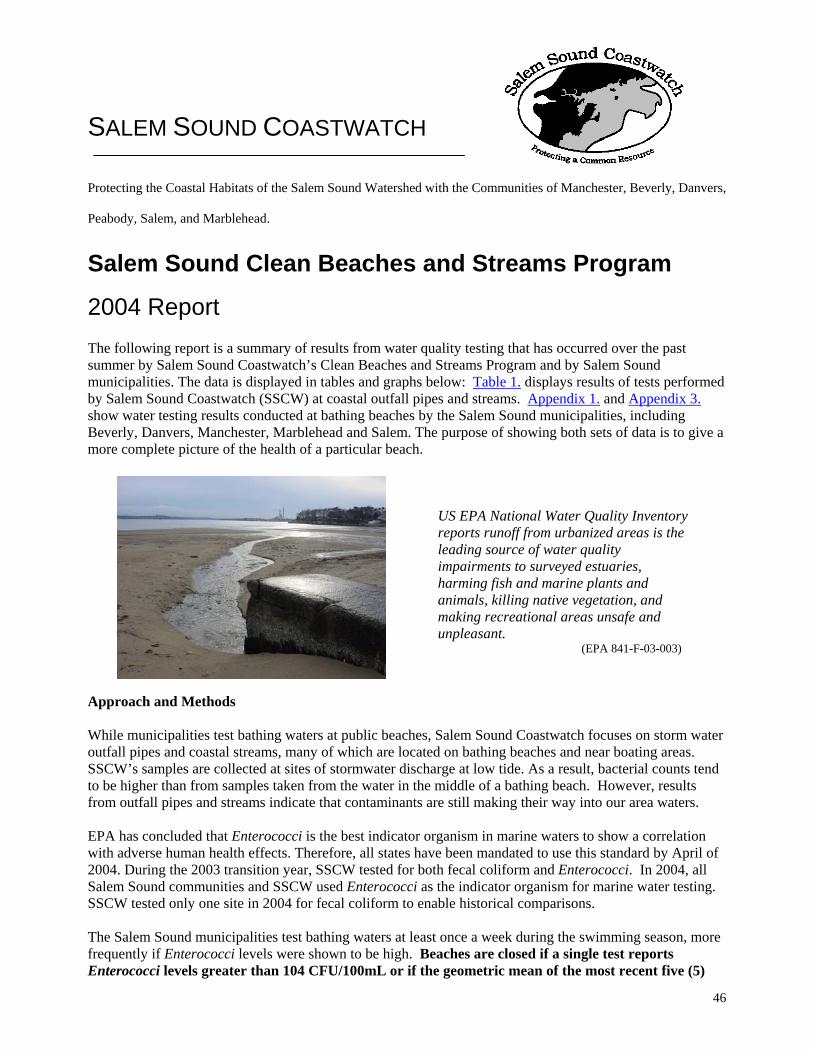
2004 Report The following report is a summary of results from water quality testing that has occurred over the past summer by Salem Sound Coastwatch’s Clean Beaches and Streams Program and by Salem Sound municipalities. The data is displayed in tables and graphs below: Table 1. displays results of tests performed by Salem Sound Coastwatch (SSCW) at coastal outfall pipes and streams. Appendix 1. and Appendix 3. show water testing results conducted at bathing beaches by the Salem Sound municipalities, including Beverly, Danvers, Manchester, Marblehead and Salem. The purpose of showing both sets of data is to give a more complete picture of the health of a particular beach.
US EPA National Water Quality Inventory reports runoff from urbanized areas is the leading source of water quality impairments to surveyed estuaries, harming fish and marine plants and animals, killing native vegetation, and making recreational areas unsafe and unpleasant.
(EPA 841-F-03-003) Approach and Methods While municipalities test bathing waters at public beaches, Salem Sound Coastwatch focuses on storm water outfall pipes and coastal streams, many of which are located on bathing beaches and near boating areas. SSCW’s samples are collected at sites of stormwater discharge at low tide. As a result, bacterial counts tend to be higher than from samples taken from the water in the middle of a bathing beach. However, results from outfall pipes and streams indicate that contaminants are still making their way into our area waters. EPA has concluded that Enterococci is the best indicator organism in marine waters to show a correlation with adverse human health effects. Therefore, all states have been mandated to use this standard by April of 2004. During the 2003 transition year, SSCW tested for both fecal coliform and Enterococci. In 2004, all Salem Sound communities and SSCW used Enterococci as the indicator organism for marine water testing. SSCW tested only one site in 2004 for fecal coliform to enable historical comparisons. The Salem Sound municipalities test bathing waters at least once a week during the swimming season, more frequently if Enterococci levels were shown to be high. Beaches are closed if a single test reports Enterococci levels greater than 104 CFU/100mL or if the geometric mean of the most recent five (5)
46
Enterococci levels within the same bathing season exceeds 35 colonies per 100mL (Massachusetts state sanitary code 105 CMR 445.000). The numbers shown in column 1, Appendix 3. represent the “geometric mean” of all test results collected over the summer by the Boards of Health. This is a statistical averaging method used to even out the average when dealing with a wide range of numbers. The variation in bacterial counts is depicted more clearly in the three graphs displayed in Appendix 1. The graphs are plotted using the logarithmic scale, and each y axis marking is an order of magnitude (1, 10, 100, 1000). Appendix 3. column 2 lists the range of Enterococci levels for each beach. Definition of Dry vs. Wet Conditions Rain can cause temporary elevated bacterial counts at discharge sites and within nearshore coastal waters. Runoff from impervious surfaces (parking lots, roofs, streets) flushes contaminants through storm drains, bringing pollution onto the beaches and other coastal habitats.
Salem Sound Coastwatch defines “dry” conditions vs. “wet” differently than the municipalities. Under SSCW’s definition, dry conditions are less than 0.2" precipitation the day of sampling or less than 0.5" within the three days preceding sampling. Wet conditions are defined as more than 0.2" precipitation on the day of sampling or more than .5" within three days preceding sampling. Protocols for wet weather sampling are the same as for dry weather sampling.
The municipalities define wet conditions, or a “storm” event, as any occurrence of precipitation during the sampling or within the 24 hours preceding the sampling.
47
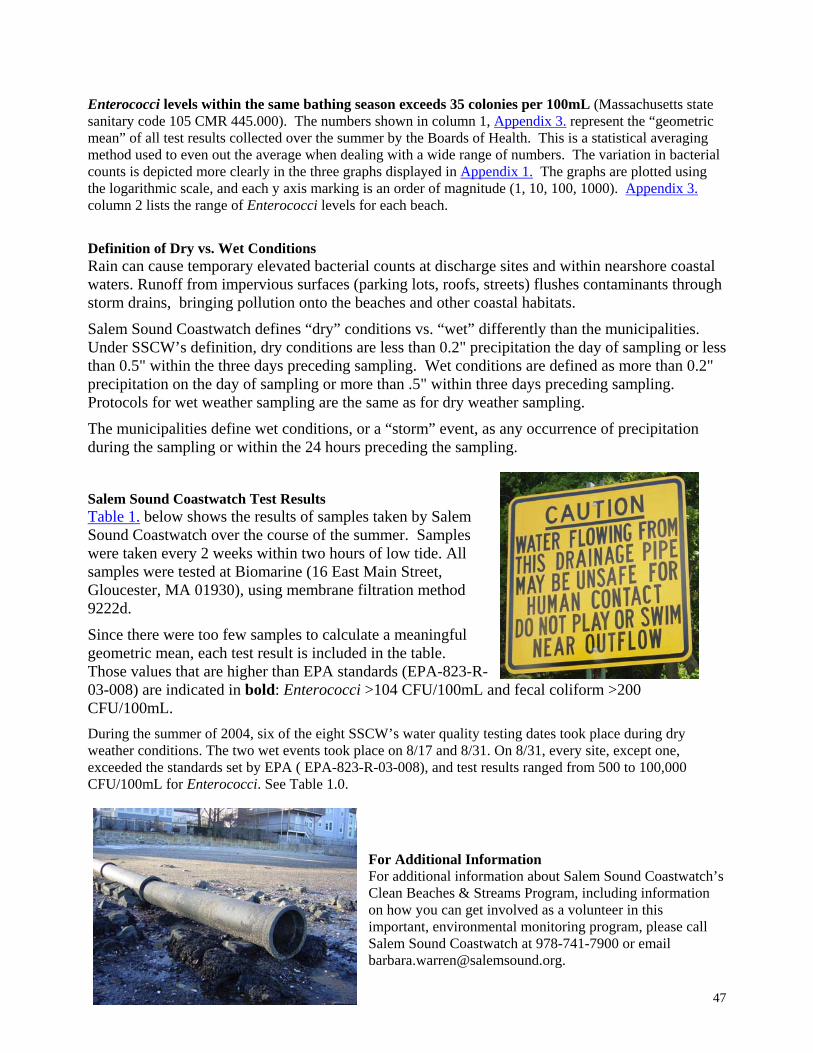
Salem Sound Coastwatch Test Results Table 1. below shows the results of samples taken by Salem Sound Coastwatch over the course of the summer. Samples were taken every 2 weeks within two hours of low tide. All samples were tested at Biomarine (16 East Main Street, Gloucester, MA 01930), using membrane filtration method 9222d.
Since there were too few samples to calculate a meaningful geometric mean, each test result is included in the table. Those values that are higher than EPA standards (EPA-823-R-03-008) are indicated in bold: Enterococci >104 CFU/100mL and fecal coliform >200 CFU/100mL. During the summer of 2004, six of the eight SSCW’s water quality testing dates took place during dry weather conditions. The two wet events took place on 8/17 and 8/31. On 8/31, every site, except one, exceeded the standards set by EPA ( EPA-823-R-03-008), and test results ranged from 500 to 100,000 CFU/100mL for Enterococci. See Table 1.0.
For Additional Information For additional information about Salem Sound Coastwatch’s Clean Beaches & Streams Program, including information on how you can get involved as a volunteer in this important, environmental monitoring program, please call Salem Sound Coastwatch at 978-741-7900 or email [email protected].

48
Table 1. Salem Sound Coastwatch--water quality monitoring results 2004 from outfall pipes and streams in the Salem Sound Watershed.
DRY DRY DRY DRY DRY WET WET DRY Marblehead Site # Test 6/8 6/22 7/6 7/20 8/3 8/17 8/31 9/14 Stramski Beach - Stream draining across beach 722 Ent 300 700 1,400 600 1,500 1,300 6,400 1,200 Stramski Way - near pkg lot after playground 722a Ent <100 1400 2,100 800 2,100 1,200 7,400 1,000 Stramski Way - near field 722b Ent 200 900 3,300 <100 <100 100 21,000 <100 Hawthorne Pond - end of street 750a Ent 100 <100 <100 ns ns ns ns ns Hawthorne Pond 750b Ent <100 <100 200 ns ns ns ns ns Hawthorne Pond - boardwalk 750c Ent ns ns ns 400 <100 ns ns ns Beverly Dane St. Beach - N. storm drain 322 Ent <100 100 500 <100 <100 100 11,900 400 Lawrence Street brook at beach 321 Ent <100 100 200 300 <100 300 5,800 200 Rice Beach-Stream draining across beach 214 Ent 200 200 900 <100 300 400 16,000 300 Brackenberry Beach - Stream across beach 213 Ent 100 700 500 300 500 400 1,300 400 Northern storm drain at beach 213a Ent 100 3,300 300 400 400 300 31,000 600 SW storm drain at beach 222 Ent ns 500 900 100 600 <100 13,000 600 Danvers Holton-Richmond School-field 400a Ent ns 1,400 700 300 200 100 3,900 1,600 Bunky's Marina - Porter River 401a Ent ns 100 200 <100 200 <100 4,500 <100 Sandy Beach - outfall pipe 430 Ent ns 1,600 <100 <100 100 500 44,000 <100 Sandy Beach - downstream of outfall pipe 430a Ent ns ns ns <100 ns <100 1,900 200 Crane River Marina 431a Ent ns ns ns <100 ns ns ns ns Eden Glen Road 491b Ent ns 100 100 200 <100 <100 ns ns Manchester Bennett's Brook - at Bennett St. 149 Ent <100 200 1000 1,700 300 200 6,400 700 Bennett's Brook - Forster Rd. 149a Ent ns ns ns ns <100 400 100 500 Raymond Street 150 Ent ns 100 200 ns ns ns 500 100 Salem Juniper Beach - storm drain on beach 620 Ent 600 900 17,000 200 9,400 600 100,000 69,000 Juniper Beach - storm drain 620 FC 60,000 47,000 210,000 1,400 950,000 2,800 160,000 450,000 Palmer Cove - storm drain at Shetland Park 629 Ent 2,100 1,300 1,100 1,500 400 400 15,000 2,000 Palmer Cove-storm drain below Playground 631 Ent <100 <100 <100 <100 35,000 300 20,000 800 Willow Ave. Beach - storm drain on beach 642 Ent ns ns ns 100 4,000 1,800 14,000 8,000 Collins Cove - Arbella St. stairs 527 Ent ns ns ns 400 ns ns 6,600 ns Willows Pier 546 Ent ns ns ns ns ns ns ns ns North River - off Commercial St. near Rt. 114 537 Ent 400 900 1,100 100 400 300 3,800 1,000 North River - south side, capped outfall 557 Ent <100 <100 <100 ns ns ns ns ns North River - off Commercial St. by footbridge 559 Ent ns ns ns 1,600 700 500 13,000 600 Derby Wharf 630 Ent ns 400 ns 300 <100 500 12,000 1,400 Pioneer Village 634 Ent ns 500 ns ns ns ns ns ns Ent = enterococci FC = fecal coliform ns = not sampled
Numbers in bold exceed standards specified by the EPA (EPA-823-R-03-008): Fecal Coliform >200 CFU/100mL; Enterococci> 104 CFU/100mL
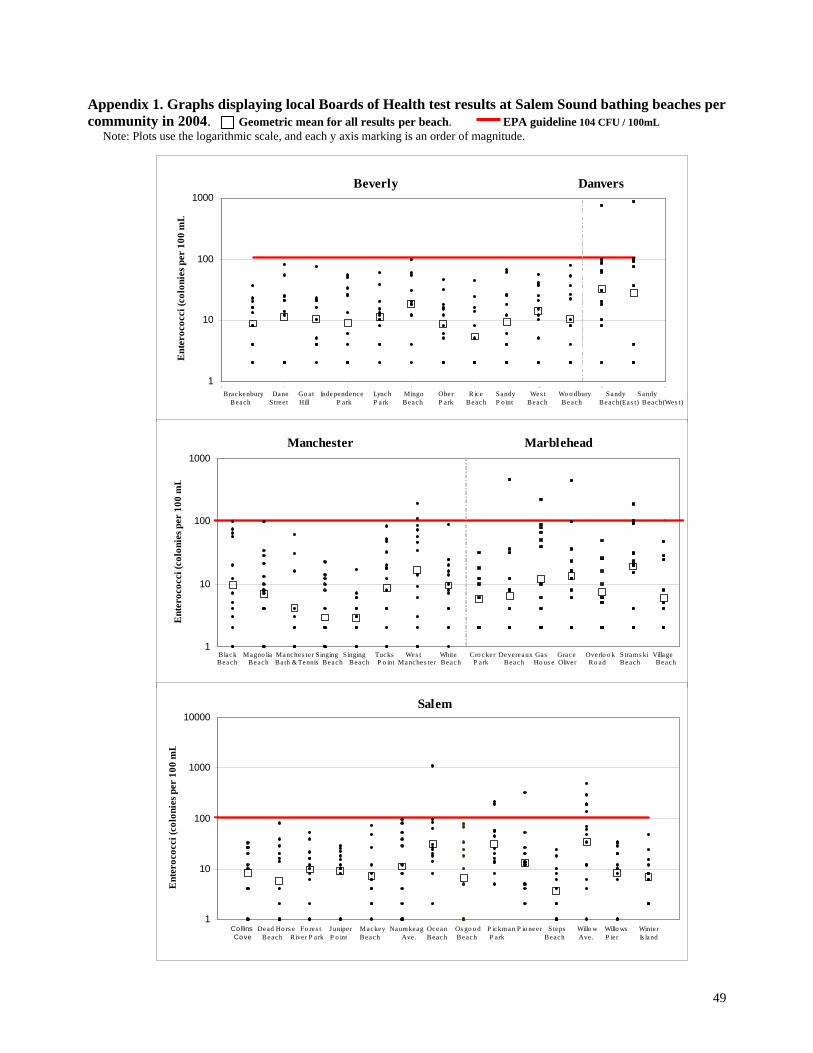
Appendix 1. Graphs displaying local Boards of Health test results at Salem Sound bathing beaches per community in 2004. Geometric mean for all results per beach. EPA guideline 104 CFU / 100mL Note: Plots use the logarithmic scale, and each y axis marking is an order of magnitude.
Beverly Danvers
1
10
100
1000
0 2 4 6 8 1 0 1 2 1 4
Ent
eroc
occi
(col
onie
s per
100
mL
Brackenbury Dane Go at Independence Lynch Mingo Ober Rice Sandy Wes t Wo o dbury Sandy Sandy Beach S tree t Hill P ark P ark Beach P ark Beach P o int Beach Beach Beach(Eas t) Beach(Wes t)
Manchester Marblehead
1
10
100
1000
Ent
eroc
occi
(col
onie
s per
100
mL
Black Magno lia Manches te r Singing S inging Tucks Wes t White Cro cker Devereaux Gas Grace Overlo o k S trams ki Village Beach Beach Ba th & Tennis Beach Beach P o int Manches ter Beach P ark Beach Ho us e Oliver Ro ad Beach Beach
Salem
1
10
100
1000
10000
Ent
eroc
occi
(col
onie
s per
100
mL
Co llins Dead Ho rs e Fo res t J uniper Mackey Naumkeag Ocean Os go o d P ickman P io neer S teps Willo w Willo ws Winte r Cove Beach R iver P ark P o int Beach Ave. Beach Beach P a rk Beach Ave . P ier Is land
49

50
Appendix 2. Public beach closings during the 2004 bathing season Beaches are closed if a single test finds Enterococci levels greater than 104 CFU/100mL or if the geometric mean of the most recent five (5) Enterococci levels within the same bathing season exceeds 35 colonies per 100mL (Massachusetts state sanitary code 105 CMR 445.000)
Beverly:
No beaches were closed.
Danvers: Sandy Beach closed July 28, reopened August 2.
Manchester: West Manchester Beach closed June 30, reopened July 7 and closed July 28, reopened August
4.
Marblehead: Stramski's closed July 16, reopened August 12. Grace Oliver's closed July 30, reopened August 1. Gas House Beach closed July 30, reopened August 12.
Salem:
Willow Avenue closed July 7 to August 11, and then closed again on September 1. Pickman Park closed July 14, reopened August 18. Ocean Ave. closed July 28 through September 1. Pioneer Village closed September 1.

Appendix 3. Salem Sound Bathing Beaches tested by local Boards of Health, 2004 Figures listed in this table are the geometric mean of all available water quality testing results per beach by municipality.
City and Beach Sampled
Enterococci (including rain events)
Range in Enterococci (CFU/100mL)
BeverlyBrackenbury Beach 9 2 - 36Dane St. (mid-beach) 11 2 - 80Goat Hill 10 2 - 115Independence Park 9 2 - 174Lynch Park 11 2 - 146Mingo Beach 18 2 - 95Ober Park 8 2 - 46Rice Beach 5 2 - 44Sandy Point 9 2 - 134West Beach 14 2 - 56Woodbury Beach 10 2 - 380DanversSandy Beach East 32 2 - 755Sandy Beach West 28 2 - 870ManchesterBlack Beach 10 1 - 97Magnolia Beach 7 1 - 97Manchester Bath and Tennis 4 1 - 61Singing Beach 3 1 - 22Singing Beach (right of pkg. lot) 3 1 - 17Tucks Point Beach 9 1 - 87West Manchester Beach 16 1 - 190White Beach 9 1 - 89MarbleheadCrocker Park 6 2 - 31Devereaux Beach 6 2 - 460Gas House Beach 12 2 - 220Grace Oliver Beach 13 2 - 440Stramski Beach 8 2 - 49Village Beach 19 2 - 185SalemCollins Cove 8 2 - 32Dead Horse Beach 6 2 - 80Forest River Point 10 2 - 52Juniper Point 9 2 - 28Mackey Beach 7 2 - 71Naumkeag 11 2 - 96Ocean Ave. Beach 31 1 - 1100Osgood Beach 6 2 - 77Pickman Park 32 1 - 210Pioneer 13 2 - 320Steps Beach 4 1 - 24Willow Ave. 33 1 - 490Willows Pier 8 1 - 33Winter Island 7 2 - 48
51

SALEM SOUND COASTWATCH
Protecting the Coastal Habitats of the Salem Sound Watershed with the Communities of Manchester, Beverly, Danvers,
Peabody, Salem, and Marblehead.
Salem Sound Clean Beaches and Streams Program
2005 Report The following report is a summary of results from water quality testing that has occurred over the past summer by Salem Sound Coastwatch’s Clean Beaches and Streams Program and by Salem Sound municipalities. The data is displayed in tables and graphs below: Table 1. displays results of tests performed by Salem Sound Coastwatch (SSCW) at coastal outfall pipes and streams.
US EPA National Water Quality Inventory reports runoff from urbanized areas is the leading source of water quality impairments to surveyed estuaries, harming fish and marine plants and animals, killing native vegetation, and making recreational areas unsafe and unpleasant.
(EPA 841-F-03-003) Approach and Methods While municipalities test bathing waters at public beaches, Salem Sound Coastwatch focuses on storm water outfall pipes and coastal streams, many of which are located on bathing beaches and near boating areas. SSCW’s samples are collected at sites of stormwater discharge at low tide. As a result, bacterial counts tend to be higher than from samples taken from the water in the middle of a bathing beach. However, results from outfall pipes and streams indicate that contaminants are still making their way into our area waters. EPA has concluded that Enterococcus is the best indicator organism in marine waters to show a correlation with adverse human health effects. Therefore, all states have been mandated to use this standard by April of 2004. During the 2003 transition year, SSCW tested for both fecal coliform and Enterococcus. In 2004 and 2005, all Salem Sound communities and SSCW used Enterococcus as the indicator organism for marine water testing. The Salem Sound municipalities test bathing waters at least once a week during the swimming season, more frequently if Enterococcus levels were shown to be high. Beaches are closed if a single test reports Enterococcus levels greater than 104 CFU/100mL or if the geometric mean of the most recent five (5) Enterococcus levels within the same bathing season exceeds 35 colonies per 100mL (Massachusetts state sanitary code 105 CMR 445.000). This is a statistical averaging method used to even out the average when dealing with a wide range of numbers.
52
Definition of Dry vs. Wet Conditions Rain can cause temporary elevated bacterial counts at discharge sites and within nearshore coastal waters. Runoff from impervious surfaces (parking lots, roofs, streets) flushes contaminants through storm drains, bringing pollution onto the beaches and other coastal habitats.
Salem Sound Coastwatch defines “dry” conditions vs. “wet” differently than the municipalities. Under SSCW’s definition, dry conditions are less than 0.2" precipitation the day of sampling or less than 0.5" within the three days preceding sampling. Wet conditions are defined as more than 0.2" precipitation on the day of sampling or more than .5" within three days preceding sampling. Protocols for wet weather sampling are the same as for dry weather sampling.
The municipalities define wet conditions, or a “storm” event, as any occurrence of precipitation during the sampling or within the 24 hours preceding the sampling.
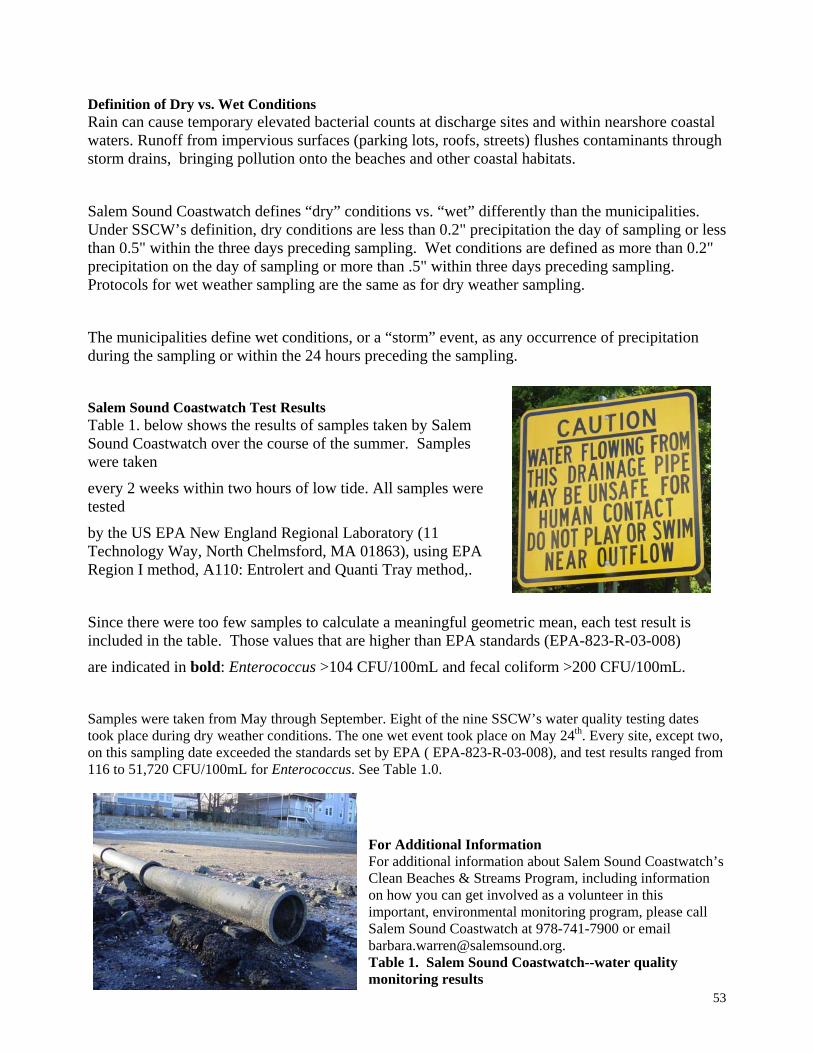
Salem Sound Coastwatch Test Results Table 1. below shows the results of samples taken by Salem Sound Coastwatch over the course of the summer. Samples were taken
every 2 weeks within two hours of low tide. All samples were tested
by the US EPA New England Regional Laboratory (11 Technology Way, North Chelmsford, MA 01863), using EPA Region I method, A110: Entrolert and Quanti Tray method,.
Since there were too few samples to calculate a meaningful geometric mean, each test result is included in the table. Those values that are higher than EPA standards (EPA-823-R-03-008)
are indicated in bold: Enterococcus >104 CFU/100mL and fecal coliform >200 CFU/100mL.
Samples were taken from May through September. Eight of the nine SSCW’s water quality testing dates took place during dry weather conditions. The one wet event took place on May 24th. Every site, except two, on this sampling date exceeded the standards set by EPA ( EPA-823-R-03-008), and test results ranged from 116 to 51,720 CFU/100mL for Enterococcus. See Table 1.0.
For Additional Information For additional information about Salem Sound Coastwatch’s Clean Beaches & Streams Program, including information on how you can get involved as a volunteer in this important, environmental monitoring program, please call Salem Sound Coastwatch at 978-741-7900 or email [email protected]. Table 1. Salem Sound Coastwatch--water quality monitoring results
53

2005 from outfall pipes and streams in the Salem Sound Watershed. WET DRY DRY DRY DRY DRY DRY DRY DRY
Marblehead Site # Test 5/24 6/7 6/21 7/5 7/26 8/9 8/23 9/6 9/20Stramski Beach - Stream draining across beach 722 Ent 364 75 293 195 960 1,038 6,932 ns 2,318
Stramski Way - Dodge Road drainage 722a Ent 587 91 666 1,350 2,452 996 4,480 >9,678 4,813
Stramski Way - Pitman Street drainage 722b Ent 1,664 nd 54 100 1,140 4 7,945 3,080 5,654
Doliber Cove Creek-Grace Oliver Beach 700 Ent 6,270 97 159 174 52 507 No flow ns ns
Riverhead Beach Culvert-facing on left 701A Ent 933 124 265 ns 278 310 334 192 384
Riverhead Beach Culvert-facing on right 701B Ent 953 81 281 ns 276 289 162 90 1,164
Preston Beach Culvert 800 Ent ns ns 21 100 ns ns ns ns nsBeverlyDane St. Beach - western storm drain at beach 322 Ent 1,041 4 239 25 105 64 79 34 16
Dane St. Beach - Lawrence Street brook at beach 321 Ent 193 117 222 34 744 129 152 52 62
Rice Beach - stream outfall onto beach 214 Ent 373 54 ns 89 6,932 No flow 1,302 ns No flow
Rice Beach - stream draining from under shed 214A Ent 165 860 ns 44 774 2,190 5,199 ns 3,683
Brackenbury Beach - stream from 4' x 4' Culvert 213 Ent 116 344 167 168 420 250 518 179 287
Concrete culvert to the east (18"dia.) 213A Ent 48 21 159 672 826 No flow 44 138 208
Storm drain 100 ft west of road 222 Ent 229 600 132 77 2,452 420 No flow 155 512
Wilson Street - beach seepage below steel upright 350s Ent ns ns nd ns ns ns ns ns ns
Kernwood Bridge - Beverly 352 Ent ns ns nd ns 12 115 54 820 ns
SalemNorth River - upstream of Rt. 114 overpass, Commercial St 537 Ent 2,460 229 2,318 839 >9,678 8,664 9,678 5,654 >9,678
North River - Commercial Way near foot bridge 559 Ent 38,730 21 127 30 263 507 826 352 5,654
Juniper Beach - storm drain on beach 620 Ent 4,100 198,630 81,640 8,390 30,760 4,814 14,210 126 >9,678
Palmer Cove - storm drain at Shetland Park 629 Ent 825 558 1,730 1,230 405 468 3,266 1,954 1,741
Derby Wharf - storm drain 630 Ent 32,700 510 475 744 1,549 9,678 2,747 395 471
Palmer Cove-storm drain below Playground 631 Ent 34 8 8 4 8 12 4,480 86 30
Willows Ave. Beach 642 Ent 51,720 215 3,300 6,240 373 >24,196 1,642 334 >9,678
Manchester
Bennett's Brook (at Bennett Street) 149 Ent ns 12 187 163 2,452 1,642 2,318 1,252 ns
Coolidge Point - Black Beach 151 Ent 140 48 105 54 5,654 606 2,747 120 587
Danvers
Sandy Beach - outfall pipe 430 Ent ns ns ns ns ns 147 ns ns ns
ENT = enterococci Numbers in bold exceed standards s specified by the EPA (EPA-823-R-03-008):ns = not sampled Enterococcus> 104 CFU/100mL nd = not detected
54

55
Appendix I.
Biomarine Inc. and US EPA Chain of Custody/Data Sheets

56

57
58
Appendix J.
Biomarine, Inc. QA/QC/SOP Manual,
DEP Certification

Biomarine’s complete QA – S.O.P. is available in PDF from Salem Sound Coastwatch.
59

60
61
Appendix K.
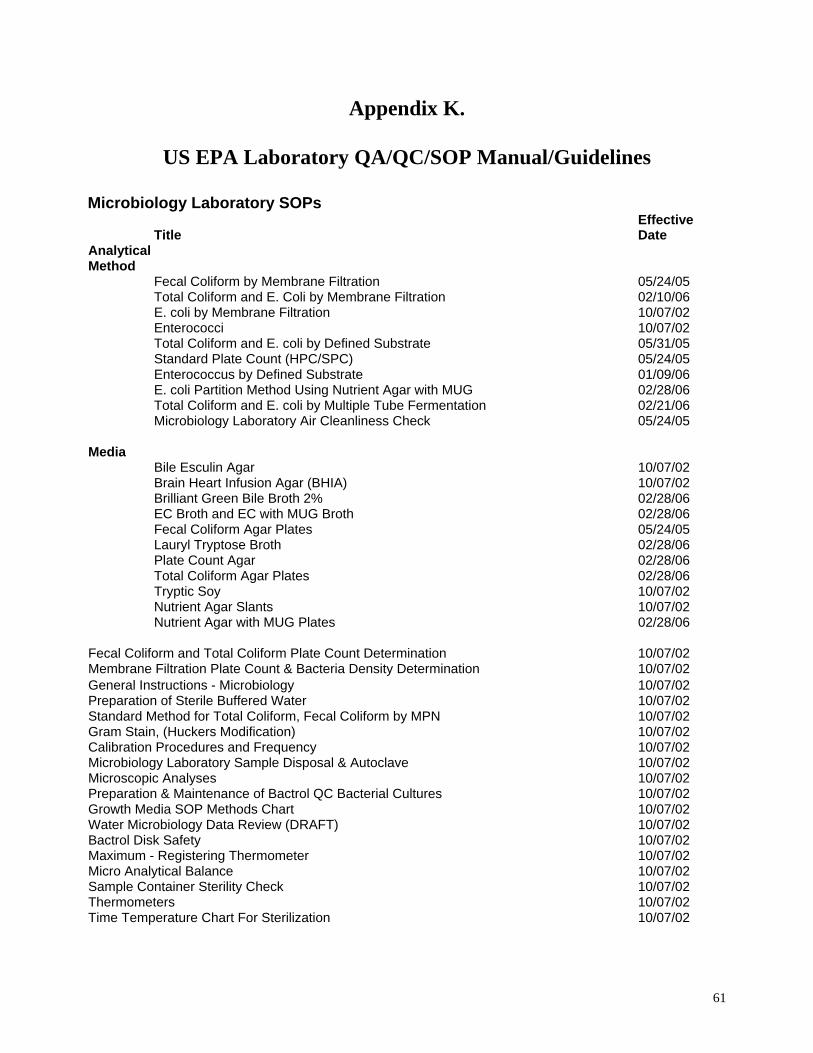
US EPA Laboratory QA/QC/SOP Manual/Guidelines
Microbiology Laboratory SOPs
Title Effective Date
Analytical Method Fecal Coliform by Membrane Filtration 05/24/05 Total Coliform and E. Coli by Membrane Filtration 02/10/06 E. coli by Membrane Filtration 10/07/02 Enterococci 10/07/02 Total Coliform and E. coli by Defined Substrate 05/31/05 Standard Plate Count (HPC/SPC) 05/24/05 Enterococcus by Defined Substrate 01/09/06 E. coli Partition Method Using Nutrient Agar with MUG 02/28/06 Total Coliform and E. coli by Multiple Tube Fermentation 02/21/06 Microbiology Laboratory Air Cleanliness Check 05/24/05 Media Bile Esculin Agar 10/07/02 Brain Heart Infusion Agar (BHIA) 10/07/02 Brilliant Green Bile Broth 2% 02/28/06 EC Broth and EC with MUG Broth 02/28/06 Fecal Coliform Agar Plates 05/24/05 Lauryl Tryptose Broth 02/28/06 Plate Count Agar 02/28/06 Total Coliform Agar Plates 02/28/06 Tryptic Soy 10/07/02 Nutrient Agar Slants 10/07/02 Nutrient Agar with MUG Plates 02/28/06 Fecal Coliform and Total Coliform Plate Count Determination 10/07/02 Membrane Filtration Plate Count & Bacteria Density Determination 10/07/02 General Instructions - Microbiology 10/07/02 Preparation of Sterile Buffered Water 10/07/02 Standard Method for Total Coliform, Fecal Coliform by MPN 10/07/02 Gram Stain, (Huckers Modification) 10/07/02 Calibration Procedures and Frequency 10/07/02 Microbiology Laboratory Sample Disposal & Autoclave 10/07/02 Microscopic Analyses 10/07/02 Preparation & Maintenance of Bactrol QC Bacterial Cultures 10/07/02 Growth Media SOP Methods Chart 10/07/02 Water Microbiology Data Review (DRAFT) 10/07/02 Bactrol Disk Safety 10/07/02 Maximum - Registering Thermometer 10/07/02 Micro Analytical Balance 10/07/02 Sample Container Sterility Check 10/07/02 Thermometers 10/07/02 Time Temperature Chart For Sterilization 10/07/02

62
EPA Microbiology Laboratory The laboratory will follow the Ecosystem Assessment Unit Ecology Monitoring Team Laboratory Quality Assurance Plan, which provides guidelines to ensure reliability and validity of their work. Compliance with the Ecosystem Assessment Unit Ecology Monitoring Team Laboratory Quality Assurance Plan is coordinated and monitored by the Biology Quality Assurance Officer (QAO)- Dave McDonald . Laboratory blanks are run with each Enterococcus sample set. Sample data is reported as qualified if the lab blank shows any contamination. All laboratory procedures are documented in writing as either Standard Operating Procedures (SOP) or Method Procedures (MP) which is edited and controlled by the Microbiologist QAO. Dave McDonald or his designee will review and approve the release of the microbiology data reports.
Laboratory Quality Control Procedures Parameter
Method
Technique
Quality Control Measure
Quality Control Criteria
Frequency
MDL
RL
Enterococcus
Enterolert with Idexx Quanti-tray
MPN
Lab blanks, Pos/Neg controls, 10% dup quanti-tray count by analysts
Lab blanks must have no growth, positive control must produce fluorescence, negative control must not fluoresce
blanks/controls per batch, dup counts monthly
1 col/100mL
4 col/100mL
EPA – OEME Laboratory Scheduling • Up to 25 samples can be analyzed per sampling date for one parameter. Multiple parameters can
be analyzed per sample with a reduction in the total number of samples taken. • Two sampling dates per month will be pre-scheduled. • Samples can be delivered to the EPA lab Monday through Thursday during the hours of 7:00am –
2:00pm. • Confirmation of sample delivery date and time can be made by contacting Nathan Raines – 617-
918-8328. • Final report will be released within 30 calendar days – preliminary data can be released sooner
upon request. • Scheduled sampling dates may be rescheduled (due to weather, etc.) only upon the availability of
the laboratory. Laboratory scheduling conflicts may prohibit a predetermined sampling date from being rescheduled.
63
Appendix L.
Salem Sound Coastwatch Clean Beaches and Streams Program Brochure

64

65

66
Appendix M.
Signature page from original QAPP May 2001
Signature page from revised QAPP
May 2005

67

68