Embed Size (px)
Citation preview
Quality Assurance Project Plan For the EPA School Air Toxics Monitoring Program
July 2009
Quality Assurance Project Plan for the EPA School Air Toxics Monitoring Program
Category II QAPP
U.S. Environmental Protection Agency Office of Air Quality Planning and Standards
Air Quality Assessment Division Research Triangle Park, North Carolina, 27711
i
1.0 Signature Page
Richard Wayland Date U.S. Environmental Protection Agency OAQPS – AQAD Director Lewis Weinstock Date U.S. Environmental Protection Agency Ambient Air Monitoring Group Leader Michael Jones Date U.S. Environmental Protection Agency Program Manager Dennis Mikel Date U.S. Environmental Protection Agency Quality Assurance Program Coordinator Joseph Elkins Date U. S. Environmental Protection Agency OAQPS Quality Assurance Manager
A signed copy of this Quality Assurance Project Plan is stored in the Quality Assurance Program Coordinator’s office. Please see the contact in the Acknowledgement Section.
ii
Acknowledgement This Quality Assurance Project Plan (QAPP) was developed internally by EPA’s Office of Air Quality Planning and Standards (OAQPS), Region 3 and Region 4. Additional material and text were provided by EPA’s Urban Air Toxics Monitoring Program Contractor; Eastern Research Group (ERG). Text provided by ERG is noted throughout the document. For more information on ERG’s or its subcontractor’s QAPP or procedures, contact ERG directly at 919-468-7800 or by email at http://www.erg.com/contact/res.htm. This QAPP was generated using the EPA QA regulations and guidance as described in EPA QA/R-5, EPA Requirements for Quality Assurance Project Plans and the accompanying document, EPA QA/G-5, Guidance for Quality Assurance Project Plans. This is a Category II QAPP, is structured as such and has all pertinent elements of a Category II QAPP, as suggested by the R-5 document. The R-5 guidance on developing QAPPs can be found at http://www.epa.gov/quality/qa_docs.html There are several companion documents to this QAPP, the School Air Toxics Monitoring Plan, dated July 8, 2009, and several instrument Standard Operating Procedures (SOPs). Information on the school locations, description of the monitoring design, schedule and other information are included in the Monitoring Plan. These documents can be downloaded at the following website: http://www.epa.gov/ttn/amtic/airtoxschool.html For questions or comments please contact: Dennis Mikel, EPA-OAQPS-AQAD at [email protected] or 919-541-5511 Mike Jones, EPA-OAQPS-AQAD at [email protected] or 919-541-0528 Lewis Weinstock, EPA-OAQPS-AQAD at [email protected] or 919-541-3661
iii
Acronyms and Abbreviations APCD Air Pollution Control or Management District ANSI American National Standards Institute AQS Air Quality System ASTM American Society for Testing and Materials CAA Clean Air Act CFR Code of Federal Regulations CoC chain of custody CV coefficient of variance DAS data acquisition system DNPH di-nitro phenyhydrazine DQA data quality assessment DQOs data quality objectives ECHD electron capture – hall detector EDO environmental data operation EPA Environmental Protection Agency ERG Eastern Research Group GC/MS gas chromatography/mass spectrometry GIS geographical information systems GPS geographic positioning system HAPs hazardous air pollutants HPLC high pressure liquid chromatography ICP/MS ion coupled plasma/mass spectrometry ISO International Standards Organization IUPAC International Union of Pure and Applied Chemists IO in-organic LAN local area network LIMS laboratory information management system MDL minimum detection limit MQOs measurement quality objectives NATA National Air Toxics Assessment NATTS National Air Toxics Trends Stations NIOSH National Institute of Occupational Safety and Health NIST National Institute of Standards and Technology NWS National Weather Service OAQPS Office of Air Quality Planning and Standards OSHA Occupational Safety and Health Administration PAH polycyclic aromatic hydrocarbons PC personal computer PD percent difference PM10 particulate matter – 10 microns PT proficiency testing QA/QC quality assurance/quality control QA quality assurance
iv
Acronyms and Abbreviations
QAFR quality assurance final report QAM quality assurance manager QAPP quality assurance project plan QC quality control RSEI Risk-Screening Environmental Indicators SATMP School Air Toxics Monitoring Program S/L State/Local SOP standard operating procedure TAD technical assistance document TO toxic organic TSA technical system audit TSP total suspended particulates UATMP Urban Air Toxics Monitoring Program UV ultra-violet VOC volatile organic compound
v
Tables
Number Description Page No.
4-1 List of Methods and Target Analytes 7 5-1 Assessment Schedule 10 5-2 Schedule of Critical SATMP Activities 11 6-1 MQOs for Metals 19 6-2 MQOs for VOCs 19 6-3 MQOs for other compounds 20 7-1 SATMP Data and Records Storage 21 8-1 Scheduled Monitoring Activities 23 9-1 List of Target Analytes 26 9-2 Sample Setup, Run and Recovery Dates 27 9-3 Field Supplies 28 9-4 Temperature Requirements 30 9-5 Holding Times 30 12-1 Sample Invalidation Criteria for Collocated Data 44 13-1 Inspections in the Laboratory 46 17-1 Assessment Summary 58
vi
Figures
Figure No. Description Page No.
3-1 10-1 10-2 10-3
Overall Structure of the SATMP UATMP Sample Data Sheet Canister Tag Carbonyl Chain of Custody Form
1 32 33 34
vii
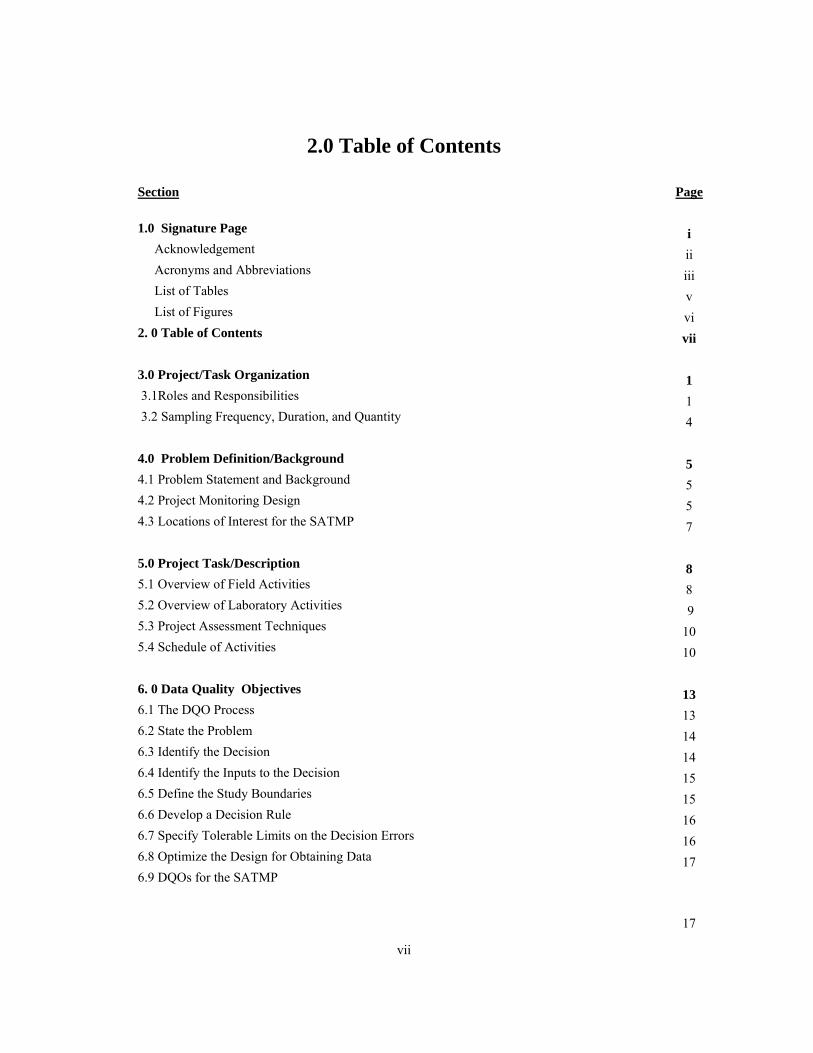
2.0 Table of Contents
Section Page 1.0 Signature Page i Acknowledgement ii Acronyms and Abbreviations iii List of Tables v List of Figures vi 2. 0 Table of Contents vii 3.0 Project/Task Organization 1 3.1Roles and Responsibilities 1 3.2 Sampling Frequency, Duration, and Quantity 4 4.0 Problem Definition/Background 5 4.1 Problem Statement and Background 5 4.2 Project Monitoring Design 5 4.3 Locations of Interest for the SATMP 7 5.0 Project Task/Description 8 5.1 Overview of Field Activities 8 5.2 Overview of Laboratory Activities 9 5.3 Project Assessment Techniques 10 5.4 Schedule of Activities 10 6. 0 Data Quality Objectives 13 6.1 The DQO Process 13 6.2 State the Problem 14 6.3 Identify the Decision 14 6.4 Identify the Inputs to the Decision 15 6.5 Define the Study Boundaries 15 6.6 Develop a Decision Rule 16 6.7 Specify Tolerable Limits on the Decision Errors 16 6.8 Optimize the Design for Obtaining Data 17 6.9 DQOs for the SATMP 17
viii
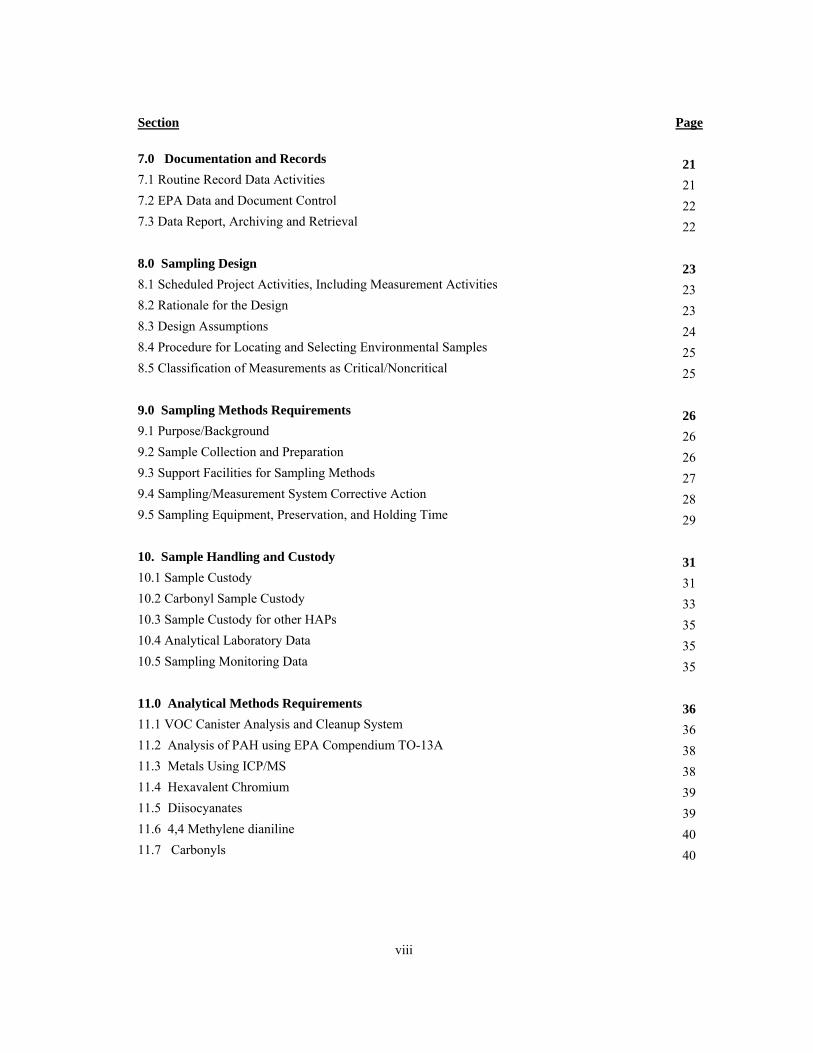
Section Page 7.0 Documentation and Records 21 7.1 Routine Record Data Activities 21 7.2 EPA Data and Document Control 22 7.3 Data Report, Archiving and Retrieval 22 8.0 Sampling Design 23 8.1 Scheduled Project Activities, Including Measurement Activities 23 8.2 Rationale for the Design 23 8.3 Design Assumptions 24 8.4 Procedure for Locating and Selecting Environmental Samples 25 8.5 Classification of Measurements as Critical/Noncritical 25 9.0 Sampling Methods Requirements 26 9.1 Purpose/Background 26 9.2 Sample Collection and Preparation 26 9.3 Support Facilities for Sampling Methods 27 9.4 Sampling/Measurement System Corrective Action 28 9.5 Sampling Equipment, Preservation, and Holding Time 29 10. Sample Handling and Custody 31 10.1 Sample Custody 31 10.2 Carbonyl Sample Custody 33 10.3 Sample Custody for other HAPs 35 10.4 Analytical Laboratory Data 35 10.5 Sampling Monitoring Data 35 11.0 Analytical Methods Requirements 36 11.1 VOC Canister Analysis and Cleanup System 36 11.2 Analysis of PAH using EPA Compendium TO-13A 38 11.3 Metals Using ICP/MS 38 11.4 Hexavalent Chromium 39 11.5 Diisocyanates 39 11.6 4,4 Methylene dianiline 40 11.7 Carbonyls 40
ix
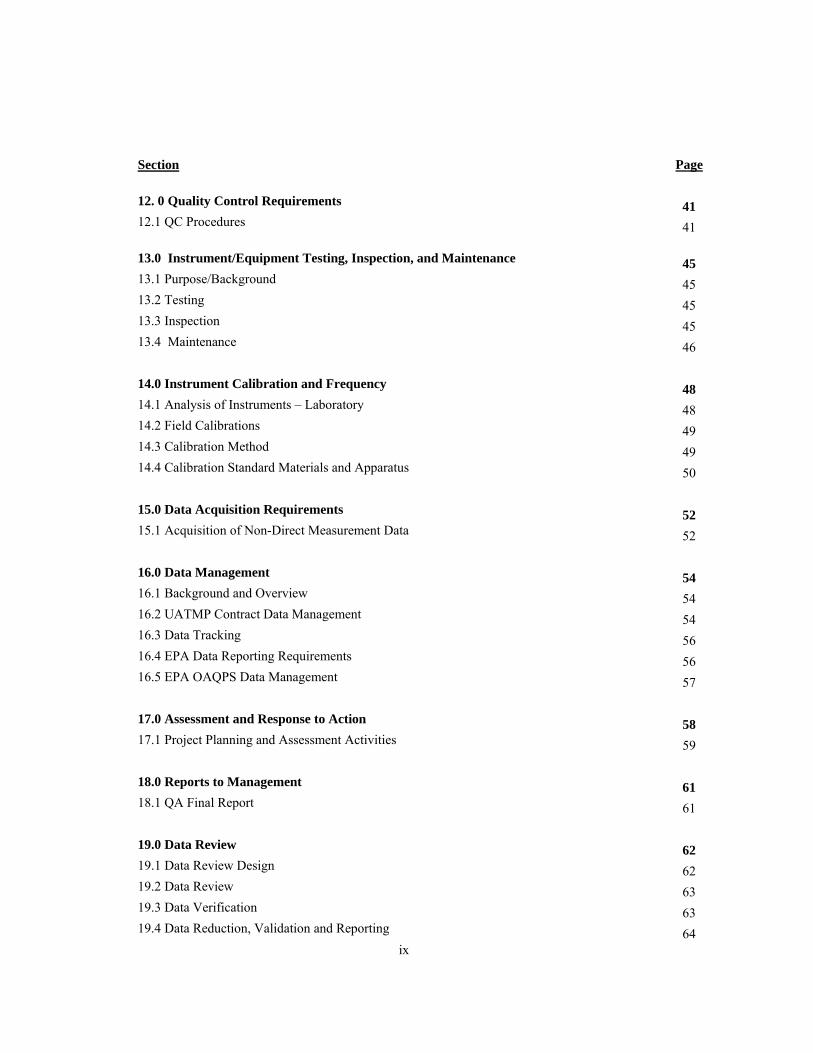
Section Page 12. 0 Quality Control Requirements 41 12.1 QC Procedures 41
13.0 Instrument/Equipment Testing, Inspection, and Maintenance 45 13.1 Purpose/Background 45 13.2 Testing 45 13.3 Inspection 45 13.4 Maintenance 46 14.0 Instrument Calibration and Frequency 48 14.1 Analysis of Instruments – Laboratory 48 14.2 Field Calibrations 49 14.3 Calibration Method 49 14.4 Calibration Standard Materials and Apparatus 50 15.0 Data Acquisition Requirements 52 15.1 Acquisition of Non-Direct Measurement Data 52 16.0 Data Management 54 16.1 Background and Overview 54 16.2 UATMP Contract Data Management 54 16.3 Data Tracking 56 16.4 EPA Data Reporting Requirements 56 16.5 EPA OAQPS Data Management 57 17.0 Assessment and Response to Action 58 17.1 Project Planning and Assessment Activities 59 18.0 Reports to Management 61 18.1 QA Final Report 61 19.0 Data Review 62 19.1 Data Review Design 62 19.2 Data Review 63 19.3 Data Verification 63 19.4 Data Reduction, Validation and Reporting 64
x
Section Page 20.0 Data Validation, Verification and Analysis 65 20.1 Process for Validating and Verifying Data 65 20.2 Data Analysis 65 21.0 Reconciliation with Data Quality Objectives 67 21.1 Reconciling Results with DQOs 67 21.2 Five Steps of DQA Process 67 Appendix A: Schools Air Toxics Ambient Monitoring Plan, dated July 8, 2009
SATMP QAPP Revision No: 4.9
Date: 07/09 Page 1 of 68
3.0 Project/Task Organization
3.1 Roles and Responsibilities
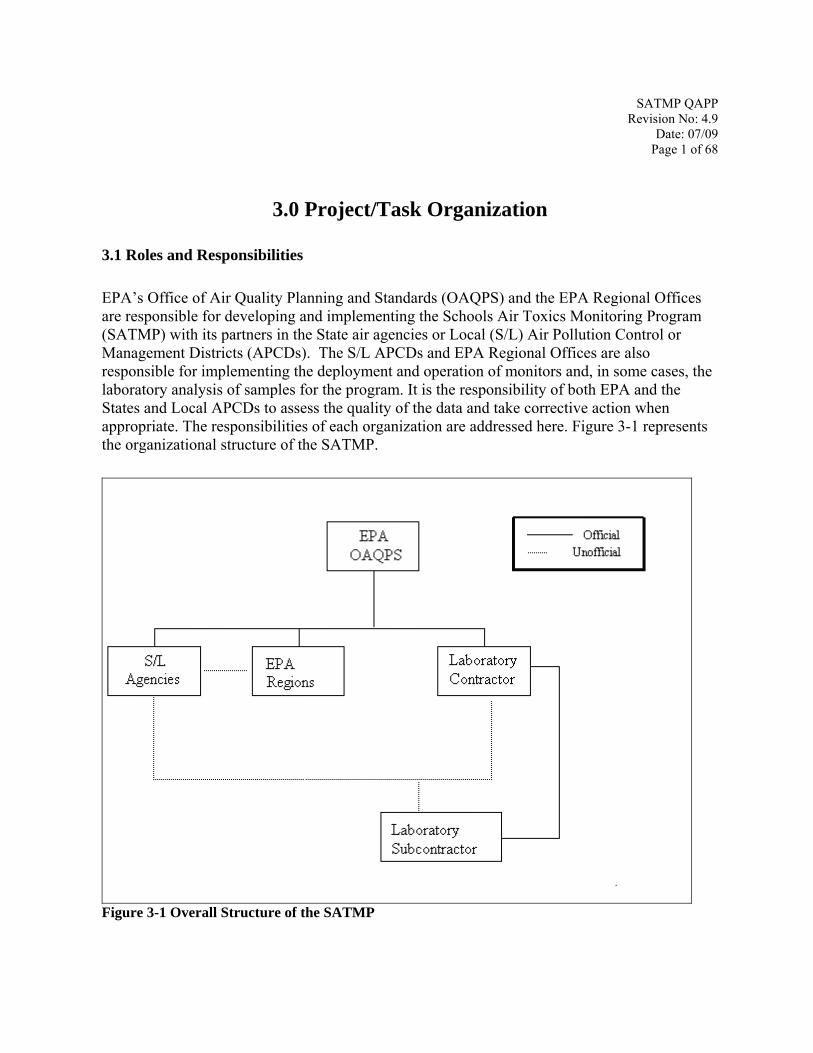
EPA’s Office of Air Quality Planning and Standards (OAQPS) and the EPA Regional Offices are responsible for developing and implementing the Schools Air Toxics Monitoring Program (SATMP) with its partners in the State air agencies or Local (S/L) Air Pollution Control or Management Districts (APCDs). The S/L APCDs and EPA Regional Offices are also responsible for implementing the deployment and operation of monitors and, in some cases, the laboratory analysis of samples for the program. It is the responsibility of both EPA and the States and Local APCDs to assess the quality of the data and take corrective action when appropriate. The responsibilities of each organization are addressed here. Figure 3-1 represents the organizational structure of the SATMP.
Figure 3-1 Overall Structure of the SATMP

SATMP QAPP Revision No: 4.9
Date: 07/09 Page 2 of 68
3.1.1 Office of Air Quality Planning and Standards EPA OAQPS is charged under the authority of the Clean Air Act (CAA) to protect and enhance the quality of the nation’s air. OAQPS sets national emissions standards for air toxics by industry group, and works with states and local agencies to monitor these pollutants which are considered harmful to public health or welfare. OAQPS evaluates the need to regulate potential air pollutants, especially air toxics, and develops national standards and works with S/L APCDs to develop plans for meeting these standards. Here are some of the roles and responsibilities for OAQPS in the SATMP; Take the lead role in implementing the program; Establish “a cross-Agency strike team” to implement the program; Examine available information from external and internal sources to create the list of
schools that require monitoring; Ensure that the methods and procedures used in making air pollution measurements are
adequate to meet the programs objectives and that the resulting data are of satisfactory quality;
Communicate technical information to the Regions and the S/L APCDs; Provide up-front support (i.e., equipment acquisition and procure laboratory support); Evaluate the performance, through Technical Systems Audits (TSAs) of laboratories
making air pollution measurements; Render technical assistance to the EPA Regional Offices and air pollution monitoring
community; and, Provide analysis and interpretation of the results and communicate those results to the
EPA Administrator and the public at large. 3.1.2 EPA Regional Offices The EPA Regional Offices will address environmental issues related to the States within their jurisdiction and administer the program. The major quality assurance (QA) responsibilities of EPA's Regional Offices, in regards to the SATMP, are the coordination of field and in some cases the laboratory quality control (QC) and QA matters at the Regional levels with the S/L agencies. The EPA Regional Offices are responsible for some of the technical aspects of the program including: Reviewing and guiding the program goals; Reviewing and developing the QAPP; Evaluating quality system performance, through TSAs (if needed) and network siting and
reviews; and,
SATMP QAPP Revision No: 4.9
Date: 07/09 Page 3 of 68
Acting as a liaison by making available the technical and quality assurance information developed by EPA Headquarters and the Region to the S/L APCDs, and making EPA Headquarters aware of any the unmet quality assurance objectives.
3.1.3 States and Local APCDs The major responsibility of S/L APCDs is the implementation of a satisfactory monitoring program, which would naturally include the implementation of an appropriate QA/QC program. It is the responsibility of S/L agencies to implement QA/QC programs in the field portion of this program, in their own laboratories, if utilized, and in any consulting and contractor laboratories which they may use to obtain data or information. Here is a list of some of the responsibilities of the S/L APCDs; Work closely with EPA OAQPS/Regional staff and school staff to site the monitoring
stations; If utilized, procure laboratory services to analyze the data; Receive and inspect unexposed samples to make sure they are ready for sampling; Operate the monitoring samplers according to the schedule stated in this QAPP; Ship the exposed samples to the laboratory performing the analysis; Participate in the screening and analysis of the data, and; In co-ordination with EPA, communicate with the schools and public about the results;
and, Follow the field approved field SOPs when operating monitors.
3.1.4 Laboratory Contractor The SATMP requires that air toxic samples be analyzed in accordance to strict QA/QC requirements as defined in Section 6.9. At this time, the EPA recommends that all samples be analyzed by OAQPS’ Urban Air Toxics Monitoring Program (UATMP) contract laboratory. It is possible that several S/L APCDs may decide to analyze the samples with the laboratories under their jurisdiction. If this is the case, then the S/L laboratories must meet the requirements as stated in Section 6.8. Demonstration of their ability to be able to meet the Measurement Quality Objectives (MQOs) is required before S/L agencies can analyze samples for this program. OAQPS will review each laboratory’s capabilities on a case by case basis. S/L laboratories will participate in an independent laboratory Technical System Audit (TSA) and analyze Proficiency Testing (PT) samples before analysis can be performed for this program.
SATMP QAPP Revision No: 4.9
Date: 07/09 Page 4 of 68
Here is a partial list of the laboratory duties: Sending sample containers/filters to the field operators, following strict requirements on
shipping and handling according to their Standard Operating Procedure (SOPs); Receiving samples from the field; Analyzing the samples relative to their QA/QC procedures and SOPs; Performing data validation procedures on the data; Troubleshooting and repairing any laboratory instruments that malfunction; and, Reporting all data to EPA as required.
The UATMP contractor does not have the ability to do certain analyses, such as the Diisocyanates and 4,4 Methylene dianiline, which are discussed later. Therefore, the UATMP contractor will subcontract these analyses. Samples that must be analyzed by the subcontractor will be shipped directly to the subcontract laboratory to expedite the analyses. It is the UATMP contractor’s responsibility to get data and information from the subcontractor in a timely manner and to maintain adherence to required chain of custody and other procedural requirements.
3.2 Sampling Frequency, Duration, and Quantity Ambient air sampling shall be conducted on a 1 in 6 day schedule, details of which must be coordinated with the EPA and national contract laboratory. Start dates will vary by site as a function of monitoring setup completion. Once monitoring operations have commenced, the base (i.e., minimum duration) sampling period is 60 days; given a 1 in 6 sampling schedule, the base sampling period is intended to result in 10 valid samples. There may be cases in which the 60 day sampling period is deemed to be insufficient (e.g., invalidated sample(s), insufficiently representative data, etc.) and thus extended, typically not to exceed a total duration of 90 days. A companion document to this QAPP, the “Schools Air Toxics Ambient Monitoring Plan, dated July 8, 2009” (hereby known as The Monitoring Plan) has detailed information in section 3.2. The S/L APCDs are authorized to collect up to three additional random samples that will be set and run at the discretion of the S/L APCDs. Details on this are also in Section 3.2 of the Monitoring Plan. The Monitoring Plan can be downloaded from the following website: http://www.epa.gov/ttn/amtic/airtoxschool.html.
SATMP QAPP Revision No: 4.9
Date: 07/09 Page 5 of 68
4.0 Problem Definition/Background
4.1 Problem Statement and Background 4.1.1 Introduction EPA will monitor air quality at a number of schools as part of an initiative to understand whether outdoor toxic air pollution poses health concerns to schoolchildren. This quality assurance plan addresses one aspect of the initiative; ambient air monitoring. EPA developed a list of priority schools for an initial round of monitoring that is expected to last a minimum of 60 days. The agency selected the schools using EPA’s National Scale Air Toxics Assessment (NATA), results from a USA Today® analysis, which is based on EPA’s Risk-Screening and Environmental Indicators (RSEI) model and after consulting with state and local air agencies. 4.1.2 Project Objectives This ambient air monitoring exercise will yield data of sufficient quality that allow a preliminary assessment of any potential air toxics impacts specific to the school at which the monitoring occurred. This preliminary assessment will be used to determine subsequent steps that may include:
1) Terminating monitoring where assessments indicate low impacts, 2) Pursuing long-term emission and risk reduction activities (such as enforcement or other actions) where monitoring data show potentially unacceptable impacts, or 3) Considering longer-term monitoring where initial data are inclusive and additional information is needed to better characterize the potential for impacts
4.2 Project Monitoring Design
4.2.1 Meteorological Measurements
Site specific meteorological parameters that will be measured consist of wind speed and direction data. The type of sensor provided will be of sufficient quality for its intended use. OAQPS is purchasing sonic anemometers and data acquisition systems that will be able to collect both scalar and vector data. Meteorological information is gathered from the National Weather Service (NWS) stations across the nation. Parameters include: temperature, relative humidity, barometric pressure, rainfall, wind speed, wind direction, cloud type/layers, cloud cover and visibility range. OAQPS staff will retrieve data on temperature and rainfall from
SATMP QAPP Revision No: 4.9
Date: 07/09 Page 6 of 68
NWS sites near the schools being monitored, to supplement the at-school wind speed and wind direction data for purposes of interpreting the air quality monitoring results.
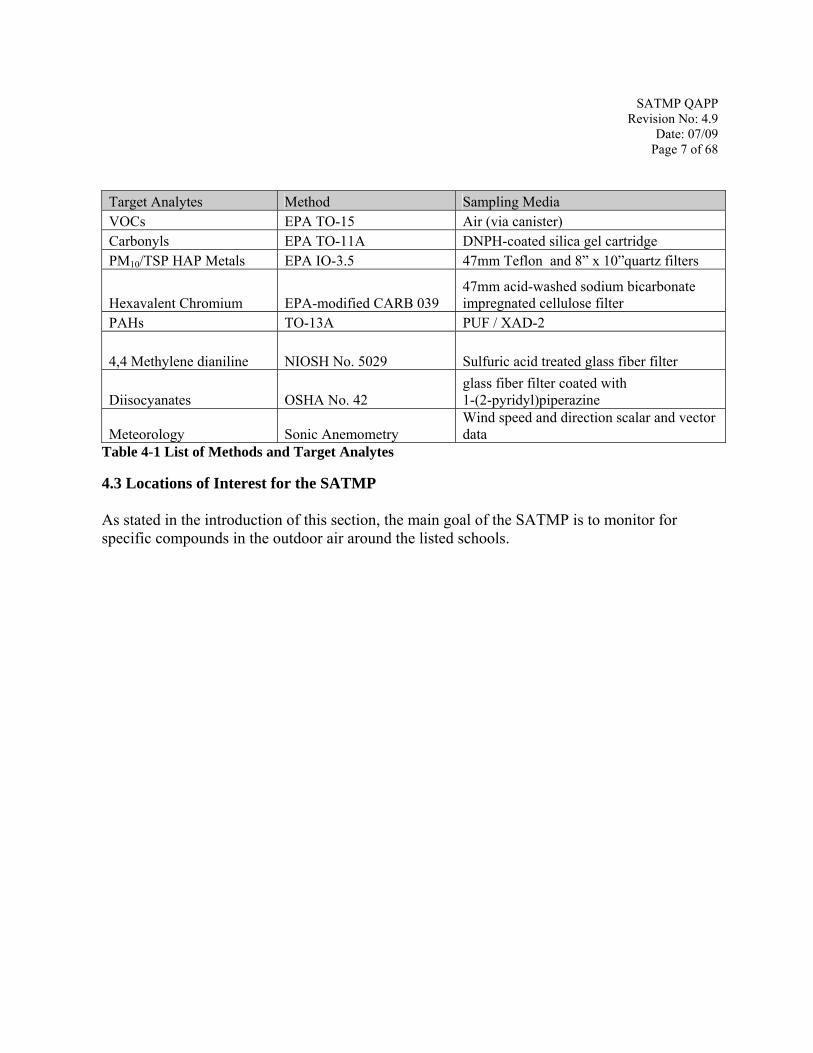
4.2.2 Hazardous Air Pollutants There are currently 187 hazardous air pollutants (HAPs) and pollutant classes that are regulated under the Clean Air Act (CAA). These pollutants, often called air toxics, have been associated with a wide variety of adverse health effects, including cancer, neurological effects, reproductive and developmental effects. Air toxics are emitted from multiple sources, including major stationary, area, and mobile sources, resulting in population exposure to these air toxics as they occur in the environment. While in some cases the public may be exposed to an individual HAP, people more typically experience exposures to multiple HAPs from many sources. Table 4-1 lists the “classes” of compounds that will be measured in the SATMP. For more information on the instruments that will be used to collect these samples, please see Table 4-1 lists the analytes by chemical class or group. Current information indicates that specific pollutants in these groups may be present at the schools. While we are focusing our effort on monitoring for specific pollutants, the measurement methods used for certain classes of pollutants will detect other chemicals as well. For instance, under the class of compounds known as “VOCs,” benzene is a pollutant that may be present at certain schools. When the laboratory performs the analysis for benzene, there are a number of other compounds that can be analyzed, such as 1, 3 butadiene. This situation exists for the other classes of compounds as well. We will report concentrations for all chemicals detected. The Monitoring Plan has the full list of compounds that will be evaluated by the methods chosen by this program. Please note that the pollutants of interest for this program are listed in Section 6.9, Tables 6-1through 6-3.
SATMP QAPP Revision No: 4.9
Date: 07/09 Page 7 of 68
Target Analytes Method Sampling Media VOCs EPA TO-15 Air (via canister) Carbonyls EPA TO-11A DNPH-coated silica gel cartridge PM10/TSP HAP Metals EPA IO-3.5 47mm Teflon and 8” x 10”quartz filters
Hexavalent Chromium EPA-modified CARB 039 47mm acid-washed sodium bicarbonate impregnated cellulose filter
PAHs TO-13A PUF / XAD-2
4,4 Methylene dianiline NIOSH No. 5029 Sulfuric acid treated glass fiber filter
Diisocyanates OSHA No. 42 glass fiber filter coated with 1-(2-pyridyl)piperazine
Meteorology Sonic Anemometry Wind speed and direction scalar and vector data
Table 4-1 List of Methods and Target Analytes 4.3 Locations of Interest for the SATMP As stated in the introduction of this section, the main goal of the SATMP is to monitor for specific compounds in the outdoor air around the listed schools.
SATMP QAPP Revision No: 4.9
Date: 07/09 Page 8 of 68
5.0 Project Task/Description The measurement goal of the SATMP is to estimate the concentration, in standard units of micrograms per cubic meter (ug/m3), nanograms per cubic meter (ng/m3) and parts per billion/volume (ppbv) of air toxic compounds of particulates and gases at the listed schools. This is accomplished by several separate collection media and analytical techniques. Activities for this program are divided into two separate, yet linked activities: field monitoring and laboratory analysis. An overview of the program follows. 5.1 Overview of Field Activities
Ambient air sampling devices will be placed at secure monitoring locations on or near schools. Table 4-1 lists the methods and sampling media used for this program. The Monitoring Plan has the instrument specifications necessary for this program. Appendix A of the Monitoring Plan lists the schools and the pollutants to be monitored. In most cases, the sampling will occur for 24 hours +/- 1 hour, with the exception of Diisocyanates and 4,4 Methylene dianiline. The schedule and timing are discussed in detail in Section 9.2.2 of this QAPP. All of the instruments operated in the field are vendor supplied. The samplers utilized for this program are similar to the instruments described in the Reference Section at the end of this chapter. All of the equipment will be supplied by vendors that specialize in manufacturing these collection devices. Training – EPA is partnering with experienced S/L APCDs to conduct the ambient monitoring aspect of the school air toxics program. EPA expects that monitoring agencies will assign experienced personnel to operate sampling equipment, and that each agency’s prior experience in operating similar criteria pollutant and/or air toxics monitors will provide adequate training to ensure proper operation of equipment during this program. EPA will survey participating monitoring agencies (through Regional Office contacts) to confirm availability of trained personnel, and will support individualized training needs as appropriate, coordinated through visits by Regional Office or Laboratory personnel. In addition and prior to the commencement of sampling, EPA will support one or more monitoring-focused national conference calls to provide opportunities for agency’s to ask clarifying questions and to ensure a common understanding of procedural requirements and expectations. Standard Operating Procedures (SOPs) - EPA will provide field SOPs for each of the methods being deployed in the schools monitoring program, complimenting the existing laboratory SOPs that have been developed by EPA’s analysis contractor. Field SOPs will be completed once the exact type(s) of samplers being procured is established through the contractual process. At that time, field SOPs will be distributed to participating agencies and one or more conference calls will be supported to ensure a complete understanding of the

SATMP QAPP Revision No: 4.9
Date: 07/09 Page 9 of 68
requirements by the individual site operators. EPA personnel will be available throughout the duration of the study to answer site-specific questions and/or handle other operational issues that may arise that may not be specifically described in the field SOPs. 5.2 Overview of Laboratory Activities Laboratory activities for the SATMP include preparing the samples, shipping/receiving, and analysis. Here some activities associated with these phases. Pre-Sampling Receiving filters, canisters or cartridges from the vendors; Checking sample integrity; Conditioning filters, storing canisters and cartridges; Storing samples prior to field use; Packaging filters, canisters and cartridges for field use; Associated QA/QC activities; Maintaining analytical equipment at specified environmental conditions; and; Equipment maintenance and calibrations.
Shipping/Receiving Receiving filters, canisters and cartridges from the field and logging into database; Storing filters, canisters and cartridges; and, Associated QA/QC activities.
Post-Sampling
Checking filter, cartridge and canister integrity and assigning unique codes; Extraction of VOCs from canisters; Extraction of Teflon, quartz and glass fiber filters; Extraction of Di-nitro phenyl-hydrazine (DNPH) bound compounds; Extraction of Polyurethane Foam (PUF) and XAD-2 resin; Analysis of samples extracted; Data entry/upload to the Air Quality System (AQS) database; Storing filters/archiving; Cleaning canisters; and, Associated QA/QC activities and data reporting.
The details for these activities are included in various sections of this document, the laboratory SOPs, and References 1- 8.
SATMP QAPP Revision No: 4.9
Date: 07/09 Page 10 of 68
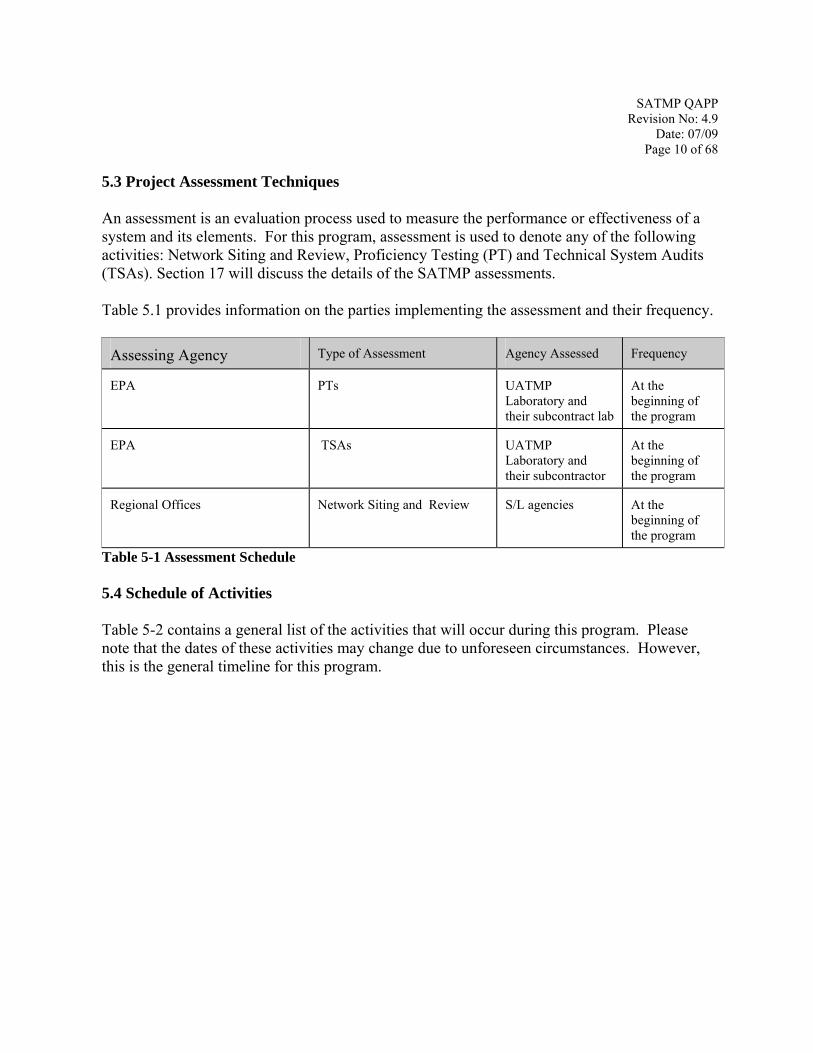
5.3 Project Assessment Techniques An assessment is an evaluation process used to measure the performance or effectiveness of a system and its elements. For this program, assessment is used to denote any of the following activities: Network Siting and Review, Proficiency Testing (PT) and Technical System Audits (TSAs). Section 17 will discuss the details of the SATMP assessments. Table 5.1 provides information on the parties implementing the assessment and their frequency.
Assessing Agency Type of Assessment Agency Assessed Frequency
EPA PTs UATMP Laboratory and their subcontract lab
At the beginning of the program
EPA TSAs UATMP Laboratory and their subcontractor
At the beginning of the program
Regional Offices Network Siting and Review S/L agencies At the beginning of the program
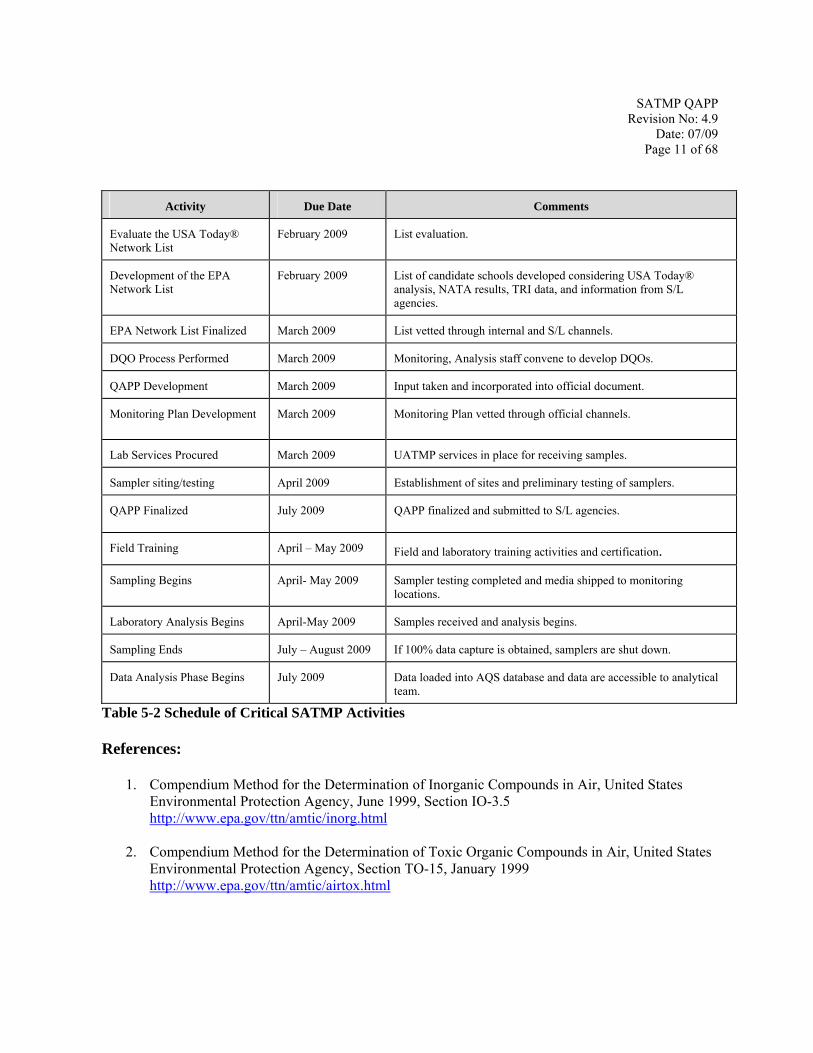
Table 5-1 Assessment Schedule 5.4 Schedule of Activities Table 5-2 contains a general list of the activities that will occur during this program. Please note that the dates of these activities may change due to unforeseen circumstances. However, this is the general timeline for this program.
SATMP QAPP Revision No: 4.9
Date: 07/09 Page 11 of 68
Activity Due Date Comments
Evaluate the USA Today® Network List
February 2009 List evaluation.
Development of the EPA Network List
February 2009 List of candidate schools developed considering USA Today® analysis, NATA results, TRI data, and information from S/L agencies.
EPA Network List Finalized March 2009 List vetted through internal and S/L channels.
DQO Process Performed March 2009 Monitoring, Analysis staff convene to develop DQOs.
QAPP Development March 2009 Input taken and incorporated into official document.
Monitoring Plan Development March 2009 Monitoring Plan vetted through official channels.
Lab Services Procured March 2009 UATMP services in place for receiving samples.
Sampler siting/testing April 2009 Establishment of sites and preliminary testing of samplers.
QAPP Finalized July 2009 QAPP finalized and submitted to S/L agencies.
Field Training April – May 2009 Field and laboratory training activities and certification.
Sampling Begins April- May 2009 Sampler testing completed and media shipped to monitoring locations.
Laboratory Analysis Begins April-May 2009 Samples received and analysis begins.
Sampling Ends July – August 2009 If 100% data capture is obtained, samplers are shut down.
Data Analysis Phase Begins July 2009 Data loaded into AQS database and data are accessible to analytical team.
Table 5-2 Schedule of Critical SATMP Activities References:
1. Compendium Method for the Determination of Inorganic Compounds in Air, United States Environmental Protection Agency, June 1999, Section IO-3.5 http://www.epa.gov/ttn/amtic/inorg.html
2. Compendium Method for the Determination of Toxic Organic Compounds in Air, United States
Environmental Protection Agency, Section TO-15, January 1999 http://www.epa.gov/ttn/amtic/airtox.html
SATMP QAPP Revision No: 4.9
Date: 07/09 Page 12 of 68
3. Compendium Method for the Determination of Toxic Organic Compounds in Air, United States
Environmental Protection Agency, Section TO-11A, January 1999 http://www.epa.gov/ttn/amtic/airtox.html
4. OSHA Method 42, http://www.osha.gov/dts/sltc/methods/organic/org042/org042.html 5. NISOH Method 5029: http://www.cdc.gov/Niosh/nmam/pdfs/5029.pdf
6. Compendium Method for the Determination of Toxic Organic Compounds in Air, United States
Environmental Protection Agency, Section TO-13A, January 1999 http://www.epa.gov/ttn/amtic/airtox.html
7. Standard Operating Procedure for the Determination of Hexavalent Chromium in Ambient Air
Analyzed by Ion Chromatography (IC) developed for US EPA by Eastern Research Group, http://www.epa.gov/ttn/amtic/airtox.html
8. Quality Assurance Handbook for Air Pollution Measurement Systems – Volume IV:
Meteorological Measurements Version 2.0, 2008, http://www.epa.gov/ttn/amtic/met.html
SATMP QAPP Revision No: 4.9
Date: 07/09 Page 13 of 68
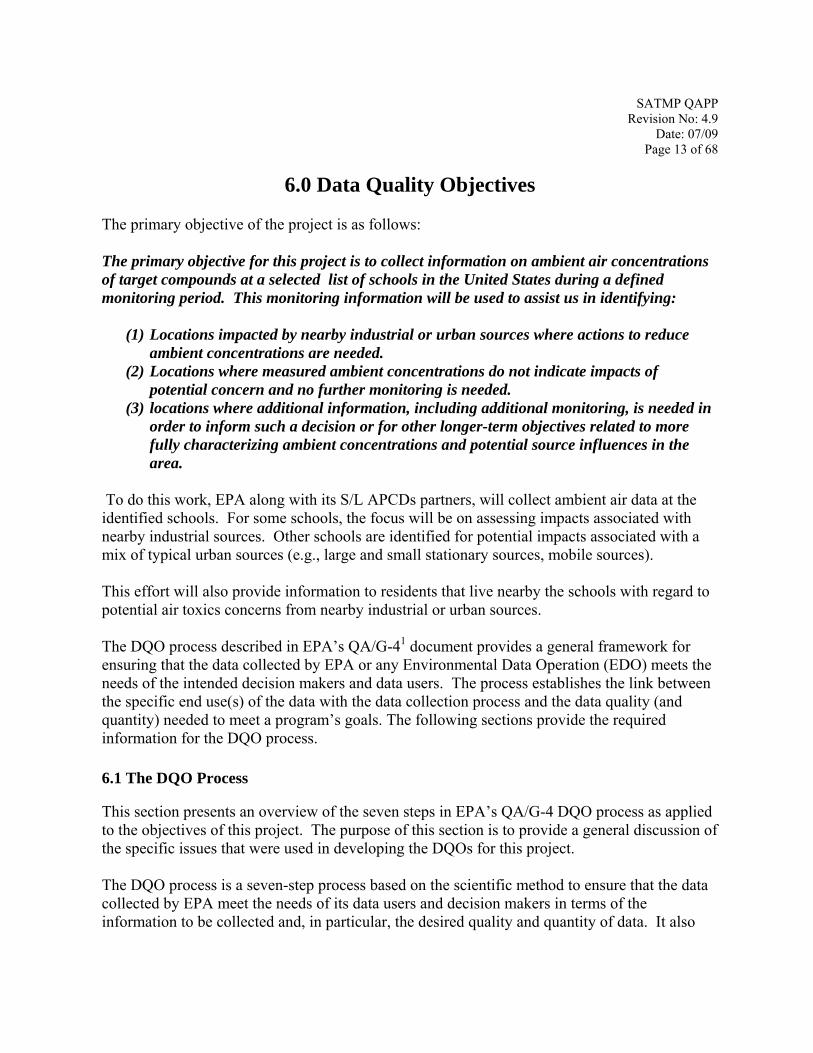
6.0 Data Quality Objectives The primary objective of the project is as follows:
The primary objective for this project is to collect information on ambient air concentrations of target compounds at a selected list of schools in the United States during a defined monitoring period. This monitoring information will be used to assist us in identifying:
(1) Locations impacted by nearby industrial or urban sources where actions to reduce ambient concentrations are needed.
(2) Locations where measured ambient concentrations do not indicate impacts of potential concern and no further monitoring is needed.
(3) locations where additional information, including additional monitoring, is needed in order to inform such a decision or for other longer-term objectives related to more fully characterizing ambient concentrations and potential source influences in the area.
To do this work, EPA along with its S/L APCDs partners, will collect ambient air data at the identified schools. For some schools, the focus will be on assessing impacts associated with nearby industrial sources. Other schools are identified for potential impacts associated with a mix of typical urban sources (e.g., large and small stationary sources, mobile sources). This effort will also provide information to residents that live nearby the schools with regard to potential air toxics concerns from nearby industrial or urban sources. The DQO process described in EPA’s QA/G-41 document provides a general framework for ensuring that the data collected by EPA or any Environmental Data Operation (EDO) meets the needs of the intended decision makers and data users. The process establishes the link between the specific end use(s) of the data with the data collection process and the data quality (and quantity) needed to meet a program’s goals. The following sections provide the required information for the DQO process. 6.1 The DQO Process
This section presents an overview of the seven steps in EPA’s QA/G-4 DQO process as applied to the objectives of this project. The purpose of this section is to provide a general discussion of the specific issues that were used in developing the DQOs for this project. The DQO process is a seven-step process based on the scientific method to ensure that the data collected by EPA meet the needs of its data users and decision makers in terms of the information to be collected and, in particular, the desired quality and quantity of data. It also
SATMP QAPP Revision No: 4.9
Date: 07/09 Page 14 of 68
provides a framework for checking and evaluating the program goals to make sure they are feasible and that the data are collected efficiently. The seven steps are usually labeled as: State the Problem
Identify the Decision
Identify the Inputs to the Decision
Define the Study Boundaries
Develop a Decision Rule
Specify Tolerable Limits on the Decision Errors
Optimize the Design for Obtaining Data
Each of these elements is discussed in detail below. The pollutant specific outcomes of the DQO process are contained in Section 6.9. 6.2 State the Problem The EPA project team developed the following problem statement: Information about air toxics has raised questions about outdoor air quality around some schools in the U.S. Some of the schools are near large industries while some schools are in urban areas, where emissions of air toxics come from a mix of large and small industries, cars, trucks, buses and other sources. Measuring the levels of toxics in the air around the schools will help EPA understand whether that air quality poses any health concerns. EPA will use what it learns from this monitoring initiative to determine its next steps. 6.3 Identify the Decision The decision statement should provide a link between the principal study question and possible actions. The decision that the monitoring at these sites is intended to inform is as follows: Data will be collected from selected schools based on information developed by or made available to the EPA. Monitoring will be performed in such a way that the resulting data will be sufficient in terms of quantity and quality to better inform our understanding of chronic air toxics concentrations in the ambient air at these schools and the influence of nearby sources. These data along with other information pertaining to air toxics at these locations will be relied upon by EPA to identify:
SATMP QAPP Revision No: 4.9
Date: 07/09 Page 15 of 68
(1) locations impacted by nearby industrial or urban sources where actions to reduce
ambient concentrations are needed to address levels of potential public health concern; (2) locations where further action is not needed at this time. (3) locations where additional information, including additional monitoring, is needed in
order to inform such a decision or to help us better characterize the impact of ambient concentrations and potential sources in the area; and
6.4 Identify the Inputs to the Decision This section discusses the variety of inputs that are needed to make the final DQO decision for this program. The pollutants of particular interest are listed in Tables 6-1 through 6-3. The Monitoring Plan lists other compounds that the laboratory will report that are also measured by the analytical methods employed. The statements included here apply implicitly to this full list of analytes. Identical analytical methods will be used by all labs participating in the program, therefore, overall precision, bias and detectability will be similar across all labs. In addition to the monitoring results, other inputs potentially important to decision-making for this project include, but not limited to, the following items (not listed in any priority order):
1. List of target schools, and target compounds; 2. Existing ambient air sampling methods and analytical techniques; 3. NATA estimates; 4. Source-specific emission inventory information; 5. Existing ambient monitoring data 6. Nearby meteorological monitoring data from the National Weather Service or
local airport weather data; 7. Topographical information pertaining to factors influencing pollutant transport; 8. Health effects information, including dose-response values and information
available on the OAQPS and ATSDR web sites; 9. Community concerns; 10. Historical monitoring, modeling, health assessments, and other information
(e.g., compliance status, voluntary emissions reduction programs, etc.) for the area; and,
11. Funding Information. 6.5 Define the Study Boundaries The specific location of the monitors should be established to represent ambient air in the proximity of the school, as described in the Monitoring Plan. Ideally, monitors should be located on the school grounds or roof of one a school buildings Siting criteria that are detailed in Code of Federal Regulations (CFR) Chapter 40 Section 58, Appendix E2 will be followed to
SATMP QAPP Revision No: 4.9
Date: 07/09 Page 16 of 68
the extent that is practical, as described in the Monitoring Plan. All monitoring stations will be located within the U.S. 6.6 Develop a Decision Rule The decision rule is an “if ... then” statement for how the various alternatives will be chosen.
If the ambient air monitoring data in combination with other information for a school indicate the need for action to reduce air concentrations of air toxics, then EPA will work with the S/L agencies on options for such actions in outdoor air. If the available monitoring data and other information are insufficient to support a conclusion in this regard, then additional data collection will be pursued. If the available monitoring data and other information are sufficient to reach a conclusion regarding the need for further action and do not support the conclusion that further action is needed, then additional data collection will not be pursued.
6.7 Specify Tolerable Limits on the Decision Errors Budgetary constraints are a consideration in describing the DQOs. The program has a finite budget that affects the amount of monitoring performed in this program. The initial monitoring will include 10 samples collected on a 1-in-6 day schedule. It was decided that on-site measurements will include meteorological data such as wind direction and wind speed to help inform our consideration of this issue. At sites where the suspected impacts are associated with a particular source(s), the monitoring data set will need to include samples taken when the predominant wind direction is generally from the sources in question in order to fully support the decision making process contemplated in this exercise. In order to understand other aspects of the quality of the data (i.e., precision and bias) the precision estimates of each method was based on the estimates from EPA’s contract laboratory for the UATMP and other method estimates and is expressed in terms of coefficient of variance (CV). The bias was chosen from the National Air Toxics Trends Stations (NATTS) estimates2. The NATTS is a long term (six-year) trends program that has been in operation since 2004. Data from proficiency testing of the laboratories within the NATTS illustrated that bias can be controlled within 25%. Data completeness (10 samples collected over a 60 - 90 day period) will be set at 100%. If, due to unforeseen events, 10 samples are not collected in 60 days, monitoring will continue until 10 samples are collected. Thus, 100% completeness will be achieved. The established minimum detection limits (MDLs) will be met in order to evaluate the resulting data in a health-based context. The MDLs are generally set at or below the concentrations of individual air toxics for which a lifetime, continuous exposure would pose an excess lifetime cancer risk of one-in-one million or a hazard quotient of 0.1. Note: for a small number of chemicals, the laboratory analytical methodology may be insufficient to achieve such
SATMP QAPP Revision No: 4.9
Date: 07/09 Page 17 of 68
an MDL. Where the level of the MDL substantially limits our interpretation with regard to potential significance of health risk-related impacts, this will be recognized in reporting and interpreting the results. 6.8 Optimize the Design for Obtaining Data The team decided that due to resource constraints, and to compare study data with other data collected within the U.S. (e.g., through the NATTS program; sampling would will follow a “one every six days” schedule. A program goal of 100% data completeness is established for the initial monitoring (60 - 90days) since this is a short-term program and the number of samples initially collected will be small. However, if the wind does not come from the direction of the sources of interest impacting the school, then the need for additional monitoring may be indicated in order to evaluate the significance of source contributions. Monitoring agencies are authorized to collect up to three additional random samples that will be set and run at the discretion of the S/L APCD. Details on this are in Section 3.2 of the Monitoring Plan. 6.9 DQOs for the SATMP This section combines all of the information gathered and states the action that will be followed given the scenarios that can occur. In order to better evaluate potential impacts of air toxics at some schools in the U.S., monitoring will commence at selected locations. If the following criteria are met, the data will be considered of sufficient quantity and quality for the decision-making to commence as described in section 6.3:
(1) Data are collected with a coefficient of variance (precision) and bias as stated in Tables 6-1 through 6-3;
(2) Data completeness is 100% or 10 samples within a window of 60 – 90 days; (3) MDLs are at or below those specified in Tables 6-1 through 6-3 and; (4) Where applicable, sufficient samples are collected when the predominant wind
direction is from the source(s) in question. Once a DQO is established, the quality of the data must be evaluated and controlled to ensure that it is maintained within the established acceptance criteria. Measurement Quality Objectives (MQOs) are designed to evaluate and control various phases (i.e., sampling, preparation, and analysis) of the measurement process to ensure that total measurement uncertainty is within the range prescribed by the DQOs. The MQOs can be defined below: Precision - a measure of mutual agreement among individual measurements of the same property usually under prescribed similar conditions. This is the random component of error.
SATMP QAPP Revision No: 4.9
Date: 07/09 Page 18 of 68
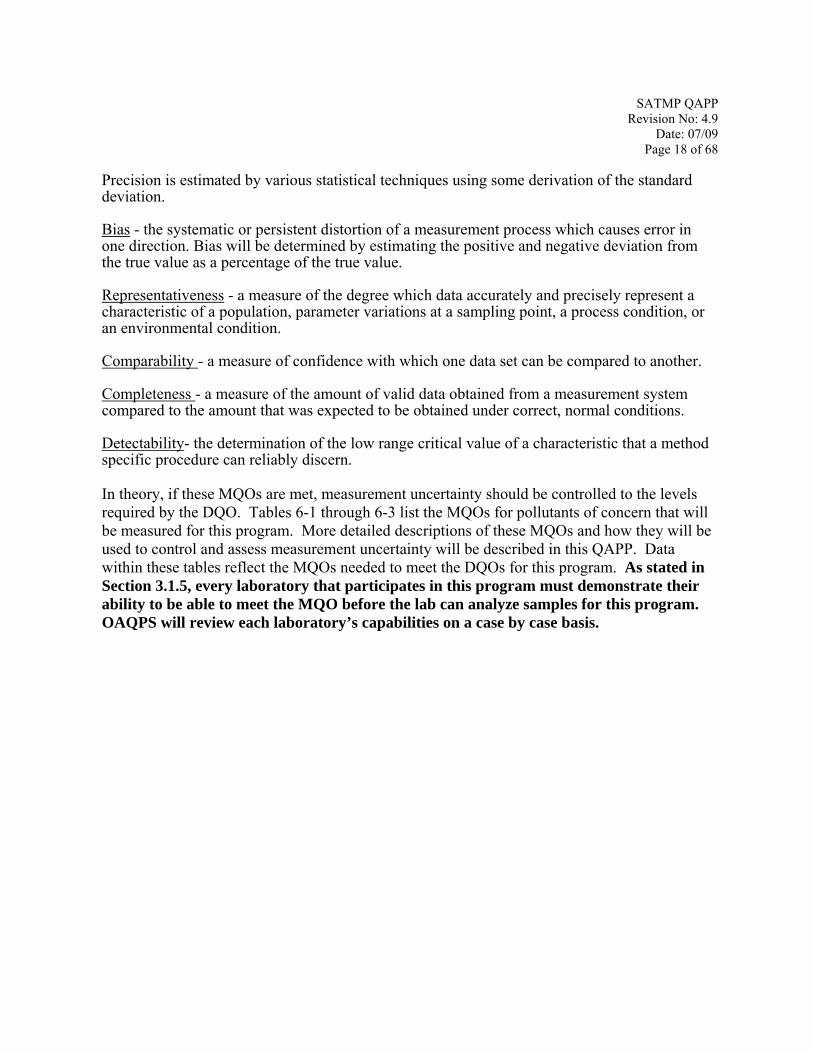
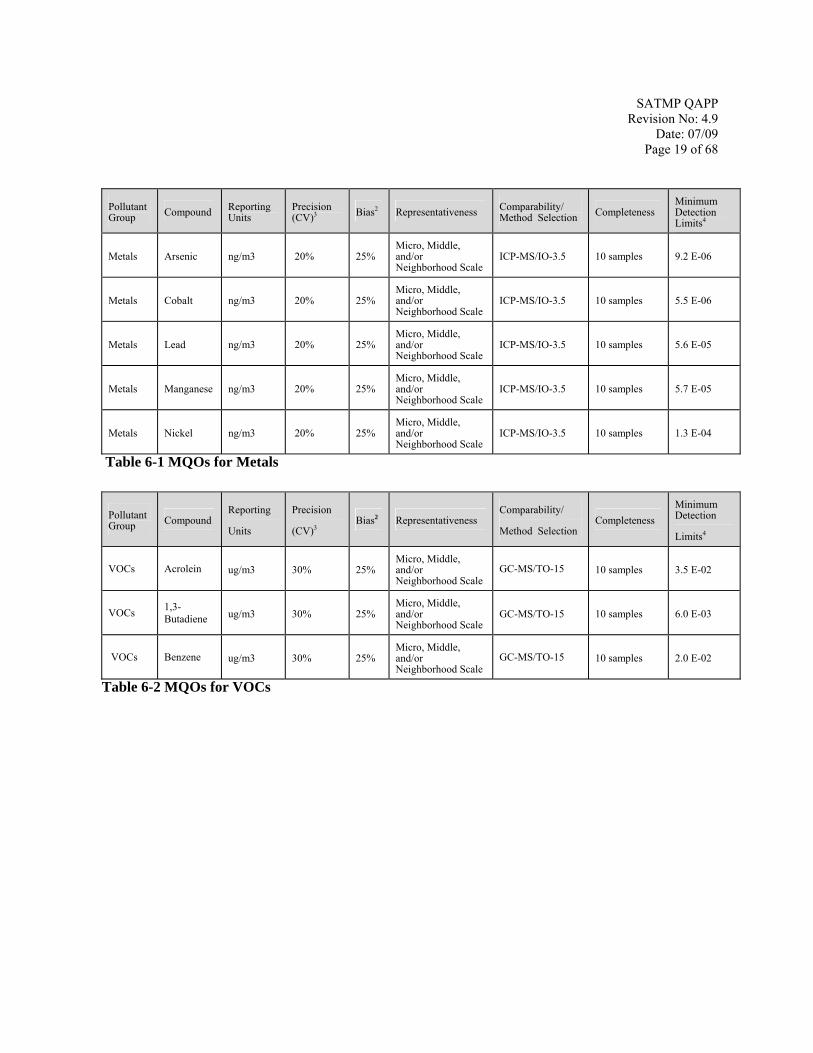
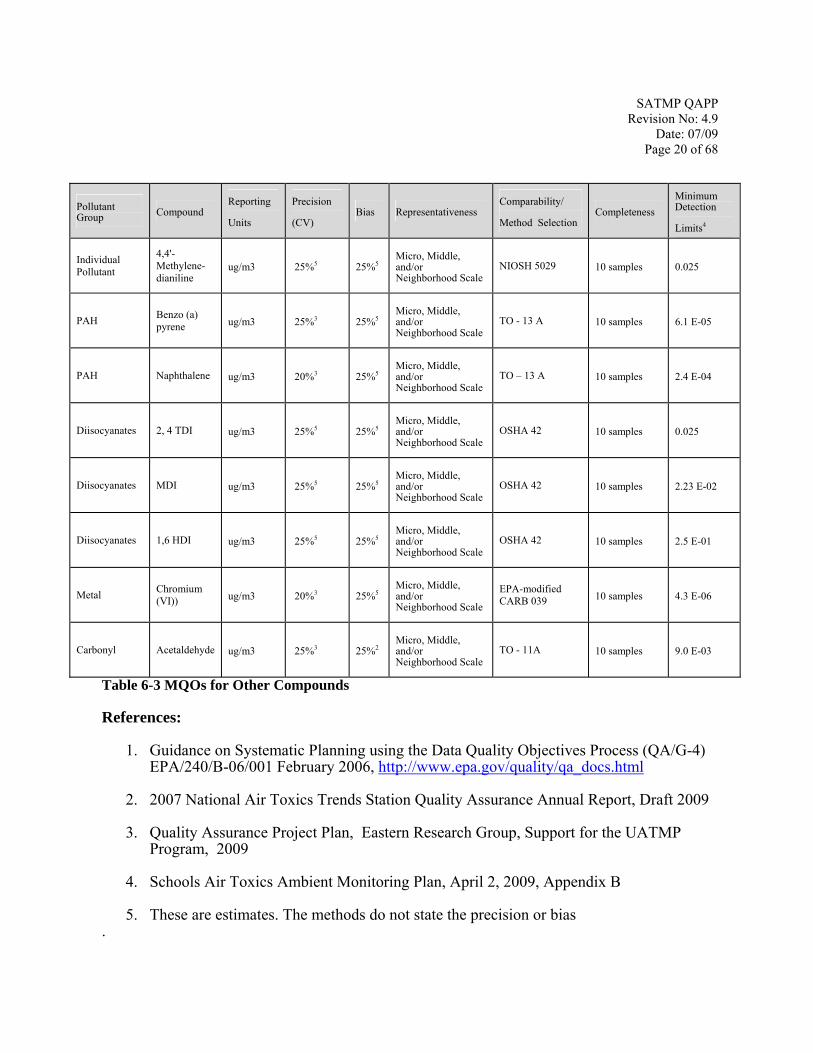
Precision is estimated by various statistical techniques using some derivation of the standard deviation. Bias - the systematic or persistent distortion of a measurement process which causes error in one direction. Bias will be determined by estimating the positive and negative deviation from the true value as a percentage of the true value. Representativeness - a measure of the degree which data accurately and precisely represent a characteristic of a population, parameter variations at a sampling point, a process condition, or an environmental condition. Comparability - a measure of confidence with which one data set can be compared to another. Completeness - a measure of the amount of valid data obtained from a measurement system compared to the amount that was expected to be obtained under correct, normal conditions. Detectability- the determination of the low range critical value of a characteristic that a method specific procedure can reliably discern. In theory, if these MQOs are met, measurement uncertainty should be controlled to the levels required by the DQO. Tables 6-1 through 6-3 list the MQOs for pollutants of concern that will be measured for this program. More detailed descriptions of these MQOs and how they will be used to control and assess measurement uncertainty will be described in this QAPP. Data within these tables reflect the MQOs needed to meet the DQOs for this program. As stated in Section 3.1.5, every laboratory that participates in this program must demonstrate their ability to be able to meet the MQO before the lab can analyze samples for this program. OAQPS will review each laboratory’s capabilities on a case by case basis.
SATMP QAPP Revision No: 4.9
Date: 07/09 Page 19 of 68
Pollutant Group Compound Reporting
Units Precision (CV)3 Bias2 Representativeness Comparability/
Method Selection Completeness Minimum Detection Limits4
Metals Arsenic ng/m3 20% 25% Micro, Middle, and/or Neighborhood Scale
ICP-MS/IO-3.5 10 samples 9.2 E-06
Metals Cobalt ng/m3 20% 25% Micro, Middle, and/or Neighborhood Scale
ICP-MS/IO-3.5 10 samples 5.5 E-06
Metals Lead ng/m3 20% 25% Micro, Middle, and/or Neighborhood Scale
ICP-MS/IO-3.5 10 samples 5.6 E-05
Metals Manganese ng/m3 20% 25% Micro, Middle, and/or Neighborhood Scale
ICP-MS/IO-3.5 10 samples 5.7 E-05
Metals Nickel ng/m3 20% 25% Micro, Middle, and/or Neighborhood Scale
ICP-MS/IO-3.5 10 samples 1.3 E-04
Table 6-1 MQOs for Metals
Pollutant Group Compound
Reporting
Units
Precision
(CV)3 Bias2 Representativeness
Comparability/
Method Selection Completeness
Minimum Detection
Limits4
VOCs Acrolein ug/m3 30% 25% Micro, Middle, and/or Neighborhood Scale
GC-MS/TO-15 10 samples 3.5 E-02
VOCs 1,3-Butadiene ug/m3 30% 25%
Micro, Middle, and/or Neighborhood Scale
GC-MS/TO-15 10 samples 6.0 E-03
VOCs Benzene ug/m3 30% 25% Micro, Middle, and/or Neighborhood Scale
GC-MS/TO-15 10 samples 2.0 E-02
Table 6-2 MQOs for VOCs
SATMP QAPP Revision No: 4.9
Date: 07/09 Page 20 of 68
Pollutant Group Compound
Reporting
Units
Precision
(CV) Bias Representativeness
Comparability/
Method Selection Completeness
Minimum Detection
Limits4
Individual Pollutant
4,4'-Methylene-dianiline
ug/m3 25%5 25%5 Micro, Middle, and/or Neighborhood Scale
NIOSH 5029 10 samples 0.025
PAH Benzo (a) pyrene ug/m3 25%3 25%5
Micro, Middle, and/or Neighborhood Scale
TO - 13 A 10 samples 6.1 E-05
PAH Naphthalene ug/m3 20%3 25%5 Micro, Middle, and/or Neighborhood Scale
TO – 13 A 10 samples 2.4 E-04
Diisocyanates 2, 4 TDI ug/m3 25%5 25%5 Micro, Middle, and/or Neighborhood Scale
OSHA 42 10 samples 0.025
Diisocyanates MDI ug/m3 25%5 25%5 Micro, Middle, and/or Neighborhood Scale
OSHA 42 10 samples 2.23 E-02
Diisocyanates 1,6 HDI ug/m3 25%5 25%5 Micro, Middle, and/or Neighborhood Scale
OSHA 42 10 samples 2.5 E-01
Metal Chromium (VI)) ug/m3 20%3 25%5
Micro, Middle, and/or Neighborhood Scale
EPA-modified CARB 039 10 samples 4.3 E-06
Carbonyl Acetaldehyde ug/m3 25%3 25%2 Micro, Middle, and/or Neighborhood Scale
TO - 11A 10 samples 9.0 E-03
Table 6-3 MQOs for Other Compounds References:
1. Guidance on Systematic Planning using the Data Quality Objectives Process (QA/G-4) EPA/240/B-06/001 February 2006, http://www.epa.gov/quality/qa_docs.html
2. 2007 National Air Toxics Trends Station Quality Assurance Annual Report, Draft 2009 3. Quality Assurance Project Plan, Eastern Research Group, Support for the UATMP
Program, 2009 4. Schools Air Toxics Ambient Monitoring Plan, April 2, 2009, Appendix B 5. These are estimates. The methods do not state the precision or bias
.
SATMP QAPP Revision No: 4.9
Date: 07/09 Page 21 of 68
7.0 Documentation and Records
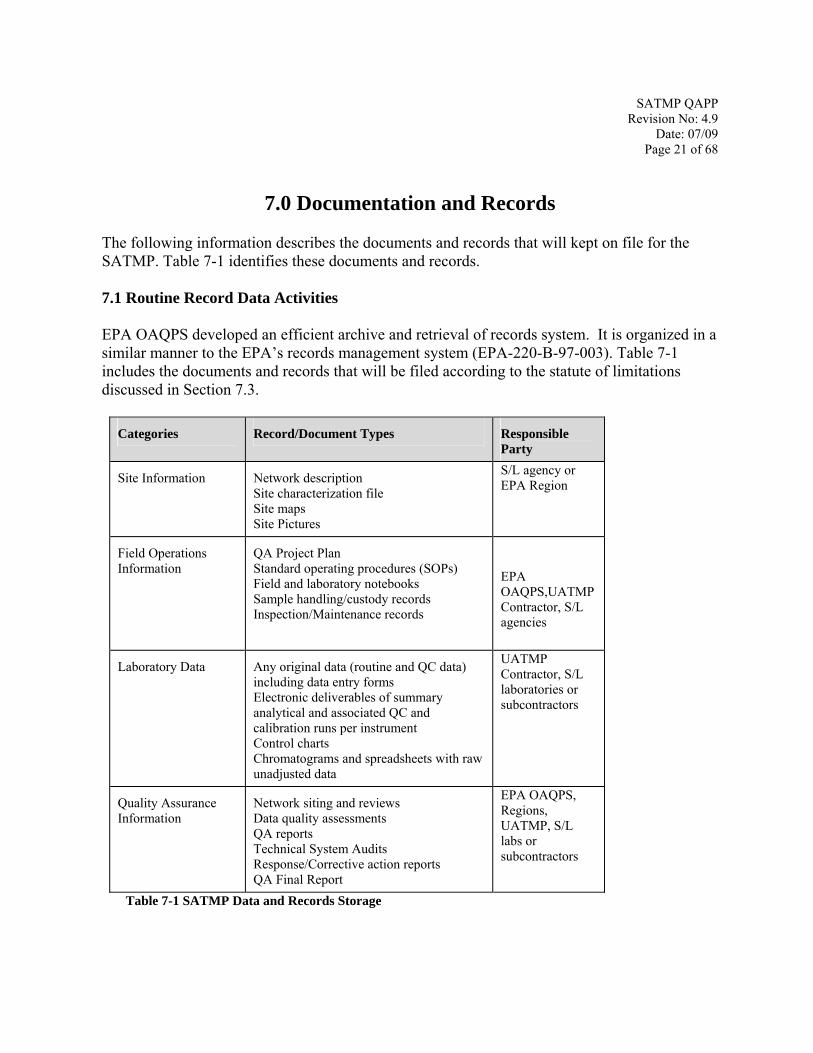
The following information describes the documents and records that will kept on file for the SATMP. Table 7-1 identifies these documents and records. 7.1 Routine Record Data Activities EPA OAQPS developed an efficient archive and retrieval of records system. It is organized in a similar manner to the EPA’s records management system (EPA-220-B-97-003). Table 7-1 includes the documents and records that will be filed according to the statute of limitations discussed in Section 7.3.
Categories Record/Document Types Responsible Party
Site Information Network description Site characterization file Site maps Site Pictures
S/L agency or EPA Region
Field Operations Information
QA Project Plan Standard operating procedures (SOPs) Field and laboratory notebooks Sample handling/custody records Inspection/Maintenance records
EPA OAQPS,UATMP Contractor, S/L agencies
Laboratory Data Any original data (routine and QC data) including data entry forms Electronic deliverables of summary analytical and associated QC and calibration runs per instrument Control charts Chromatograms and spreadsheets with raw unadjusted data
UATMP Contractor, S/L laboratories or subcontractors
Quality Assurance Information
Network siting and reviews Data quality assessments QA reports Technical System Audits Response/Corrective action reports QA Final Report
EPA OAQPS, Regions, UATMP, S/L labs or subcontractors
Table 7-1 SATMP Data and Records Storage
SATMP QAPP Revision No: 4.9
Date: 07/09 Page 22 of 68
7.2 EPA Data and Document Control Table 7-1 represents the documents and records, at a minimum, that must be filed. These documents, including draft and intermediate versions of significant importance to the project records will be stored and maintained consist with EPA records management policies. 7.2.1 Non-EPA Records There are a number of S/L APCDs that will be involved in this program. It would be difficult to describe each agency’s document and record management system. However, there are some general rules that apply. This section describes some of these practices. Notebooks – The S/L APCDs will issue notebooks to each field and laboratory technician. This notebook will be uniquely numbered and associated with the individual site. Although the samples will have a Chain of Custody (CoC) with each sample, the notebooks will be used to record additional information about these operations. All notebooks will be bound as well as paginated so that individual pages cannot be removed unnoticeably. Field notebooks - The SATMP will utilize sampling site notebooks. This will be 3-ring binders that will contain the appropriate data forms for routine operations as well as inspection and maintenance forms and SOPs. Additional notes, such as weather conditions, will be noted whenever the site technician arrives. Lab Notebooks - These notebooks will be uniquely numbered. One notebook will be available for general comments/notes; others will be associated with, the temperature and humidity recording instruments, the refrigerator, calibration equipment/standards, and the analytical balances and instruments used for this program. Electronic data collection – In order to reduce the potential for data entry errors, automated systems will be utilized where appropriate and will record the same information that is found on data entry forms. In order to provide a back-up, a hardcopy of automated data collection information will be stored for the appropriate time frame in project files. 7.3 Data Reports, Archiving and Retrieval In general, all the information listed in Table 7-1 will be retained for 5 years. However, if any litigation, claim, negotiation, audit or other action involving the records has been started before the expiration of the 5-year period, the records will be retained until completion of the action.
SATMP QAPP Revision No: 4.9
Date: 07/09 Page 23 of 68
Section 8.0 Sampling Design
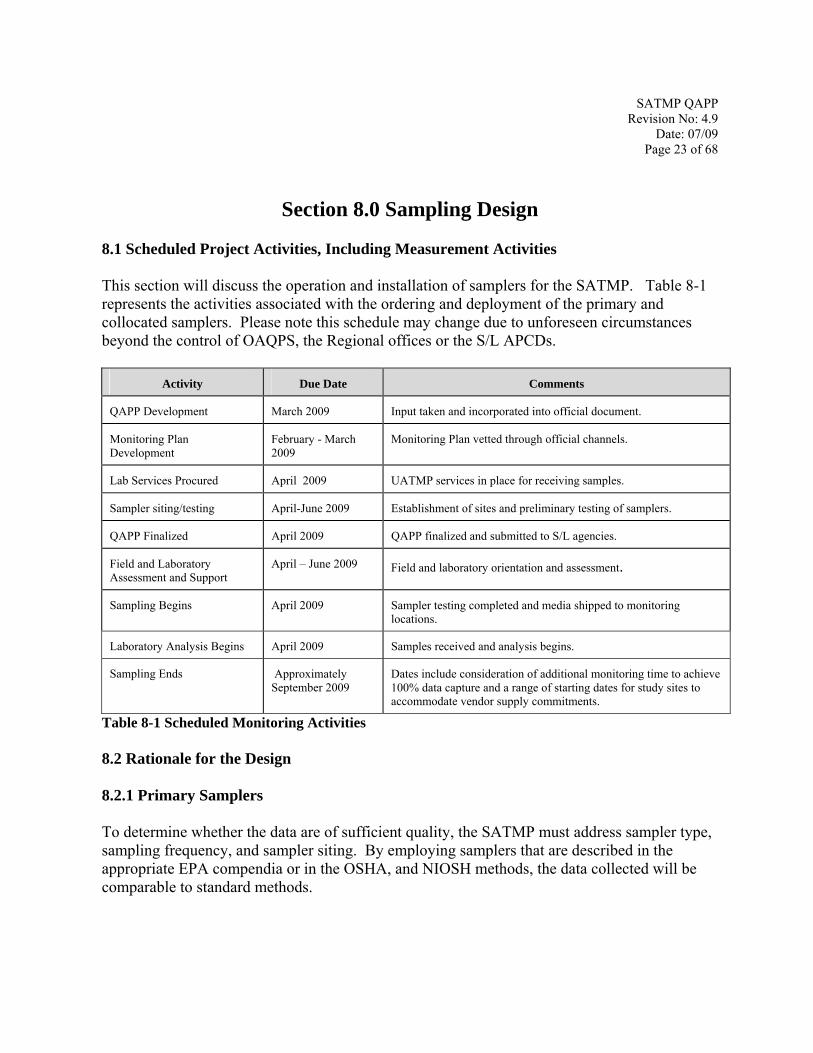
8.1 Scheduled Project Activities, Including Measurement Activities This section will discuss the operation and installation of samplers for the SATMP. Table 8-1 represents the activities associated with the ordering and deployment of the primary and collocated samplers. Please note this schedule may change due to unforeseen circumstances beyond the control of OAQPS, the Regional offices or the S/L APCDs.
Activity Due Date Comments
QAPP Development March 2009 Input taken and incorporated into official document.
Monitoring Plan Development
February - March 2009
Monitoring Plan vetted through official channels.
Lab Services Procured April 2009 UATMP services in place for receiving samples.
Sampler siting/testing April-June 2009 Establishment of sites and preliminary testing of samplers.
QAPP Finalized April 2009 QAPP finalized and submitted to S/L agencies.
Field and Laboratory Assessment and Support
April – June 2009 Field and laboratory orientation and assessment.
Sampling Begins April 2009 Sampler testing completed and media shipped to monitoring locations.
Laboratory Analysis Begins April 2009 Samples received and analysis begins.
Sampling Ends Approximately September 2009
Dates include consideration of additional monitoring time to achieve 100% data capture and a range of starting dates for study sites to accommodate vendor supply commitments.
Table 8-1 Scheduled Monitoring Activities 8.2 Rationale for the Design 8.2.1 Primary Samplers To determine whether the data are of sufficient quality, the SATMP must address sampler type, sampling frequency, and sampler siting. By employing samplers that are described in the appropriate EPA compendia or in the OSHA, and NIOSH methods, the data collected will be comparable to standard methods.
SATMP QAPP Revision No: 4.9
Date: 07/09 Page 24 of 68
By selecting sampler locations using the rules in Network Design and Site Exposure Criteria for Selected Noncriteria Air Pollutants,1 and 40 CFR Part 58 Appendix E2, the EPA SATMP can be confident that the samplers are sited in a similar fashion. The sampling instruments are detailed in the Monitoring Plan. Sampling frequency is discussed in Section 8.2.2 and 9.2, while siting and exposure are further described in sections 8.3 – 8.4. 8.2.2 QA/collocated Samplers The purpose of collocated samplers is to estimate the precision of the various samplers. The goal is to have concentrations measured by a sampler having a CV of less than 30% for most systems. Tables 6-1 through 6-3 list the individual precision CV objectives. To estimate the level of precision being achieved in the field, the SATMP will operate collocated samplers for all samplers, but not at every site. It is estimated that 15% of the network will have collocated samplers. The VOCs and aldehyde samplers have dual channel configuration, which allows collocated canisters and DNPH cartridges to be loaded on the same instrument as the primary sample. The other samplers will require a second/collocated sampler to run along side of the primary sampler. The QA samples will be set, run and collected on a 1 in 6 day schedule, the same as the primary samplers. Please see Table 9-2 for details on setup and recovery of primary and collocated samples. Section 12.1.3 outlines the equations that will be used to determine precision. There will be two samples from each instrument that will be used to determine the precision. Please note that if a S/L APCD does a random sample, as described in Section 3.2 of the Monitoring Plan and there is a collocated sampler, collocated samples must be collected on during the random sample event. 8.3 Design Assumptions The sampling design is based on the assumption that following the rules and guidance provided in 40 CFR Part 58 Appendix E1 and using the guidance in the Network Design and Site Exposure Criteria for Selected Noncriteria Air Pollutants2 will result in data that can be used to document air concentrations during the monitoring period. This information will be used in for use in considering the potential impacts of air toxics emissions on the ambient air outside schools. The siting design assumes that location of the monitors is within the micro, middle or neighborhood scale, as defined in 40 CFR Part 58 Appendix D3.
SATMP QAPP Revision No: 4.9
Date: 07/09 Page 25 of 68
8.4 Procedure for Locating and Selecting Environmental Samples 8.4.1 Sampling Design The design of the air toxics network must achieve the monitoring objective. For the SATMP, the objective is to: Collect information on ambient air concentrations of selected target compounds at a targeted list of schools identified by EPA in the United States during a defined monitoring period. The procedure for siting the samplers at the schools is based on best-case judgment by a combination of EPA Regional staff, the S/L monitoring operators, and the school staff. The best-case decisions will utilize data from existing monitoring networks, knowledge of source emissions and population distribution, and inference from analyses of meteorology to select optimal sampler locations. In addition, a Geographic Information System (GIS) software package will also be utilized to help locate the samplers. 8.5 Classification of Measurements as Critical/Noncritical The ambient concentration and site location data will be provided to AQS. The information collected at collocated samplers is the same as that presented in Tables 6-1, 6-2 and 6-3 for primary samplers. All of the measurements in these tables are considered critical because they form the basis for estimating precision, which is critical to appropriate interpretation of the monitoring data. References:
1. Network Design and Site Exposure Criteria for Selected Noncriteria Air Pollutants, 1984, EPA document: EPA-450/4-84-022
2. Code of Federal Regulations, Title 40 Part 58 , Appendix E
3. Code of Federal Regulations, Title 40 Part 58, Appendix D
SATMP QAPP Revision No: 4.9
Date: 07/09 Page 26 of 68
9.0 Sampling Methods Requirements
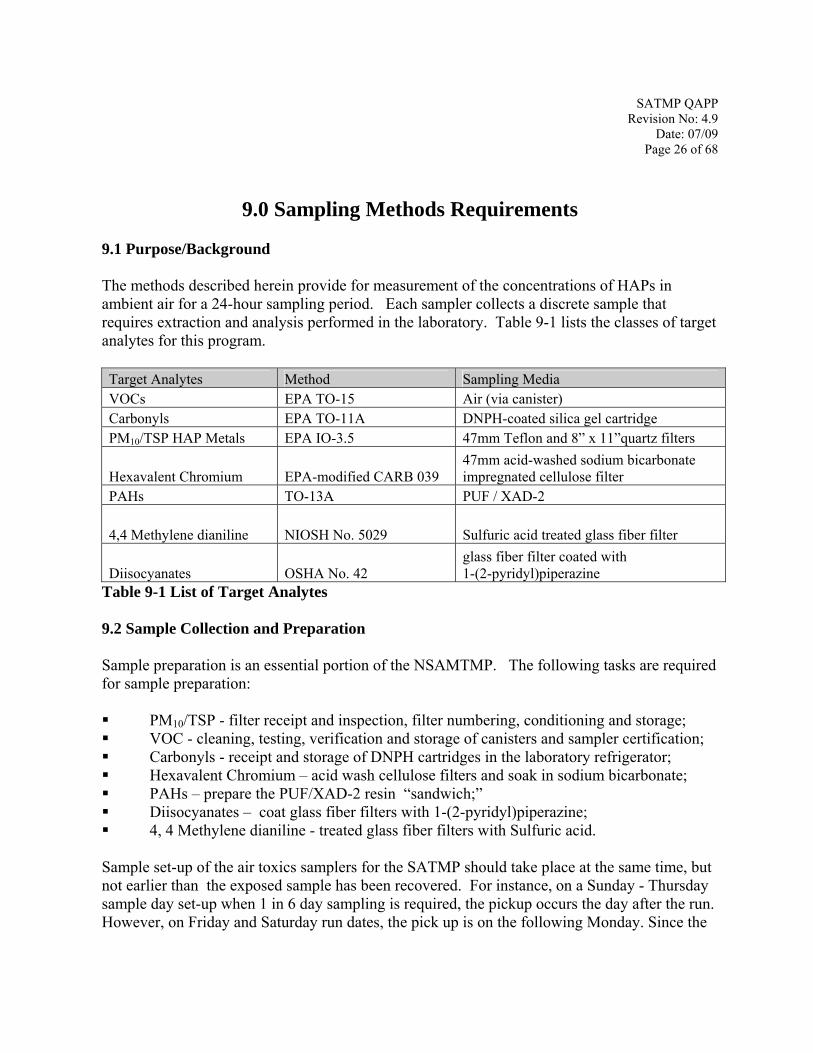
9.1 Purpose/Background The methods described herein provide for measurement of the concentrations of HAPs in ambient air for a 24-hour sampling period. Each sampler collects a discrete sample that requires extraction and analysis performed in the laboratory. Table 9-1 lists the classes of target analytes for this program. Target Analytes Method Sampling Media VOCs EPA TO-15 Air (via canister) Carbonyls EPA TO-11A DNPH-coated silica gel cartridge PM10/TSP HAP Metals EPA IO-3.5 47mm Teflon and 8” x 11”quartz filters
Hexavalent Chromium EPA-modified CARB 039 47mm acid-washed sodium bicarbonate impregnated cellulose filter
PAHs TO-13A PUF / XAD-2
4,4 Methylene dianiline NIOSH No. 5029 Sulfuric acid treated glass fiber filter
Diisocyanates OSHA No. 42 glass fiber filter coated with 1-(2-pyridyl)piperazine
Table 9-1 List of Target Analytes 9.2 Sample Collection and Preparation Sample preparation is an essential portion of the NSAMTMP. The following tasks are required for sample preparation: PM10/TSP - filter receipt and inspection, filter numbering, conditioning and storage; VOC - cleaning, testing, verification and storage of canisters and sampler certification; Carbonyls - receipt and storage of DNPH cartridges in the laboratory refrigerator; Hexavalent Chromium – acid wash cellulose filters and soak in sodium bicarbonate; PAHs – prepare the PUF/XAD-2 resin “sandwich;” Diisocyanates – coat glass fiber filters with 1-(2-pyridyl)piperazine; 4, 4 Methylene dianiline - treated glass fiber filters with Sulfuric acid.
Sample set-up of the air toxics samplers for the SATMP should take place at the same time, but not earlier than the exposed sample has been recovered. For instance, on a Sunday - Thursday sample day set-up when 1 in 6 day sampling is required, the pickup occurs the day after the run. However, on Friday and Saturday run dates, the pick up is on the following Monday. Since the
SATMP QAPP Revision No: 4.9
Date: 07/09 Page 27 of 68
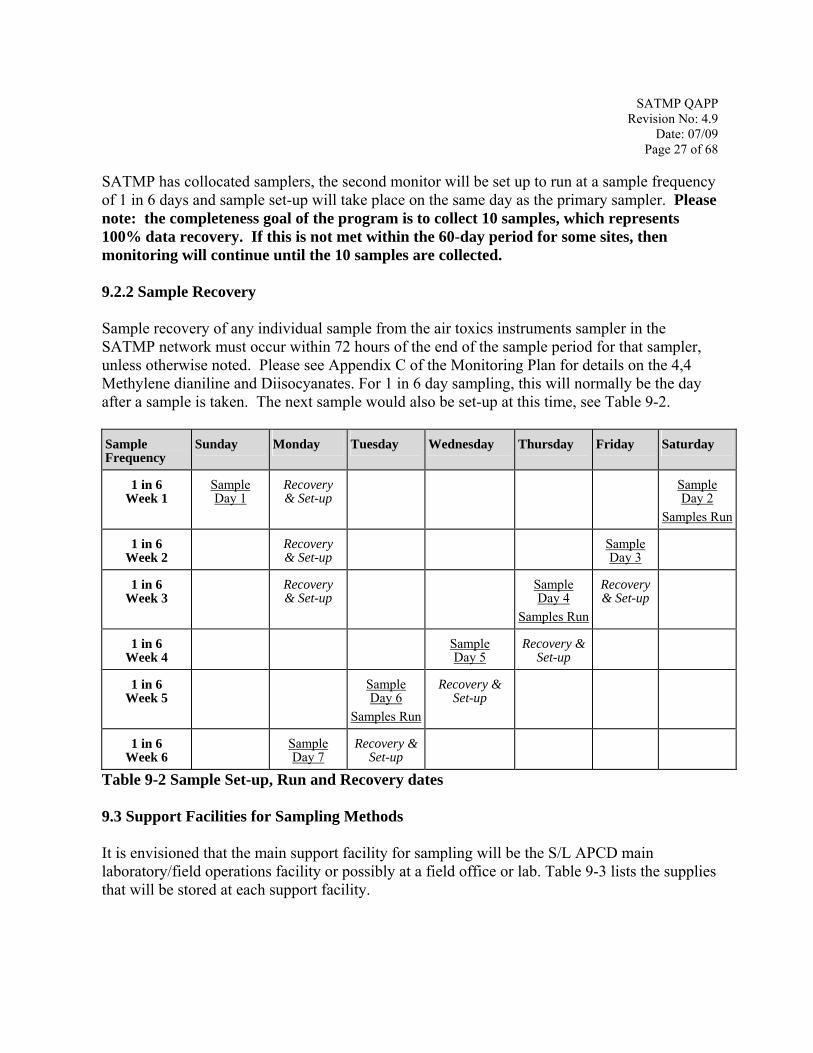
SATMP has collocated samplers, the second monitor will be set up to run at a sample frequency of 1 in 6 days and sample set-up will take place on the same day as the primary sampler. Please note: the completeness goal of the program is to collect 10 samples, which represents 100% data recovery. If this is not met within the 60-day period for some sites, then monitoring will continue until the 10 samples are collected. 9.2.2 Sample Recovery Sample recovery of any individual sample from the air toxics instruments sampler in the SATMP network must occur within 72 hours of the end of the sample period for that sampler, unless otherwise noted. Please see Appendix C of the Monitoring Plan for details on the 4,4 Methylene dianiline and Diisocyanates. For 1 in 6 day sampling, this will normally be the day after a sample is taken. The next sample would also be set-up at this time, see Table 9-2. Sample Frequency
Sunday Monday Tuesday Wednesday Thursday Friday Saturday
1 in 6 Week 1
Sample Day 1
Recovery & Set-up
Sample Day 2
Samples Run
1 in 6 Week 2
Recovery & Set-up
Sample Day 3
1 in 6 Week 3
Recovery & Set-up
Sample Day 4
Samples Run
Recovery & Set-up
1 in 6 Week 4
Sample Day 5
Recovery & Set-up
1 in 6 Week 5
Sample Day 6
Samples Run
Recovery & Set-up
1 in 6 Week 6
Sample Day 7
Recovery & Set-up
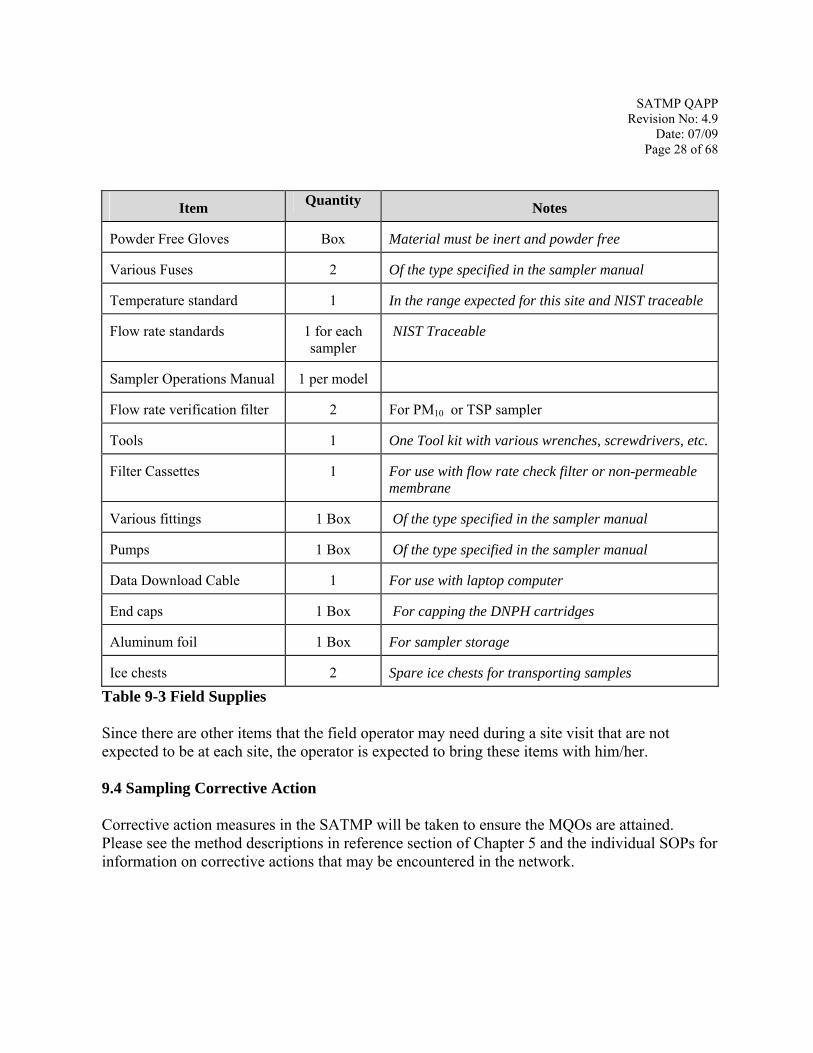
Table 9-2 Sample Set-up, Run and Recovery dates 9.3 Support Facilities for Sampling Methods It is envisioned that the main support facility for sampling will be the S/L APCD main laboratory/field operations facility or possibly at a field office or lab. Table 9-3 lists the supplies that will be stored at each support facility.
SATMP QAPP Revision No: 4.9
Date: 07/09 Page 28 of 68
Item Quantity Notes
Powder Free Gloves Box Material must be inert and powder free
Various Fuses 2 Of the type specified in the sampler manual
Temperature standard 1 In the range expected for this site and NIST traceable
Flow rate standards 1 for each sampler
NIST Traceable
Sampler Operations Manual 1 per model
Flow rate verification filter 2 For PM10 or TSP sampler
Tools 1 One Tool kit with various wrenches, screwdrivers, etc.
Filter Cassettes 1 For use with flow rate check filter or non-permeable membrane
Various fittings 1 Box Of the type specified in the sampler manual
Pumps 1 Box Of the type specified in the sampler manual
Data Download Cable 1 For use with laptop computer
End caps 1 Box For capping the DNPH cartridges
Aluminum foil 1 Box For sampler storage
Ice chests 2 Spare ice chests for transporting samples
Table 9-3 Field Supplies Since there are other items that the field operator may need during a site visit that are not expected to be at each site, the operator is expected to bring these items with him/her. 9.4 Sampling Corrective Action Corrective action measures in the SATMP will be taken to ensure the MQOs are attained. Please see the method descriptions in reference section of Chapter 5 and the individual SOPs for information on corrective actions that may be encountered in the network.
SATMP QAPP Revision No: 4.9
Date: 07/09 Page 29 of 68
9.5 Sampling Equipment, Preservation, and Holding Time This sections details the requirements needed to prevent sample contamination, the volume of air to be sampled, how to protect the sample, temperature preservation requirements, and the permissible holding times to protect ensure against degradation of sample integrity. 9.5.1 Sample Contamination Prevention The quality system has rigid requirements for preventing sample contamination. Powder free gloves are worn while handling filters, filter cassettes, canisters, and PUF/XAD-2 and DNPH cartridges. Filter and cartridges are to be held in storage containers (static resistant zip lock bags) as provided by the sampler manufacturer during transport to and from the laboratory. 9.5.2 Sample Volume The volume of air to be sampled is detailed specified in the Manufacturers and Method specifications. The different methods specify that certain minimum volumes must be collected. For all but two collection systems, Diisocyanates and 4,4 Methylene dianiline, samples are expected to be collected for 24 hours; therefore, the site operators must set the flow rates to collect sufficient sample to obtain the minimum sample volume. In some cases a shorter sample period may occur due to power outages. If the sample period is less than 23 hours or greater than 25 hours, the sample will be flagged and the analytical laboratory notified via a phone call and by filling out the Chain of Custody (CoC) form. For Diisocyanates, four 4 samples of 5 hours duration are expected to be collected over a 24- hour period (beginning at 00:00, 06:00, 12:00, and 18:00) at sample rate of 0.9 liters per minute. The four filters will be extracted together for a single analysis and effective resultant sample volume of 1080 liters. For 4, 4 Methylene dianiline, two2 samples of 10 hours duration over a 24- hour period (beginning at 06:00 and 18:00) at a sample rate of 0.9 liters per minute will be performed. The two filters will be extracted together for a single analysis with an effective resultant sample volume of 1080 liters. 9.5.3 Temperature Preservation and Holding Time Requirements The temperature requirements of the samples vary between methods. During transport from the laboratory to the sample location there are no specific requirements for temperature control with the exception of DNPH cartridges, Hexavalent chromium and glass fiber filters. Filters will be located in their protective container and in the transport container. Excessive heat must be avoided (e.g., do not leave in direct sunlight or a closed-up car during summer). The OSHA
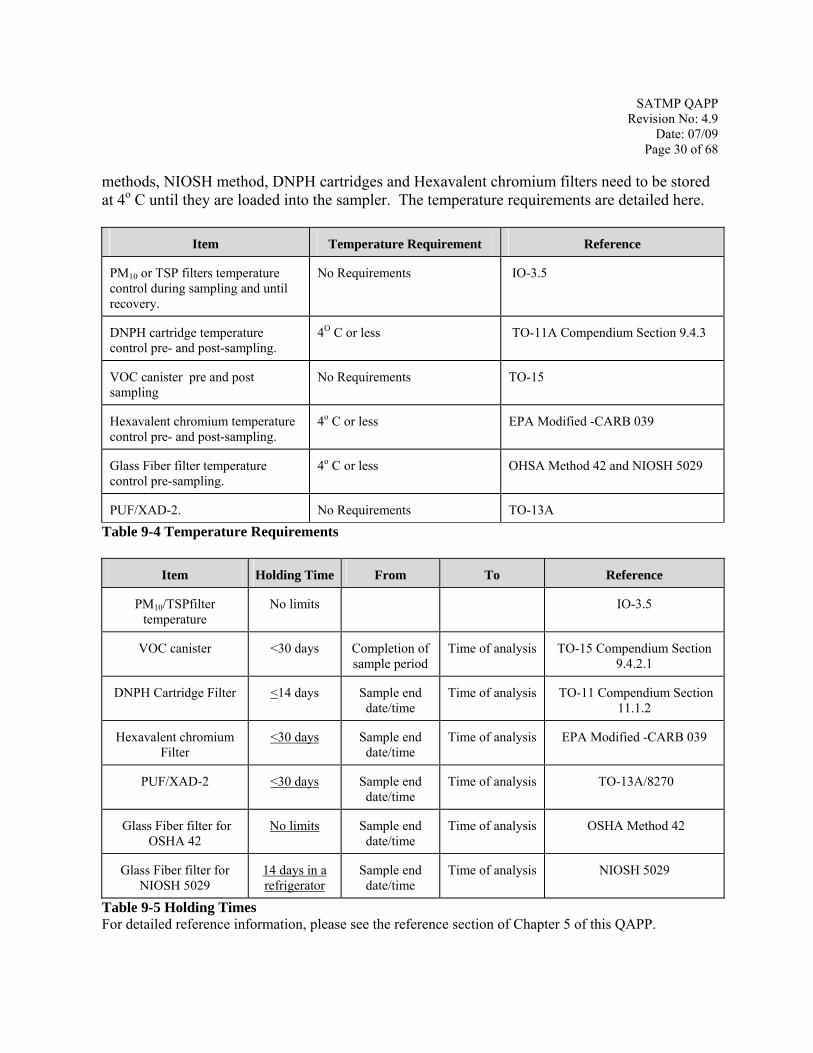
SATMP QAPP Revision No: 4.9
Date: 07/09 Page 30 of 68
methods, NIOSH method, DNPH cartridges and Hexavalent chromium filters need to be stored at 4o C until they are loaded into the sampler. The temperature requirements are detailed here.
Item Temperature Requirement Reference
PM10 or TSP filters temperature control during sampling and until recovery.
No Requirements IO-3.5
DNPH cartridge temperature control pre- and post-sampling.
4O C or less TO-11A Compendium Section 9.4.3
VOC canister pre and post sampling
No Requirements TO-15
Hexavalent chromium temperature control pre- and post-sampling.
4o C or less EPA Modified -CARB 039
Glass Fiber filter temperature control pre-sampling.
4o C or less OHSA Method 42 and NIOSH 5029
PUF/XAD-2. No Requirements TO-13A
Table 9-4 Temperature Requirements
Item Holding Time From To Reference
PM10/TSPfilter temperature
No limits IO-3.5
VOC canister <30 days Completion of sample period
Time of analysis TO-15 Compendium Section 9.4.2.1
DNPH Cartridge Filter <14 days Sample end date/time
Time of analysis TO-11 Compendium Section 11.1.2
Hexavalent chromium Filter
<30 days Sample end date/time
Time of analysis EPA Modified -CARB 039
PUF/XAD-2 <30 days Sample end date/time
Time of analysis TO-13A/8270
Glass Fiber filter for OSHA 42
No limits Sample end date/time
Time of analysis OSHA Method 42
Glass Fiber filter for NIOSH 5029
14 days in a refrigerator
Sample end date/time
Time of analysis NIOSH 5029
Table 9-5 Holding Times For detailed reference information, please see the reference section of Chapter 5 of this QAPP.
SATMP QAPP Revision No: 4.9
Date: 07/09 Page 31 of 68
Section 10.0 Sample Handling and Custody
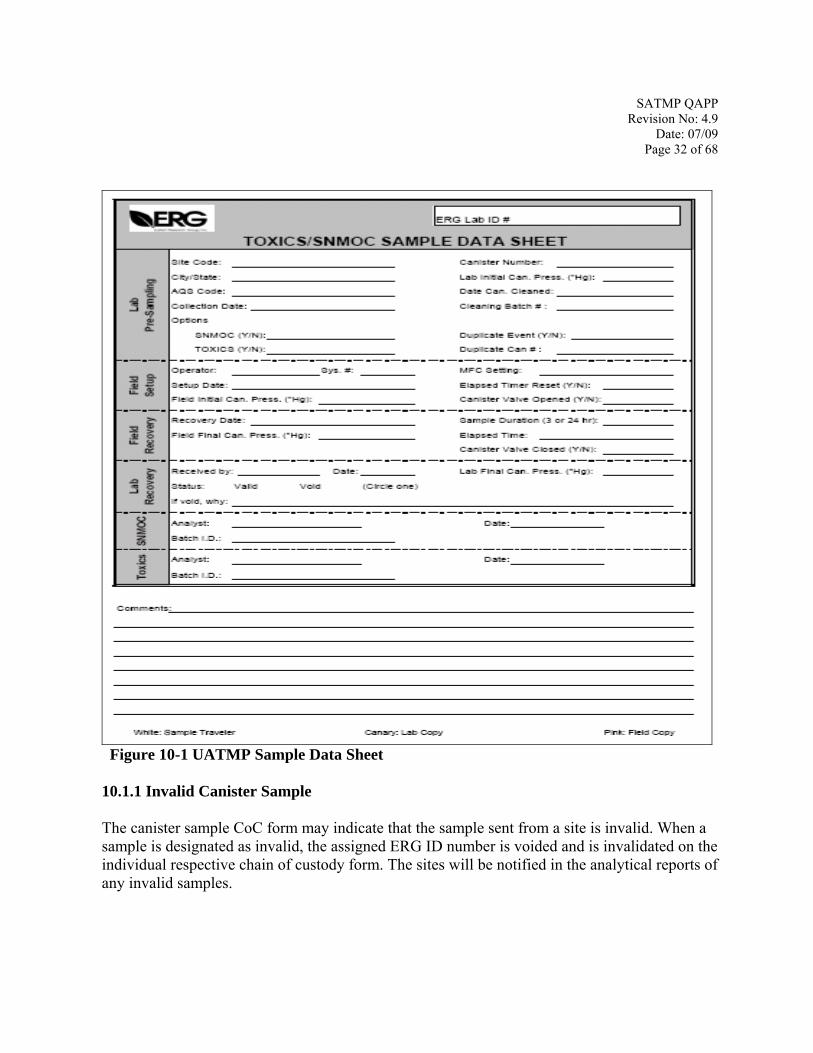
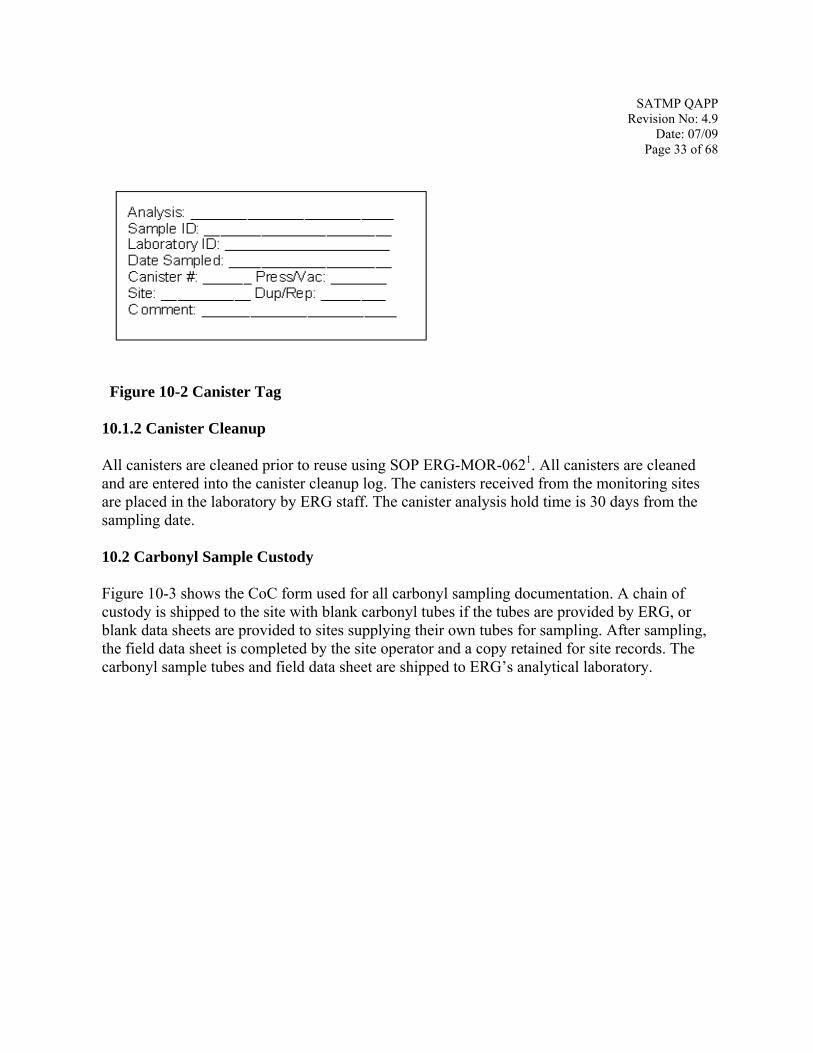
10.1 Sample Custody Sample custody is an extremely important aspect of this program. Samples custody procedures must be followed in order to assure safe and secure samples are delivered both from and to the field. All shipping to and from the S/L agencies will be handled by Federal Express with Overnight Delivery. The next sections outline the UATMP contract sample handling regime. Figures 10-1, 10-2 and 10-3 illustrate examples of chain of custody (CoC) forms that will be used in this program. 10.1.1 Canister Sampling Field Data Forms A color-coded, three-copy canister sample CoC form is shipped with each 6-liter canister to the SATMP site. If duplicate samples are to be taken, two canisters and two data sheets are sent in the shipping container to the site. When a sample is taken, the site operator fills out the field data form according to the instructions in the on-site notebook. The site operator detaches the pink copy, inserts it in the on-site notebook, and sends the remaining copies with the canister in the shipping container to the analytical laboratory. Upon receipt, the sample canister vacuum/pressure is compared against the field documented vacuum/pressure to ensure the canister remained airtight during transport. If any leaks are detected, the sample is voided. More detailed sample receipt procedures and sample acceptance policies are presented in the SOP ERG-MOR-0451. The sample specific information from the CoC sheets is then entered into the LIMS. The sample is logged into the LIMS as described in the SOP ERG-MOR-0791. The sample is given a unique identification (ID) number and tagged, (See Figure 10-2), noting the site location and the sample collection date. The remaining copies of the canister sample data sheet are separated; the white copy is stored with the canister until analysis is complete and the yellow copy is stored chronologically in a designated file cabinet. The sample ID number is presented on the canister tag and on all ERG copies of the data sheet.
SATMP QAPP Revision No: 4.9
Date: 07/09 Page 32 of 68
Figure 10-1 UATMP Sample Data Sheet 10.1.1 Invalid Canister Sample The canister sample CoC form may indicate that the sample sent from a site is invalid. When a sample is designated as invalid, the assigned ERG ID number is voided and is invalidated on the individual respective chain of custody form. The sites will be notified in the analytical reports of any invalid samples.
SATMP QAPP Revision No: 4.9
Date: 07/09 Page 33 of 68
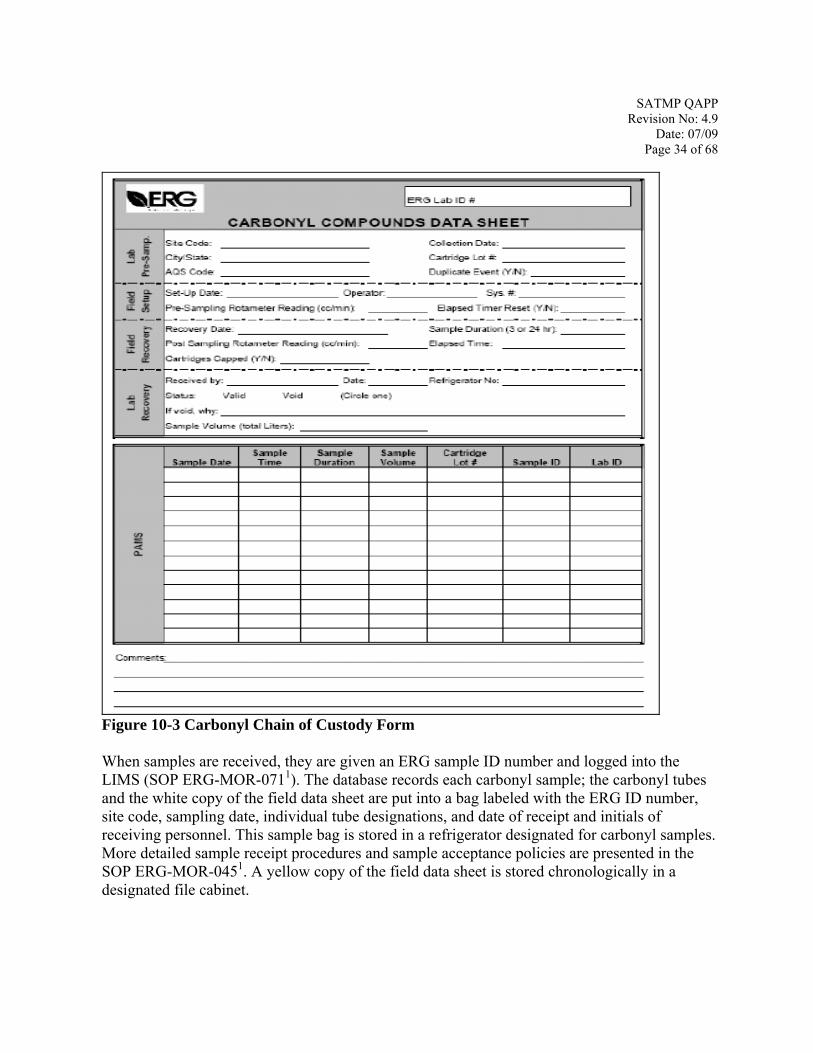
Figure 10-2 Canister Tag 10.1.2 Canister Cleanup All canisters are cleaned prior to reuse using SOP ERG-MOR-0621. All canisters are cleaned and are entered into the canister cleanup log. The canisters received from the monitoring sites are placed in the laboratory by ERG staff. The canister analysis hold time is 30 days from the sampling date. 10.2 Carbonyl Sample Custody Figure 10-3 shows the CoC form used for all carbonyl sampling documentation. A chain of custody is shipped to the site with blank carbonyl tubes if the tubes are provided by ERG, or blank data sheets are provided to sites supplying their own tubes for sampling. After sampling, the field data sheet is completed by the site operator and a copy retained for site records. The carbonyl sample tubes and field data sheet are shipped to ERG’s analytical laboratory.
SATMP QAPP Revision No: 4.9
Date: 07/09 Page 34 of 68
Figure 10-3 Carbonyl Chain of Custody Form When samples are received, they are given an ERG sample ID number and logged into the LIMS (SOP ERG-MOR-0711). The database records each carbonyl sample; the carbonyl tubes and the white copy of the field data sheet are put into a bag labeled with the ERG ID number, site code, sampling date, individual tube designations, and date of receipt and initials of receiving personnel. This sample bag is stored in a refrigerator designated for carbonyl samples. More detailed sample receipt procedures and sample acceptance policies are presented in the SOP ERG-MOR-0451. A yellow copy of the field data sheet is stored chronologically in a designated file cabinet.
SATMP QAPP Revision No: 4.9
Date: 07/09 Page 35 of 68
10.3 Sample Custody for other HAPs Prepared sample media (i.e., XAD, PUF, filters, etc.) and documentation during the sample collection phase of the program will use pre-formatted forms supplied by ERG or the subcontractor (RTI Laboratories - Levonia, Michigan). Field testing personnel will record data on the appropriate CoC forms. The CoC forms provided by the subcontractor are presented in their QAPP. The CoC forms provide for documentation of time, date, location, meteorological parameters and possibly some laboratory parameters. XAD, PUF, and filters are received at ERG’s laboratory as presented in the SOP for Sample Receipt at ERG Chemistry Laboratory, ERG-MOR-0451. The HAPs samples received at the ERG laboratory will be logged into the LIMS as described in the SOP ERG-MOR-0791. 10.4 Analytical Laboratory Data All analytical laboratories will provide sample tracking forms, narratives describing any anomalies and any modifications to analytical procedures, data and sample handling records, and laboratory notes for inclusion in the final report. All laboratory electronic records will be recorded for archive on magnetic media, and all hardcopies of raw data will be included in the project archive file. All records generated by measurement activities are signed or initialed by the person performing the work and reviewed by an appropriate supervisor. Measurement results become part of a project report which is reviewed by a technical reviewer. All notebooks are kept in black ink, dated and signed by the person making the entries, and routinely inspected by the appropriate supervisor, as evidenced by his/her initials and date of inspection. Laboratory notebook maintenance procedures are regulated by Standard Operating Procedure, ERG-MOR-039. 10.5 Sampling Monitoring Data All data sheets from the monitoring sites will be collected at the end of each monitoring episode and maintained in the laboratory/field office throughout the monitoring program. If corrective action is required during the field monitoring activities, the reason for the correction and action taken will be documented on a corrective action report form, as described in the UATMP contract QAPP. All forms will be written on with indelible ink. If correction is required on the form, a single line will be drawn through the erroneous entry, and the correction will be dated and initialed. Any blank spaces will have a line drawn through to ensure that the space is not filled in later. The original field data will remain in ERG custody and is eventually stored on file with the final report for 5 years. References: 1. The Eastern Research Group SOPs are Confidential Business Information. Eastern Research Group’s contact information is in the Acknowledgment section.
SATMP QAPP Revision No: 4.9
Date: 07/09 Page 36 of 68
11.0 Analytical Methods Requirements
The analytical instrument for this program are: gas chromatograph – mass spectroscopy (GC/MS) for VOCs, high pressure liquid chromatograph (HPLC) for carbonyls, inductively coupled plasma/mass spectrometer (ICP/MS) for metals, ion chromatography (IC) for Hexavalent Chromium, HPLC for the Diisocyanates and HPLC and Electron Capture - Hall Detector (ECHD) for 4, 4 Methylene dianiline. All analytical method SOPs are on file with ERG or its subcontractors. Contact information for ERG is in the Acknowledgement Section of this QAPP. 11.1 VOC Canister Analysis and Cleanup System The atmosphere is sampled by introduction of air into a specially-prepared stainless steel canister. A sample of air is drawn through a sampling train comprised of components that regulate the rate and duration of sampling into the pre-evacuated and passivated canister. After the air sample is collected, the canister valve is closed, an identification tag is attached to the canister, and the canister is transported to the laboratory for analysis. Upon receipt at the laboratory, the canister is recorded and is stored until analysis. Storage times of up to thirty 30 days have been demonstrated for many of the VOCs. To analyze the sample, a known volume of sample is directed from the canister through a solid multi-sorbent concentrator. A portion of the water vapor in the sample breaks through the concentrator during sampling, to a degree depending on the multi-sorbent composition, duration of sampling, and other factors. Water content of the sample can be further reduced by dry purging the concentrator with helium while retaining target compounds. After the concentration and drying steps are completed, the VOCs are thermally desorbed, entrained in a carrier gas stream, and then focused in a small volume by trapping on a reduced temperature trap or small volume multi-sorbent trap. The sample is then released by thermal desorption and carried onto a gas chromatographic column for separation. As a simple alternative to the multi-sorbent/dry purge water management technique, the amount of water vapor in the sample can be reduced below any threshold for effecting the proper operation of the analytical system by reducing the sample size. For example, a small sample can be concentrated on a cold trap and released directly to the gas chromatographic column. A canister cleanup system has been developed and is used to prepare sample canisters for use and reuse after analysis (SOP ERG-MOR-0621). An oil-free compressor with an 80-gallon reservoir provides source air for the system. The compressor was chosen to minimize hydrocarbon contamination. A coalescing filter removes water mist and particulate matter down to a particle size of 10 microns and permeation dryers remove water vapor from the compressor source air. The permeation dryers are used with a moisture indicator to show detectable moisture in the air leaving the dryer. Next, air is passed through a catalytic oxidizer to destroy residual hydrocarbons. The oxidizer is
SATMP QAPP Revision No: 4.9
Date: 07/09 Page 37 of 68
followed by an in-line filter for secondary particulate matter removal. A single-stage regulator controls the final air pressure in the canisters, and a metering valve is used to control the flow rate at which the canisters are filled during a cleanup cycle. The flow direction is controlled by a separate rotometer, installed in the clean, dried air line. A shutoff valve exists between the clean dried air line and the humidifier system (which is a modified SUMMA®-treated 6-liter canister partially filled with HPLC-grade water). One flowmeter and flow-control valve direct the cleaned, dried air into the 6-liter canisters, where it is bubbled through the HPLC-grade water; a second flow-control valve and flowmeter allow air to bypass the canister/bubbler. By setting the flow-control valves separately, the downstream relative humidity can be regulated. A setting of 100% relative humidity is used for canister cleaning with the wet rotometer on and the dry rotometer off. Another shutoff valve is located between the humidifier and each 8-port manifold where the canisters are connected for cleanup. The vacuum system consists of a Precision Model DD-310 turbo-molecular vacuum pump, a cryogenic trap, an absolute pressure gauge, and a manifold vacuum valve connected. The cryogenic trap prevents the sample canisters from being contaminated by back- diffusion of hydrocarbons from the vacuum pump into the cleanup system. The manifold vacuum valves enable isolation of the vacuum pump from the system without shutting off the vacuum pump. After sample analyses and data review are completed, a bank of eight canisters is connected to each manifold with each canister valve open and the air pressure, vacuum, and bellows valves closed. The vacuum pump is started and one of the bellows valves is opened, drawing a vacuum on the canisters connected to the corresponding manifold. After reaching 10 mm Hg absolute pressure, as indicated by the absolute pressure gauge, the vacuum is maintained for 30 minutes. The bellows valves are then closed and the cleaned, dried air that has been humidified is introduced into the evacuated canisters at a rate of 4.0 liters per minute until the pressures reach approximately 20 psig. This flow rate has been recommended by the manufacturer as the highest flow rate at which the catalytic oxidizers can handle elimination of hydrocarbons with a minimum of 99.7% efficiency. The evacuation and pressurization of the canisters constitutes one cleanup cycle. The cleanup cycle is repeated twice more during the canister cleanup procedure. Following the third pressurization, the canister valves are closed, and the canister that had the highest pre-cleanup concentration is selected for cleanliness verification. The cleanliness of the canister is qualified by GC/MS analysis (one canister per bank of cleaned canisters - one canister per eight cleaned). The cleanliness criterion for each bank of eight canisters is 0.2 ppbv per analyte or the MDL, whichever is greater. Upon meeting this criterion, the canister is reconnected to the cleanup manifold. All canister valves are opened and the canisters are evacuated to approximately 29.5 inches Hg absolute pressure for a fourth time, in preparation for shipment to the site.
SATMP QAPP Revision No: 4.9
Date: 07/09 Page 38 of 68
11.2 Analysis of PAH using EPA Compendium Method TO-13A Sampling modules containing polyurethane foam (PUF), petri dishes containing filters, CoC forms and all associated documentation will be shipped to the ERG laboratory from the field. Upon receipt at the laboratory, samples will be logged into the laboratory sample tracking system and sent to the sample preparation laboratory. Sample preparation and analysis procedures are based on SW-846 Method 3540C for sample preparation and EPA Compendium Method TO-13A for analysis using Selected Ion Monitoring techniques. The hold time is two weeks (14 days) after sampling for extraction and 45 days after extraction for analysis. Sample extracts will be analyzed for PAHs using the analytical procedures outlined in EPA Compendium Method TO-13A, using Selected Ion Monitoring. Instrument operating conditions are shown in Table 2 of EPA Compendium Method TO-13A and the laboratory SOPs ERG-MOR-0441. The mass spectrometer will be tuned and mass-calibrated as required using perfluorotributylamine (FC-43), per the manufacturer’s instructions. The tune of the instrument is verified by injecting 50ng of DFTPP and checking the ion abundance criteria against the ion abundance criteria listed in Table 3 of EPA Compendium Method TO-13A. If the DFTPP mass spectrum does not meet method specifications, the DFTPP is re-analyzed or the mass spectrometer is re-tuned so that the instrument will meet the tuning criteria. The DFTPP tuning criteria must be met before analysis of samples can begin. The acceptability of the instrument tune will be verified by analysis of the DFTPP solution daily, or every 12 twelve hours if the instrument is operated for 24 hours a day. Analytical procedures for performance of the Selected Ion Monitoring analysis are presented in ERG-MOR-0491 for analysis by EPA Compendium Method TO-13A. 11.3 Metals Using ICP/MS After receipt of the sample shipment, the samples are checked against the CoC forms and then assigned an analytical laboratory sample number. Each sample component is examined to determine if damage occurred during travel. Color, appearance, and other particulars of the samples are noted. Sample preparation and analysis procedures are based on EPA Compendium Method IO-3.5A for the Determination of Metals in Ambient Particulate Matter using ICP/MS techniques. A complete description of the preparation and analytical procedures for metals filters is in ERG-MOR-0851. Instrument operating conditions for the analysis of inorganics using an ICP/MS are shown in Table 3 of EPA Compendium Method IO-3.5A and the laboratory SOPs ERG-MOR-0851 for Teflon® filters. The mass spectrometer will be mass calibrated and resolution checked. Resolution at low mass is indicated by magnesium isotopes 24, 25, and 26. Resolution at high mass is indicated by lead isotopes 206, 207, and 208. Instrument stability must be demonstrated by running a tuning solution containing 100 µg/L of beryllium, magnesium, cobalt, indium and lead. The analyses will be run five times with the resulting relative standard
SATMP QAPP Revision No: 4.9
Date: 07/09 Page 39 of 68
deviation (RSD) of absolute signals for all analytes of less than 5 percent. 11.4 Hexavalent Chromium Hexavalent chromium filter samples are stored in the freezer after they are received from the field prior to analysis. Internal studies have shown that the Hexavalent chromium does not degrade for up to 21 days if the samples they are stored in the freezer before extraction. Due to oxidation/reduction and conversion problems between the trivalent chromium (Cr3+) and Hexavalent chromium (Cr6+), the extraction is performed immediately prior to analysis. Therefore, it is important that the ion chromatograph (IC) be equilibrated, calibrated and ready for analysis before filters are extracted. Sample preparation is performed by removing the filter from its filter cassette and placing it into a 14-mL polystyrene tube and adding 10-mL of sodium bicarbonate in deionized water. The extraction is done on a bench-top. The extract is sonicated for three hours before a 5-mL aliquot is removed for analysis on the IC. Extracts are stored in a freezer until they are analyzed. All analysis is completed the day the filters are extracted. The analytical separation for the Hexavalent chromium is performed using a Dionex-600 IC with a Dionex LC 20 Chromatography Enclosure with a PC 10 Pneumatic Controller and a GP50 Gradient Pump configured with an IonPac AS7 and an IonPac NG1 guard column. ERG’s system uses a Dionex® data system. Samples are injected in duplicate using a Dionex AS40 auto-ampler. A mobile phase is used to perform the analytical separation at a flow rate of 1.5mL/min, and a post-column reagent flow rate of 0.5mL/min. The multi-wavelength UV detector is used at 530 nm. The samples are prepped and analyzed following ERG SOP, for Analysis of Hexavalent Chromium by Ion Chromatography ERG-MOR-0631. 11.5 Diisocyanates Samples are collected by use of a supported filter holder with a sampling pump at the recommended flow rate with the sampling device devise in line. A known volume of air is pulled through a three-piece styrene cassette containing a glass fiber filters coated with 0.1 mg of 1-(2-pyridyl)piperazine (1-2PP) and a backup pad. After sampling, the filters are wrapped and shipped to the laboratory for analysis. Samples are extracted with 90/10 (v/v) acetonitrile/dimethyl sulfoxide and analyzed by HPLC using an ultraviolet (UV) or fluorescence detector.
SATMP QAPP Revision No: 4.9
Date: 07/09 Page 40 of 68
11.6 4,4 Methylene dianiline Samples are collected by use of a supported filter holder and a sampling pump calibrated with a representative sample in line. Samples are taken by drawing a known volume of air through a sulfuric acid-treated glass fiber filter. The samples are transferred within four 4 hours of completion of sampling, into a vial containing 4 mL of 0.1 N methanolic - potassium hydroxide. Samples can be stored in the glass vials for up to one month prior to analysis. The samples are agitated in an ultrasonic water bath before analysis. The samples are analyzed on HPLC using a UV and electrochemical detector. 11.7 Carbonyls A known volume of ambient air is drawn through a pre-packed cartridge coated with acidified DNPH at a known sampling rate for an appropriate period of time. Sampling rate and time are dependent upon carbonyl concentration in the test atmosphere. After sampling, the sample cartridges and field blanks are individually capped and placed in shipping tubes with end caps. Sample identifying tags and labels are then attached to the capped tubes. The capped tubes are then placed in a polypropylene shipping container cooled to sub-ambient temperature (4o C) and returned to the laboratory for analysis. Alternatively, the sample vials can be placed in a thermally- insulated box with appropriate padding for shipment to the laboratory. The cartridges may either be placed in cold storage until analysis or immediately washed by gravity feed elution with 5 mL of Acetonitrile from a glass syringe reservoir to a graduated test tube or a 5 mL volumetric flask. The eluate is then diluted to a known volume and refrigerated until analysis. For determining carbonyls, the DNPH-carbonyl derivative can be determined using reverse phase HPLC with an ultraviolet (UV) absorption detector operated at 360 nm. To determine carbonyls, the HPLC system is operated in the linear gradient program mode. Carbonyl compounds in the sample are identified and quantified by comparison of their retention times and peak heights or peak areas with NIST traceable standard solutions. References 1. The Eastern Research Group SOPs are Confidential Business Information. Eastern Research Group’s contact information is in the Acknowledgment section.
SATMP QAPP Revision No: 4.9
Date: 07/09 Page 41 of 68
12.0 Quality Control Requirements
Quality Control (QC) is the overall system of technical activities that measures the attributes and performance of a process. In the case of the SATMP, QC activities are used to ensure that measurement uncertainty, as discussed in Chapter Section 6, is maintained within acceptance criteria for the attainment of the DQO. 12.1 QC Procedures Day-to-day QC is implemented through the use of various checks on the samplers. These checks are used to verify that the sampler is operating properly. The procedures for the methods section are described in Sections 9 (field) and 11 (laboratory), respectively. The following information provides some additional descriptions of these QC activities, how they will be used in the evaluation process, and what corrective actions will be taken when they do not meet acceptance criteria. Note that more detailed information on the instruments used in the field can be obtained in the SOPs at this website: http://www.epa.gov/ttn/amtic/airtoxschool.html 12.1.1 Calibrations Calibration is the comparison of a measurement standard or instrument with another standard or instrument to report, or eliminate by adjustment, any variation (deviation) in the accuracy of the item being compared. The purpose of calibration is to minimize bias. Calibration activities for air toxics samplers follow a two-step process:
1. Certifying the calibration standard and/or transfer standard against an authoritative standard; and,
2. Comparing the calibration standard and/ or transfer standard against the routine sampling/analytical instruments.
Calibration requirements for the critical field and laboratory equipment are discussed in Section 14 of this QAPP. More detailed procedures are found in the respective instrument and sampler SOPs. 12.1.2 Blanks Blank samples are used to determine contamination arising from principally four sources: the environment from which the sample was collected/analyzed, the reagents used in the analysis,
SATMP QAPP Revision No: 4.9
Date: 07/09 Page 42 of 68
the apparatus used, and the operator/analyst performing the analysis. Three types of blanks will be implemented in the air toxics program: Lot blanks - shipments of filters and cartridges will be periodically sent from the vendor to UATMP contract lab. Each shipment must be tested to determine the length of time it takes the filters to stabilize. Upon arrival of each shipment, three3 lot blanks will be randomly selected for the shipment and be subjected to the conditioning/pre-sampling procedures. Field blanks - provides an estimate of total measurement system contamination. By comparing information from laboratory blanks against the field blanks, one can assess contamination from field activities. Field blanks will be utilized for all samples with the exception of canister sampling. Field blanks cannot be utilized with the VOC canisters since they arrive in the field under vacuum. Lab blanks -provides an estimate of contamination occurring at the analysis facility. Details of the use of the lab blanks can be found in the SOPs. Lab blanks will be utilized for the aldehydes, metals and VOCs. Lab blanks for VOCs are generated by the canister cleaning system. Blank Evaluation - The laboratory will include three 3 field and three 3 lab blanks into each batch. The following statistics will be generated for data evaluation purposes: Corrective action- The acceptance criteria for field blanks are discussed in the individual SOPs. However the mean difference based upon the number of blanks in each batch will be used for comparison against the acceptance criteria. If the mean difference of either the field or laboratory blanks is greater than the accepted values, then these will be noted in the QA final report. If the blank means of either the field or lab blanks are still out of the acceptance criteria, all samples within the analysis session will be flagged with the appropriate flag, and efforts will be made to determine the source of contamination. In theory, field blanks should contain more contamination than laboratory blanks. Therefore, if the field blanks are outside of the criteria while the lab blanks are acceptable, analysis can continue on the next batch of samples while field contamination sources are investigated. If the mean difference of the laboratory blanks is greater than the acceptance criteria, the laboratory will stop until the issue is satisfactorily resolved. The laboratory technician will alert the Laboratory Manager and/or QA Officer of the problem. The problem and solution will be reported and appropriately filed under response and corrective action reports. The laboratories will take the appropriate action according to the individual lab SOPs.
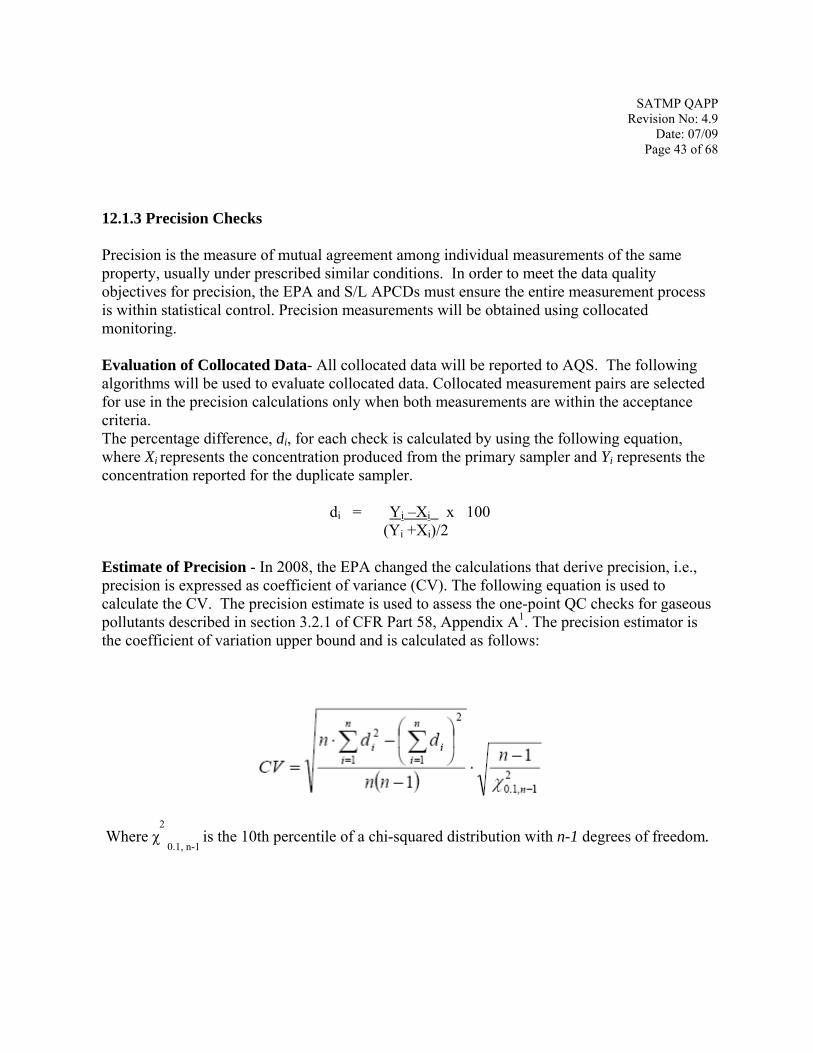
SATMP QAPP Revision No: 4.9
Date: 07/09 Page 43 of 68
12.1.3 Precision Checks Precision is the measure of mutual agreement among individual measurements of the same property, usually under prescribed similar conditions. In order to meet the data quality objectives for precision, the EPA and S/L APCDs must ensure the entire measurement process is within statistical control. Precision measurements will be obtained using collocated monitoring. Evaluation of Collocated Data- All collocated data will be reported to AQS. The following algorithms will be used to evaluate collocated data. Collocated measurement pairs are selected for use in the precision calculations only when both measurements are within the acceptance criteria. The percentage difference, di, for each check is calculated by using the following equation, where Xi represents the concentration produced from the primary sampler and Yi represents the concentration reported for the duplicate sampler.
di = Yi –Xi x 100 (Yi +Xi)/2
Estimate of Precision - In 2008, the EPA changed the calculations that derive precision, i.e., precision is expressed as coefficient of variance (CV). The following equation is used to calculate the CV. The precision estimate is used to assess the one-point QC checks for gaseous pollutants described in section 3.2.1 of CFR Part 58, Appendix A1. The precision estimator is the coefficient of variation upper bound and is calculated as follows:
Where χ
2
0.1, n-1 is the 10th percentile of a chi-squared distribution with n-1 degrees of freedom.
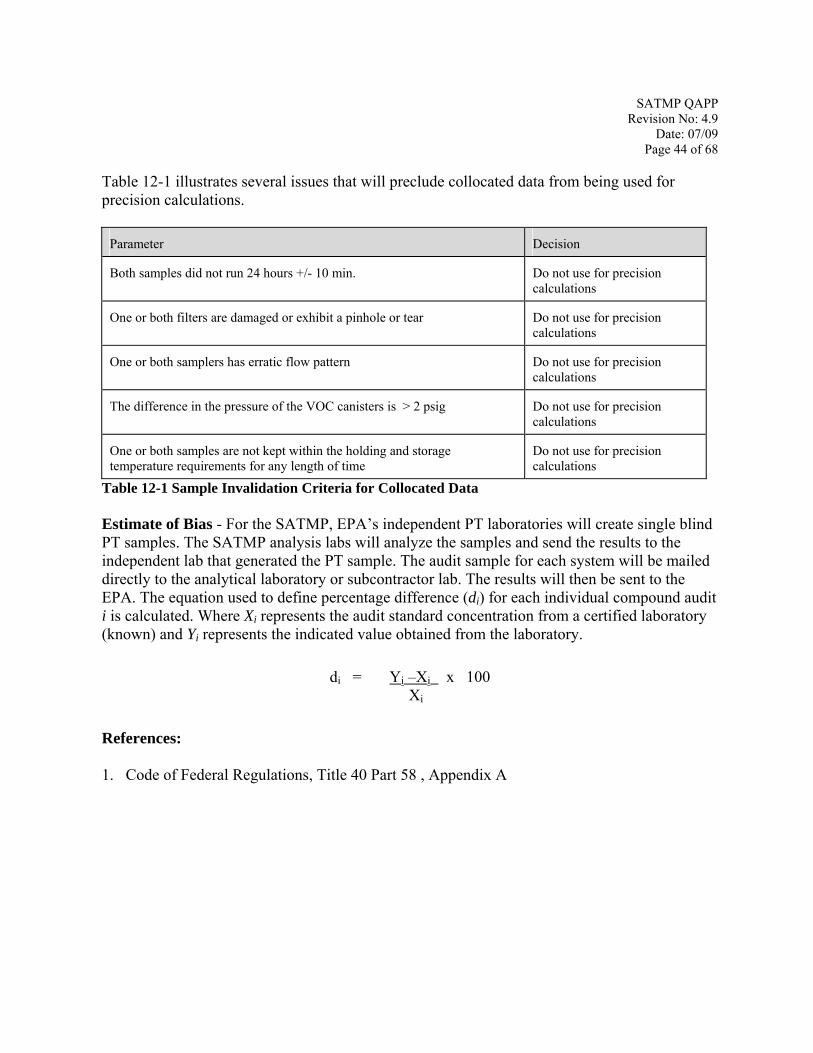
SATMP QAPP Revision No: 4.9
Date: 07/09 Page 44 of 68
Table 12-1 illustrates several issues that will preclude collocated data from being used for precision calculations.
Parameter Decision
Both samples did not run 24 hours +/- 10 min. Do not use for precision calculations
One or both filters are damaged or exhibit a pinhole or tear Do not use for precision calculations
One or both samplers has erratic flow pattern Do not use for precision calculations
The difference in the pressure of the VOC canisters is > 2 psig Do not use for precision calculations
One or both samples are not kept within the holding and storage temperature requirements for any length of time
Do not use for precision calculations
Table 12-1 Sample Invalidation Criteria for Collocated Data Estimate of Bias - For the SATMP, EPA’s independent PT laboratories will create single blind PT samples. The SATMP analysis labs will analyze the samples and send the results to the independent lab that generated the PT sample. The audit sample for each system will be mailed directly to the analytical laboratory or subcontractor lab. The results will then be sent to the EPA. The equation used to define percentage difference (di) for each individual compound audit i is calculated. Where Xi represents the audit standard concentration from a certified laboratory (known) and Yi represents the indicated value obtained from the laboratory.
di = Yi –Xi x 100
Xi
References: 1. Code of Federal Regulations, Title 40 Part 58 , Appendix A

SATMP QAPP Revision No: 4.9
Date: 07/09 Page 45 of 68
13.0 Instrument/Equipment Testing, Inspection, and Maintenance 13.1 Purpose/Background The purpose of this section in the SATMP QAPP is to discuss the procedures used to verify that all instruments and equipment are maintained in sound operating condition and are capable of operating at acceptable performance levels. 13.2 Testing All samplers used in the SATMP will be similar to the instruments described in the TO and IO Compendia, OSHA and NIOSH methods. Prior to field installation, field operators will assemble and run the samplers at the laboratory facilities (if available). The field operators will perform external and internal leak checks and temperature, pressure and flow rate verification checks. If any of these checks are is out of specification, the field technicians will attempt to correct them. If the problem is beyond their expertise, the field manager will contact the vendor for guidance. If the vendor does not provide sufficient support, then the instrument will be returned to the vendor. Once installed at the site, the field operators will run the tests at least one more time. If the sampling instrument meets the acceptance criteria, it will be assumed to be operating properly. 13.3 Inspection Inspection of various equipment and components are provided here. The inspections section is subdivided into two sections: one pertaining to laboratory issues; and one associated with field activities. 13.3.1 Inspection in Laboratory Table 13-1 lists several items that require inspections and how to appropriately document the inspection. All of the different areas of the laboratory (GC/MS, IC, HPLC and the ICP/MS rooms) will be maintained. Other inspections will be documented in the individual SOPs and QAPPs.
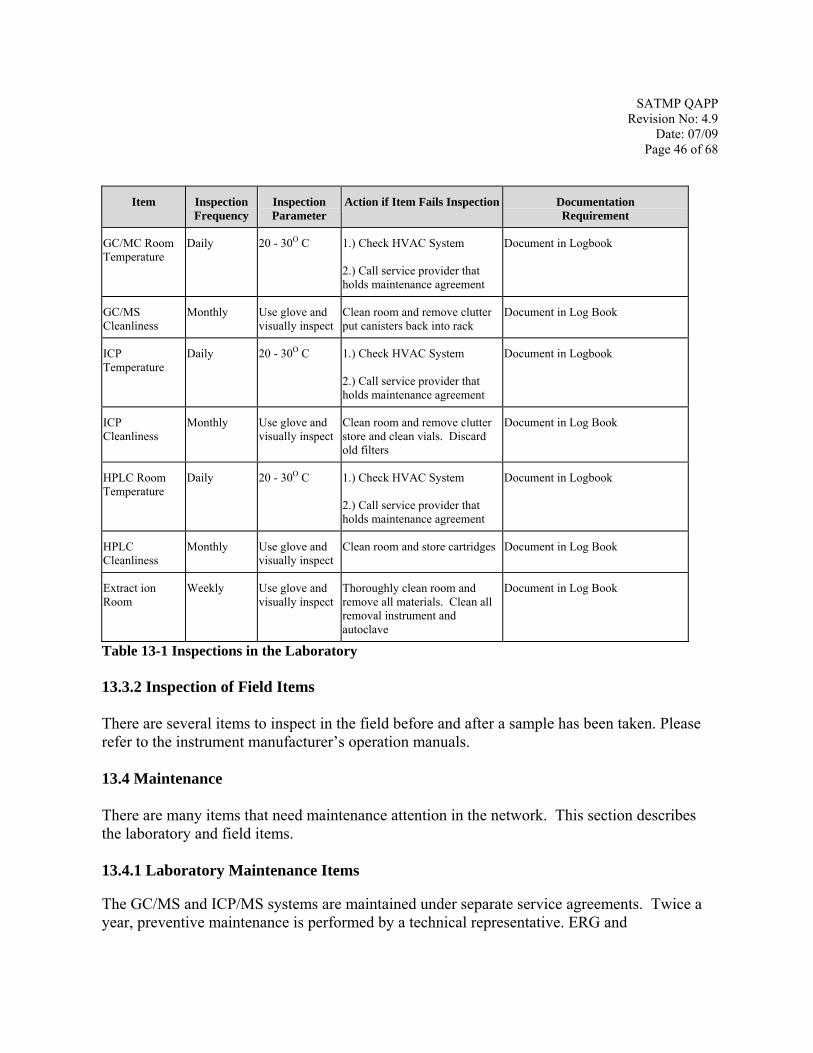
SATMP QAPP Revision No: 4.9
Date: 07/09 Page 46 of 68
Item Inspection Frequency
Inspection Parameter
Action if Item Fails Inspection Documentation Requirement
GC/MC Room Temperature
Daily 20 - 30O C 1.) Check HVAC System 2.) Call service provider that holds maintenance agreement
Document in Logbook
GC/MS Cleanliness
Monthly Use glove and visually inspect
Clean room and remove clutter put canisters back into rack
Document in Log Book
ICP Temperature
Daily 20 - 30O C 1.) Check HVAC System 2.) Call service provider that holds maintenance agreement
Document in Logbook
ICP Cleanliness
Monthly Use glove and visually inspect
Clean room and remove clutter store and clean vials. Discard old filters
Document in Log Book
HPLC Room Temperature
Daily 20 - 30O C 1.) Check HVAC System 2.) Call service provider that holds maintenance agreement
Document in Logbook
HPLC Cleanliness
Monthly Use glove and visually inspect
Clean room and store cartridges Document in Log Book
Extract ion Room
Weekly Use glove and visually inspect
Thoroughly clean room and remove all materials. Clean all removal instrument and autoclave
Document in Log Book
Table 13-1 Inspections in the Laboratory 13.3.2 Inspection of Field Items There are several items to inspect in the field before and after a sample has been taken. Please refer to the instrument manufacturer’s operation manuals. 13.4 Maintenance There are many items that need maintenance attention in the network. This section describes the laboratory and field items. 13.4.1 Laboratory Maintenance Items The GC/MS and ICP/MS systems are maintained under separate service agreements. Twice a year, preventive maintenance is performed by a technical representative. ERG and
SATMP QAPP Revision No: 4.9
Date: 07/09 Page 47 of 68
subcontractor personnel perform minor maintenance, such as column and detector maintenance, on an as-needed basis. Other maintenance information can be obtained in the UATMP and subcontractor SOPs. 13.4.2 Field Maintenance Items There are many items associated with appropriate preventive maintenance of a successful field program. Please refer to the manufacturer’s operating manual and the field SOPs for detail on maintenance items for individual samplers this website: http://www.epa.gov/ttn/amtic/airtoxschool.html.
SATMP QAPP Revision No: 4.9
Date: 07/09 Page 48 of 68
14.0 Instrument Calibration and Frequency All instrument and samplers in this program will be calibrated using NIST traceable standards. The field and laboratory technician that operate and maintain the instruments should also perform verifications/calibrations as necessary. For the SATMP, the calibrations are divided into the field and analytical laboratory portions. Note that more detailed information on the instruments used in the field can be obtained in the SOPs at this website: http://www.epa.gov/ttn/amtic/airtoxschool.html 14.1 Laboratory Instruments All laboratories will maintain sets of standards for each of the laboratory systems. Below are brief statements on how these calibrations are performed. Please refer to the UATMP or its subcontractor’s SOPs for detailed information on calibrating the laboratory instruments. For the Gas Chromatographs, a NIST Traceable cylinder is attached to a mass flow control
calibration unit. The concentrations of benzene, propane and methylene chloride are blended down to a value which will be in the higher 80% of the range of compounds found in ambient concentrations. This usually is ~ 20 ppbv. The Gas Chromatographs is allowed to reach operating conditions. The gas from the mass flow controller is injected into the system and the carrier helium is allowed to flow. Once the calibration gas is allowed to enter, two peaks should appear. The mass flow controller is then adjusted to allow the gas concentration to be ~ 40%. This process is then repeated with a concentration of 20% of range of compounds. Zero air is then generated and a baseline is determined. The system is now ready to accept ambient concentrations. After the day’s batches are run, a single point (80%) is injected into the GC.
After the Inductively Coupled Plasma unit is allowed to come to operating conditions, a standard solution of metals is injected into the ICP. The responses are noted. Distilled ion-free water is then injected into the ICP. This allows the system to reach a baseline.
For the HPLC, the procedure is the same, with the exception of the compounds injected. The compounds that are used for calibration are from standard solutions. After the HPLC has come to operating conditions, ultra-pure diluent solution is injected. This allows the system to reach a baseline. Different concentrations at 80% of the normal ambient concentrations of standard solutions are injected into the HPLC. Response peaks are observed and recorded. This procedure is repeated at the end of the analysis batch run.
SATMP QAPP Revision No: 4.9
Date: 07/09 Page 49 of 68
14.2 Field Calibrations The following calibrations are performed in the field: calibration of volumetric flow rate meter of each sampler against the working standard; calibration of sampler temperature and pressure sensors against the working temperature
standard; calibration of the min/max thermometers, normally located in the coolers in which DNPH
cartridges are transported to and from the sampler in the field, against the laboratory-checked working standard thermometer;
verification of pressure sensors; and, check initial wind speed and direction of the sensors. The following section will give more details on how these procedures are performed. Please reference the individual SOPs and/or manufacturer’s operating manual. 14.3 Calibration Method This section describes generalized calibration procedures that will be used by the laboratories and S/L APCD field technicians. 14.3.1 Laboratory/ Field - Flow Calibration After equilibrating the calibration device to the ambient conditions, connect the flow calibration device on the sampler down tube or filter holding device. If the sampler has not been calibrated before, or if the previous calibration was not acceptable, perform a leak check according to the manufacturer’s operational instruction manual, which is incorporated into SATMP SOPs. Otherwise, place the sampler in calibration or “run” mode and perform a one-point calibration or one-point flow rate verification. The field staff will only perform a leak check after calibration or verification is outside of the acceptance criteria. Following the calibration or verification, turn off the sampler pump, remove the filter, cartridge, and remove the flow calibration device, (and flow adaptor device if applicable), and replace the sampler inlet or hood. If the flow rate is determined to be outside of the required target flow rate, attempt to determine possible causes by minor diagnostic and trouble shooting techniques (e.g., leak checks), including those listed in the manufacturer’s operating instruction manual.
SATMP QAPP Revision No: 4.9
Date: 07/09 Page 50 of 68
14.3.2 Laboratory/Field Pressure Calibration According to ASTM Standard D 3631 (ASTM 1977)1, a barometer can be calibrated by comparing it with a secondary standard traceable to a NIST primary standard. Protect all barometers from violent mechanical shock and sudden changes in pressure. A barometer subjected to either of these events must be recalibrated. Maintain the vertical and horizontal temperature gradients across the instruments at less than 0.1EC/m. Locate the instrument so as to avoid direct sunlight, drafts, and vibration. A Fortin mercury type of barometer is used in the laboratory to calibrate and verify the aneroid barometer used in the field to verify the barometric sensors of samplers. Details are provided in the appropriate SOP. 14.3.3 Laboratory/Field Temperature Calibration The operations manuals and individual laboratory and field sampler SOPs will have detailed procedures for calibrating the temperature sensor for the particular samplers and instruments. The EPA Quality Assurance Handbook, Volume IV (EPA 2008)2 Section 4.3.4, provides information on calibration equipment and methods for assessing response characteristics of temperature sensors. 14.3.4 Wind sensor Calibration The SATMP will utilize sonic anemometers in the field. Sonic anemometry is a relatively new technology that is gaining national acceptance, due to lower levels of detection and no moving parts. However, because the sensors do not have any moving parts, calibration of theses sensors can be challenging. In general, sonic anemometers must be mounted so they are level and are oriented to true North. Please reference the instrument manufacturer’s operating manual for instruction on calibrations, orientation and alignment. Additional background information on wind direction alignment can be obtained in the EPA’s QA Handbook, Volume IV: Meteorological Measurements2. 14.4 Calibration Standard Materials and Apparatus Flow Rate - The flow rate standard apparatus used for flow-rate calibration (field- NIST-traceable, piston, thermister or venturi type volumetric flow rate meter; laboratory -NIST-traceable manual soap bubble flow meter and time monitor) has its own certification and is traceable to other standards for volume or flow rate which are themselves NIST-traceable. A calibration relationship for the flow-rate standard, such as an equation, curve, or family of curves, is established by the manufacturer (and verified if needed) that is accurate to within 2% over the expected range of ambient temperatures and pressures at which the flow-rate standard is used. The flow rate standard will be recalibrated and recertified at least annually.
SATMP QAPP Revision No: 4.9
Date: 07/09 Page 51 of 68
The actual frequency with which this recertification process must be completed depends on the type of flow rate standard; some are much more likely to be stable than others. In addition to providing excellent documentation of the certification of the standard, a control chart also gives a good indication of the stability of the standard. If the two standard-deviation control limits are close together, the chart indicates that the standard is very stable and could be certified less frequently. The minimum recertification frequency is 1 year. On the other hand, if the limits are wide, the chart would indicate a less stable standard that will be recertified more often. Temperature - The temperature standard used for temperature calibration will have its own certification and be traceable to a NIST primary standard. A calibration relationship to the temperature standard (an equation or a curve) will be established that is accurate to within 2% over the expected range of ambient temperatures at which the temperature standard is to be used. The temperature standard must be re-verified and recertified at least annually. The S/L APCDs will use NIST-traceable mercury in glass thermometer or thermistor type temperature probes for laboratory calibration. The field temperature standards will be digital readout thermistor type probes. Each probe will be certified against NIST-traceability standards. Calibration Frequency - Since the SATMP is a 60 day project, calibrations must be performed at the beginning and at the end of the sampling, or if the instrument malfunctions or is repaired. More frequent calibrations are encouraged, but not required and are left to the field operator’s discretion. These events, as well as sampler equipment maintenance and inspections will be documented in field data records (i.e., CoC forms) and notebooks. The records will normally be controlled by the individual agency field managers, and located in the labs or field sites when in use or at the manager’s offices when being reviewed or used for data validation. References:
1. ASTM. 1977. Standard test methods for measuring surface atmospheric pressure. American Society for Testing and Materials. Philadelphia, PA. Standard D 3631-84.
2. EPA. 2008. Quality Assurance Handbook for Air Pollution Measurement Systems
Volume IV: Meteorological Measurements. U.S. Environmental Protection Agency. Document No. EPA/454/B-08-002. http://www.epa.gov/ttn/amtic/met.html
SATMP QAPP Revision No: 4.9
Date: 07/09 Page 52 of 68
15.0 Data Acquisition Requirements
This section addresses data not obtained by direct measurement from the SATMP. This includes both outside data and historical monitoring data. Non-monitoring data and historical monitoring data are used by the SATMP in a variety of ways. The procedures described in this section apply both to data acquired through the SATMP and to information previously acquired and/or acquired from outside sources. 15.1 Acquisition of Non-Direct Measurement Data The SATMP will rely on data that are generated through field and laboratory operations; however, other significant data are obtained from sources outside the EPA or from historical records. 15.1.1 Chemical and Physical Properties Data Physical and chemical properties data and conversion constants are often required in the processing of raw data into reporting units. This type of information that has not already been specified in the monitoring regulations will be obtained from nationally and internationally recognized sources.
• National Institute of Standards and Technology (NIST); • International Standards Organization (ISO), International Union of Pure and Applied
Chemists (IUPAC), American National Standards Institute (ANSI), and other widely-recognized national and international standards organizations;
• U.S. EPA; and, • Operating instrument manuals and SOPs.
15.1.2 Sampler Operation and Manufacturers' Literature Another important source of information needed for sampler operation is manufacturers' literature. Operations manuals and users' manuals frequently provide numerical information and equations pertaining to specific equipment. Field personnel are cautioned that such information is sometimes in error, and appropriate cross-checks will be made to verify the reasonableness of information contained in manuals.
SATMP QAPP Revision No: 4.9
Date: 07/09 Page 53 of 68
15.1.2 Other Ancillary Data Other data, such as GIS and satellite mapping data are useful for siting and analysis of the data collected for this project. Here is a partial list of some data that will be useful to this program.
Standard Google Earth™ layers; Markers for schools to be monitored, with pop-up box indicating name, address, and
pollutants to be monitored; Other schools in the area; Airports; Major roadways in the vicinity of the school, which is a standard Google Earth™ layer;
and; Demographics of the area.
15.1.5 National Weather Service Data Meteorological information is gathered from the U.S. Weather Service stations across the nation. Parameters include: temperature, relative humidity, barometric pressure, rainfall, wind speed, wind direction, cloud type/layers, cloud cover and visibility range.
SATMP QAPP Revision No: 4.9
Date: 07/09 Page 54 of 68
16.0 Data Management 16.1 Background and Overview As laboratory analysis is completed, ERG will submit the data to the Air Quality System (AQS). The processing of the data through AQS will be handled in a method consistent with the existing data processing activities. Namely, the data will be screened to ensure that the data are properly formatted and use valid coding values (for example, ensure the site id is valid). Once the data have passed this first set of validations, the data will undergo a statistical evaluation within AQS; the data and evaluation results will be reviewed verified and reprocessed if necessary. Once the data are deemed of acceptable quality, they are available from AQS. for analysis. EPA will promote the public availability of quality assured data through the project web site. This section will detail how the data will be managed both by the UATMP contractor and EPA. 16.2 UATMP Contract Data Management This section describes the data management operations pertaining to field monitoring supported by ERG, with an overview of the operations and analyses performed on raw (as-collected) data. These operations include data recording, validation, transformation, transmittal, reduction, analysis, management, storage, and retrieval. The sample tracking and CoC information are entered into the ERG LIMS. All users
must be authorized by the Program Manager. The following privilege levels are defined:
Data Entry Privilege - The individual may see and modify only data within the
LIMS that he or she has personally entered; Administration Privilege - Data Administrators for the database are allowed to change
data as a result of QA screening and related reasons. The Data Administrator is responsible for performing the following tasks on a regular basis: 1) merging/correcting the duplicate data entry files and 2) running verification/validation routines, correcting data as necessary and generating summary data. 16.2.1 Data Recording Data entry, validation, and verification functions are all integrated in the ERG LIMS. Procedures for providing all laboratory notebook information and subsequent data entry are provided in SOP ERG-MOR-0392 for Maintaining Laboratory Notebooks.
SATMP QAPP Revision No: 4.9
Date: 07/09 Page 55 of 68
16.2.2 Data Validation Data validation is a combination of checking that data processing operations have been carried out correctly and of monitoring the quality of the field operations. Data validation can identify problems in either of these areas. Once problems are identified, the data can be corrected or invalidated, and corrective actions can be taken for field or laboratory operations. The following validation functions are incorporated to ensure quality of data entry and data processing operations: Completeness Checks – When the data are processed, certain completeness criteria
must be met. For example, each sample must have a start time, an end time, an average flow rate, dates analyzed, and operator and technician names.
Data Retention – Raw data sheets are retained on file at ERG for a minimum of five years after the close of the contract, and are readily available for audits and data verification activities. After five years, hardcopy records and computer backup media are disposed.
Statistical Data Checks – Errors found during statistical screening will be traced back to original data entry files and to the raw data sheets, if necessary. These checks shall be run on an annual schedule and prior to any data submission to AQS. Data validation is the process by which raw data are screened and assessed before they can be included in the main data base.
16.2.3 Data Transformation Calculations for transforming raw data from measured units to final concentrations use standardized procedures listed in the individual SOPs or subcontractor’s QAPP. All data are double checked to ensure there are no incorrect transformations. All new spreadsheets also go through the laboratory contractor’s internal peer review, to ensure that all data submitted are accurate. The reviewer uses hand calculations and visual verification to review all data reported to the EPA and S/L agencies are valid following guidelines outlined in SOP ERG-MOR-0572. Separate SOPs for Developing, Documenting, and Evaluating the Accuracy of Spreadsheet Data are presented in SOP ERG-MOR-0172. 16.2.4 Data Transmittal Data transmittal occurs when data are transferred from one person or location to another or when data are copied from one form to another. Some examples of data transmittal are copying raw data from a notebook onto a data entry form for keying into a computer file and electronic transfer of data over a computer network. Each individual SOP discusses the procedures for determining the calculations of concentrations as well as data entry. ERG will
SATMP QAPP Revision No: 4.9
Date: 07/09 Page 56 of 68
report all ambient air quality data and information specified by the AQS User’s Guide1. The data and information will be fully screened and validated and will be submitted directly to the AQS via electronic transmission, in the format of the AQS, and in accordance with the annual schedule.
16.3 Data Tracking The ERG LIMS database contains the necessary input functions and reports appropriate to track and account for the whereabouts of specific samples during processing operations. The following input locations are used to track sample location and status: • Laboratory (initial receipt) • Sample receipt; • Canister number (VOC only); • Filter package for the laboratory (filter numbers in each package are recorded); • Laboratory (receipt from field) • Package receipt (package is opened and contents are logged in); • Samples are stored in correct locations (i.e., carbonyl tubes, XAD resin, and PUF are
stored in separate refrigerators, metals filters are stored in the ICP-MS laboratory, and canisters are stored in the laboratory); and,
• Refrigerator, by refrigerator number. Security of the data in the UATMP database is ensured by the following controls:
• Password protection on the data base that defines three levels of access to the
data; • Regular password changes (quarterly for continuing personnel); • Logging of all incoming communication sessions, including the originating
telephone number, the user’s ID, and connect times; and • Storage of media including backup tapes in locked, restricted access areas.
16.4 EPA Data Reporting Requirements Below are the data reporting requirements that must be adhered. If a S/L APCD is not familiar with submitting HAPs or meteorological data, please refer to the document in the Reference Section at the end of this chapter. HAPs Sample Analyses - Quality assured ambient monitoring data shall be reported to the U.S. EPA’s AQS database (http://www.epa.gov/ttn/airs/airsaqs) not later than 14 calendar days following sample collection. All data, including any values below MDL, shall be reported to AQS. Under no circumstances are data value substitutions (e.g., ½ MDL) acceptable.
SATMP QAPP Revision No: 4.9
Date: 07/09 Page 57 of 68
Meteorological - Hourly scalar and vector wind speed and direction data will be downloaded from the data loggers concurrent with sample pickup from each site (i.e., every 6th day) and submitted for data processing and reporting to AQS. EPA will provide additional instructions once the specific equipment types are determined. 16. 5 EPA OAQPS Data Management The AQS is EPA’s primary ambient air quality repository. In order to have the ability to submit data to AQS, organizations must be provided access to a screening group, which defines which monitors may be updated by the organization. Once the data has been validated by AQS, the data must undergo a statistical evaluation to check for any pattern anomalies in the dataset. Once that has been reviewed, the data can then be “posted” to be made available to the public. All data that is collected for the SATMP will be submitted to the AQS using a screening group established by EPA exclusively for this project. This includes any samples gathered and/or analyzed by organizations other than ERG. Once the data is submitted to AQS, ERG will perform the above mentioned statistical analysis of the data, but will not post the data at this time. On a frequent basis, EPA personnel will review the statistically evaluated data submitted by ERG. Once a site has completed the study period and the data has been reviewed by EPA, ERG will post the data for that site to be made available in AQS EPA health and air quality science will analyze data and publically post analysis results on the project web site. Reference: 1. Air Quality System User’s Guide, http://www.epa.gov/ttn/airs/airsaqs/manuals/manuals.htm 2. The Eastern Research Group SOPs are Confidential Business Information. Eastern Research Group’s contact information is in the Acknowledgment section.
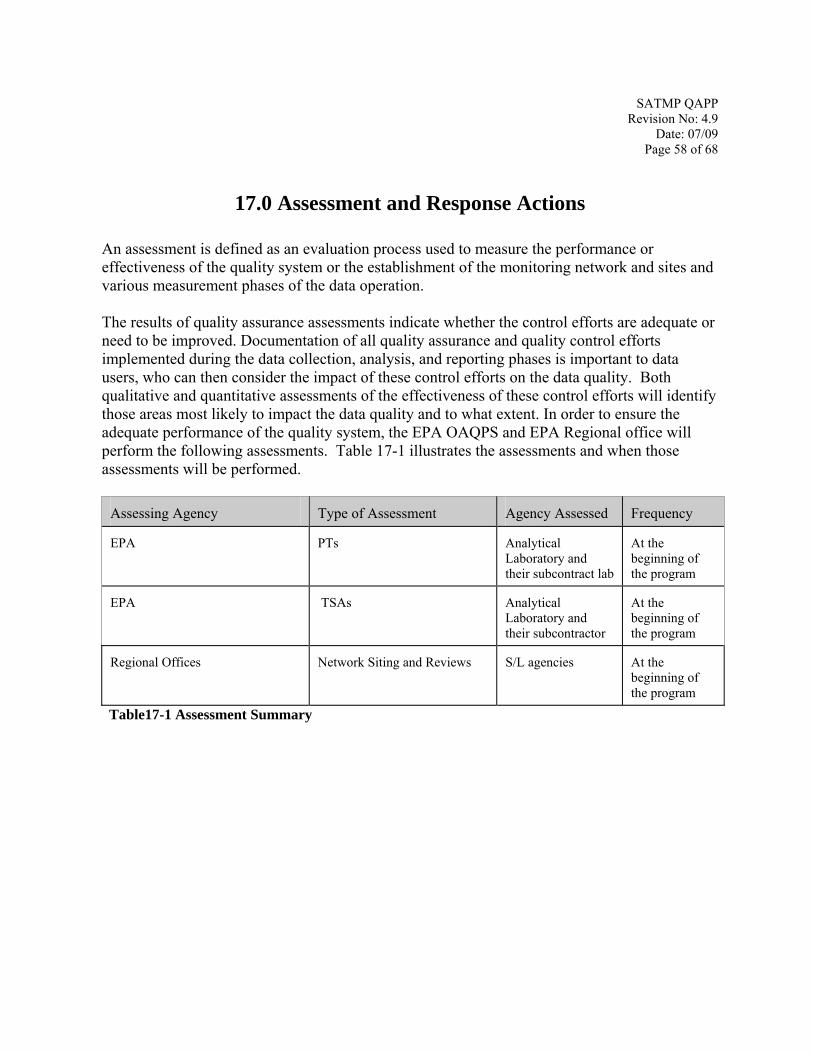
SATMP QAPP Revision No: 4.9
Date: 07/09 Page 58 of 68
17.0 Assessment and Response Actions
An assessment is defined as an evaluation process used to measure the performance or effectiveness of the quality system or the establishment of the monitoring network and sites and various measurement phases of the data operation. The results of quality assurance assessments indicate whether the control efforts are adequate or need to be improved. Documentation of all quality assurance and quality control efforts implemented during the data collection, analysis, and reporting phases is important to data users, who can then consider the impact of these control efforts on the data quality. Both qualitative and quantitative assessments of the effectiveness of these control efforts will identify those areas most likely to impact the data quality and to what extent. In order to ensure the adequate performance of the quality system, the EPA OAQPS and EPA Regional office will perform the following assessments. Table 17-1 illustrates the assessments and when those assessments will be performed.
Assessing Agency Type of Assessment Agency Assessed Frequency
EPA PTs Analytical Laboratory and their subcontract lab
At the beginning of the program
EPA TSAs Analytical Laboratory and their subcontractor
At the beginning of the program
Regional Offices Network Siting and Reviews S/L agencies At the beginning of the program
Table17-1 Assessment Summary
SATMP QAPP Revision No: 4.9
Date: 07/09 Page 59 of 68
17.1 Project Planning and Assessment Activities 17.1.1 Network Siting and Reviews In identifying specific monitoring locations on school grounds, EPA Regional, S/L APCD staff and school officials will consider the following types of information: Emission information, such as emission density maps for the region in which the
monitor is located and emission maps showing the major sources of emissions; Best professional judgment; GIS updates; Access and safety issues; and, Meteorology.
17.1.2 Technical Systems Audits A TSA is a thorough and systematic on-site qualitative audit, where facilities, equipment, personnel, training, procedures, and record keeping are examined for conformance to the QAPP. EPA OAQPS staff or its designee will perform TSAs on the project contract laboratory and its subcontractor. Other laboratories that participate in the program will have a TSA performed by the Regional offices. Key personnel to be interviewed during the audit are those individuals with responsibilities for: planning, field operations, laboratory operations, QA/QC, data management, and reporting. To increase uniformity of the TSA, an audit checklist will be developed and used. This checklist is based on the EPA G-71 guidance. The audit team will prepare a brief written summary of findings, organized into the following areas: planning, field operations, laboratory operations, quality assurance/quality control, data management, and reporting. Problems with specific areas will be discussed and an attempt made to rank them in order of their potential impact on data quality. The audit finding form has been designed such that one is filled out for each major deficiency that requires formal corrective action. The finding should include items like: systems impacted, estimated time period of deficiency, site(s) affected, and reason of action. The finding form will inform the Division about serious problems that may compromise the quality of the data and therefore require specific corrective actions. They are initiated by the auditors, and discussed at the debriefing. During the debriefing, if the audited group is in agreement with the finding, the form is signed by the group’s branch manager or his designee during the exit interview. If a disagreement occurs, the auditors will record the opinions of the group audited and set a time at some later date to address the finding at issue. OAQPS and the audited organization will work together to solve required corrective actions.
SATMP QAPP Revision No: 4.9
Date: 07/09 Page 60 of 68
17.1.3 Proficiency Testing Laboratory bias will be determined by the analysis of known reference analytes prepared by independent laboratories, i.e., the PT samples. The UATMP contract laboratory supporting the school monitoring project currently participates in the EPA’s national PT program that supports the NATTS and non-NATTS laboratories. The PTs for some of the compounds will be created by Alion Inc., an EPA independent contractor. For compounds that are not currently in the EPA’s National PT program, they will be purchased by an independent PT provider. The provider will be identified at a later date. The PT is an assessment tool for the laboratory operations only. An EPA’s Contract laboratory independent from the UATMP contract laboratory creates “blind” samples. Upon receipt, the laboratory logs in the samples and performs the normal handling routines as any other sample. The PT is analyzed in accordance with the SOPs. Then the results are reported to the EPA. The contract laboratory that creates the PT samples will write PT report and sends a copy of the results to the laboratory and the EPA OAQPS QA coordinator. Any results outside of the EPA’s acceptance criteria are then noted in the PT report. Reference: 1. EPA Guidance on Technical Audits and Related Assessments for Environmental Data Operations
(QA/G-7), May 2006. http://www.epa.gov/quality/qa_docs.html
SATMP QAPP Revision No: 4.9
Date: 07/09 Page 61 of 68
18.0 Reports to Management This section describes the quality-related reports and communications to management necessary to support SATMP monitoring and the associated data acquisition, validation, assessment, and reporting. Since this is a short term program, it is envisioned that one report will be issued; a QA final report (QAFR). 18.1 QA Final Report After the monitoring has been completed, the OAQPS staff will gather PT data, and precision, bias and completeness information from the collocated monitoring and perform a Data Quality Assessment (DQA). The DQA process is discussed in Section 20.0 of this QAPP. Please reference that section for details.
SATMP QAPP Revision No: 4.9
Date: 07/09 Page 62 of 68
19.0 Data Review This section describes how the UATMP contractor’s procedures that will be utilized to perform data review and validation. 19.1 Data Review Design
The contractor LIMS is used to facilitate data storage, retrieval, analysis, and reporting. Data summaries, QC charts, and other graphs, are generated in a cost-effective manner and aid in maintaining consistent data quality. All data reported by ERG will use a flagging system, as specified by the UATMP QAPP. Each sample received at the ERG Laboratory is logged into the ERG LIMS. The accompanying field data forms are reviewed to verify that all data entry is complete and correct. The personnel performing the data review: • are familiar with typical diurnal concentration variations (for example, benzene,
toluene, and xylene concentrations usually increase and decrease together, since the occurrence of these compounds is attributed to mobile sources);
• are familiar with the type of instrument malfunctions which cause characteristic trace irregularities;
• recognize that cyclical or repetitive variations (at the same time each day or at periodic intervals during the day) may be caused by excessive line voltage or temperature variations {note that nearby source activity can also cause erroneous or non- representative measurements}; and
• recognize that flow rates showing little or no activity often indicate flow problems, or sample line leaks.
Information used to validate air toxics data includes: • Multi-point calibrations - the multipoint calibrations are used to establish proper initial
calibration and can be used to show changes in calibration. • Instrument logs - all activities and samples analyzed are entered into the log books to
track the samples throughout the measurement procedures. • Blanks replicate and spike results - these QC indicators can be used to ascertain
whether sample handling or analysis is causing bias in the data set. These data will include summaries for the monitoring locations in the respective cities, analysis and interpretation of data trends for that group of prevalent compounds, illustration of changes in ambient air concentrations of the most prevalent components of urban air pollution from year to year, completeness report and collocated and duplicate results from the field and replicate results from the laboratory.
SATMP QAPP Revision No: 4.9
Date: 07/09 Page 63 of 68
The reliability and acceptability of environmental analytical information depends on the rigorous completion of all the requirements outlined in the QA/QC protocol. During data analysis and validation, data are filtered and accepted or rejected based on the set of QC criteria listed in the individual SOPs. The data are critically reviewed to locate and isolate spurious values. A spurious value, when located, is not immediately rejected. All questionable data, whether rejected or not, are maintained along with rejection criteria and any possible explanation. Such a detailed approach can be time-consuming but can also be helpful in identifying sources of error and, in the long run, save time by reducing the number of outliers. 19.2 Data Review Prior to performing any statistical calculations, the reported data from the chain of custody forms are checked to ensure accurate transcription. The value is double-checked and a comparison to previously recorded data is made. Using conveniently formatted and bound prepared data recording forms is essential; hardcopies of data can also be obtained directly from measuring devices equipped with the necessary digital recording peripherals. Usually, this method of recording data is sufficient if the hardcopies are properly labeled and filed, although a periodic check will be performed to ensure the proper operation of such a device. The collected data are reviewed by the laboratory contractor’s project Analyst and the Task Leader. The data are scrutinized daily to eliminate the collection of invalid data. The analyst records any unusual circumstances (no matter how minor) during analysis (e.g., power loss or fluctuations, temporary leaks or adjustments, operator error) on the chain of custody form and notifies the analytical Task Leader. 19.3 Data Verification Data verification consists of confirmation by examination and provision of objective evidence that specified requirements have been fulfilled. The specific requirements are QC checks, acceptable data entry limits, etc. Data validation is confirmation by examination and provision of objective evidence that the particular requirements for a specific intended use are fulfilled. Intended use deals with data of acceptable quality to permit making decisions at the correct level of confidence. The following sections outline data validation and usability requirements. At least 10% of the database is checked to verify its validity. Items checked include original data sheets, checks of all calculations (from calibration to sample analysis), and data transfers. As the data are checked, corrections are made to the database as errors or omissions are encountered. If errors are located, all of the data is checked to verify data quality. The analytical reviewer examines all data for overall data quality and completeness. The project Program Manager reviews all data before data are reported to the EPA.
SATMP QAPP Revision No: 4.9
Date: 07/09 Page 64 of 68
19.4 Data Reduction, Validation, and Reporting A sample analysis logbook is maintained to detail pertinent sample information at the time of analysis. Entries include site code, sample date, analysis date, and electronic file names. Chromatograph and area count reports from each detector are printed for each analysis and the analytical database for each analysis acquires, integrates, and stores the analytical data. Project data are processed using a personal computer system containing the software. The data are reported with the chromatogram and detailed information. Electronic copies of the data are stored on the contractors LIMS server. The analytical procedures performed during the monitoring program will be checked against those described in the QAPP and the SOPs. Deviations from the QAPP will be classified as acceptable or unacceptable, and critical or noncritical. Acceptance criteria are stated in each method and in Section 6.9 of this document. QC samples and procedures performed during the monitoring program will be checked against those described in Section 7 of this QAPP. Other QC results (matrix/method spike recoveries, blank analysis, duplicate analysis, etc.) will be reviewed as well. All results outside specified parameters will be discussed with the EPA for corrective action. In some cases, reference methods have guidance on corrective action. Where available, the guidance in the reference methods will be followed. Otherwise, the data will be flagged and reported to the EPA.
Documentation of equipment and instrument calibration (e.g., monitoring equipment and analytical instruments) will be checked against the values used in data collection. The documentation will be checked to ensure that the calibration: • Was performed within an acceptable time prior to the sampling dates;
Includes the proper number of calibration points; • Was performed using appropriate standards for the reported measurements; and • Had acceptable checks to ensure that the measurement system or analytical system was
stable when the calibration was performed.
The data processing systems will be checked by using raw data for which calculated values are already known. The example data will be put into the system and the calculated results compared to the known values.

SATMP QAPP Revision No: 4.9
Date: 07/09 Page 65 of 68
20.0 Data Validation, Verification and Analysis
This section was taken from the UATMP contract QAPP. Many of the processes for verifying and validating the measurement phases of the data collection operation have been discussed in Section 19. This section will outline how ERG will produce data that will meet the stated objectives by performing software tests, plotting, and other methods of analysis. 20.1 Process for Validating and Verifying Data 20.1.1 Verification of Data After a reporting batch is completed, a thorough review of the data will be conducted for completeness and manual and electronic data entry accuracy. For the chromatographic data, the entries are reviewed to reduce the possibility of entry and transcription errors. Once the data are transferred to the ERG LIMS database, the data will be reviewed for routine data outliers and data outside acceptance criteria. These data will be flagged appropriately. Appropriate data qualifiers or flags can be found in the SOPs. 20.1.2 Validation Records of all samples will be retained on file for 5 years, valid or invalid. Information will include a brief summary of why the sample was invalidated along with the associated flags. This record will be available on stored electronic media. Certain criteria based upon the laboratory analyst’s judgment have been developed that will be used to invalidate a sample or measurement (i.e., water in cartridges, vacuum on canister too low, etc.). In all cases the sample will be returned to the laboratory for further examination. When the laboratory analyst reviews the CoC forms, he/she will look for possible problems. Filters that have flags related to obvious contamination, filter damage, or field accidents will be examined immediately. Upon concurrence of the associated laboratory analyst and the Analytical Coordinator, these samples will be invalidated. 20.2 Data Analysis Data analysis refers to the process of interpreting the data that are collected. Although there are a large number of parameters to analyze, many of these parameters present similar characteristics. The following describe software programs, described below, that helps with analysis of the data. Spreadsheets - Spreadsheets allow the user to input data and statistically analyze, plot and graph linear data. This type of analysis will allow the user to see if there are any variations in the data sets. In addition, various statistical tests such as tests for linearity, slope, intercept or
SATMP QAPP Revision No: 4.9
Date: 07/09 Page 66 of 68
correlation coefficient can be generated between two strings of data. Time series plots can help identify the trends. Large jumps or dips in concentrations, periodicity of peaks, and expected or unexpected relationships among species. VOCDat - Recently, the EPA has made software available that can analyze data. One such program is VOCDat, developed by Sonoma Technology, Inc., under contract to EPA. ERG has a subcontract with Sonoma Technology, Inc., who provides VOCDat to S/L agencies. VOCDat is a Windows-based program that provides a graphical platform from which to display collected VOC data; to evaluate data according to specified quality control procedures; and for exploratory data analysis. This program will enable ERG to rapidly validate and release their air toxics VOC data to AQS. VOCDat displays the observed VOC concentrations using scatter, fingerprint, and time series plots. Customizable screening criteria may be applied to the data and the quality control codes may be changed for individual data points as well as for the entire sample on all plots. VOCDat allows a user to find out the percentage a particular compound is of the total. This test allows the user the ability to see if the data exceed the 3 sigma rule for outliers.
SATMP QAPP Revision No: 4.9
Date: 07/09 Page 67 of 68
21.0 Reconciliation with Data Quality Objectives 21.1 Reconciling Results with DQOs The DQOs for the air toxics monitoring network were developed in Section 6. The following is excerpted from section 6.9. In order to better evaluate potential impacts of air toxics at some schools in the U.S., monitoring will commence at selected locations. If the following criteria are met, the data will be considered of sufficient quantity and quality for the decision-making to commence as described in section 6.3:
1. Data are collected with a coefficient of variance (precision) and bias as stated in Tables 6-1 through 6-3;
2. Data completeness is 100%, that is at least 10 samples will be collected; 3. MDLs are at or below those specified in Tables 6-1 through 6-3 and; 4. Where applicable, sufficient samples are collected when the predominant wind
direction is from the source(s) in question. This section of the QAPP will outline the assessment procedures that OAQPS QA staff will follow to determine whether the data complies with the stated goals by performing a Data Quality Assessment (DQAs) that is described in EPA QA/G-9: Guidance for Data Quality Assessment1. The DQA will be detailed in the QAFR that is discussed in Section 18, Reports to Management. For the stated DQO, the assessment process must follow statistical routines. The following five steps will discuss how this will be achieved. 21.2 Five Steps of DQA Process As described in EPA QA/G-9, the DQA process is comprised of five steps. The steps are detailed below. Step 1: Review DQOs and Sampling Design - Section 6 of this QAPP contains the details for the DQOs, including defining the objectives of the SATMP and stating the MQOs. Section 8.0 of this QAPP contains the details for the sampling design, including the rationale for the design, the design assumptions, and the sampling locations and frequency.
SATMP QAPP Revision No: 4.9
Date: 07/09 Page 68 of 68
Step 2: Conduct Preliminary Data Review - A preliminary data review will be performed to uncover potential limitations to using the data, to reveal outliers, and generally to explore the basic structure of the data. The first step is to calculate basic summary statistics, generate graphical presentations of the data, and review these summary statistics and graphs. Step 3: Select the Statistical Test - OAQPS staff will generate summary statistics for each of its primary and QA samplers. The summary statistics will be calculated from only valid samples. The following statistical tests will be performed: < Examination of precision of the data as described in Section 12.1.3; < Examination of bias from the PT data. OAQPS will generate graphs and tables to present the results from the summary QA statistics. Step 4: Draw Conclusions from the Data - If the MQOs are met, and the study design acceptable, then it can be assumed that the program QA objectives have been met. This conclusion can be included in the QAFR. If any MQOs are not met, then these will be noted in the QAFR as well. Step 5: Action Plan Based on Conclusions from DQA - The QAFR will be presented to EPA management and analysis staff when completed. It is outside of the scope of the QAPP or QAFR what actions might follow this school monitoring program. However, the information from this program will be used in considering and undertaking any additional study or mitigation actions, if needed. References: 1. Guidance for the Data Quality Assessment Process EPA QA/G-9 U.S. Environmental
Protection Agency, QAD EPA/600/R-96/084, July 1996.