Embed Size (px)
Citation preview

Quality Assurance Project Plan University of Rhode Island Watershed Watch Ambient and Marine Field Assays Date: September 2005 Revised: July 2012 Prepared for: U.S. Environmental Protection Agency N.E. Region 1 1 Congress Street, Suite 1100 Boston, Massachusetts 02114-2023 Prepared by: University of Rhode Island Watershed Watch URI Cooperative Extension Water Quality Program College of the Environment and Life Sciences Coastal Institute in Kingston 1 Greenhouse Road Kingston, Rhode Island, 02881
Quality Assurance Project Plan
University of Rhode Island Ambient and Marine Field Monitoring and Assays
University of Rhode Island Watershed Watch URI Cooperative Extension Water Quality Program
College of the Environment and Life Sciences Coastal Institute in Kingston
1 Greenhouse Road Kingston, Rhode Island, 02881
Linda T Green, Program Director Elizabeth M. Herron, Program Coordinator
Arthur J. Gold, Program Advisor
Marie Evans Esten, original QAPP Preparer Loon Environmental, LLC Kingston, Rhode Island
2005
Linda T. Green, QAPP revision preparer URI Watershed Watch, Kingston, Rhode Island
2012

URI WATERSHED WATCH TECHNICAL REPORT NO. 5 Linda Green, M.S., Elizabeth Herron, M.A. and Arthur Gold, Ph.D. are members of the Dept. of Natural Resources Science, College of the Environment and Life Sciences, University of Rhode Island. Contribution #5029 of the RI Agricultural Experiment Station, with support from RI Cooperative Extension, RI Department of Environmental Management, United States Department of Agriculture and local governments. Cooperative Extension in Rhode Island provides equal opportunities without regard to race, age, religion, color, national origin, sex or preference, creed or handicap For additional information or to request a copy: Linda T Green, Program Director 401-874-2905 - [email protected] Elizabeth M. Herron, Program Coordinator 401-874-4552 - [email protected] Natural Resources Science Dept. The Coastal Institute in Kingston 1 Greenhouse Road Kingston, RI 02881 www.uri.edu/ce/wq/ww/html/ww.html

QAPP –Watershed Watch Ambient and Marine Field Assays Revision: 1 Date: November 20, 2012
i
Approval List Lead Organization Program Leader, University of Rhode Island Cooperative Extension Water Quality Programs and Faculty Advisor to the University of Rhode Island Watershed Watch (URIWW) _______________________________________________________________ Dr. Arthur Gold Date University of Rhode Island College of the Environment and Life Sciences Department of Natural Resources 1 Greenhouse Road Kingston, Rhode Island 02881 Phone: 401-874-2903 University of Rhode Island Watershed Watch Program Director and Laboratory Project Manager – Nutrients _________________________________________________________________ Linda Green Date University of Rhode Island Watershed Watch Laboratory University of Rhode Island Cooperative Extension 1 Greenhouse Road Kingston, Rhode Island 02881 Phone: 401-874-2905 Fax: 401-874-4561 University of Rhode Island Watershed Watch Program Coordinator and Laboratory Project Manager – Microbiology __________________________________________________________________ Elizabeth Herron Date University of Rhode Island Watershed Watch Laboratory University of Rhode Island Cooperative Extension 1 Greenhouse Road Kingston, Rhode Island 02881 Phone: 401-874-4552 Fax: 401-874-4561 Laboratory Quality Assurance Advisor _____________________________________________________________________ Jose Amador Date University of Rhode Island Department of Natural Resources Science 1 Greenhouse Road Kingston, Rhode Island 02881 Phone: 401-874-2905 Fax: 401-874-4561

QAPP –Watershed Watch Ambient and Marine Field Assays Revision: 1 Date: November 20, 2012
ii
United States Environmental Protection Agency, Region 1 _____________________________________________________________________ Robert Adler Date United States Environmental Protection Agency, Region 1 1 Congress Street, Suite 1100 Boston, Massachusetts 02114-2023 Phone: 617-918-1396 Fax: 617-918-2064 United States Environmental Protection Agency, Region 1 _____________________________________________________________________ Steve DiMattei Date United States Environmental Protection Agency, Region 1 New England Laboratory 11 Technology Drive North Chelmsford, Massachusetts 01863 Phone: 617-918-8369 Rhode Island Department of Environmental Management _____________________________________________________________________ Sue Kiernan – Deputy Chief Date Rhode Island Department of Environmental Management Office of Water Resources 235 Promenade Street Providence, Rhode Island 02908 Phone: 401-222-3961

QAPP –Watershed Watch Ambient and Marine Field Assays Revision: 1 Date: November 20, 2012
iii
Distribution List
Lead Organization Program Leader, University of Rhode Island Cooperative Extension Water Quality Programs and Faculty Advisor to the University of Rhode Island Watershed Watch (URIWW) Dr. Arthur Gold University of Rhode Island College of the Environment and Life Sciences Department of Natural Resources 1 Greenhouse Road Kingston, Rhode Island 02881 Phone: 401-874-2903 University of Rhode Island Watershed Watch Program Director and Laboratory Project Manager – Nutrients Linda Green University of Rhode Island Watershed Watch Laboratory University of Rhode Island Cooperative Extension 1 Greenhouse Road Kingston, Rhode Island 02881 Phone: 401-874-2905 Fax: 401-874-4561 University of Rhode Island Watershed Watch Program Coordinator and Laboratory Project Manager – Microbiology Elizabeth Herron University of Rhode Island Watershed Watch Laboratory University of Rhode Island Cooperative Extension 1 Greenhouse Road Kingston, Rhode Island 02881 Phone: 401-874-4552 Fax: 401-874-4561 Laboratory Quality Assurance Advisor Jose Amador University of Rhode Island Department of Natural Resources Science 1 Greenhouse Road Kingston, Rhode Island 02881 Phone: 401-874-2905 Fax: 401-874-4561

QAPP –Watershed Watch Ambient and Marine Field Assays Revision: 1 Date: November 20, 2012
iv
Distribution List (continued)
Cooperating Agencies and Organizations: United States Environmental Protection Agency, Region 1 Robert Adler 1 Congress Street, Suite 1100 Boston, Massachusetts 02114-2023 Phone: 617-918-1396 Fax: 617-918-2064 United States Environmental Protection Agency, Region 1 Steve DiMattei New England Laboratory 11 Technology Drive North Chelmsford, Massachusetts 01863 Phone: 617-918-8369 Rhode Island Department of Environmental Management Elizabeth Scott – Deputy Chief Office of Water Resources 235 Promenade Street Providence, Rhode Island 02908 Phone: 401-222-3166 Rhode Island Department of Environmental Management Sue Kiernan – Deputy Chief Office of Water Resources 235 Promenade Street Providence, Rhode Island 02908 Phone: 401-222-3961 University of Rhode Island Coastal Institute Dr. Peter August - Director 1 Greenhouse Road Kingston, Rhode Island 02881 Phone: 401-874-4794 Wood-Pawcatuck Watershed Association Denise Poyer, Program Coordinator 203B Arcadia Rd. Hope Valley, Rhode Island 02852 Narrow River Preservation Association Annette DeSilva – Monitoring Coordinator 56 South River Road Narragansett, Rhode Island 02882

QAPP –Watershed Watch Ambient and Marine Field Assays Revision: 1 Date: November 20, 2012
v
Distribution List (continued) Cooperating Agencies and Organizations: The Committee for the Great Salt Pond Kevin Hoyt PO Box 1092 Block Island, Rhode Island 02807 Salt Ponds Coalition Mr. Roy Jeffrey Volunteer Monitoring Coordinator PO Box 375 Charlestown, Rhode Island 02813 SBH CUSH

QAPP –Watershed Watch Ambient and Marine Field Assays Revision: 1 Date: November 20, 2012
vi
List of Abbreviations
Abbreviation Definition
BOD Biochemical Oxygen Demand
CA Corrective Action
%D Percent Difference
DI Deionized Water
DQIs Data Quality Indicators
DO Dissolved Oxygen
DQO Data Quality Objectives
EPA-NE Environmental Protection Agency – New England District (Region 1)
g Gram
HDPE High Density Poly-Ethylene
L Liter
LCS Laboratory Control Standard (standard analyzed as a sample)
MDL Method Detection Limit
mL Milliliter
mg Milligram
MS Matrix spike
NA Not Applicable
ppb Parts per billion (µg/L)
ppm Parts per million (mg/L)
ppt Parts per thousand
QAPP Quality Assurance Project Plan
QA/QC Quality Assurance/Quality Control
QAPP –Watershed Watch Ambient and Marine Field Assays Revision: 1 Date: November 20, 2012
vii
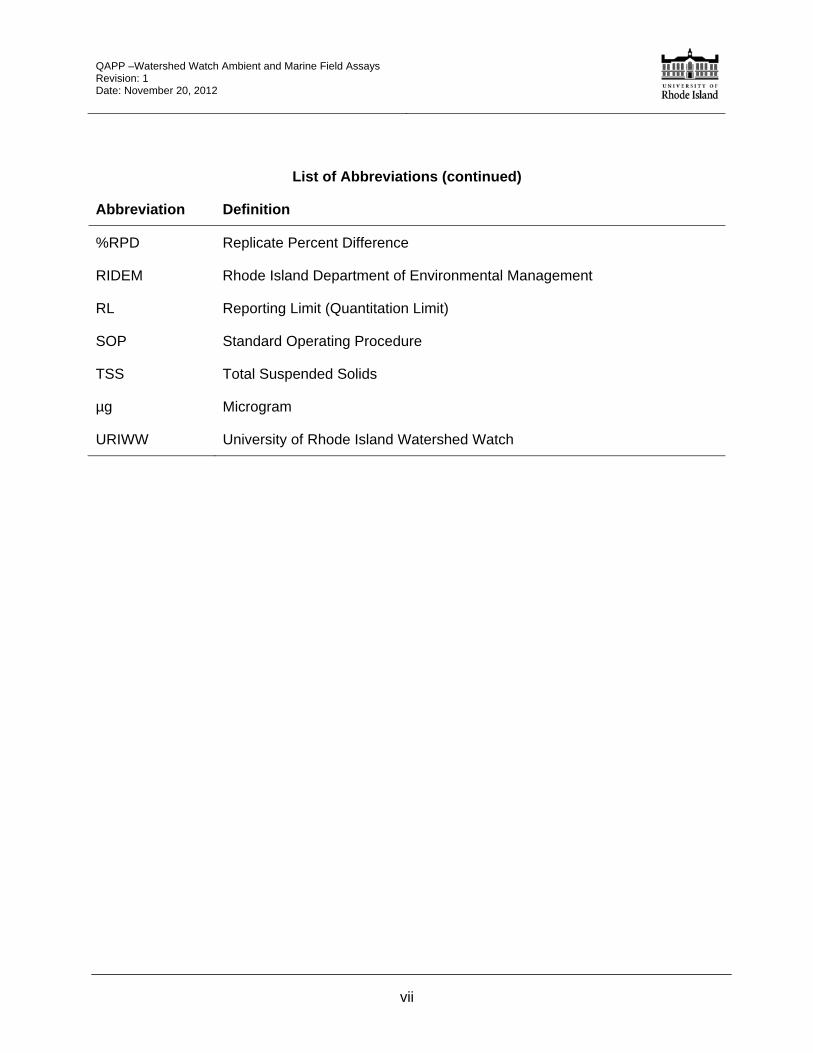
List of Abbreviations (continued)
Abbreviation Definition
%RPD Replicate Percent Difference
RIDEM Rhode Island Department of Environmental Management
RL Reporting Limit (Quantitation Limit)
SOP Standard Operating Procedure
TSS Total Suspended Solids
µg Microgram
URIWW University of Rhode Island Watershed Watch

QAPP –Watershed Watch Ambient and Marine Field Assays Revision: 1 Date: November 20, 2012
viii
TABLE OF CONTENTS
1.0 PURPOSE AND DESCRIPTION ....................................................................................................... 1
1.1 QUALITY ASSURANCE PROJECT PLAN (QAPP) OBJECTIVES ............................................................ 4 1.2 ORGANIZATION AND COMMUNICATION .............................................................................................. 4
1.2.1 Personnel Qualifications ........................................................................................................... 5 1.2.2 Training ..................................................................................................................................... 6
1.3 SCHEDULE/TIME-LINE ..................................................................................................................... 6
2.0 FIELD QUALITY OBJECTIVES AND MEASUREMENT PERFORMANCE CRITERIA .................. 8
2.1 METHOD DETECTION LIMITS (MDL) AND REPORTING LIMIT (RL) ....................................................... 8 2.2 PRECISION ...................................................................................................................................... 8 2.3 ACCURACY ..................................................................................................................................... 8 2.4 COMPARABILITY .............................................................................................................................. 9 2.5 COMPLETENESS .............................................................................................................................. 9 2.6 QA/QC TABLES ............................................................................................................................ 10
2.6.1 Contaminants of Concern and Other Target Analytes Table (Reference Limit and Evaluation Table) - Worksheet #9b ......................................................................................................... 11
2.6.2 Field and Quality Control Sample Summary Table – Worksheet #9c ..................................... 13 2.6.3 Measurement Performance Criteria Table – Worksheet #11b ............................................... 15 2.6.4 Sampling Locations, Sampling and Analysis Method/SOP Requirements Table – Worksheet
#12b ....................................................................................................................................... 18 2.6.5 Field Sampling Equipment Calibration Table - Worksheet #14 ............................................. 20 2.6.6 Field Equipment Maintenance, Testing and Inspection Table – Worksheet #15 .................... 21 2.6.7 Field Analytical Method/SOP Reference Table (Test Kits and Instruments) –Worksheet #17
............................................................................................................................................... 24 2.6.8 Field Sampling QC Table – Worksheet 22a ............................................................................ 25 2.6.9 Field Analytical QC Table – Worksheet 23a ........................................................................... 28
3.0 SAMPLE HANDLING, TRACKING AND CUSTODY REQUIREMENTS ....................................... 31
3.1 ACCEPTANCE OF EXPENDABLE LABORATORY SUPPLIES ................................................................. 31 3.2 SAMPLE HANDLING SYSTEM – WORKSHEET 16 .............................................................................. 33
4.0 PROJECT DOCUMENTATION AND RECORDS ........................................................................... 34
LIST OF FIGURES (Tables listed in Table of Contents)
FIGURE 1 - UNIVERSITY OF RHODE ISLAND WATERSHED WATCH LABORATORY STRUCTURE ........................... 5 FIGURE 2 - EXAMPLE OF A TYPICAL MONITORING SCHEDULE ......................................................................... 7 FIGURE 3 - EXAMPLE SAMPLE LOG SHEET ................................................................................................... 32
LIST OF APPENDICIES
Appendix A – Field Standard Operating Procedures Appendix B – Resumes of Key Laboratory Personnel Appendix C – Descriptive Information Regarding University of Rhode Island Watershed Watch

QAPP –Watershed Watch Ambient and Marine Field Assays Revision: 1 Date: November 20, 2012
1 of 32
1.0 PURPOSE AND DESCRIPTION
The University of Rhode Island Watershed Watch Program (URIWW) is a Cooperative Extension Water Quality Program in the Department of Natural Resources Science, College of the Environment and Life Sciences. The program is located in the Coastal Institute building on the URI Kingston campus. Begun in 1988, the URIWW program is a statewide volunteer monitoring program with over 300 volunteers. The program focuses on providing current information on the water quality of surface water resources throughout Rhode Island. It is a service provider to statewide and local decision-makers and is practically the sole source of long-term lake water quality data for Rhode Island. The URIWW Laboratory provides analytical services to the Rhode Island Department of Environmental Management (RIDEM) and the Environmental Protection Agency, New England District (Region 1) (EPA-NE) as well as other URI researchers. It is a resource for volunteers working with municipal boards and is linked with all Cooperative Extension water quality activities. The program is intended to encourage communities and shoreline residents to understand the need to cooperatively manage and improve the water quality of all the water bodies within a watershed.
Information describing the URIWW program, program fact-sheets, water quality data as well as monitoring protocols are maintained at the following web-site: www.uri.edu/ce/wq/ww. Basic information describing URIWW is also available in Appendix C.
The purpose of this Quality Assurance Project Plan (QAPP) is to provide guidance on the field procedures and quality assurance/quality control (QA/QC) tasks performed in marine and ambient waters as part of the URIWW program. Ambient waters are considered fresh surface waters (lakes, ponds and rivers). Field tasks are completed both by professional URIWW staff and volunteers. Field tasks may include the collection of filtered and whole water samples for laboratory analysis of fecal coliforms, enterococcus bacteria, alkalinity, pH, salinity, chlorophyll-a, chloride, ammonia-N, orthophosphate-P, nitrate + nitrite-N, total phosphorus and total nitrogen. Additionally, Secchi disk transparency and water temperature are often determined in the field using instruments, and dissolved oxygen and salinity may be determined in the field using test kits. The actual suite of analytical procedures completed in the field and the actual number and type of samples collected in the field depends upon specific program requirements. This QAPP describes general collection procedures for ambient and marine samples utilized by the URIWW program and does not provide information on project-specific details or goals.
The Standard Operating Procedures (SOPs) contained in this QAPP form the basis of the various URIWW Monitoring Manuals which as of this writing include: Lake and Pond Monitoring Manual, Narrow River Monitoring Manual, Greenwich Bay Monitoring Manual, Wadeable Streams Monitoring Manual as well as Salt Ponds, Bristol Harbor, Stonington Harbor, and Greenwich Bay supplements to the Lake Monitoring Manual. The Monitoring Manuals include approved field SOPs from this QAPP as well as a Sampling Plan and water quality fact sheets. The Sampling Plan includes a monitoring schedule, a step by step sampling guide referring to the SOPs and the recommended order of completing monitoring tasks. They are on-line at www.uri.edu/ce/wq/ww
This QAPP does not describe laboratory analytical procedures; this information is found in the University of Rhode Island Watershed Watch Laboratory Program QAPP. A cross-reference between the information required by EPA-NE and this QAPP is provided in the table below. Note that information found in narrative format instead of in an EPA-NE table is listed as “in narrative”.

QAPP –Watershed Watch Ambient and Marine Field Assays Revision: 1 Date: November 20, 2012
2 of 32
Required Information Checklist
EPA-NE Work-sheet
number
Worksheet Title
Location In URIWW Field QAPP
1 Title and approval In narrative
2 Table of contents & document
format In narrative
3 Distribution list In narrative
4 Project personnel sign-off sheet All relevant personnel are included on
the approval page
5a Organizational chart Figure 1
5b Communication pathway Section 1.2 in narrative
6 Personnel responsibilities and
qualification Section 1.2 and 1.2.1 in narrative
7 Special personnel training
requirements Section 1.2.2 in narrative
8a Project scoping meeting attendance
sheet, agenda NA
8b Problem definition/site history &
background Section 1.0 in narrative
9a Project description Section 1.0 in narrative
9b Contaminants of concern Section 2.6.1
9c Field & QC sample summary Section 2.6.2
10 Project schedule timeline Section 1.3 in narrative
11a Project quality objectives/decision
statements Section 2.0 in narrative
11b Measurement performance criteria
table Section 2.6.3
12a Sampling design & rationale NA
12b Sampling locations, methods, SOP
requirements table Section 2.6.4

QAPP –Watershed Watch Ambient and Marine Field Assays Revision: 1 Date: November 20, 2012
3 of 32
EPA-NE Work-sheet
number
Worksheet Title
Location In URIWW Field QAPP
13 Project sampling SOP table Appendix A
14 Field equipment calibration Section 2.6.5
15 Field equipment maintenance Section 2.6.6
16 Sampling handling, tracking,
custody Section 3.0 in narrative and Section 3.2
17 Field method /SOP Section 2.6.7
18 Field calibration Relevant data summarized in Section
2.6.5 in Worksheet #14
19 Field maintenance Relevant data summarized in Section
2.6.6 in Worksheet #15
20 Fixed lab. analytical , SOP
reference table NA
21 Lab instrument maintenance &
calibration table NA
22a Field sampling QC Section 2.6.8
22b Field sampling QC continued NA
23a Field analytical QC Section 2.6.9
23b More field QC NA
24a Lab analytical QC NA
24b More lab analytical QC NA
25 Non-direct measurement criteria NA
26 Project documentation and records Section 4.0 in narrative
27a Assessment and response NA
27b Project assessment NA
27c Project assessment plan NA
28 QA management reports Section 4.0 in narrative

QAPP –Watershed Watch Ambient and Marine Field Assays Revision: 1 Date: November 20, 2012
4 of 32
EPA-NE Work-sheet
number
Worksheet Title
Location In URIWW Field QAPP
29a Data evaluation process NA
29b Data validation summary NA
29c Data validation modifications NA
30 Data usability assessment NA
Notes: NA – Not applicable to this QAPP. This QAPP provides information regarding general field protocols only. No project-specific information is contained in this general QAPP. No laboratory analysis information is provided in this QAPP, refer to “Quality Assurance Project Plan – University of Rhode Island Watershed Watch Laboratory Program” for laboratory specific QA/QC information.
1.1 Quality Assurance Project Plan (QAPP) Objectives
The objective of this QAPP is to present the organization, objectives and specific QA/QC procedures associated with URIWW field analysis and sample collection protocols. Guidance on the field analysis procedures for the following assays is provided in this document: temperature, Secchi depth transparency, DO and salinity. Guidance on the field collection procedures for filtered, unfiltered and bacterial samples are also included in this QAPP. Specific QA/QC criteria as well as documentation are outlined in individual Field SOPs located in Appendix A. This QAPP does not describe any laboratory analysis procedures; this information is provided in the University of Rhode Island Watershed Watch Laboratory Program QAPP.
1.2 Organization and Communication
Dr. Arthur Gold is the Program Leader of the Cooperative Extension Water Quality Program and faculty advisor to the URIWW program. He will provide overall guidance related to projects performed by the URIWW program (figure 1). Linda Green is the URIWW Program Director as well as the overall Laboratory Project Manager and Laboratory Manager for nutrient analyses. As such she is responsible for overall operation of the laboratory as well as the QA/QC of all non-microbiological related assays. Elizabeth Herron is the URIWW Program Coordinator and Laboratory Project Manager for microbiological analysis and also the Web and Data Manager. She is responsible for the analysis and QA/QC of microbiological assays. She is responsiblie for overseeing all data entry and proofing, and all internet content. Dr. Jose Amador will provide QA/QC guidance. Ms. Herron and Ms. Green are both responsible for the supervision and training of volunteers collecting samples and data as part of the URIWW program as well as all students employed by URI Watershed Watch. All changes to the QAPP or specific SOPs will completed only after review and acceptance by Ms. Green or Ms. Herron.

QAPP –Watershed Watch Ambient and Marine Field Assays Revision: 1 Date: November 20, 2012
5 of 32
Figure 1 - University of Rhode Island Watershed Watch Laboratory Structure
1.2.1 Personnel Qualifications
A brief description of the experience of principal laboratory personnel is described here. Resumes of key personnel are located in Appendix B. Dr. Arthur Gold is a watershed hydrologist and Professor in the Department of Natural Resources Science at URI. He has over 30 years of experience in the field of water resources; has published over 100 refereed journal articles and has served on numerous national and international committees dealing with water resources. Currently, Dr. Gold is the associate director of the URI Coastal Institute and is the program leader for the URI Cooperative Extension. Linda Green is a Research Association IV in the Department of Natural Resources Science at URI. Ms. Green has over 35 years of analytical laboratory related experience and has been the director of URIWW since its inception in 1988. She is the recipient of numerous awards and grants related to her work with the URIWW program and has authored numerous articles and technical publications. Ms. Green has hosted workshops on QA/QC in volunteer monitoring programs and was the sole volunteer monitoring representative on the National Water Quality Monitoring Council from 1997 – 2009 as well as a co-founding member of the Rhode Island Volunteer Monitoring Steering Committee. Elizabeth Herron is a Research Associate III in the Department of Natural Resources Science at URI. Ms. Herron has over 25 years of experience in the field and is a former director of the North American Lake Management Society as well as a co-founding member of the Rhode Island Volunteer Monitoring Steering Committee. She has authored numerous articles and technical publications and has presented workshops and technical papers throughout the United States.
Arthur Gold Program Leader URI Cooperative Extension Water Quality Programs
Faculty Advisor URI Watershed Watch
Linda Green Program Director
Elizabeth Herron Program Coordinator
Linda Green Laboratory Manager – Nutrients
Elizabeth Herron Laboratory Manager – Microbiology
Data & Internet Manager
Jose Amador QA Advisor
Volunteer Monitors and Student Technicians Volunteer Monitors
and Student Technicians

QAPP –Watershed Watch Ambient and Marine Field Assays Revision: 1 Date: November 20, 2012
6 of 32
Dr. Jose Amador has 30 years of experience in the field of soil science, microbiology and nutrient chemistry. He has published over 80 peer reviewed articles. He is currently a Professor of Microbial Ecology and Soil Science in the Department of Natural Resources Science at URI.
1.2.2 Training
Training of volunteer monitoring personnel and student technicians is conducted by Linda Green, Elizabeth Herron and URIWW staff. Training is provided on limnologic principles, water sample collection and method-specific details for the collection of basic physical and chemical parameters in the field (temperature, Secchi depth transparency, DO and salinity). Training consists of classroom and field workshops conducted by Ms. Green and Ms. Herron. The workshops provide verbal and hands-on training with the collection apparatus and the analysis of water samples. Each volunteer is provided with a copy of the relevant Monitoring Manual which contains written instructions for the collection and analysis of field samples. Attendance of at least one field training session is mandatory and attendance of a classroom workshop is strongly encouraged. Workshop attendance records are retained by the URIWW group.
1.3 Schedule/Time-Line
This QAPP does not relate to a specific project, therefore no specific time-line or schedule is offered. Specific monitoring schedules are found in the specific Monitoring Manuals a described in Section 1.0 of this QAPP. A schedule for rivers & streams, including Narrow River is included below as an example of a typical monitoring schedule (figure 2). Note that most sampling activities take place from May and into October, weather permitting.

QAPP –Watershed Watch Ambient and Marine Field Assays Revision: 1 Date: November 20, 2012
7 of 32
Figure 2 - Example of a Typical Monitoring Schedule

QAPP –Watershed Watch Ambient and Marine Field Assays Revision: 1 Date: November 20, 2012
8 of 32
2.0 FIELD QUALITY OBJECTIVES AND MEASUREMENT PERFORMANCE CRITERIA
High quality data is the goal of all URIWW field analytical and sample collection procedures. Specific data quality objectives have been set for field analytical procedures on a method basis for method detection limits (MDL), precision, accuracy, comparability and completeness. Values specific to each of these objectives are located in the following Section. Since this document is a general QAPP for field assays only, there are no specific if/then statements linking field criteria to project decisions.
2.1 Method Detection Limits (MDL) and Reporting Limit (RL)
The MDL is the analyte concentration where there is 99% confidence that the sample concentration is different from zero. Below the MDL it is uncertain if the concentration is not zero. The reporting limit (RL) is the value above which data have definable accuracy and precision. Each field assay has a specific MDL and RL value. These values are located in worksheet 9b (see Section 2.6.1).
2.2 Precision
Precision is a measure of the degree to which two or more measurements are in agreement as well as a measurement of random error. Precision of field assays will be assessed through the measurement of duplicate samples and subsequent calculation of the relative percent difference (%RPD) as described below. %RPD = Result of Replicate 1 – Result of Replicate 2 x 100 Average of Result of Replicate 1 and Result of Replicate 2 Objectives for precision are located in worksheets 11b and 23a, Section 2.6.3 and 2.6.9, respectively.
2.3 Accuracy
Accuracy is an evaluation of the degree to which a measured value and a known reference value or true value are in agreement. This is a measurement of systematic error and is often referred to as “bias”. Accuracy of field analytical procedures is determined by the analysis of reference material and comparison of the resulting value to that of the accepted value. The difference between the accepted and reference value is the percent difference (%D). The %D is calculated as follows: %D = Known Value of Reference Material – Calculated Value of Reference Material x 100 Known Value of Reference Material Objectives for accuracy are located in worksheet 11b, 14 and 22a (see Section 2.6.3, 2.6.5 and 2.6.8, respectively).

QAPP –Watershed Watch Ambient and Marine Field Assays Revision: 1 Date: November 20, 2012
9 of 32
2.4 Comparability
All field analytical procedures and sample collection methods utilized by the URIWW program are based on procedures found in the following sources: APHA, AWWA, WEF. Standard Methods for the Examination of Water and Wastewater. 19th ed. Washington D.C.: APHA, 1995. U.S. Environmental Protection Agency. Volunteer Stream Monitoring: A Methods Manual, EPA 841-B-97-003. Washington D.C.: Office of Water, Nov. 1997. U.S. Environmental Protection Agency. Volunteer Lake Monitoring: A Methods Manual, EPA 440/4-91-002. Washington D.C.: Office of Water, Dec. 1991. Carlson, R. and J. Simpson. A Coordinator’s Guide to Volunteer Lake Monitoring Methods. North American Lake Management Society (NALMS), Feb. 1996. U.S. Environmental Protection Agency. Volunteer Estuary Monitoring: A Methods Manual. 2nd ed. U.S. Environmental Protection Agency and Center for Marine Conservation, No Date Listed. Field Test Kit Instructions from the manufacturer (LaMotte) at www.lamotte.com
2.5 Completeness
Completeness is a measure of the amount of valid data obtained from the field analytical procedures as well as a measure of the number of valid samples collected in the field compared to the number expected to be obtained under normal conditions. Greater than 67% completeness of field analytical procedures and collection of valid samples is expected. Completeness is calculated as follows: Completeness = Number of Valid Field Analytical Measurements x 100 (Field Analytical Number of Field Analytical Measurements Planned Procedures)
And
Completeness = Number of Valid Field Samples Collected x 100 (Collection of Field Number of Field Samples Planned Samples)

QAPP –Watershed Watch Ambient and Marine Field Assays Revision: 1 Date: November 20, 2012
10 of 32
2.6 QA/QC Tables
Tables summarizing the QA/QC objectives for each field analytical procedure performed as well as any objectives related to the collection of field samples for later analysis by the URIWW Laboratory are provided on the following pages. These tables address the Data Quality Indicators (DQIs) or the procedures to be followed to provide assurance that a field analytical procedure is returning valid results. Each DQI has a specific result that must be met before the data is considered acceptable. Maintenance and calibration procedures for each piece of equipment/instrument are provided for field analytical procedures and sample collection methods as well as preservation and required sample volume. The person(s) responsible for assessing problems relating to field analytical procedure DQIs and/or maintenance of field equipment are also listed within the tables.

QAPP –Watershed Watch Ambient and Marine Field Assays Revision: 1 Date: November 20, 2012
11 of 32
2.6.1 Contaminants of Concern and Other Target Analytes Table (Reference Limit and Evaluation Table) - Worksheet #9b
EPA-NE QAPP Worksheet #9b - Rev. 10/99
Contaminants of Concern and Other Target Analytes Table (Reference Limit and Evaluation Table)
Analyte Reporting Units
Project Action Limit
(Units) (wet or dry
weight)
Project Quantitation
Limit (Units)
(wet or dry weight)
Analytical Method Achievable Field Analytical Limits
MDLs Method
RLs MDLs RLs
Field Analytical Procedures
Secchi Depth meters NA – This is a generic QAPP for
field procedures 0.1 0.1 0.1 0.1
Temperature °C 0.0 0.0 0.0 0.0
Dissolved Oxygen mg/L O2 0.0 0.2 0.0 0.2
Salinity1 ppt 0.0 1.0 0.0 <0.4
Wind Speed Code – See Field SOP
003
NA NA NA NA
Light NA NA NA NA
Rain NA NA NA NA
State of Tide NA NA NA NA
Field Sample Collected
Filters for chlorophyll-a analysis NA
NA – Samples filtered in field, then kept frozen until analyzed by the URIWW Laboratory. Refer to URIWW
Laboratory QAPP for QA/QC information on chlorophyll-a analysis.
Filtered Water Sample (for chloride and dissolved nutrients: ammonia-N,
orthophosphate-P and nitrate + nitrite-N2) NA
NA – Sample analyzed by the URIWW Laboratory. Refer to URIWW Laboratory QAPP for QA/QC information on
analyses.

QAPP –Watershed Watch Ambient and Marine Field Assays Revision: 1 Date: November 20, 2012
12 of 32
EPA-NE QAPP Worksheet #9b - Rev. 10/99
Contaminants of Concern and Other Target Analytes Table (Reference Limit and Evaluation Table)
Analyte Reporting Units
Project Action Limit
(Units) (wet or dry
weight)
Project Quantitation
Limit (Units)
(wet or dry weight)
Analytical Method Achievable Field Analytical Limits
MDLs Method
RLs MDLs RLs
Unfiltered Water Sample (for pH, alkalinity and salinity1)
NA NA – Sample analyzed in the URIWW Laboratory. Refer to URIWW Laboratory QAPP for QA/QC information on
analyses.
Unfiltered Water Sample (for total nitrogen and phosphorus3)
NA NA – Sample analyzed in the URIWW Laboratory. Refer to URIWW Laboratory QAPP for QA/QC information on
analyses.
Unfiltered water sample (for fecal coliforms, and enterococci)
NA NA – Samples filtered in field and then analyzed in the
URIWW Laboratory. Refer to URIWW Laboratory QAPP for QA/QC information on analyses.
Notes: 1Salinity may be analyzed in the field or in the laboratory using a salinity refractometer. 2Samples are analyzed jointly for nitrate-N (NO3-N) + nitrite-N (NO2-N) because nitrite levels are generally very low and the method for separating the two species requires several extra steps. 3The total nitrogen and phosphorus analysis provides a value for all the nitrogen and phosphorus in a sample. This is in contrast to the analysis for nitrate + nitrite-N, ammonia-N, and orthophosphate-P; these analyses only provide values for specific dissolved species.
QAPP –Watershed Watch Ambient and Marine Field Assays Revision: 1 Date: November 20, 2012
13 of 32
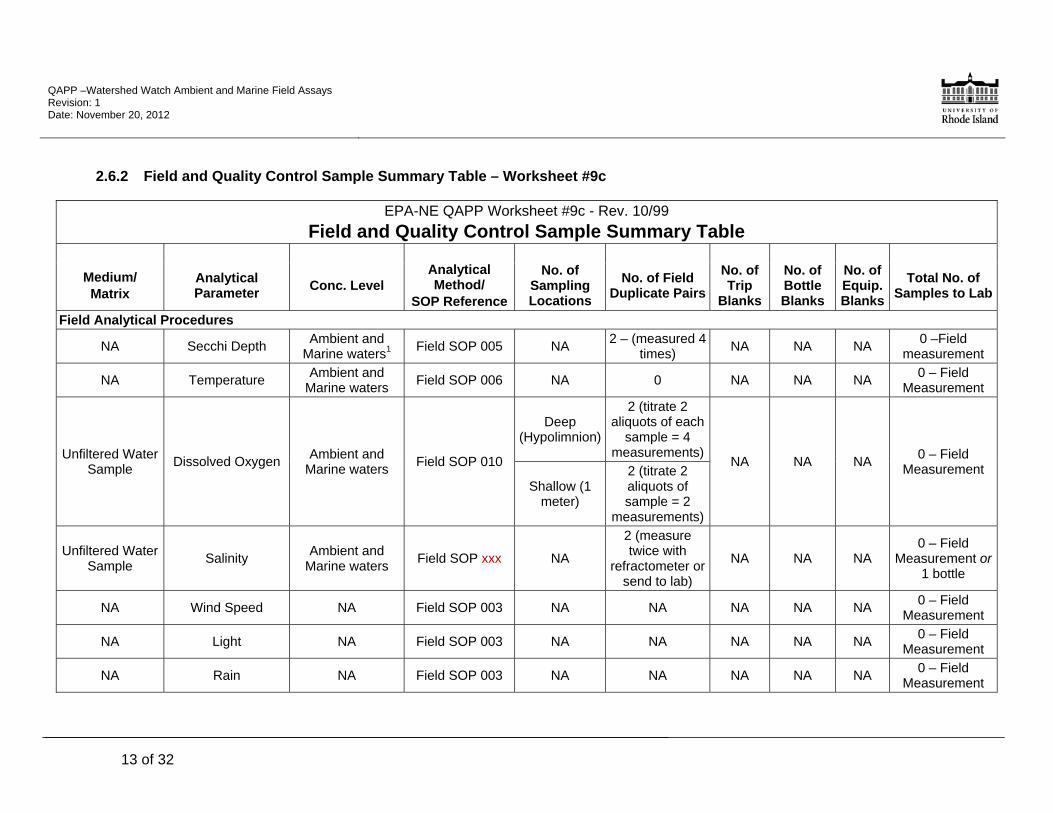
2.6.2 Field and Quality Control Sample Summary Table – Worksheet #9c
EPA-NE QAPP Worksheet #9c - Rev. 10/99
Field and Quality Control Sample Summary Table
Medium/ Matrix
Analytical Parameter
Conc. Level
Analytical Method/
SOP Reference
No. of
Sampling Locations
No. of Field
Duplicate Pairs
No. of Trip
Blanks
No. of Bottle Blanks
No. of Equip. Blanks
Total No. of
Samples to Lab
Field Analytical Procedures
NA Secchi Depth Ambient and
Marine waters1 Field SOP 005 NA
2 – (measured 4 times)
NA NA NA 0 –Field
measurement
NA Temperature Ambient and
Marine waters Field SOP 006 NA 0 NA NA NA 0 – Field
Measurement
Unfiltered Water Sample
Dissolved Oxygen Ambient and
Marine waters Field SOP 010
Deep (Hypolimnion)
2 (titrate 2 aliquots of each
sample = 4 measurements)
NA NA NA 0 – Field
Measurement Shallow (1
meter)
2 (titrate 2 aliquots of sample = 2
measurements)
Unfiltered Water Sample
Salinity Ambient and
Marine waters Field SOP xxx NA
2 (measure twice with
refractometer or send to lab)
NA NA NA 0 – Field
Measurement or 1 bottle
NA Wind Speed NA Field SOP 003 NA NA NA NA NA 0 – Field
Measurement
NA Light NA Field SOP 003 NA NA NA NA NA 0 – Field
Measurement
NA Rain NA Field SOP 003 NA NA NA NA NA 0 – Field
Measurement

QAPP –Watershed Watch Ambient and Marine Field Assays Revision: 1 Date: November 20, 2012
14 of 32
EPA-NE QAPP Worksheet #9c - Rev. 10/99
Field and Quality Control Sample Summary Table
Medium/ Matrix
Analytical Parameter
Conc. Level
Analytical Method/
SOP Reference
No. of
Sampling Locations
No. of Field
Duplicate Pairs
No. of Trip
Blanks
No. of Bottle Blanks
No. of Equip. Blanks
Total No. of
Samples to Lab
NA State of Tide NA Field SOP 003 NA NA NA NA NA 0 – Field
Measurement
Field Samples Collected
Filter Chlorophyll-a Ambient and
Marine waters Field SOP 007 NA
2 (filter 2 aliquots of each
sample = 4 filters total)
0 0 0 4 filters
Filtered Water Sample
Chloride, Ammonia-N, Orthophosphate-
P and Nitrate + Nitrite-N
Ambient and Marine waters Field SOP 007 NA 0 0 0 0 1 bottle
Unfiltered Water Sample
pH, Alkalinity and Salinity
Ambient and Marine waters Field SOP 009 NA 0 0 0 0 1 bottle
Unfiltered Water Sample
TSS Ambient and
Marine waters Field SOP 009 NA 0 0 0 0 1 bottle
Unfiltered Water Sample
Total Nitrogen and Phosphorus
Ambient and Marine waters Field SOP 009 NA 0 0 0 0 1 bottle
Unfiltered Water Sample
fecal coliforms and enterococci
Ambient and Marine waters Field SOP 008 NA 0 0 0 0 1 bottle
Note: This QAPP deals with the field collection and analysis of samples only. Laboratory QA/QC is dealt with in the URIWW Laboratory QAPP. Additionally, due to the nature of the analyses performed by the laboratory there is no need to collect additional sample volume for matrix spikes, they come from the same bottle. Therefore, the MS column has been eliminated from this table.
1 Ambient water refers to fresh water (rivers, ponds, lakes). Marine water refers to estuarine and marine waters.

QAPP –Watershed Watch Ambient and Marine Field Assays Revision: 1 Date: November 20, 2012
15 of 32
2.6.3 Measurement Performance Criteria Table – Worksheet #11b
EPA-NE QAPP Worksheet #11b - Rev. 10/99
Measurement Performance Criteria Table
Sampling Procedure Field QC Sample and/or Field
Activity Used to Assess Measurement Performance
Measurement Performance Criteria
Data Quality Indicators (DQIs)
Field SOP Number
QC Sample Assesses Error
for Sampling (S), Analytical (A) or
Both (S&A)
Field Analytical Procedures
Secchi Depth
Complete field measurement 4 times
Not greater than 0.25 m difference between all readings
Precision 005 A
Calibrate yearly Less than 10%D in gradation of
measurement line Accuracy 005 A
Temperature Calibrate yearly Difference less than +/- 1 °C
from reference Accuracy 006 A
Dissolved Oxygen (Unfiltered Water Sample)
Duplicate titration Difference between
measurements not greater than 1 mg/L DO
Precision 010 A
Field Sample Duplication of deep water samples
Difference between measurements not greater than
1 mg/L DO Precision 010 A & S
Analysis of known sample (LCS)1 Value less than +/- 1 ppm different from known value
Accuracy 010 A&S
Salinity (Unfiltered Water Sample)
Analysis of known sample (LCS) 1 Value less than +/- 2 ppt
different from known value Accuracy 013 A&S
Duplicate measurement Difference between
measurements not greater than 2 ppt
Precision 013 A

QAPP –Watershed Watch Ambient and Marine Field Assays Revision: 1 Date: November 20, 2012
16 of 32
EPA-NE QAPP Worksheet #11b - Rev. 10/99
Measurement Performance Criteria Table
Sampling Procedure Field QC Sample and/or Field
Activity Used to Assess Measurement Performance
Measurement Performance Criteria
Data Quality Indicators (DQIs)
Field SOP Number
QC Sample Assesses Error
for Sampling (S), Analytical (A) or
Both (S&A)
Wind Speed NA NA NA 003 NA
Light NA NA NA 003 NA
Rain NA NA NA 003 NA
State of Tide NA NA NA 003 NA
Field Samples Collected
Chlorophyll-a
Field duplicate pair See URIWW Laboratory QAPP Precision 007 S
Filter each field sample twice See URIWW Laboratory QAPP Precision 007 S
Sampling and processing of a sample in the laboratory2
Used to evaluate if persons collecting samples are
processing samples correctly and the precision between samples of the same water
collected by different persons.
Precision 007 007
Chloride, Ammonia-N, Orthophosphate-P and
Nitrate + Nitrite-N
None (See URIWW Laboratory QAPP for QA/QC information)
pH, Alkalinity and Salinity None (See URIWW Laboratory QAPP for QA/QC information)
TSS None (See URIWW Laboratory QAPP for QA/QC information)

QAPP –Watershed Watch Ambient and Marine Field Assays Revision: 1 Date: November 20, 2012
17 of 32
EPA-NE QAPP Worksheet #11b - Rev. 10/99
Measurement Performance Criteria Table
Sampling Procedure Field QC Sample and/or Field
Activity Used to Assess Measurement Performance
Measurement Performance Criteria
Data Quality Indicators (DQIs)
Field SOP Number
QC Sample Assesses Error
for Sampling (S), Analytical (A) or
Both (S&A)
Total Nitrogen and Phosphorus
None (See URIWW Laboratory QAPP for QA/QC information)
fecal coliforms and enterococci
None (See URIWW Laboratory QAPP for QA/QC information)
Notes: 1 Analysis of a known sample (LCS) is completed by volunteer monitors when they drop samples off at the URIWW Laboratory. A known sample of water is provided and the monitor is observed by a member of the URIWW Laboratory staff to ensure that they are completing the sampling and analysis procedures correctly. Ideally every volunteer monitor will process one LCS each year for DO and salinity, this is not always the case. 2 Collection and filtration of a laboratory provided sample is completed by volunteer monitors when they drop samples off at the URIWW Laboratory. A sample of water is provided and the monitor is observed by a member of the URIWW Laboratory staff to ensure that they are completing the sampling and filtration procedures correctly. This sample is not a LCS as the URIWW Laboratory does not know the concentration of chlorophyll-a in the provided sample. Rather, after each volunteer monitor has completed the sampling exercise the samples are analyzed and the results compared to determine if there are any major differences among the volunteer monitor’s samples.

QAPP –Watershed Watch Ambient and Marine Field Assays Revision: 1 Date: November 20, 2012
18 of 32
2.6.4 Sampling Locations, Sampling and Analysis Method/SOP Requirements Table – Worksheet #12b
EPA-NE QAPP Worksheet #12b - Rev. 10/99
Sampling Locations, Sampling and Analysis Method/SOP Requirements Table Sampling Location & Depth
Parameter Matrix # Samples Field SOP
Lab. SOP
Sample Volume
Containers (number, size
and type) Preservation
Max Holding time
Field Analytical Procedures
Various – Project Specific
Secchi Depth NA 4 005 NA NA NA NA NA
Temperature NA 1 006 NA NA NA NA Analyze sample
as soon as collected
Dissolved Oxygen
Unfiltered Water
Sample
Deep -2 (Titrated 2
times) 010 NA 60 mL
2, 60 mL glass DO bottles
Ice/4 °C 1 hour
Unfiltered
Water Sample
Shallow – 1 (titrated 2
times) 010 NA 60 mL
1, 60 mL glass DO bottle
Ice/4 °C 1 hour
Salinity Unfiltered
Water Sample
2 (measure salinity 2
times) 013 NA 1 drop
1, 60 mL plastic bottle
none none
Wind Speed NA NA 003 NA NA NA NA NA Light NA NA 003 NA NA NA NA NA Rain NA NA 003 NA NA NA NA NA State of Tide NA NA 003 NA NA NA NA NA

QAPP –Watershed Watch Ambient and Marine Field Assays Revision: 1 Date: November 20, 2012
19 of 32
EPA-NE QAPP Worksheet #12b - Rev. 10/99
Sampling Locations, Sampling and Analysis Method/SOP Requirements Table Sampling Location & Depth
Parameter Matrix # Samples Field SOP
Lab. SOP
Sample Volume
Containers (number, size
and type) Preservation
Max Holding time
Field Samples Collected
Chlorophyll-a Filter 4 filters (2
water samples)
007 012
100 mL from each of 2 250 mL bottles
Aluminum foil packet
Place in zip-lock plastic
bag with desiccant chips and
freeze
6 months
Chloride, Ammonia-N, Orthophosphate-P and
Nitrate + Nitrite-N
Filtered Water
Sample 1 007
013, 014 & 015
60 – 125 mL 1, 60 – 125 mL
brown glass bottle
Ice/4 °C Frozen upon delivery and
lab log-in
Chloride – 1 year;
Ammonia-N, Orthophosphate-P and Nitrate +
Nitrite-N 30 days
pH, Alkalinity and
Salinity
Unfiltered Water
Sample 1 009
010 & 017
200 mL 1, 500 mL white
HDPE bottle Ice/4 °C
pH and Alkalinity - 24
hours Salinity -1 year
TSS Unfiltered
Water Sample
1 009 011 & 009
500 mL 1, 500 mL HDPE
bottle Ice/4 °C TSS – 1 week
Total Nitrogen and
Phosphorus
Unfiltered Water
Sample 1 009 016 100 mL
1, 125 – 250 mL brown glass bottle
Ice/4 °C 30 days
fecal coliforms and
enterococci
Unfiltered Water
Sample 1 008 007 100 mL
1, 250 – 500 mL sterile white plastic bottle
Ice/4 °C 6 hours
QAPP –Watershed Watch Ambient and Marine Field Assays Revision: 1 Date: November 20, 2012
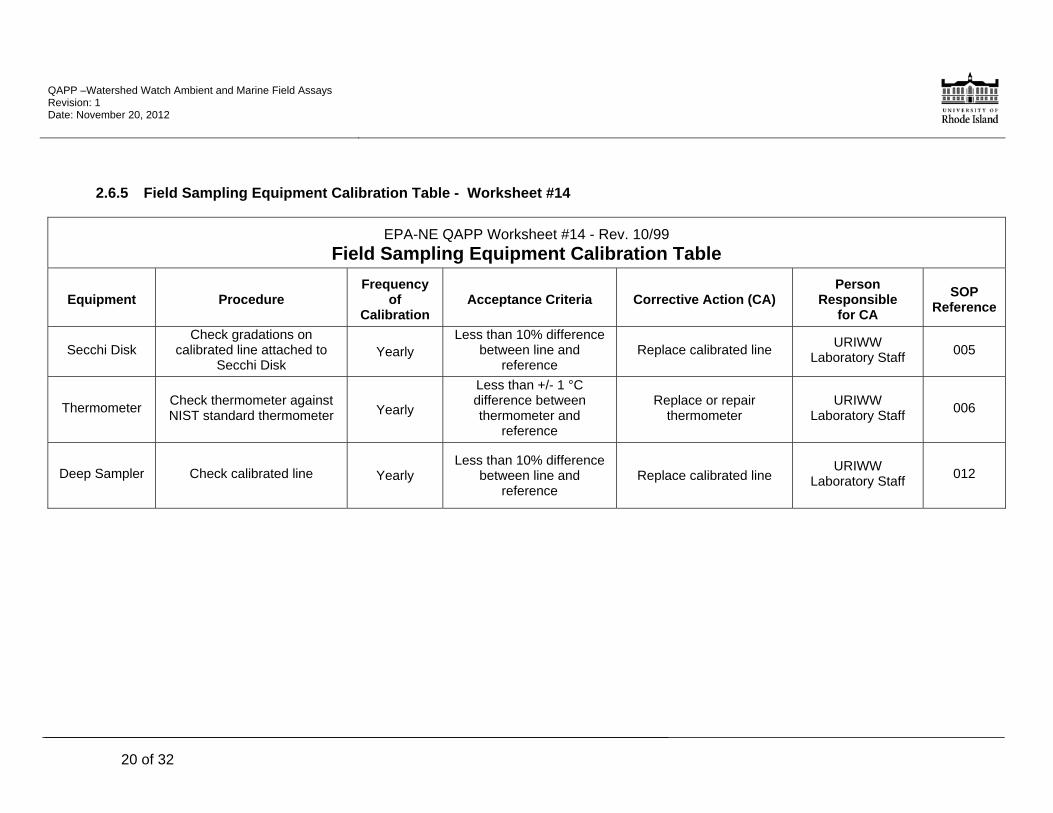
20 of 32
2.6.5 Field Sampling Equipment Calibration Table - Worksheet #14
EPA-NE QAPP Worksheet #14 - Rev. 10/99
Field Sampling Equipment Calibration Table
Equipment
Procedure
Frequency of
Calibration
Acceptance Criteria
Corrective Action (CA)
Person Responsible
for CA
SOP
Reference
Secchi Disk Check gradations on
calibrated line attached to Secchi Disk
Yearly Less than 10% difference
between line and reference
Replace calibrated line URIWW
Laboratory Staff 005
Thermometer Check thermometer against NIST standard thermometer Yearly
Less than +/- 1 °C difference between thermometer and
reference
Replace or repair thermometer
URIWW Laboratory Staff
006
Deep Sampler Check calibrated line Yearly Less than 10% difference
between line and reference
Replace calibrated line URIWW
Laboratory Staff 012

QAPP –Watershed Watch Ambient and Marine Field Assays Revision: 1 Date: November 20, 2012
21 of 32
2.6.6 Field Equipment Maintenance, Testing and Inspection Table – Worksheet #15
EPA-NE QAPP Worksheet #15 - Rev. 10/99
Field Equipment Maintenance, Testing and Inspection Table
Sampling
Equipment/ Instrument
Maintenance
Activity
Testing Activity
Inspection
Activity
Responsible
Person
Frequency
Acceptance
Criteria
Corrective
Action
SOP
Reference
Secchi Disk Rinse with tap water after use and allow to dry
NA Make sure line is attached
securely to Secchi disk
Person(s) collecting sample
Before each use
Securely attached Attach line securely.
005
Thermometer Rinse with tap water after use and allow to dry
Electronic thermometers only:
Make sure that thermometer turns on
Electronic thermometers: make sure probe is not
damaged.
Spirit thermometers: Make sure spirit is continuous in the
thermometer (no breaks in internal fluid) and that
the probe is not damaged.
Person(s) collecting sample
Before each use
Electronic thermometers:
thermometer turns on and probe is not
damaged.
Spirit thermometer: Spirit is continuous
and probe is not damaged.
Electronic thermometers: replace battery if probe does not turn on. If
still not operational call
URIWW Laboratory for a
replacement thermometer.
Spirit
thermometer: Call URIWW
Laboratory for a replacement thermometer.
006
Filter housings, syringe
Rinse with tap water after use and allow to dry
NA Check that filter housing
and syringe are not cracked or damaged.
Person(s) collecting sample
Before each use
Filter housing and syringe are not
damaged.
Call URIWW Laboratory for a
replacement filter housing
and/or syringe.
007

QAPP –Watershed Watch Ambient and Marine Field Assays Revision: 1 Date: November 20, 2012
22 of 32
EPA-NE QAPP Worksheet #15 - Rev. 10/99
Field Equipment Maintenance, Testing and Inspection Table
Sampling
Equipment/ Instrument
Maintenance
Activity
Testing Activity
Inspection
Activity
Responsible
Person
Frequency
Acceptance
Criteria
Corrective
Action
SOP
Reference
DO test kit
Rinse all syringes and
glassware with tap water after use, allow to
dry
NA
Check that enough reagent is available for the next round of sampling and that it is the correct color (color change indicates reagent needs replacement). Make sure there is no precipitate in the reagent bottles. Precipitate indicates that reagent must be replaced. Check that syringes and glassware are not damaged.
Person(s) collecting sample
Before each use
No equipment is damaged and
enough reagents are available for next sampling
round.
Call URIWW Laboratory for replacement equipment or
more reagents.
010
DO test kit
Replace all reagents and clean test kit components
NA NA URIWW
Laboratory Staff
Yearly NA NA 010
Shallow water sampler
Rinse with tap water after use and allow to dry
NA
Ensure that the primer bulb is not cracked and the tubing is securely
attached to the sampler.
Person(s) collecting sample
Before each use
Equipment is not damaged.
Call URIWW Laboratory for replacement
sampler.
011

QAPP –Watershed Watch Ambient and Marine Field Assays Revision: 1 Date: November 20, 2012
23 of 32
EPA-NE QAPP Worksheet #15 - Rev. 10/99
Field Equipment Maintenance, Testing and Inspection Table
Sampling
Equipment/ Instrument
Maintenance
Activity
Testing Activity
Inspection
Activity
Responsible
Person
Frequency
Acceptance
Criteria
Corrective
Action
SOP
Reference
Deep water sampler
Rinse with tap water after use and allow to dry
NA
Ensure the sampler is operational, that all lines are securely attached to
sampler and the weight is attached to the sampler.
Also check that the tube
that goes into the DO bottle is present. If it is
not there replace it using the barrel of a round Bic® pen cut to the appropriate
length.
Person(s) collecting sample
Before each use
Equipment is not damaged, line is securely attached and tube leading
into the DO bottle is present.
Call URIWW Laboratory for a
replacement sampler and/or
re-attach sampler line.
012
Salinity refractometer
Rinse glass surface and
cover with de-ionized water
after use, allow to dry open
NA
Check that sampling pipet is clean & undamaged. Check that enough de-
ionized water is available for the next round of
sampling, for cleaning and for calibration check. Ensure that enough 10 ppt salinity standard is available for calibration
check.
Person(s) collecting sample
Before each use
No equipment is damaged and
enough de-ionized water and
calibration standard is available for next
sampling round.
Call URIWW Laboratory for replacement equipment or more water or
standards.
013

QAPP –Watershed Watch Ambient and Marine Field Assays Revision: 1 Date: November 20, 2012
24 of 32
2.6.7 Field Analytical Method/SOP Reference Table (Test Kits and Instruments) –Worksheet #17
EPA- NE QAPP Worksheet #17 – Rev. 10/99
Field Analytical Method/SOP Reference Table Reference Number (Field SOP Number)
Title, Revision Date and/or Number Analytical Parameter Instrument
001 Safety First, 3/05 None None
002 Where We Monitor: Pin-Pointing Your Monitoring
Location, 3/05 Location of Monitoring None
003 Monitoring Postcard Instructions, 3/05 Wind Speed, Light, Rain, State of Tide None
004 Handling and Transporting Water Samples, 3/05 None None
005 Secchi Depth Transparency, 3/05 Secchi Depth Secchi Disk
006 Water Temperature, 3/05 Water Temperature Thermometer
007 Chlorophyll (Algae) And Dissolved Nutrients,
3/05 Chlorophyll-a, Chloride, Ammonia-N,
Orthophosphate-P and Nitrate + Nitrite-N Filter Housing and Syringe
008 Bacterial Monitoring, 3/05 enterococci, fecal colifroms and E. coli None
009 Collecting Unfiltered Water Samples, 3/05 pH, Alkalinity, BOD, TSS, Salinity, Total
Nitrogen and Phosphorus None
010 Dissolved Oxygen Monitoring, 3/05 Dissolved Oxygen DO Test Kit
011 Shallow Water Sampler Operation, 3/05 None Shallow Water Sampler
012 Deep Water Sampler Operation, 3/05 None Deep Water Sampler
013 Monitoring Salinity, 3/05 Salinity Salinity Refractometer

QAPP –Watershed Watch Ambient and Marine Field Assays Revision: 1 Date: November 20, 2012
25 of 32
2.6.8 Field Sampling QC Table – Worksheet 22a
Note that other collected samples: nutrients (ammonia-N, orthophosphate-P & nitrate + nitrite-N), pH, alkalinity, TSS, salinity, total nitrogen and phosphorus and bacteria (fecal coliforms and enterococci) do not have any associated field sampling QC. All QC procedures (duplicate analyses, blanks, etc.) are completed in the laboratory. Therefore, there are no field sampling QC tables (Worksheet #22a) for these parameters.
EPA-NE QAPP Worksheet #22a - Rev. 10/99 - Field Sampling QC Table
Nutrients (whole and filtered) Sampling SOP Field SOP 007 Analytical Method/SOP Reference Laboratory SOP 012
Medium/Matrix Whole & Filtered / Ambient or Marine Waters Sampler’s Name Student staff
Analytical Parameter Chlorophyll-a Field Sampling Organization URIWW
Concentration Level
(undiluted sample)
Ambient and marine samples:
<2.5 ug/l – 100 ug/l P (total anddissolved)
<25 ug/l – 1000ug/l N total-, nitrate+nitrite, ammonia-
1 – 40 mg/l Cl
No. of Sample Locations 1-2
Field QC: Frequency/Number Method/SOP QC
Acceptance Limits Corrective Action (CA) Person(s) Responsible for CA
Data Quality Indicator (DQI)
Field Duplicate Pair (raw water)
10% See Laboratory QAPP See Laboratory QAPP URIWW Staff Precision
Field Filtration Duplicate 10% See Laboratory QAPP See Laboratory QAPP URIWW Staff Precision
Sampling and processing of a blind, purchased QC sample in the laboratory
1 - yearly Used to evaluate program. See Laboratory QAPP URIWW Staff Accuracy
Field Blanks 4-61 See Laboratory QAPP Re-sample, perform tests in laboratory of water
sources URIWW Staff Accuracy
1 Field blanks are collected with 4-6 monthly water collections annually, by URIWW student staff, proceed for total N&P and also filtered for dissolved nutrients..

QAPP –Watershed Watch Ambient and Marine Field Assays Revision: 1 Date: November 20, 2012
26 of 32
EPA-NE QAPP Worksheet #22a - Rev. 10/99 - Field Sampling QC Table
Bacteria – have elizabeth check this Sampling SOP Field SOP 007 Analytical Method/SOP Reference Laboratory SOP 012
Medium/Matrix Whole Ambient or Marine Waters Sampler’s Name Various
Analytical Parameter Fecal coliform and Enterococci Bacteria Field Sampling Organization URIWW
Concentration Level
(undiluted sample)
<1 – TNTC MPN or counts/100 ml
No. of Sample Locations 1-2
Field QC: Frequency/Number Method/SOP QC
Acceptance Limits Corrective Action (CA) Person(s) Responsible for CA
Data Quality Indicator (DQI)
Field Duplicate Pair (raw water)
10% See Laboratory QAPP See Laboratory QAPP URIWW Staff Precision
Sampling and processing of a blind, purchased QC sample in the laboratory
1 - yearly Used to evaluate program. See Laboratory QAPP URIWW Staff Accuracy

QAPP –Watershed Watch Ambient and Marine Field Assays Revision: 1 Date: November 20, 2012
27 of 32
EPA-NE QAPP Worksheet #22a - Rev. 10/99 - Field Sampling QC Table
Chlorophyll (algae) Sampling SOP Field SOP 007 Analytical Method/SOP Reference Laboratory SOP 012
Medium/Matrix Filter / Ambient or Marine Waters Sampler’s Name Various
Analytical Parameter Chlorophyll-a Field Sampling Organization NA
Concentration Level
(undiluted sample)
Ambient and marine samples:
<0.2 – 100 µg/L chlorophyll-a No. of Sample Locations NA
Field QC: Frequency/Number Method/SOP QC
Acceptance Limits Corrective Action (CA) Person(s) Responsible for CA Data Quality Indicator (DQI)
Field Duplicate Pair (raw water)
100% See Laboratory QAPP See Laboratory QAPP URIWW Staff Precision
Field Filtration Duplicate 100% See Laboratory QAPP See Laboratory QAPP URIWW Staff Precision
Sampling and processing of a provided sample in the laboratory
1 - yearly
Used to evaluate program and if person(s) collecting samples are processing
samples correctly.
Re-train person(s) collecting samples if needed URIWW Staff Precision
Note: No measurement performance criteria are provided in this table as this QAPP is for general field procedures and not associated with a specific project
QAPP –Watershed Watch Ambient and Marine Field Assays Revision: 1 Date: November 20, 2012
28 of 32
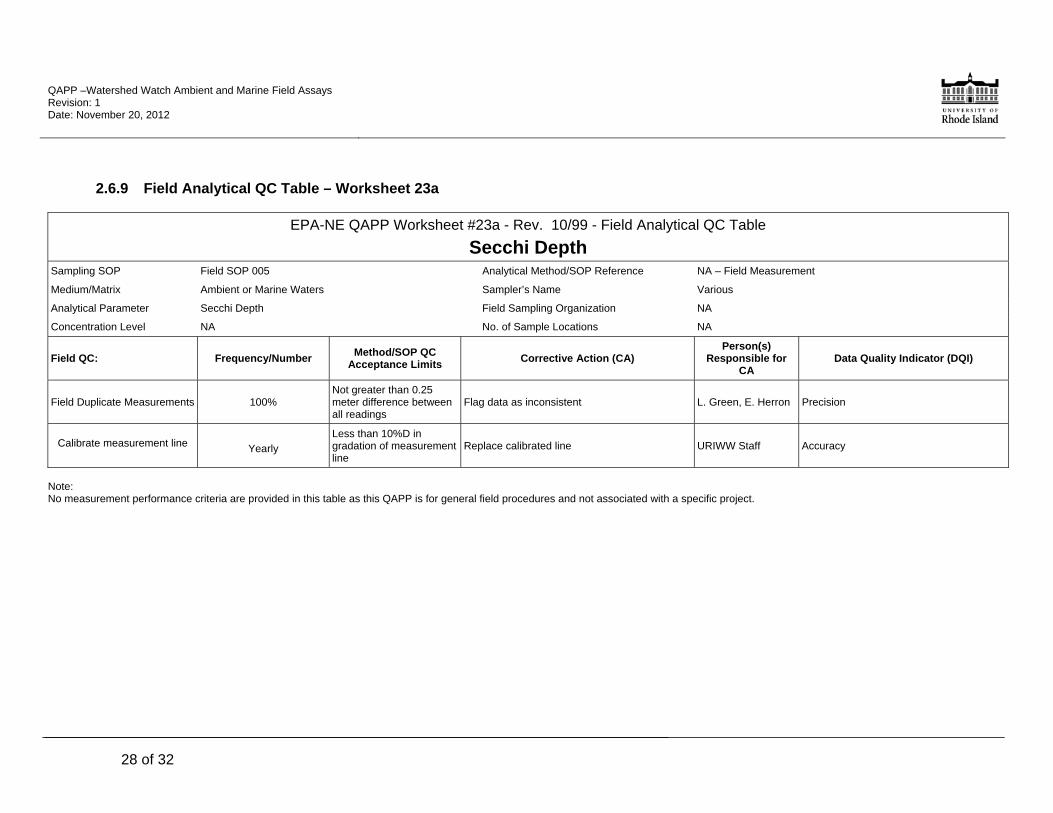
2.6.9 Field Analytical QC Table – Worksheet 23a
EPA-NE QAPP Worksheet #23a - Rev. 10/99 - Field Analytical QC Table
Secchi Depth Sampling SOP Field SOP 005 Analytical Method/SOP Reference NA – Field Measurement
Medium/Matrix Ambient or Marine Waters Sampler’s Name Various
Analytical Parameter Secchi Depth Field Sampling Organization NA
Concentration Level NA No. of Sample Locations NA
Field QC: Frequency/Number Method/SOP QC
Acceptance Limits Corrective Action (CA)
Person(s) Responsible for
CA Data Quality Indicator (DQI)
Field Duplicate Measurements 100% Not greater than 0.25 meter difference between all readings
Flag data as inconsistent L. Green, E. Herron Precision
Calibrate measurement line Yearly
Less than 10%D in gradation of measurement line
Replace calibrated line URIWW Staff Accuracy
Note: No measurement performance criteria are provided in this table as this QAPP is for general field procedures and not associated with a specific project.

QAPP –Watershed Watch Ambient and Marine Field Assays Revision: 1 Date: November 20, 2012
29 of 32
EPA-NE QAPP Worksheet #23a - Rev. 10/99 - Field Analytical QC Table
Temperature Sampling SOP Field SOP 006 Analytical Method/SOP Reference NA – Field Measurement
Medium/Matrix Ambient or Marine Waters Sampler’s Name Various
Analytical Parameter Temperature Field Sampling Organization NA
Paramter Level 0 -100 °C No. of Sample Locations NA
Field QC: Frequency/Number Method/SOP QC
Acceptance Limits Corrective Action (CA)
Person(s) Responsible for
CA Data Quality Indicator (DQI)
Calibrate Yearly Difference less than +/- 1 °C from reference
Replace or repair thermometer URIWW Staff Accuracy
Note: No measurement performance criteria are provided in this table as this QAPP is for general field procedures and not associated with a specific project
EPA-NE QAPP Worksheet #23a - Rev. 10/99 - Field Analytical QC Table
Dissolved Oxygen Sampling SOP Field SOP 010 Analytical Method/SOP Reference NA – Field Test Kit
Medium/Matrix Ambient or Marine Waters Sampler’s Name Various
Analytical Parameter Dissolved Oxygen Field Sampling Organization NA
Concentration Level 0 – 10 mg/L O2 No. of Sample Locations NA
Field QC: Frequency/Number Method/SOP QC
Acceptance Limits Corrective Action (CA)
Person(s) Responsible for
CA Data Quality Indicator (DQI)
Duplicate Titration 100% Results not more than 1 mg/L O2 different
Complete a third titration and record results Sampler Precision
Collect field duplicate pair (deep water samples only)
100% Results not more than 1 mg/L O2 different
Complete a third titration and record results Sampler Precision
Analysis of known sample (LCS)
Yearly Value less than +/- 1 ppm different from known value
Sampler is re-trained in how to complete analysis
L. Green or E. Herron
Accuracy
Note: No measurement performance criteria are provided in this table as this QAPP is for general field procedures and not associated with a specific project

QAPP –Watershed Watch Ambient and Marine Field Assays Revision: 1 Date: November 20, 2012
30 of 32
EPA-NE QAPP Worksheet #23a - Rev. 10/99 - Field Analytical QC Table
Salinity Sampling SOP Field SOP 013 Analytical Method/SOP Reference Create refractometer SOP
Medium/Matrix Marine Waters Sampler’s Name Various
Analytical Parameter Salinity Field Sampling Organization NA
Concentration Level <1 – 40 ppt No. of Sample Locations NA
Field QC: Frequency/Number Method/SOP QC
Acceptance Limits Corrective Action (CA)
Person(s) Responsible for A
Data Quality Indicator (DQI)
Analysis of known sample (LCS)
Prior to each day’s use of refractometer
Value less than +/- 2 ppt different from known value
Refractometer is re-claibrated Refractometer user Accuracy
Note: No measurement performance criteria are provided in this table as this QAPP is for general field procedures and not associated with a specific project

QAPP –Watershed Watch Ambient and Marine Field Assays Revision: 1 Date: November 20, 2012
31 of 32
3.0 SAMPLE HANDLING, TRACKING AND CUSTODY REQUIREMENTS
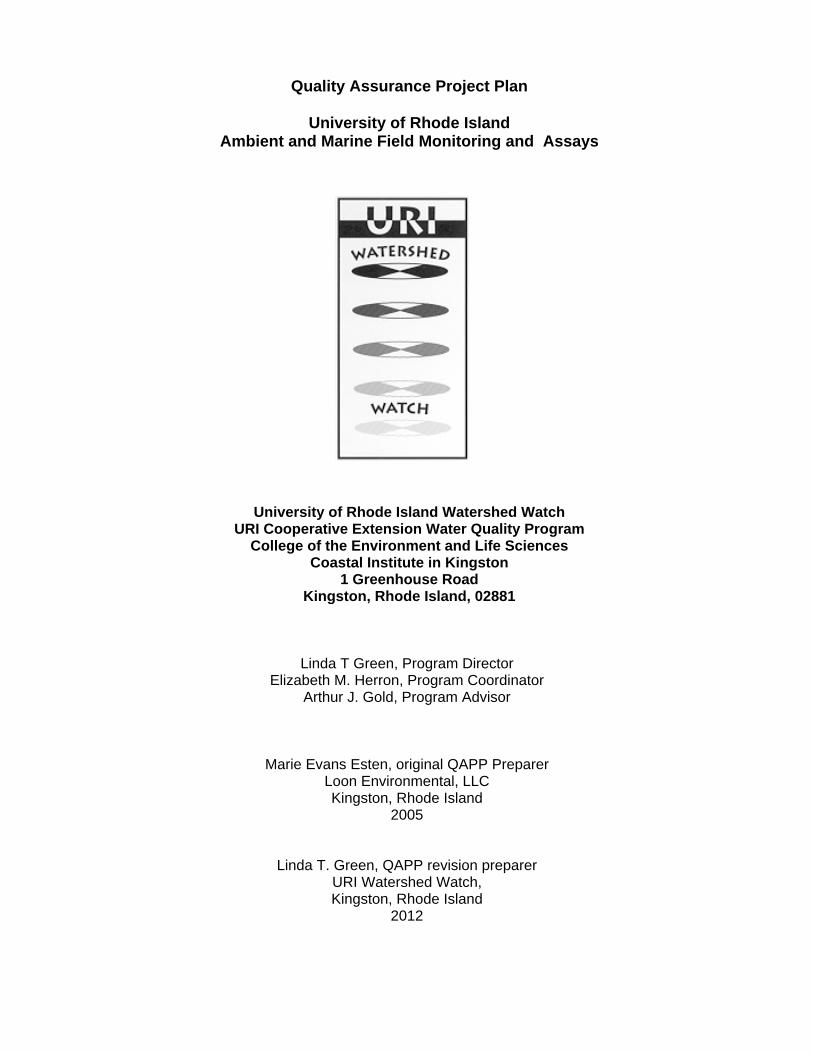
Data collected using field analysis procedures (Secchi depth, temperature, DO, wind speed, light, rain and state of tide) are returned to the URIWW Laboratory on monitoring postcards (see Field SOP 003) or a similar document, or entered on-line. The postcard and online data entry includes the date and time of sampling, sampling location and monitor(s) name(s) as well as the field data. Collected samples are transported to the URIWW Laboratory by the sampler. When dropping off the samples at the laboratory the sampler signs their name on the sample log sheet, provides the date and time the samples were collected and alerts laboratory staff if the required samples were not collected. Sample log sheets provided by the URIWW Laboratory act as the project chain of custody and are retained by the URIWW Laboratory in the project file (figure 3). The sample log sheet will include the following information: 1. Project Name 2. Project Location 3. Person(s) responsible for transporting samples 4. Date and time of sample collection 5. Date and time of sample receipt 6. Sample identification name/number 7. Number and type of sample bottles A technician will be responsible for checking that the samples listed on the sample log sheet correspond correctly with the samples received. A copy of the sample log sheet will be maintained in the project file. Project files are maintained in the main URIWW laboratory and Linda Green’s office, in the URI Coastal Institute. Both locations are locked when staff are not present.
3.1 Acceptance of Expendable Laboratory supplies
All expendable laboratory supplies such as test kit reagents and sample bottles will be inspected upon arrival by either Linda Green or Elizabeth Herron. Packages containing damaged material or packages that were open upon arrival will not be accepted. Chemicals will be marked with the date of acceptance as well as the date they are opened.

QAPP –Watershed Watch Ambient and Marine Field Assays Revision: 1 Date: November 20, 2012
32 of 32
Figure 3 - Example sample log sheet
Date Time Date Time Plastic Brown Plastic Plastic Chl-a Tributary
# Depth Monitoring Location Your name Unfiltered Unfiltered Filtered Sterile baggy Bottles
1 S Almy Pond 1 1 1 1
2 S Alton Pond 1 1 1 1
3 S Annaquatucket Mill P 1 1 1 1
4 S Asa Pond 1 1 1 1
5 D Barber Pond 1 2 1 1
6 D Beach Pond 1 2 1 1
7 S Belleville Pond - Lower 1 1 1 1
8 S Belleville P - Upper 1 1 1 1
9 S Blackamore Pond 1 1 1 1
10 S Blue Lake (CT) 1 1 1 1
11 D Boone Lake 1 2 1 1
12 D Carr Pond (WG) 1 2 1 1
13 S Cross Mills Pond 1 1 1 1
14 D Deep Pond 1 2 1 1
15 D Flat River Reservoir 1 2 1 1
16 D Georgiaville Pond 1 2 1 1
17 D Gorton Pond 1 2 1 1
18 S Hawkins Pond 1 1 1 1
19 D Hundred Acre Pond 1 2 1 1
20 S Indian Lake 1 1 1 1
21 S Keech Pond 1 1 1 1
22 S Lily Pond 1 1 1 1
23 D Little Pond 1 2 1 1
24 D Long Pond (SK) 1 2 1 1
Collected Received
2012 lakes and Ponds Log Sheet: Third Water Collection (July) You should have all of the bottles/bags listed with your monitoring location.

QAPP –Watershed Watch Ambient and Marine Field Assays Revision: 1 Date: November 20, 2012
33 of 32
3.2 Sample Handling System – Worksheet 16
EPA-NE QAPP Worksheet #16 - Rev. 10/99
Sample Handling System SAMPLE COLLECTION, PACKAGING AND SHIPMENT Sample Collection: Various persons Sample Packing: Person(s) responsible for sample collection Coordination of Shipment: Person(s) responsible for sample collection Type of Shipment: By car in cooler with ice packs. Generally the person responsible for sample collection or their designee. SAMPLE RECEIPT AND ANALYSIS Responsible Organization: University of Rhode Island Watershed Watch Laboratory (URIWW) Sample Receipt: URIWW Staff Sample Custody and Storage: URIWW Staff Sample Preparation: URIWW Staff Sample Determinative Analysis: URIWW Staff SAMPLE ARCHIVAL Field Sample Storage (No. of days from sample collection): Dependent upon analysis – Refer to URIWW Laboratory Program QAPP. Sample Extract/Digestate Storage (No. of days from extraction/digestion): Dependent upon analysis – Refer to URIWW Laboratory Program QAPP. SAMPLE DISPOSAL Responsible Organization and personnel: URIWW / URIWW Staff

QAPP –Watershed Watch Ambient and Marine Field Assays Revision: 1 Date: November 20, 2012
34 of 32
4.0 PROJECT DOCUMENTATION AND RECORDS
All sample log sheets will be retained by the laboratory in the project files. All hard copy field data sheets will also be retained in the project files. Project files are maintained in the main URIWW laboratory and Linda Green’s office, in the URI Coastal Institute by Linda Green and Elizabeth Herron. Both locations are locked when staff are not present. Electronic data are stored on a password protected laboratory computer that is networked to several other password protected computers throughout the URIWW Laboratories and offices. All laboratory data (electronic and hard copy) are retained for at least 10 years. No general quality management reports are prepared. During the collection and analysis of field samples the volunteer or technician completing sample collection or analysis is responsible for recording any problems with meeting measurement performance criteria (Section 2.6.3) and/or instrument operational issues. Any failure of a sample to meet defined measurement performance criteria should be recorded and the data flagged for further review upon data entry and final data validation. Data generated by each analysis is internally validated by either Ms. Green or Ms. Herron by comparing the data to criteria in the appropriate tables in Section 2.6. The data validation process starts once the data has been produced and is entered into Microsoft Excel files. After data has been entered into the appropriate file, URIWW staff complete an initial check to be sure all data was entered correctly. Then, Ms. Green or Ms. Herron check the data entered for errors and correct any. Outliers and inconsistencies are flagged for further review. If data collected by volunteer monitor is flagged, then the monitor is contacted to check that the data sent to the laboratory was correct. Data are compared to values obtained for similar samples analyzed in the past. The decision to discard data will be made by either Ms. Green or Ms. Herron.

QAPP –Watershed Watch Ambient and Marine Field Assays Revision: 1 Date: November 20, 2012
Appendix A
Appendix A
Standard Operation Procedures List of SOPs
Description SOP
Number
Safety First 001
Where We Monitor: Pin-Pointing Your Monitoring Location 002
Monitoring Postcard Instructions 003
Handling and Transporting Water Samples 004
Secchi Depth Transparency 005
Water Temperature 006
Chlorophyll (Algae) And Dissolved Nutrients 007
Bacterial Monitoring 008
Collecting Unfiltered Water Samples 009
Dissolved Oxygen Monitoring 010
Shallow Water Sampler Operation 011
Deep Water Sampler Operation 012
Monitoring Salinity 013

QAPP –Watershed Watch Ambient and Marine Field Assays Revision: 1 Date: November 20, 2012
Appendix B
Appendix B
Resumes for Key Laboratory Personnel List of Resumes
Arthur Gold, PhD
Linda Green, MS
Elizabeth Herron, MA
Jose Amador, PhD

QAPP –Watershed Watch Ambient and Marine Field Assays Revision: 1 Date: November 20, 2012
Appendix C
Appendix C
Descriptive Information Regarding University of Rhode Island Watershed Watch (URIWW)