Embed Size (px)
Citation preview
Quality Control and Proficiency Testing
Ross Molinaro, PhD, MT(ASCP), DABCC, FACB Emory University
Atlanta, GA

Learning Objectives
After this presentation, you should be able to: • Define QC terms • Provide an overview of Multi-rule QC • Define and calculate “Sigma” as measure of process
performance • Assess Proficiency Testing
– Requirements, Process and Function
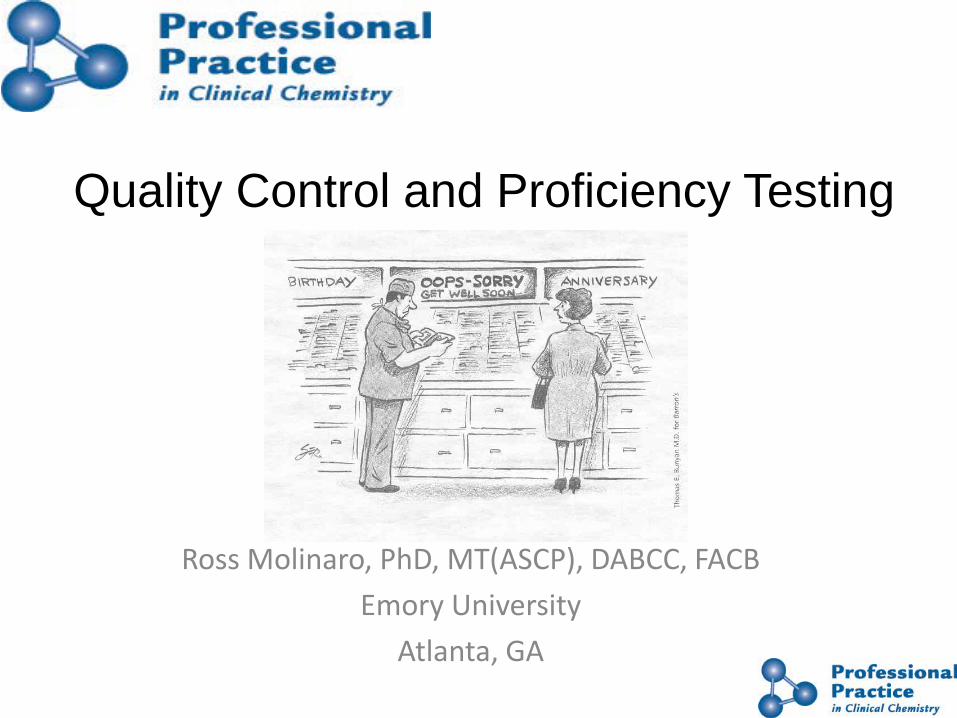
Important Definitions Quality • The totality of characteristics of a product or service that
bear on its ability to satisfy stated and implied needs (customer requirements).
Quality assurance • Planned and systematic activities to provide adequate
confidence that requirements for quality will be met. Quality management • All activities of the overall management function that
determine quality policy objectives and responsibilities; and implement them by means such as quality planning, quality control, quality assurance, and quality improvement within the quality system.
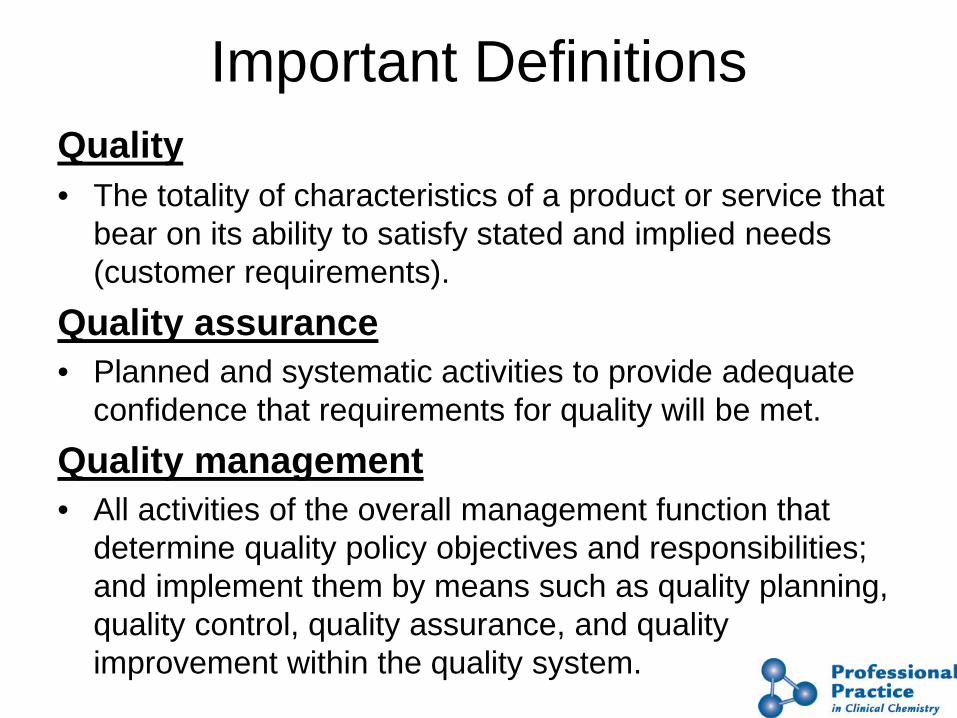
Controls and Control Charts Routinely performance of analytical methods is monitored
using stable controls. • Control Material - Specimen or solution which is
analyzed solely for monitoring performance of a method. (Never used for calibration purposes)
• Control Charts – Simple graphical displays in which
observed values are plotted versus the time when the observations were made.
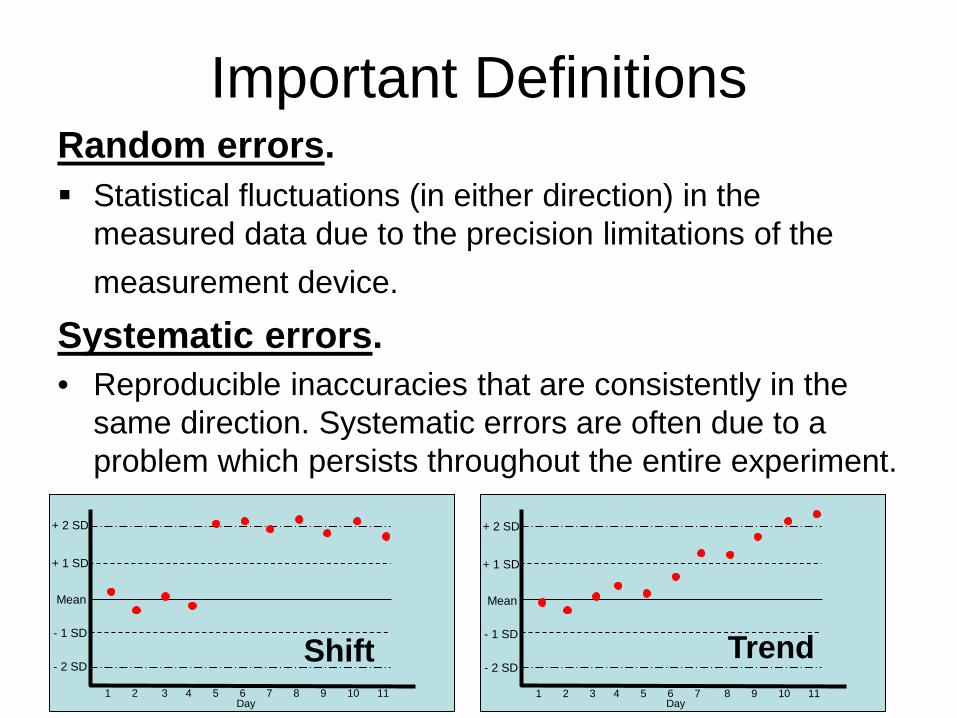
Random errors. Statistical fluctuations (in either direction) in the
measured data due to the precision limitations of the measurement device.
Systematic errors. • Reproducible inaccuracies that are consistently in the
same direction. Systematic errors are often due to a problem which persists throughout the entire experiment.
Important Definitions
Mean
- 1 SD
- 2 SD
+ 1 SD
+ 2 SD
Day 1 2 3 4 5 6 7 8 9 10 11
Mean
- 1 SD
- 2 SD
+ 1 SD
+ 2 SD
Day 1 2 3 4 5 6 7 8 9 10 11
Shift Trend
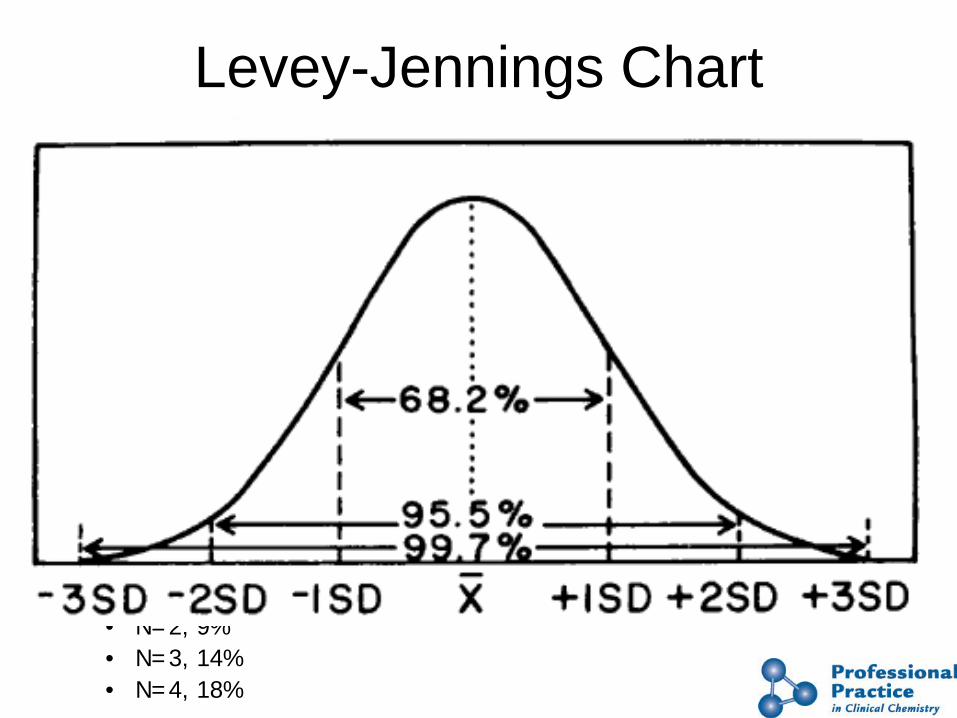
► False rejection problems with LJ charts that use 2 SD control limits: • N=1, 5% • N=2, 9% • N=3, 14% • N=4, 18%
Levey-Jennings Chart
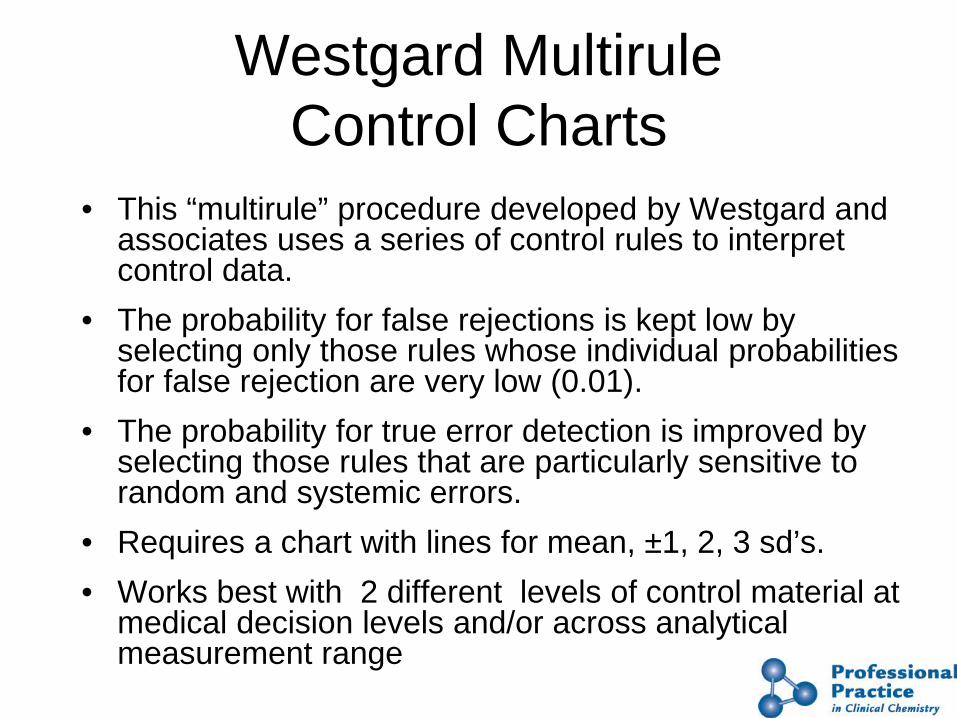
Westgard Multirule Control Charts
• This “multirule” procedure developed by Westgard and associates uses a series of control rules to interpret control data.
• The probability for false rejections is kept low by selecting only those rules whose individual probabilities for false rejection are very low (0.01).
• The probability for true error detection is improved by selecting those rules that are particularly sensitive to random and systemic errors.
• Requires a chart with lines for mean, ±1, 2, 3 sd’s. • Works best with 2 different levels of control material at
medical decision levels and/or across analytical measurement range

PROBLEM RESOLUTION IN THE WORKPLACE
DON’T CHANGE ANYTHING OR LOOK AT
ANY OTHER QC DID YOUTRY TO FIX IT?
DID QC PASS?YES NO
YES
THAT’S STUPID!NO
ARE YOUGOING TO BE IN
TROUBLE?
NO
PRETEND YOU DON’T KNOW ABOUT IT.
DOES ANYBODY KNOW ABOUT IT?
OH NO! YESYES
NO
HIDE ITCAN YOU
BLAME SOMEONEELSE?
NO
THEN, THERE IS NO PROBLEM.
YES
The “Notsogood” Lab QC Trouble Shooting Diagram

Westgard Structured Rule Interpretation
– When controls fall within 2 sd’s, accept the run.
– “Warning Rule” - One control ± 2 sd limit, hold patient results while inspecting control data with the 13s , 22s , R4s , 41s , and 10x rules. If any of these additional rules indicates that the run is “out of control”, reject the run.
– When a run is “out of control” determine the type of error occurring based on the control rule violated.
– Look for sources of that type of error. Correct the problem and reanalyze the whole run including controls.

Control rule definitions ► AL = general symbol for a control rule
• A is an abbreviation for a statistic, or the number of control measurements
• L refers to the control limits, usually specified by giving the number of standard deviations from the mean; also can specify the probability for false rejection
12s = one control measurement exceeds x ± 2s limits
13s = one control measurement exceeds x ± 3s limits
22s = two consecutive control measurements exceed the same x + 2s or x - 2s limit
R4s = range or difference between control measurements within a run exceeds 4s
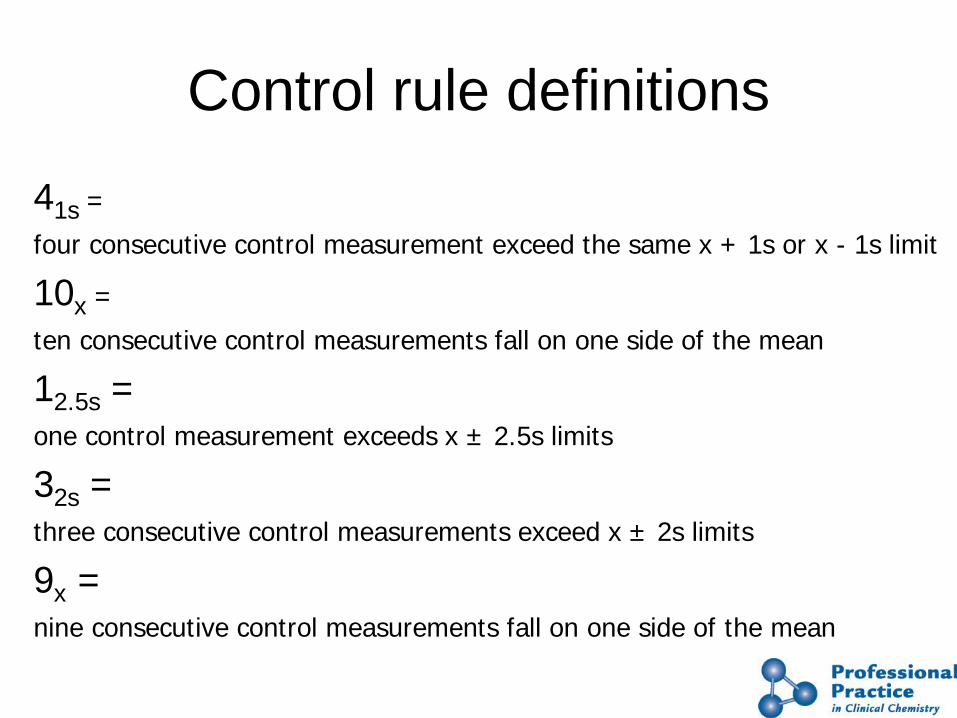
Control rule definitions
41s =
four consecutive control measurement exceed the same x + 1s or x - 1s limit
10x =
ten consecutive control measurements fall on one side of the mean
12.5s = one control measurement exceeds x ± 2.5s limits
32s = three consecutive control measurements exceed x ± 2s limits
9x = nine consecutive control measurements fall on one side of the mean
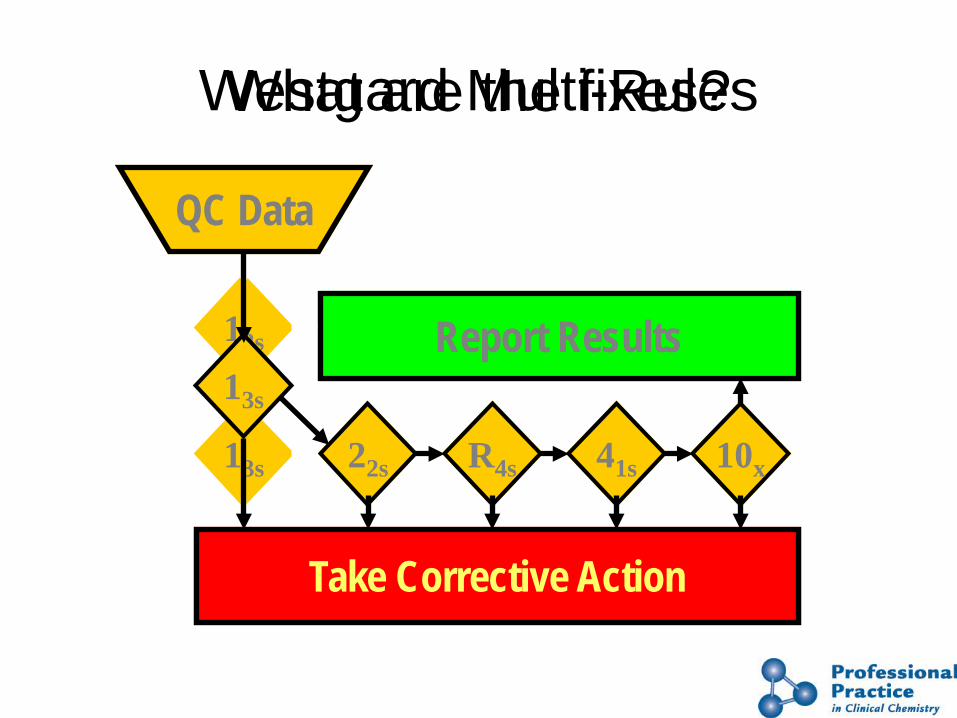
Westgard Multi-Rules
QC Data
12s
13s 22s R4s 41s 10x
Report Results
Take Corrective Action
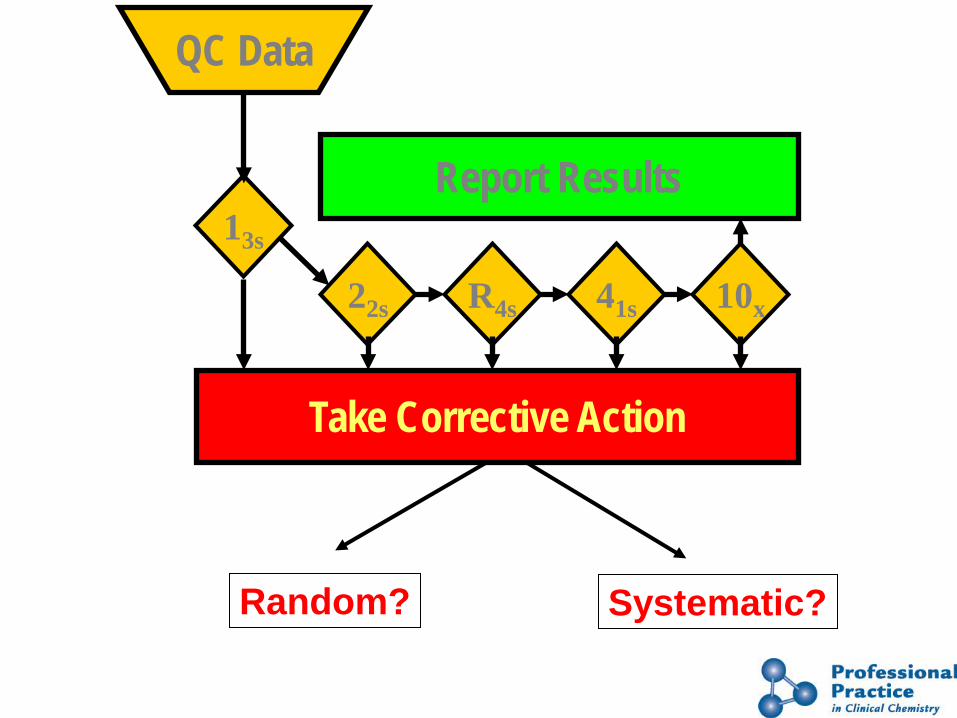
QC Data
13s
22s R4s 41s 10x
Report Results
Take Corrective Action
What are the fixes?
QC Data
13s
22s R4s 41s 10x
Report Results
Take Corrective Action
Random? Systematic?
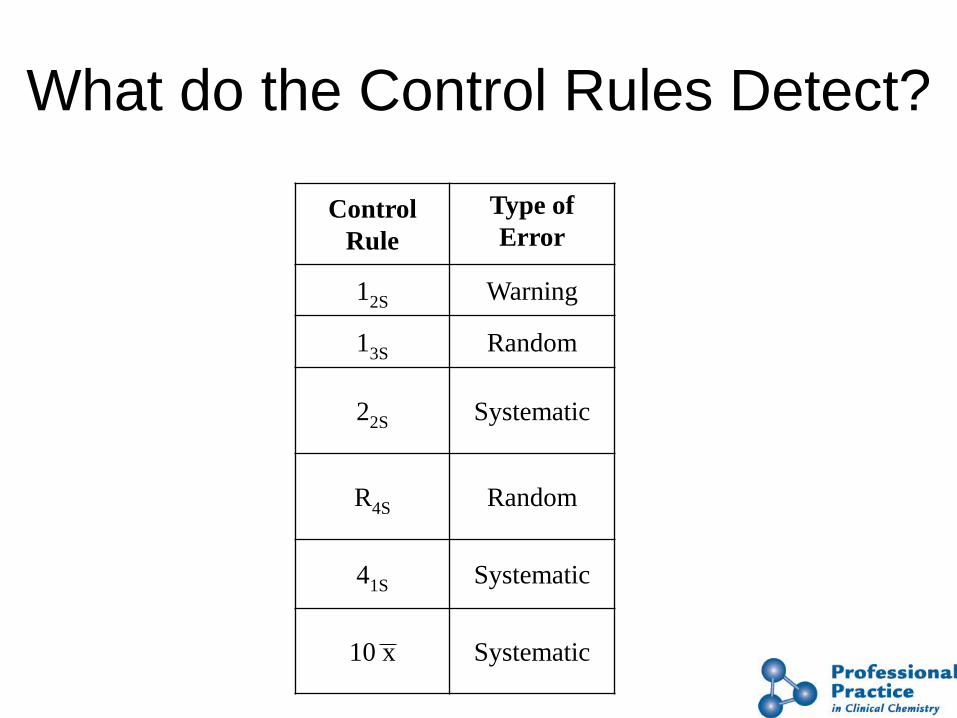
What do the Control Rules Detect?
Control Rule
Type of Error
12S Warning
13S Random
22S Systematic
R4S Random
41S Systematic
10 x Systematic

What Do You Do Now? • Change Old Bad Habits - Recognize Problems:
– Bad Habit #1: Repeat the control – Bad Habit #2: Try a new control
• Develop Good Habits - Solve Problems: – Good Habit #1: Inspect control charts or rules violated
to determine type or error – Good Habit #2: Relate type of error to possible
causes – Good Habit #3: Consider factors in common on
multitest systems – Good Habit #4: Relate causes to recent changes – Good Habit #5: Verify the solution and document the
remedy
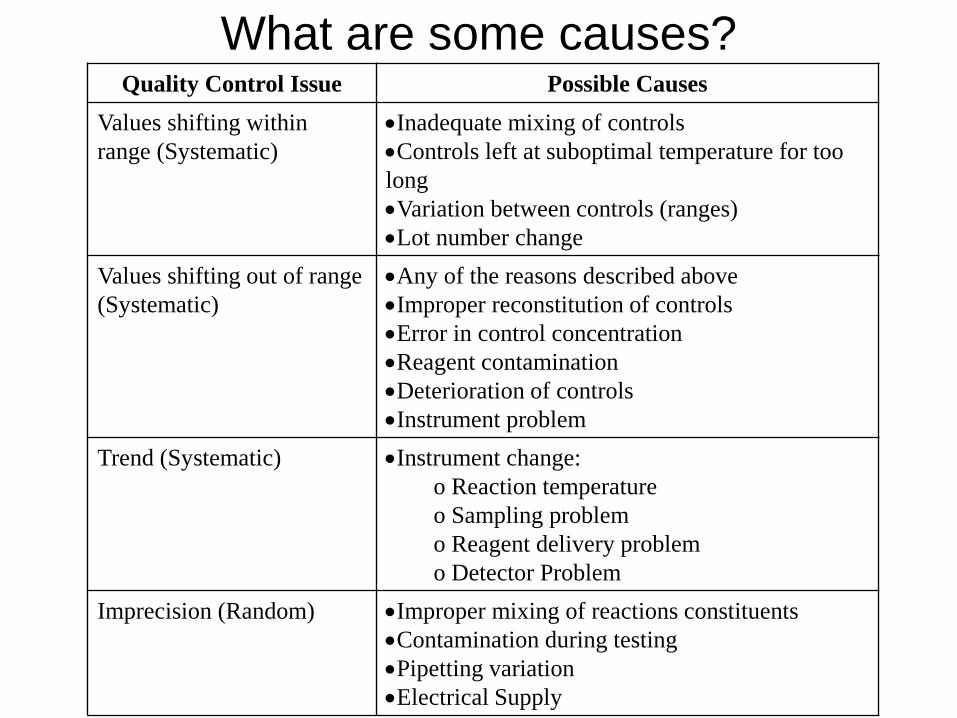
What are some causes?
Quality Control Issue Possible Causes Values shifting within range (Systematic)
•Inadequate mixing of controls •Controls left at suboptimal temperature for too long •Variation between controls (ranges) •Lot number change
Values shifting out of range (Systematic)
•Any of the reasons described above •Improper reconstitution of controls •Error in control concentration •Reagent contamination •Deterioration of controls •Instrument problem
Trend (Systematic) •Instrument change: o Reaction temperature o Sampling problem o Reagent delivery problem o Detector Problem
Imprecision (Random) •Improper mixing of reactions constituents •Contamination during testing •Pipetting variation •Electrical Supply
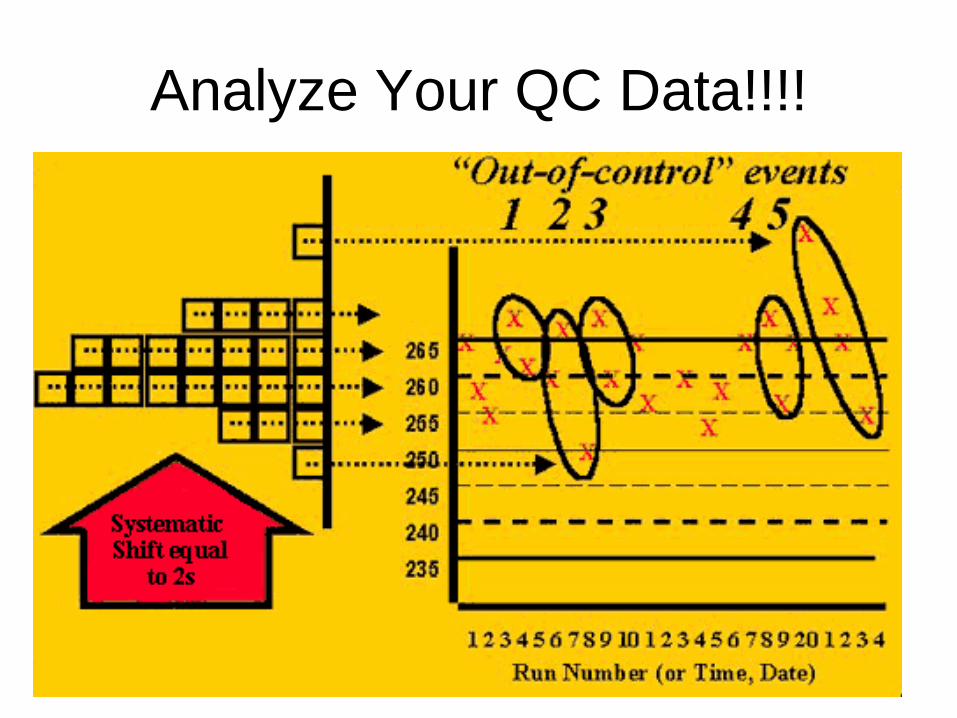
Analyze Your QC Data!!!!
Mean
- 1 SD
- 2 SD
+ 1 SD
+ 2 SD
Day 1 2 3 4 5 6 7 8 9 10 11
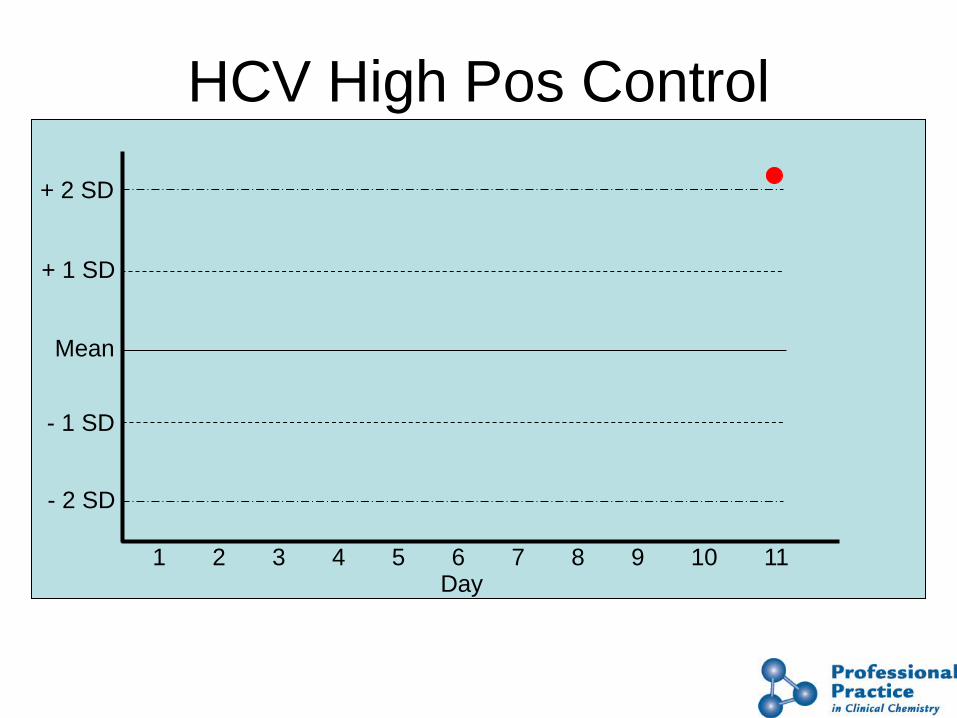
HCV High Pos Control
Shift.
Inspect control charts or rules violated to determine type or error
Systematic Error.
Trend.
• Instrument change: o Reaction temperature o Sampling problem o Reagent delivery problem
• Controls left at suboptimal temperature for too long • Variation between controls (ranges)
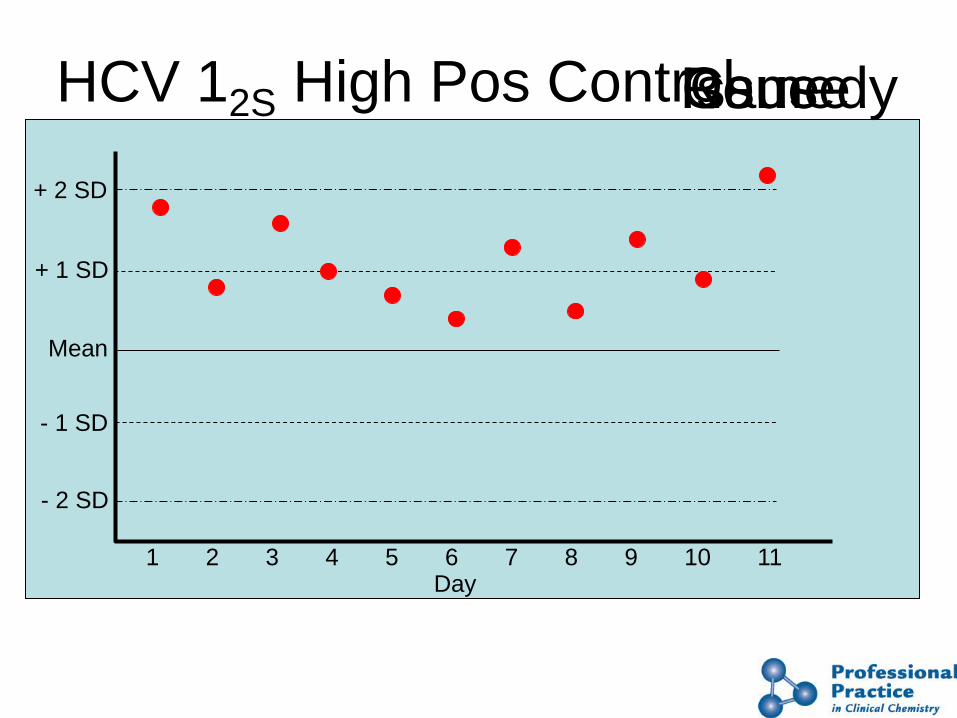
HCV 12S High Pos Control Issue Cause
Mean
- 1 SD
- 2 SD
+ 1 SD
+ 2 SD
Day 1 2 3 4 5 6 7 8 9 10 11
Remedy
Shift.
Inspect control charts or rules violated to determine type or error
Systematic Error.
Trend.
• Instrument change: o Reaction temperature o Sampling problem o Reagent delivery problem
• Controls left at suboptimal temperature for too long • Variation between controls (ranges)
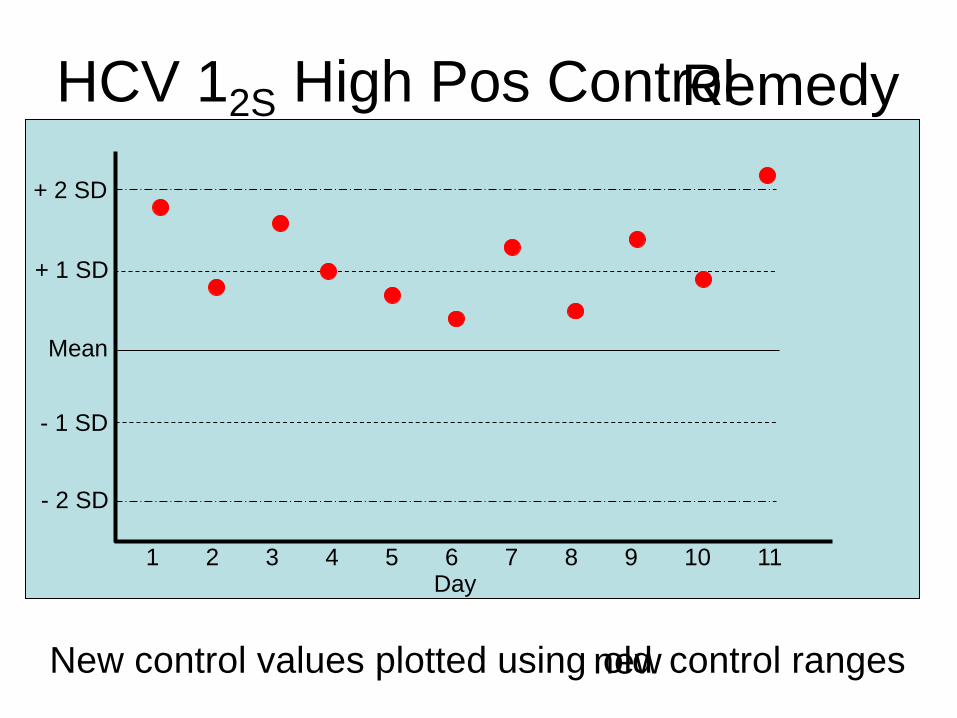
HCV 12S High Pos Control
Mean
- 1 SD
- 2 SD
+ 1 SD
+ 2 SD
Day 1 2 3 4 5 6 7 8 9 10 11
Remedy
New control values plotted using control ranges old new
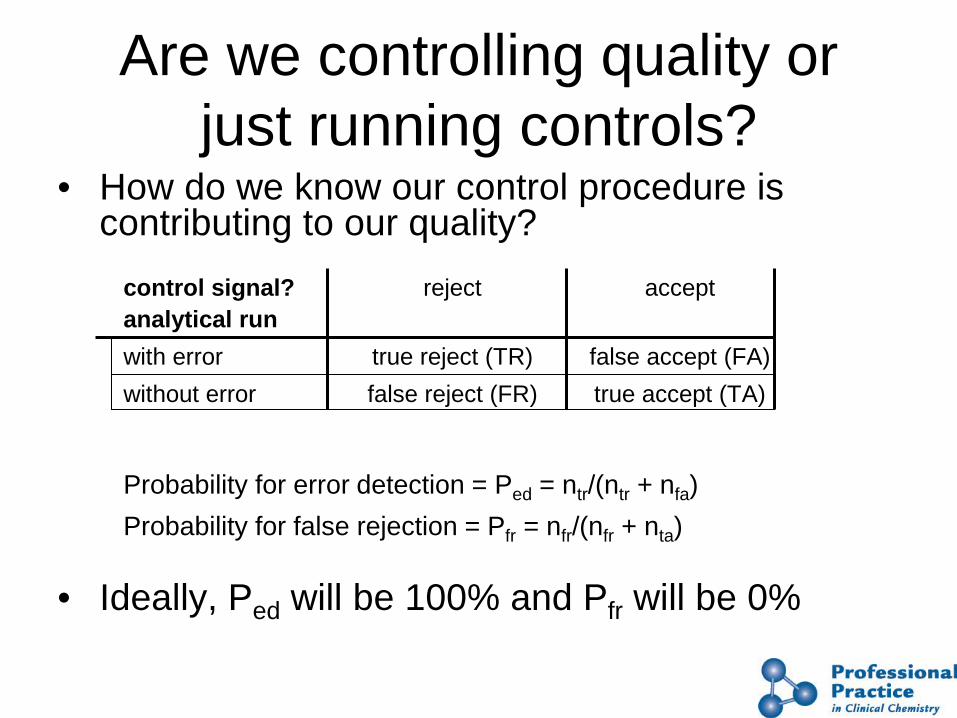
Are we controlling quality or just running controls?
• How do we know our control procedure is contributing to our quality?
control signal? reject accept analytical run with error true reject (TR) false accept (FA) without error false reject (FR) true accept (TA) Probability for error detection = Ped = ntr/(ntr + nfa) Probability for false rejection = Pfr = nfr/(nfr + nta)
• Ideally, Ped will be 100% and Pfr will be 0%

On what does the performance of control procedures depend?
Ped increases when: • N increases • Control limits are narrowed • Fewer measurements in a row are required to exceed a
limit Pfr decreases when: • N decreases • Control limits are widened • More measurements in a row are required to exceed a
limit
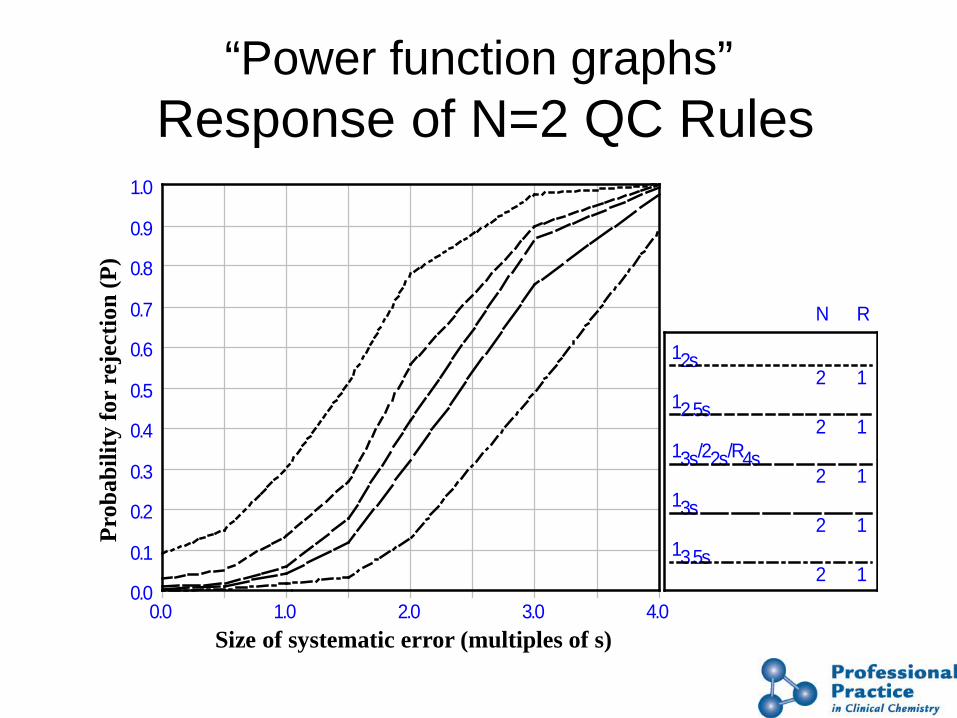
“Power function graphs” Response of N=2 QC Rules
0.0
0.1
0.2
0.3
0.4
0.5
0.6
0.7
0.8
0.9
1.0
0.0 1.0 2.0 3.0 4.0
12s
12.5s
13s/22s/R4s
13s
13.5s
N
2
2
2
2
2
R
1
1
1
1
1
Size of systematic error (multiples of s)
Prob
abili
ty fo
r re
ject
ion
(P)

• Six Sigma: Quantitative goal for process performance
• Achieve “six sigma” performance
Universal measure of process performance • Measure Defects Per Million (DPM) or Defects Per Million
Opportunities (DPMO)
A six sigma process is one that produces no more than 3.4 defects per million opportunities
Goal of ≤ 3.4 DPMO is the current industry standard for many manufacturing processes
o Motorola: Six Sigma = 3.4 DPM
Established by Motorola in 1985 to reduce number of manufacturing defects
Important Definitions
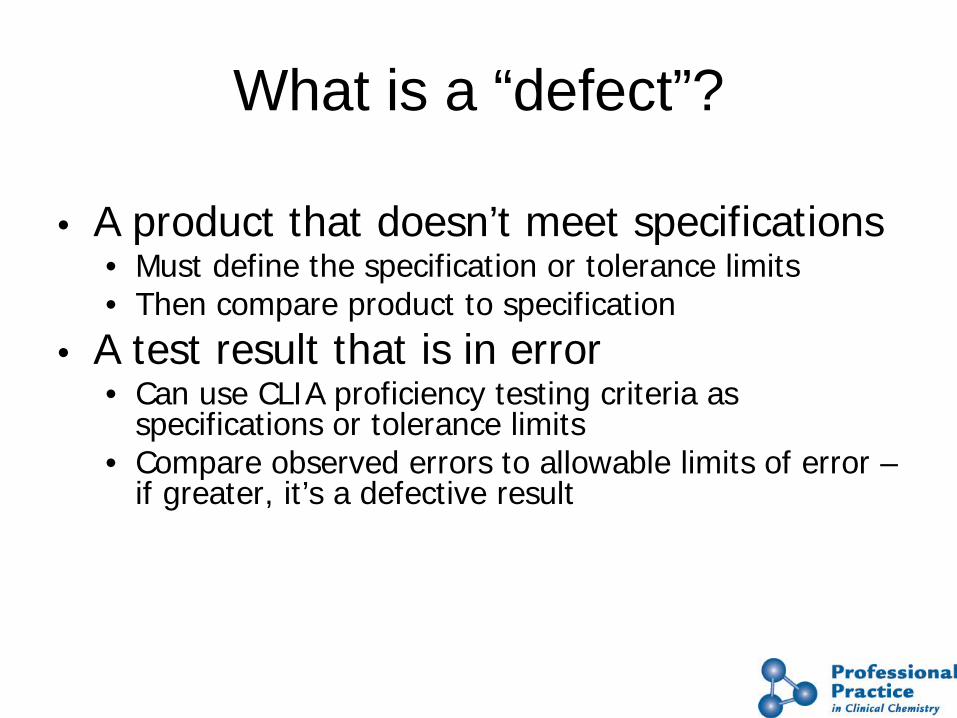
What is a “defect”?
• A product that doesn’t meet specifications • Must define the specification or tolerance limits • Then compare product to specification
• A test result that is in error • Can use CLIA proficiency testing criteria as
specifications or tolerance limits • Compare observed errors to allowable limits of error –
if greater, it’s a defective result

26
Sigma Metric Sigma = (TEA - bias)/SD
• Sigma has no units • All parameters in the equation should be of
the same unit • If units are in %, CV will replace SD at a
specific medical decision concentration • Bias will be expressed as % at the same
medical decision concentration

27
Recommended Sigma values
• Higher sigma is better
• Sigma of 6.0 is the goal for world class quality
• Sigma of 3.0 is the minimum allowable sigma for routine production

28
Sigma Metric and QC Design • Sigma ≥ 6, QC process is flexible. Keep false rejections low
by using wide control limits - at least 3s. • Sigma ~ 5, N=2 or 3 with control limits of 2.5s or 3.0s. • Sigma ~ 4, N=4 to 6, use either the 12.5s single rule or a
13s/22s/R4s/41s multirule procedure. • Sigma < 4.0, run all the control you can afford. In addition,
increase the frequency of instrument function checks, performance validation checks, and preventive maintenance.
• Sigma < 3.0, look for a new and better method. You can’t do enough QC to assure the quality of the test results
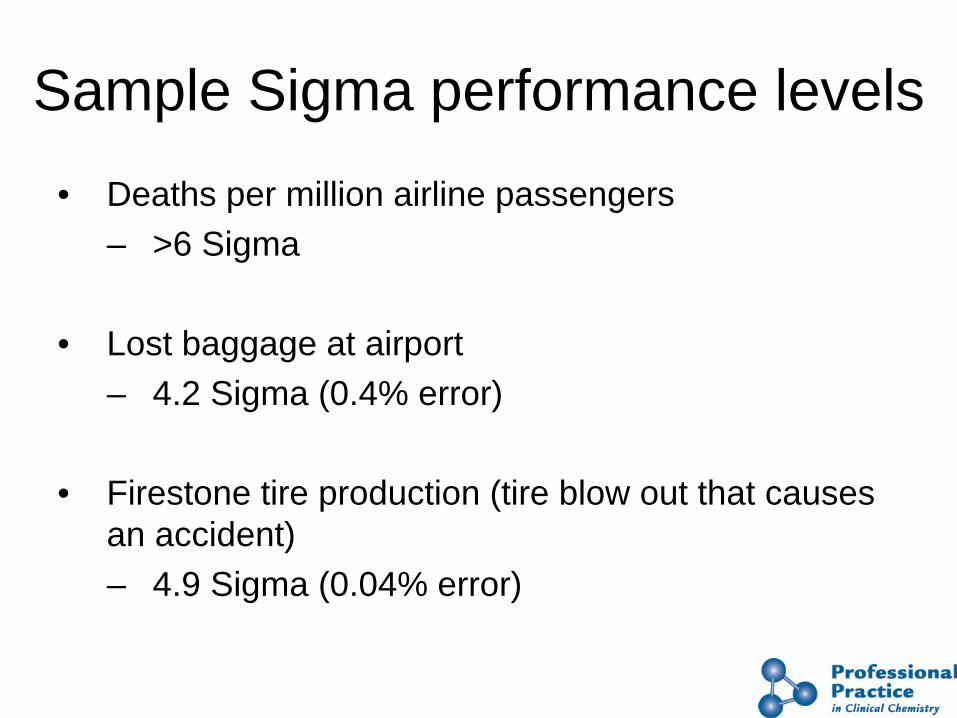
Sample Sigma performance levels • Deaths per million airline passengers
– >6 Sigma
• Lost baggage at airport – 4.2 Sigma (0.4% error)
• Firestone tire production (tire blow out that causes
an accident) – 4.9 Sigma (0.04% error)
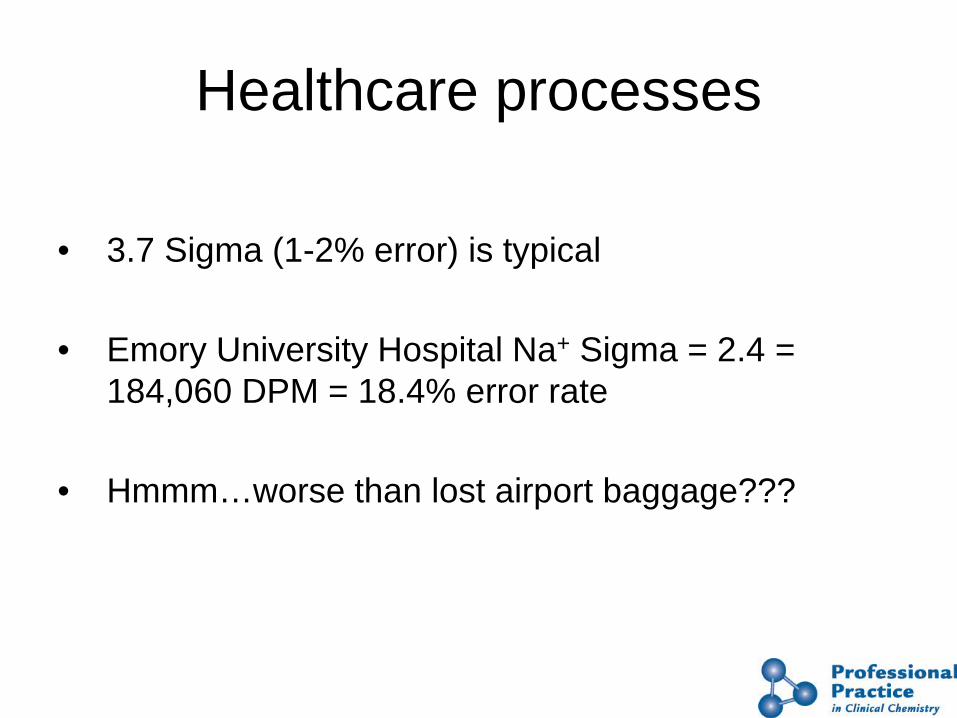
Healthcare processes
• 3.7 Sigma (1-2% error) is typical
• Emory University Hospital Na+ Sigma = 2.4 = 184,060 DPM = 18.4% error rate
• Hmmm…worse than lost airport baggage???
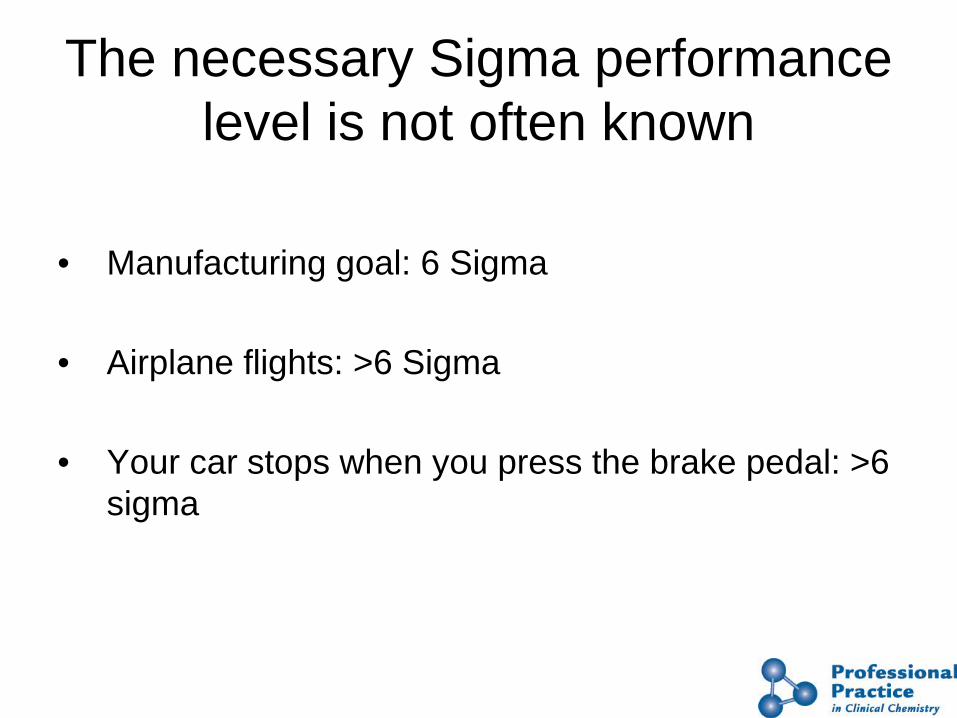
The necessary Sigma performance level is not often known
• Manufacturing goal: 6 Sigma
• Airplane flights: >6 Sigma
• Your car stops when you press the brake pedal: >6 sigma
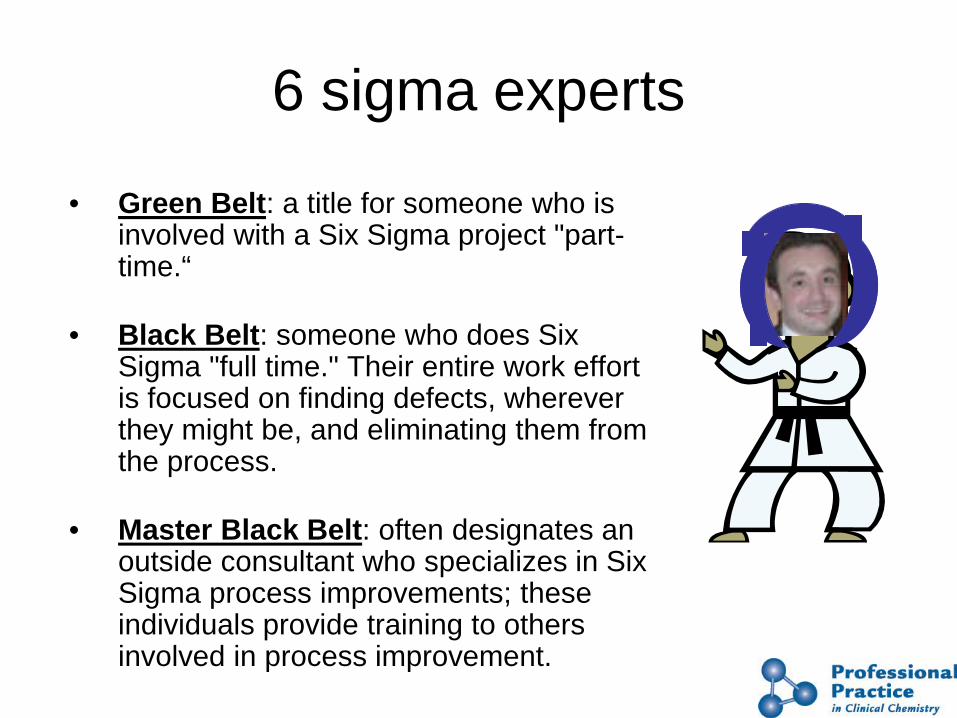
6 sigma experts
• Green Belt: a title for someone who is involved with a Six Sigma project "part-time.“
• Black Belt: someone who does Six Sigma "full time." Their entire work effort is focused on finding defects, wherever they might be, and eliminating them from the process.
• Master Black Belt: often designates an outside consultant who specializes in Six Sigma process improvements; these individuals provide training to others involved in process improvement.

Who is this Man?
James O. Westgard, Ph.D.
Visit him at: www.Westgard.com to learn more about more really cool QC stuff !!

Oswego, New York Feb. 23, 2007
The light at the end of the tunnel!

CLIA
CMS
FDA CDC
Regulatory
CLIA
CMS
FDA CDC
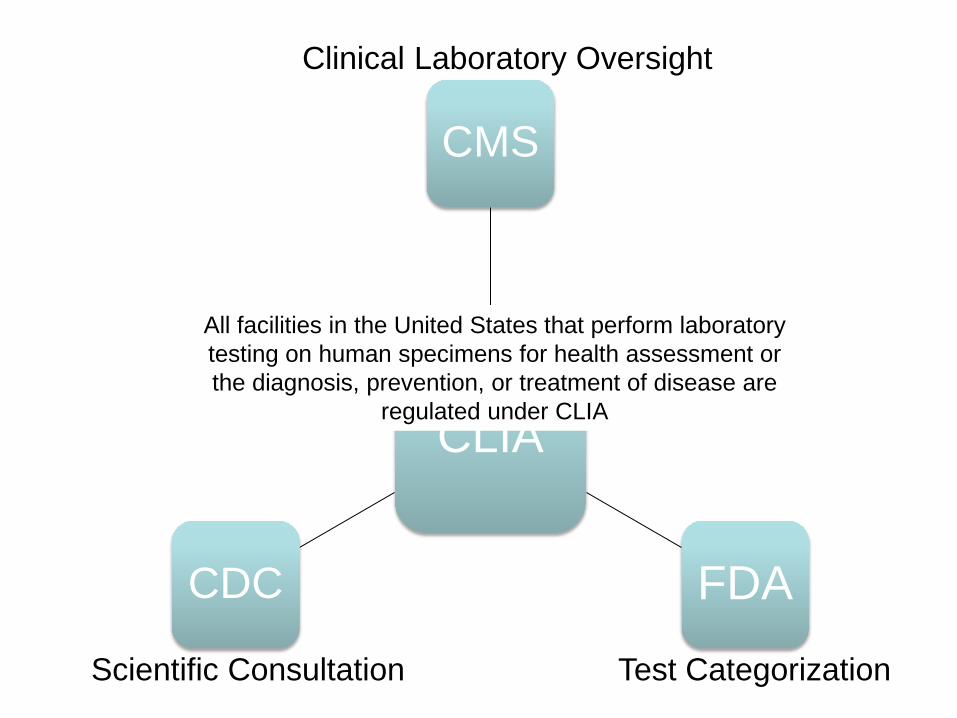
Clinical Laboratory Oversight
Test Categorization Scientific Consultation
All facilities in the United States that perform laboratory testing on human specimens for health assessment or the diagnosis, prevention, or treatment of disease are
regulated under CLIA

FDA test classification
Clinical Lab Oversight
• CMS
• Accreditation Organizations (deemed organizations)
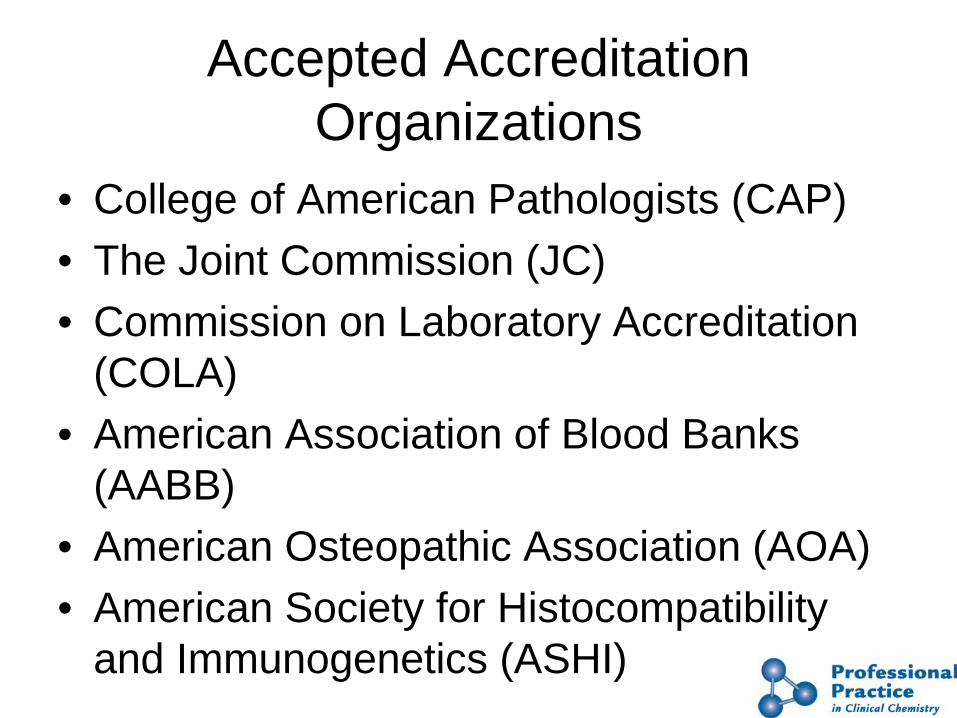
Accepted Accreditation Organizations
• College of American Pathologists (CAP) • The Joint Commission (JC) • Commission on Laboratory Accreditation
(COLA) • American Association of Blood Banks
(AABB) • American Osteopathic Association (AOA) • American Society for Histocompatibility
and Immunogenetics (ASHI)
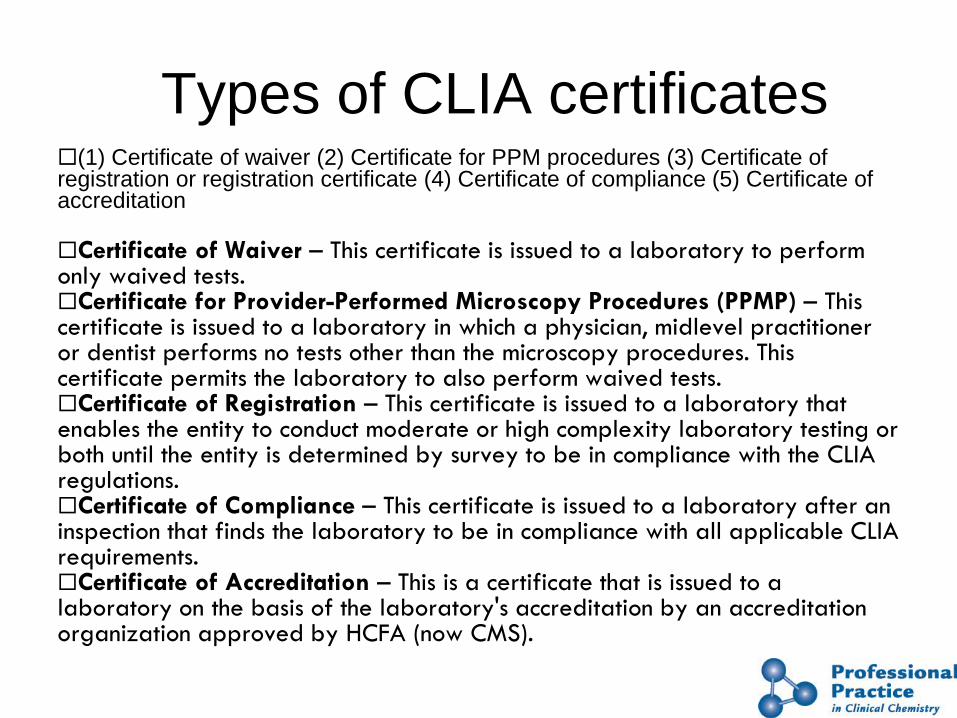
Types of CLIA certificates (1) Certificate of waiver (2) Certificate for PPM procedures (3) Certificate of registration or registration certificate (4) Certificate of compliance (5) Certificate of accreditation
Certificate of Waiver – This certificate is issued to a laboratory to perform only waived tests. Certificate for Provider-Performed Microscopy Procedures (PPMP) – This certificate is issued to a laboratory in which a physician, midlevel practitioner or dentist performs no tests other than the microscopy procedures. This certificate permits the laboratory to also perform waived tests. Certificate of Registration – This certificate is issued to a laboratory that enables the entity to conduct moderate or high complexity laboratory testing or both until the entity is determined by survey to be in compliance with the CLIA regulations. Certificate of Compliance – This certificate is issued to a laboratory after an inspection that finds the laboratory to be in compliance with all applicable CLIA requirements. Certificate of Accreditation – This is a certificate that is issued to a laboratory on the basis of the laboratory's accreditation by an accreditation organization approved by HCFA (now CMS).
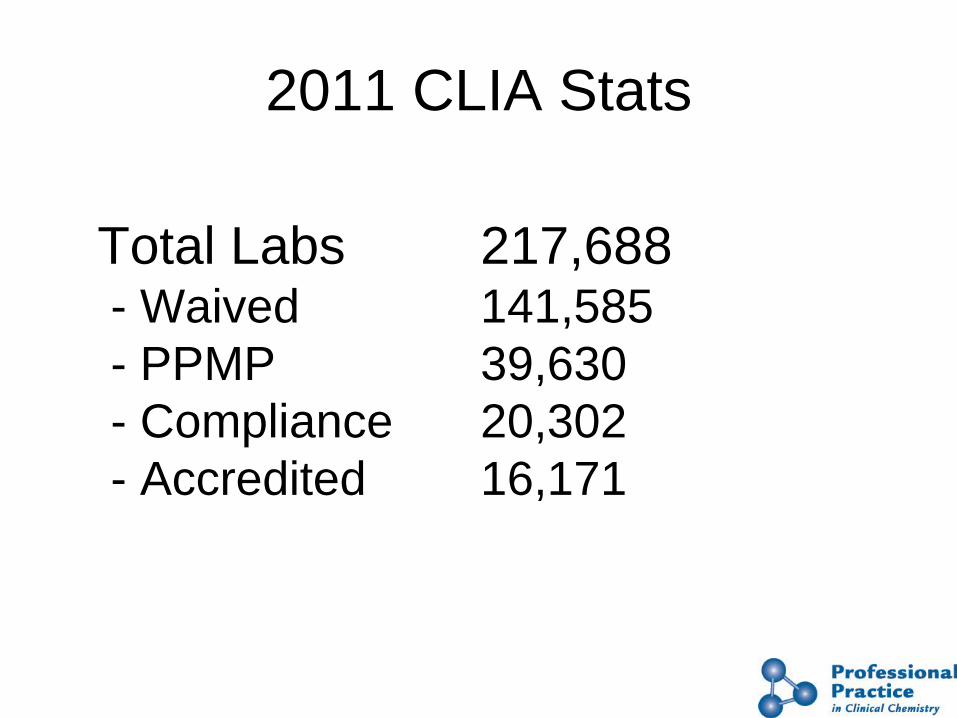
2011 CLIA Stats
Total Labs 217,688 - Waived 141,585 - PPMP 39,630 - Compliance 20,302 - Accredited 16,171
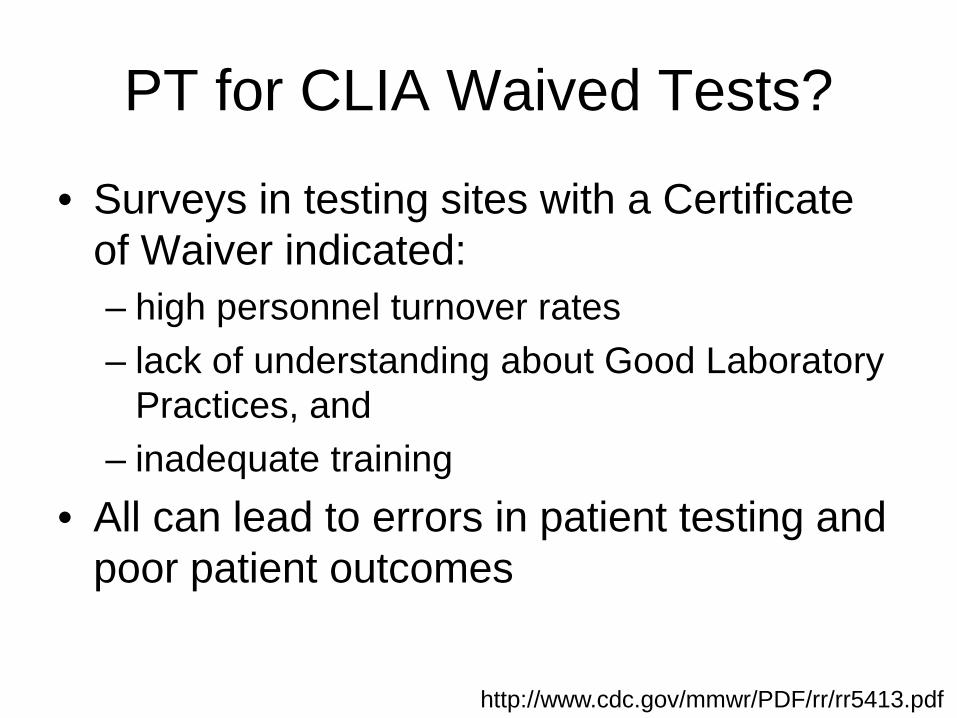
PT for CLIA Waived Tests?
• Surveys in testing sites with a Certificate of Waiver indicated: – high personnel turnover rates – lack of understanding about Good Laboratory
Practices, and – inadequate training
• All can lead to errors in patient testing and poor patient outcomes
http://www.cdc.gov/mmwr/PDF/rr/rr5413.pdf
Question
• If my lab only performs waived testing,
am I required to perform PT? PT is not required for any test that is waived.
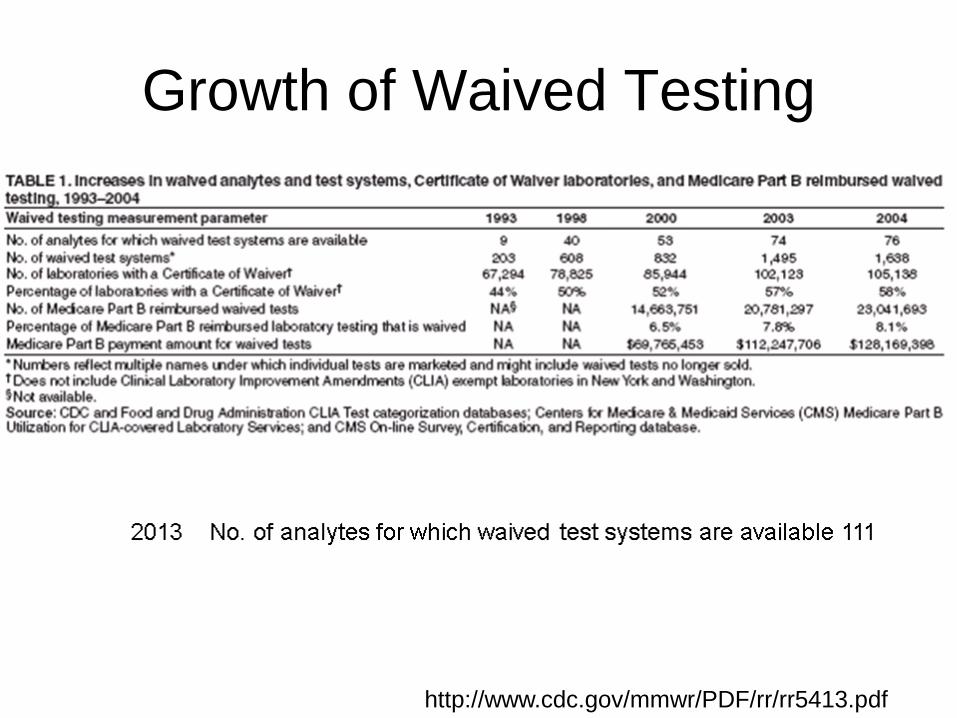
Growth of Waived Testing
http://www.cdc.gov/mmwr/PDF/rr/rr5413.pdf

Who is doing the training?
http://www.cdc.gov/mmwr/PDF/rr/rr5413.pdf
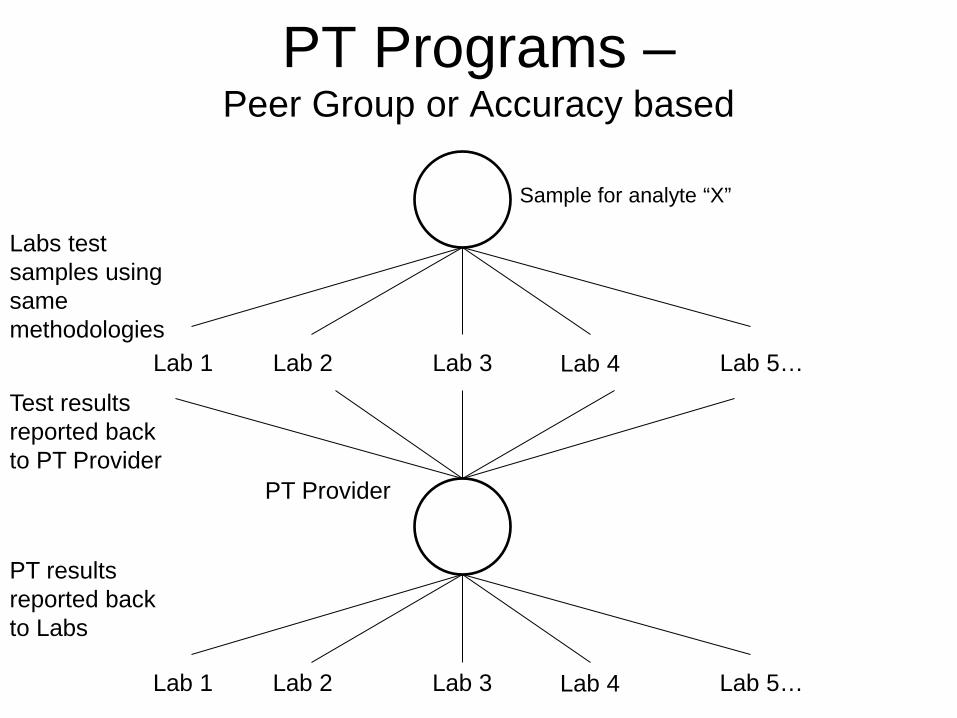
PT Programs – Peer Group or Accuracy based
PT Provider
Sample for analyte “X”
Labs test samples using same methodologies
Lab 1 Lab 2 Lab 3 Lab 4 Lab 5…
Test results reported back to PT Provider
Lab 1 Lab 2 Lab 3 Lab 4 Lab 5…
PT results reported back to Labs
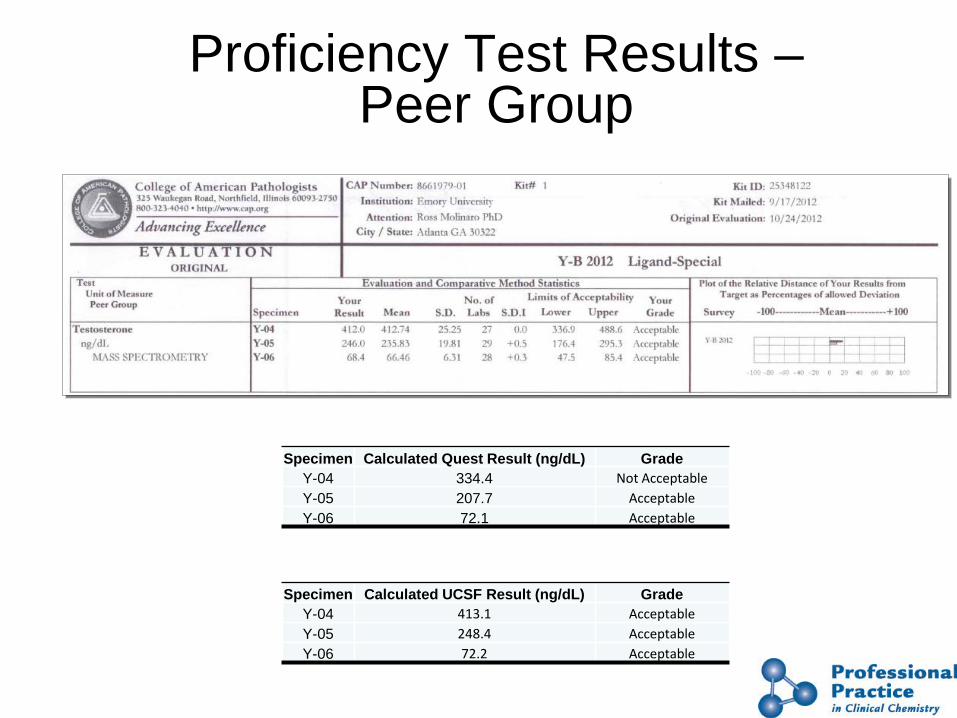
Proficiency Test Results – Peer Group
Specimen Calculated Quest Result (ng/dL) Grade Y-04 334.4 Not Acceptable Y-05 207.7 Acceptable Y-06 72.1 Acceptable
Specimen Calculated UCSF Result (ng/dL) Grade Y-04 413.1 Acceptable Y-05 248.4 Acceptable Y-06 72.2 Acceptable

Proficiency Test Results – Accuracy Based
http://www.ngsp.org/CAP/CAP12b.pdf
Question
• If I have more than one testing site, do I need to enroll in PT for each site?
PT enrollment and participation is required for each CLIA certificate
Frequency
• PT must be performed for the required tests
• Typically three sets of five specimens are sent to labs for PT each year
• For the majority of lab disciplines, satisfactory grade is ≥80% – ABO group and D (Rho)t tying is 100% – Blood bank compatibility testing is 100%

Passing PT
• If a set of 5 specimens is received, at least 4 out of the 5 must pass
• If <4 pass, the lab must achieve ≥80% acceptability on the next 2 PT surveys
• If fail again within 2 surveys, the lab’s PT is considered unsuccessful for that analyte – Increased scrutiny put on lab – Investigation
CLIA Performance Measures Proficiency Testing (PT)
• Laboratories conducting moderate and/or high complexity testing are required to participate in PT for certain tests they perform
• PT is also educational and involves sending samples with results unknown to the laboratory, three times per year to evaluate whether the laboratory’s results are accurate and compare to its peers. The CLIA regulation requires that the PT samples be tested in the same manner and by the same individuals as patient testing. PT samples are provided by private non-profit organizations, Federal, or State agencies. PT programs undergo an annual and ongoing regulatory review conducted by CMS.

Question
• How do I verify the accuracy of the tests that do not have PT required?
One way to check the accuracy of testing: – Split a patient’s specimen (NEVER SPLIT A PT SAMPLE) with
another laboratory that offers the same test(s). Review your results and the other laboratory’s results for acceptability.
Self Assessment Questions
1. Reproducible inaccuracies that are consistently in the same direction define which of the following?
a) Systematic error b) Imprecision c) Random error d) Dissociative statistics

2. Which of the following is true regarding Sigma metrics?
a) All parameters in the equation should be of different units
b) With a Sigma < 3.0, your method is considered performing at 3.4 defects per million opportunities
c) Sigma has no units d) None of the above
3. All facilities in the United States that perform laboratory testing on human specimens for health assessment or the diagnosis, prevention, or treatment of disease are regulated under which of the following?
a) Food and Drug Administration b) College of American Pathology c) Clinical Laboratory Improvements
Amendment d) Centers for Disease Control and Prevention
4. The satisfactory grade for proficiency testing in the clinical laboratory is always at least:
a) 100% b) 50% c) 25% d) None of the above