Embed Size (px)
Citation preview

Quality Control in Refractive Surgery
Stefan Pieger*, M.Sc.
Wendelstein, Germany
* Ingenieurbüro Pieger GmbH
Nidek Germany Office

Introduction
Personal experience as application specialist for refractive excimer lasers since 1987. (Meditec, Schwind, Nidek)
Progress in PRK&LASIK was usually based on outcomes analysis.
Excimer Laser Surgery and refractive surgery in general well suited for a systematic approach on quality control.
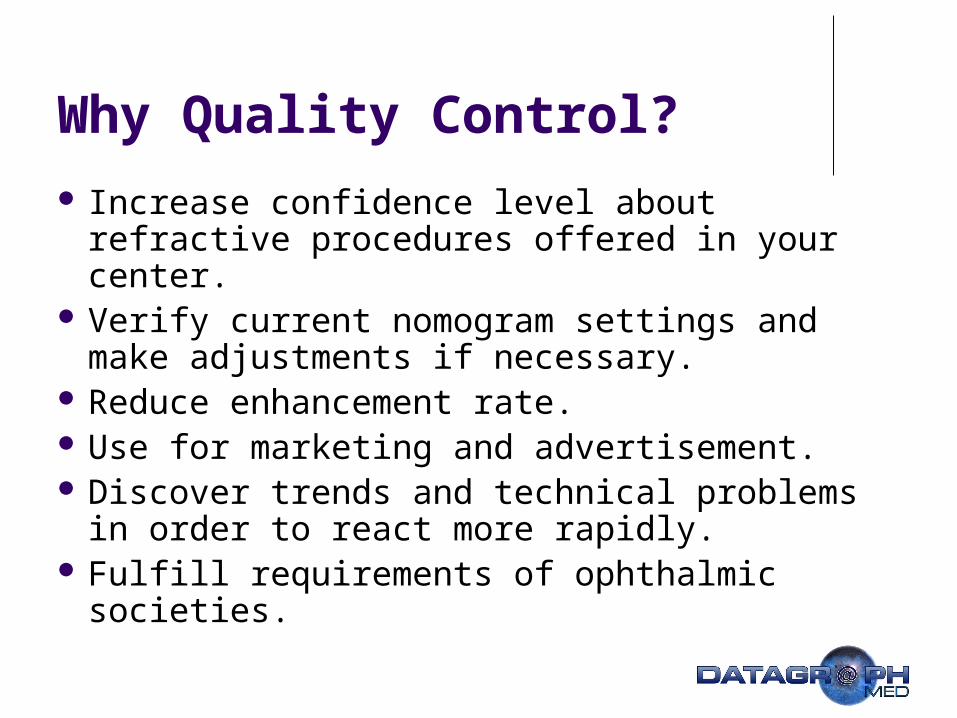
Why Quality Control?
Increase confidence level about refractive procedures offered in your center.
Verify current nomogram settings and make adjustments if necessary.
Reduce enhancement rate. Use for marketing and advertisement. Discover trends and technical problems in
order to react more rapidly. Fulfill requirements of ophthalmic societies.

How to collect your data?
Patients files
Excel Spread Sheet
Database Software (Access; Filemaker; etc.)
Outcomes Analysis Software (Datagraph; ASSORT; Refr. Consultant; etc.)

How to analyze refractive data?
Standard Refractive Outcomes Stability / Safety / Predictability / Efficacy
Additional Outcome Parameters Astigmatism Outcomes: Surgically Induced change in
Cylinder (SIA); Double Angle Scatter Plot Defocus Equivalent / Contrast Sensitivity in mesopic
conditions / pre OP BSCVA vs. post OP UCVA Wavefront Based Outcomes
Defocus + Cyl (‘aberrometer refraction’) Higher Order RMS / Spherical Aberration (Z12) / Coma /
Trefoil

Standard Refractive Outcomes: Safety
1% 0% 2% 0%
22%
13%
54%57%
19%25%
2% 3%0% 0%
0%
10%
20%
30%
40%
50%
60%
70%
80%
90%
100%
lost > 2 lost 2 lost 1 unchanged gained 1 gained 2 gained > 2
2. SAFETY: Change in BSCVA - Percent
1 (770)
3 (653)
month (eyes)
Follow up time interval
Number of eyes per Follow up visit.
2 or more lines lost 3 % at 1 m post OP

Standard Refractive Outcomes: Efficacy
4%6%
18%
26%
46%40%
14%14%10%
7%3%4% 5%3%
0%
10%
20%
30%
40%
50%
60%
70%
80%
90%
100%
20/12 orbetter
20/15 20/20 20/25 20/30 20/40 20/50 orworse
4. EFFICACY: UCVA - Percent
1 m (691)
3 m (562)
month (eyes)
Follow up time interval
Number of eyes per Follow up visit.
72% 20/20 or better 3 month post Op

Standard Refractive Outcomes: Stability (SEQ)
1. STABILITY: Achieved Change in Refr. over Time
-0,22-0,18-0,20-0,15
-4,70
1189 744 662 42 25-8,00
-7,00
-6,00
-5,00
-4,00
-3,00
-2,00
-1,00
0,00
1,00
pre OP 1 m 3 m 6 m 12 m± 1 StDev
Follow up time interval
Mean value of SEQ
Number of eyes per Follow up visit.

Standard Refractive Outcomes: Predictability (SEQ)
PREDICTABILITY: Attempted vs Achieved (Scatter) 744 eyes
y = -0.00x2 + 0.94x + 0.21
0
1
2
3
4
5
6
7
8
9
10
11
12
13
14
15
0 1 2 3 4 5 6 7 8 9 10 11 12 13 14 15
Attempted delta SR equiv. [D]Da
tag
rap
h
Achieved [D]
overcorrected
undercorrected
Number of eyes at follow up
±1 D ‘happiness’ Zone
Trend line
y = -0.00x2 + 0.94x + 0.21Regression Formula: ‘Achieved = 0.94*Attempted’(~6% undercorrection)

Astigmatism Outcomes:SIA (based on Vector Analysis)
Attempted Cyl vs SIA (Scatter) 3 month postOP 490 eyes
y = -0.00x2 + 0.90x + 0.04
0
1
2
3
4
5
6
7
0 1 2 3 4 5 6 7
Attempted Cyl [D]
Da
tag
rap
h
Achieved [D]
overcorrected
undercorrected
y = 0.90 * x(~10% undercorrection)
-2/-1@180°
0/-0.5@90°(-0.5/+0.5@180°)
0.5 D CylOvercorrection!
0/-0.5@180°
0.5 D CylUndercorrection!

Astigmatism Outcomes:Double Angle Scatter Plot
Double Angle Scatter Plot 3 m postOP 491 eyes
-5
-4
-3
-2
-1
-0
-1
-2
-3
-4
-5
-5 -4 -3 -2 -1 -0 -1 -2 -3 -4 -5
Mean Cyl 0,07 @ 14,4°
Datagraph
0°
45°
90°
135°
Double Angle Scatter Plot 918 eyes
-5
-4
-3
-2
-1
-0
-1
-2
-3
-4
-5
-5 -4 -3 -2 -1 -0 -1 -2 -3 -4 -5
Mean Cyl 0,46 @ 179,6°
Datagraph
0°
45°
90°
135°
PreOP Cyl & Axis PostOP Cyl & Axis

Additional Outcomes:pre OP BSCVA vs. post OP UCVA
7%
1%
39%34%
79%
96%91%
98% 95%99%
98%100%
99%100%
1%0%0%
10%
20%
30%
40%
50%
60%
70%
80%
90%
100%
'20/10' 20/12 orbetter
20/15 orbetter
20/20 orbetter
20/25 orbetter
20/30 orbetter
20/40 orbetter
20/50 orbetter
20/60 orworse
preOP BSCVA vs. postOP UCVA - Percent
3 m (397)
preSCVA (703)
month (eyes)

Additional Outcomes:Defocus Equivalent
60%64%
86%88%
99%99% 100%100% 100%100% 100%100%
0%
10%
20%
30%
40%
50%
60%
70%
80%
90%
100%
<=0,5D <=1D <=2D <=3D <=4D <=5D
DEFOCUS EQUIVALENT - Percent
1 m (615)
3 m (554)
month (eyes)
SEQ =
SPH + ½ CYL
DEQ =
|SEQ|+|½ CYL|

72%76%
92% 92%
99% 99% 100%100%
0%
10%
20%
30%
40%
50%
60%
70%
80%
90%
100%
+- 0,5 +- 1,0 +- 2,0 +- 3,0
Refractive outcome - % within | Attempted | 1 m (744) 3 m (662)
Defocus Equivalent vs. Refractive Outcome
60%64%
86% 88%
99% 99% 100%100%
0%
10%
20%
30%
40%
50%
60%
70%
80%
90%
100%
<=0,5D <=1D <=2D <=3D
DEFOCUS EQUIVALENT - Percent
1 m (615)
3 m (554)
-5.0/+10.0@90°SEQ PlanoDEQ +5
DEQ ~ ‚Blur Circle‘

Additional Outcomes:Mesopic Contrast Sensitivity
Contrast Sensitivity Mesopic
1,63
1,88
1,57
1,21
1,68
1,92
1,61
1,22
0,40
0,60
0,80
1,00
1,20
1,40
1,60
1,80
2,00
2,20
A (3cpd) B (6cpd) C (12cpd) D (18cpd)
pre op (112)
1 m (72)
month (eyes)
Spatial Frequency [cycles/degree]
Normal Population Range (Vector Vision CSV 1000)
VA in LogMar Scale

Wavefront based Outcomes – 2ndOrder / Coma / Trefoil
„Work in progress“ ! Using Aberrometer Refraction rather
than Manifest Refraction? Presenting horizontal and vertical
Coma individually? Vector calculation to present magnitude and axis in [D]! (0.5 D Coma @ 230°)
Trefoil: Axis? Present only magnitude?
ff
f f

Wavefront based Outcomes – Higher Order RMS [µm ±StDev]
RMS higher order over time
0.540.540.510.53
0.31
52 26 29 11 30.00
0.10
0.20
0.30
0.40
0.50
0.60
0.70
0.80
0.90
pre OP 1 m 3 m 6 m 9 m
Pupil Diameter: 6.0 mm

Wavefront based Outcomes – Spherical Aberration [µm] or [D]
Spherical Aberration (Z12) over time [µm]
-0,24-0,25
-0,23
-0,03
18 13 11 6-0,40
-0,35
-0,30
-0,25
-0,20
-0,15
-0,10
-0,05
0,00
0,05
0,10
pre OP 1 m 3 m 9 m
Spherical Aberration (Z12) DEQ over time [D]
1,521,421,361,31
0,41
18 13 11 7 60,00
0,50
1,00
1,50
2,00
2,50
3,00
pre OP 1 m 3 m 6 m 9 m
Dat
agra
ph
Pupil Diameter: 6.0 mm

Making Outcome-based Nomogram Adjustments
Comparison of Laser Settings vs. Achieved change in refraction (and not Attempted vs. Achieved).
Reduce random errors as far as possible as nomograms can only compensate systematic errors!
Must be specific for major laser parameters like OZ, TZ, ablation profile type as well as for refraction types.

Nomograms for Individual Patient Groups
Data must be filtered on certain parameters: Refraction Type
(Myp/MyoAsti/Hyp/HypAsti…) Surgery Type (PRK; LASIK; LASEK;
Custom…) Optical Zone Diameter Others (age, laser software version;
humidity…)

Nomogram Improvements – Laser Settings vs. Achieved
Laser Settings vs Achieved 1166 eyes
y = -0,01x2 + 1,22x - 0,08
0
1
2
3
4
5
6
7
8
9
10
11
12
13
14
15
0 1 2 3 4 5 6 7 8 9 10 11 12 13 14 15
Laser setting [D]
Da
tag
rap
h
Achieved [D]
overcorrected
undercorrected
y = -0,01x2 + 1,22x - 0,08
reduce attempted SEQ by 22%!

Laser Settings vs Achieved 1166 eyes
y = -0,01x2 + 1,22x - 0,08
0
1
2
3
4
5
6
7
8
9
10
11
12
13
14
15
0 1 2 3 4 5 6 7 8 9 10 11 12 13 14 15
Laser setting [D]
Da
tag
rap
h
Achieved [D]
overcorrected
undercorrected
Identify and exclude outliers

Laser Setting CYL vs. Surgical Induced change in Astigmatism
Laser Setting (cyl) vs SIA 1480 eyes
y = 0.03x2 + 0.60x + 0.26
0
1
2
3
4
5
6
7
0 1 2 3 4 5 6 7
LaserSetCyl [D]
Da
tag
rap
h
Achieved [D]
overcorrected
undercorrected
1. High Scatter! (further analysis necessary!)
2. 40 % systematic undercorrection

Nomograms: General Comments
1. Reduce Scatter by Standardized Surgery and OR Environment
2. Exclude Outliers from Data Analysis
3. Exclude Enhancements
4. Choose appropriate follow up interval (≥ 3 m)
5. Create Formula („-10%“) / Lookup Table or use Nomogram Software

Summary
Improving the results of refractive surgery procedures must be based on an individual quality control system.
Nomograms can compensate for systematic errors, but not for random errors.
Modern outcomes analysis software allows constant monitoring of your results.
Conventional Outcomes will be extended by HO-RMS, Spherical Aberration and Coma.

Thank You!
www.datagraph-med.com


![OVERVIEW OF FIRST WENDELSTEIN 7-X HIGH-PERFORMANCE ... · After successful first operation [1] in 2015, the optimized stellarator device Wendelstein 7-X [2, 3] is now running with](https://img.pdfslide.net/doc/110x75/601b42e52ce30b167b4cfd1f/overview-of-first-wendelstein-7-x-high-performance-after-successful-first-operation.jpg)


![Nidek manual[1]](https://img.pdfslide.net/doc/110x75/55a258f11a28ab5f4f8b4850/nidek-manual1.jpg)