Embed Size (px)
Citation preview

Quality control monitoring for WFCAM
Marco RielloCASU - Cambridge, UK
ESO Calibration Workshop - January 2007
Talk outline
WFCAM overview
WFCAM operations at CASU
Quality control
Mauna Kea NIR sky
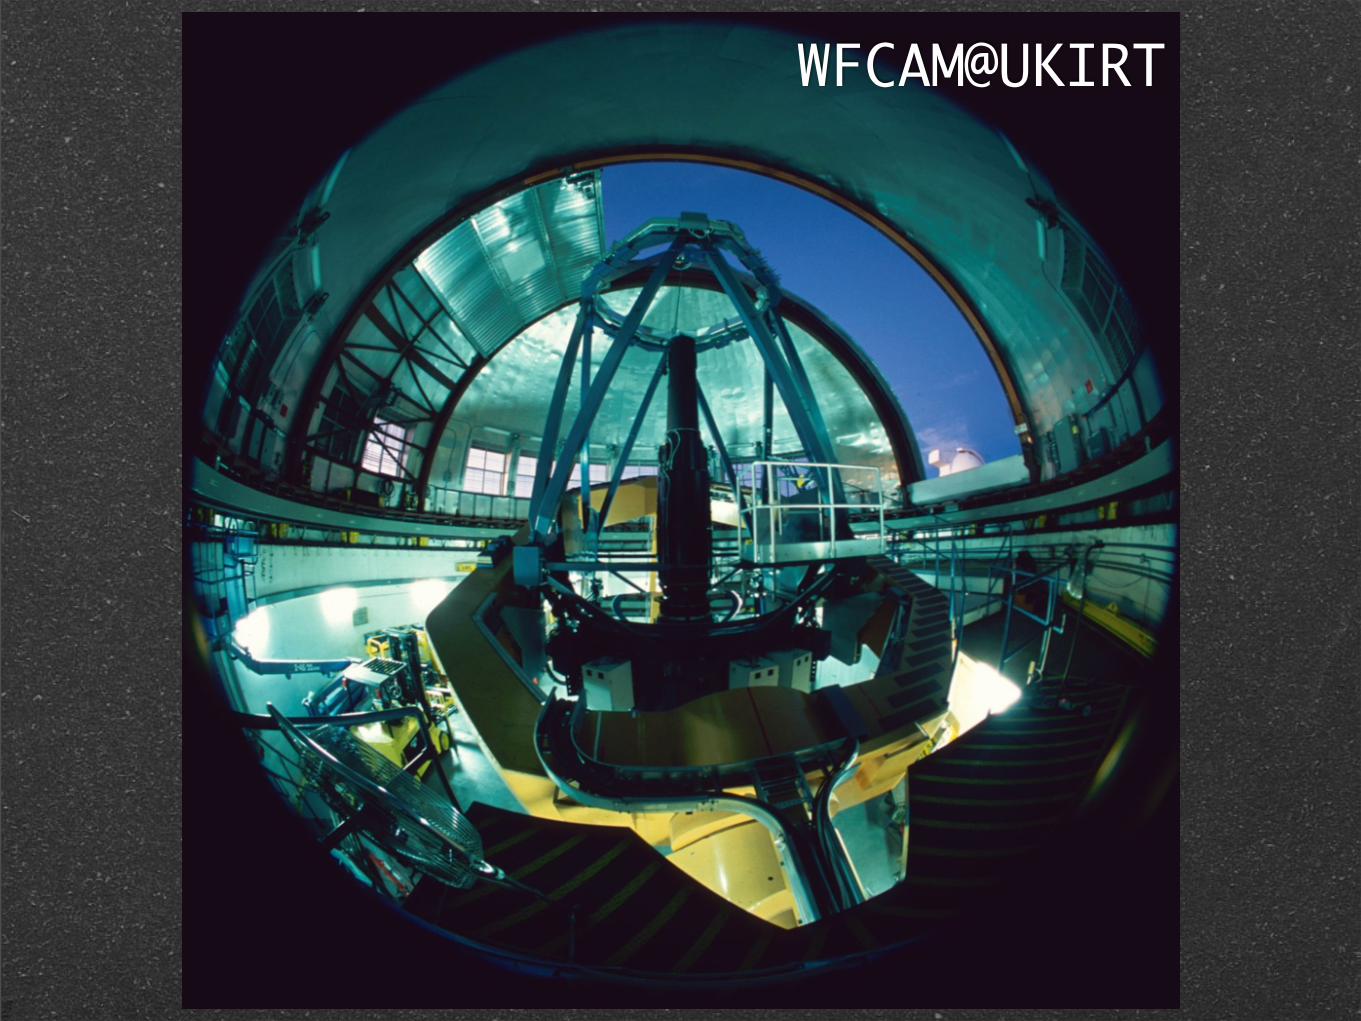
WFCAM@UKIRT
y
x
y
x
x
y
x
y
3 4
2
12.83’
13.65’
12.83’
13.65’
4.25’
8.7’
28.0’
N
EAG
26.48’
1
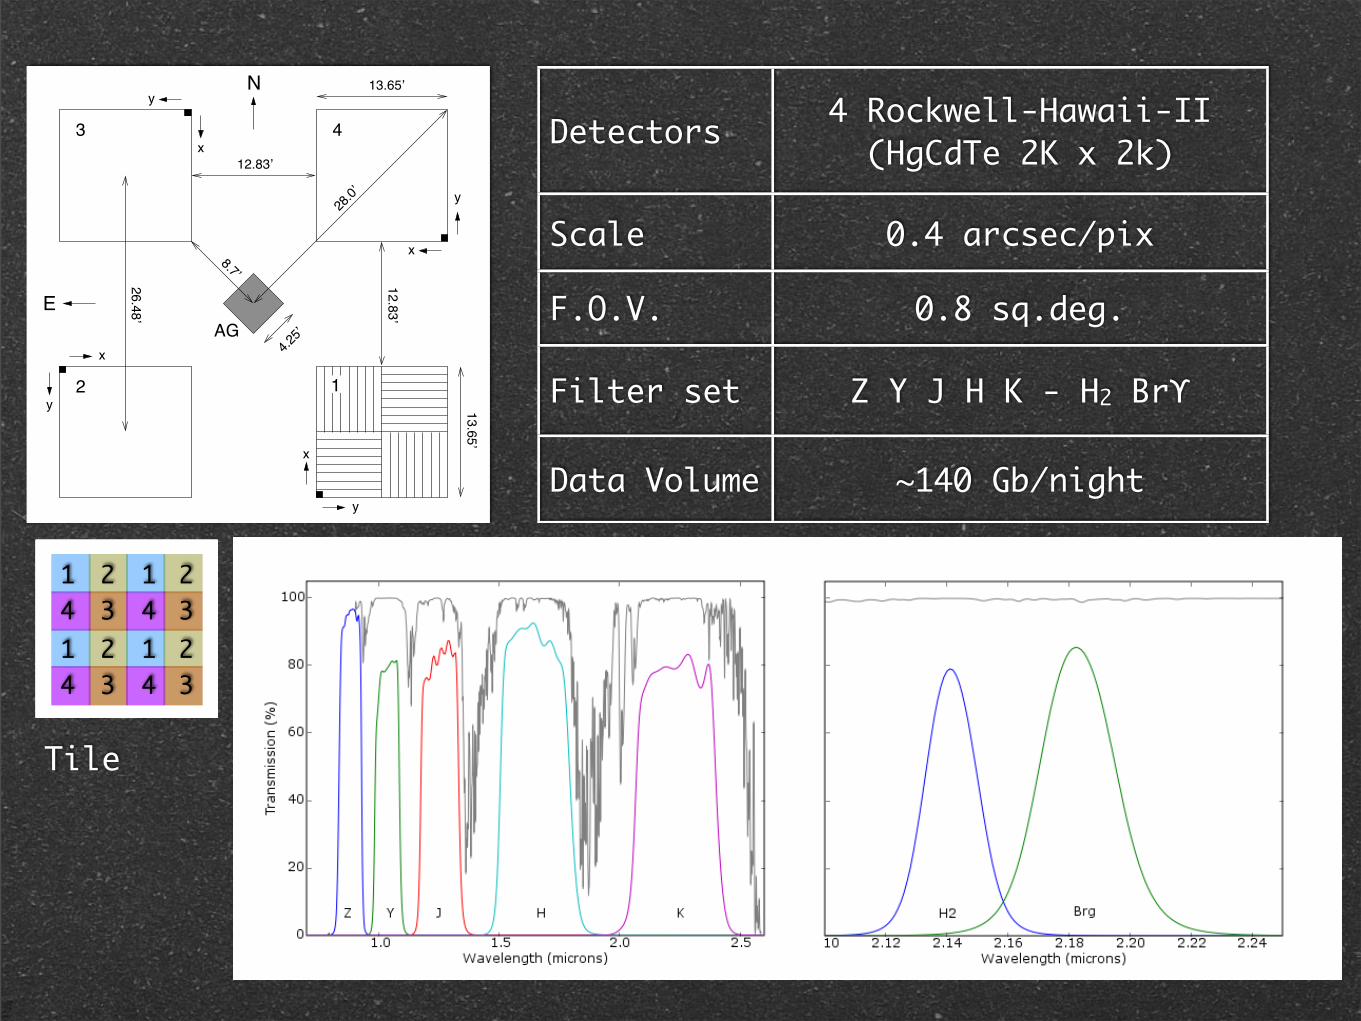
Detectors 4 Rockwell-Hawaii-II(HgCdTe 2K x 2k)
Scale 0.4 arcsec/pix
F.O.V. 0.8 sq.deg.
Filter set Z Y J H K - H2 Brϒ
Data Volume ~140 Gb/night
Tile
1
1 1
1 2
22
23
3
3
34
4
4
4

Data FlowWFCAM pipeline processing 3
PC cluster
!"#$
Data
Products
Server
Ultrium tape
system
tapes
from
JAC
raw
archive
Figure 1. A schematic of the data processing setup for WFCAM in Cambridge. Incoming tapes are ingested, the data verified, convertedto MEF format and fed to the processing cluster. A raw data archive is held on-line, whilst processed products are automaticallytransferred via the internet to the Wide Field Astronomy Unit (WFAU) in Edinburgh
!100 Tbytes of physical disk space and is via a mix of sep-arate disk-server RAID5 systems and optical fiber-channelRAID5/6 arrays, all interconnected on separate G-bit back-bones. As noted earlier, CASU store all image data, rawand processed, using lossless Rice compression which givesa factor 3-5 saving on disk space requirements.
Usually 8 nights are processed independently in paral-lel on 4 of the PCs. The processing time for a single nightvaries significantly, but generally depends on the averagenumber of detected objects per field (i.e. crowded regionsof the Galactic plane take longer) and the observing mode(interleaving and/or stacking). For an average night the to-tal processing time is of order !30 hours, but it can easilydouble, when for instance most of the data come from theUKIDSS Galactic Plane Survey (GPS) or Galactic ClusterSurvey (GCS) that are observing in highly crowded regions.
The overall data processing strategy attempts to min-imise the use of on-sky science data to form “calibration”images for removing the instrumental signature. By doingthis we also minimise the creation of data-related artefactsintroduced in the image processing phase. To help achievethis we make extensive use of twilight flats, rather than dark-sky flats (which potentially can be corrupted by thermalglow, fringing, large objects and so on) and by attemptingto decouple, insofar as is possible, sky estimation/correctionfrom the science images.
When the processing of a night is completed, variousvalidation checks are made, e.g. were all processing stepscarried out for each science file, are all calibration framesincluding sky frames present and so on ? If these are satis-factory the image data products plus confidence maps arecompressed for final storage and the quality information isingested in a local Data Quality Control (DQC) database(see section 6). The ingestion process provides further checkson the presence of essential keywords and is a very powerful
way to spot obvious problems that may have occurred dur-ing processing. When the validation process is completed,the data is flagged as “ready to be transferred” to the WF-CAM Science Archive (WSA) in Edinburgh (Hambly et al.2006). The data transfer rate to Edinburgh can sustain "10Mbyte/s which can readily keep up with the processed (com-pressed) data volume.
3 IMAGE PROCESSING
The processing pipeline can deal with compressed or un-compressed data in a transparent way because the I/O ismanaged through the CFITSIO library. However, since sev-eral I/O operations are required for each data frame, it ismore e!cient to uncompress images on-the-fly before pro-cessing commences, and then compress the final product forlong-term storage.
Each night of data is pipeline processed independentlyusing master calibration twilight flats (updated at leastmonthly) and a series of nightly generated dark frames cov-ering the range of exposure times and readout modes usedduring that night. A running sky “average” in each passbandis used for sky artefact correction. After removing the ba-sic instrumental signature the pipeline then uses the headercontrol keywords to produce interleaved and/or combined(stacked) image frames for further analysis. This includesgeneration of detected object catalogues, and astrometricand photometric calibration based on 2MASS (Skrutskie etal. 2006).
For orientation an overview of all the stages in thepipeline is shown in figure 2. In what follows we outlinethe general arithmetic operations required to remove the in-strumental signature and then discuss the actual pipelineoperations devised to deal with WFCAM data in more de-tail.
c! 2006 RAS, MNRAS 000, 1–26
UKIDSS

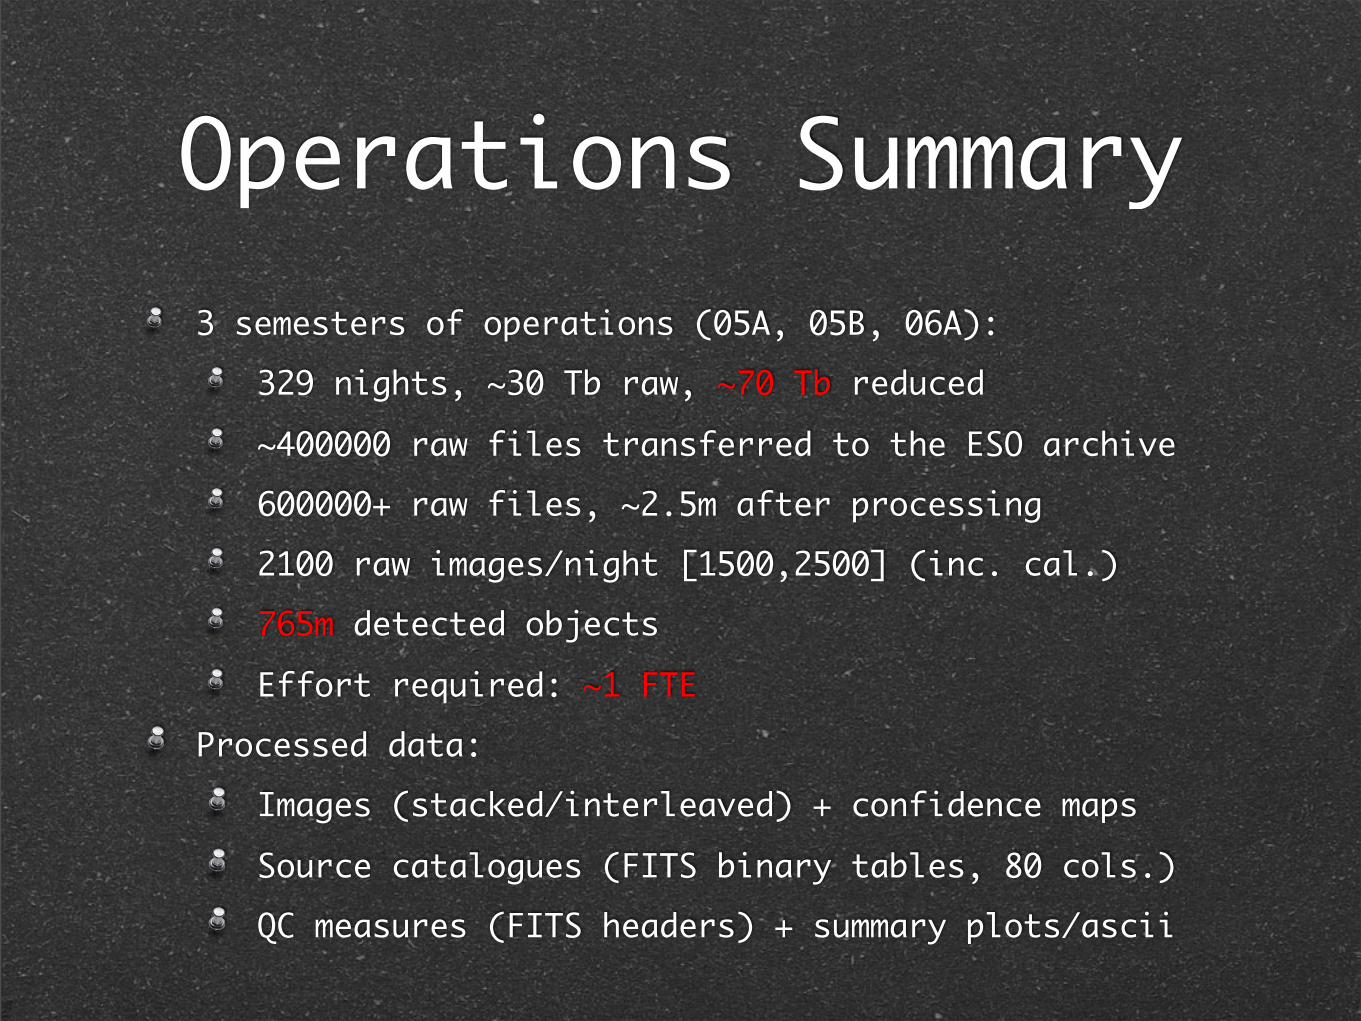
Operations Summary
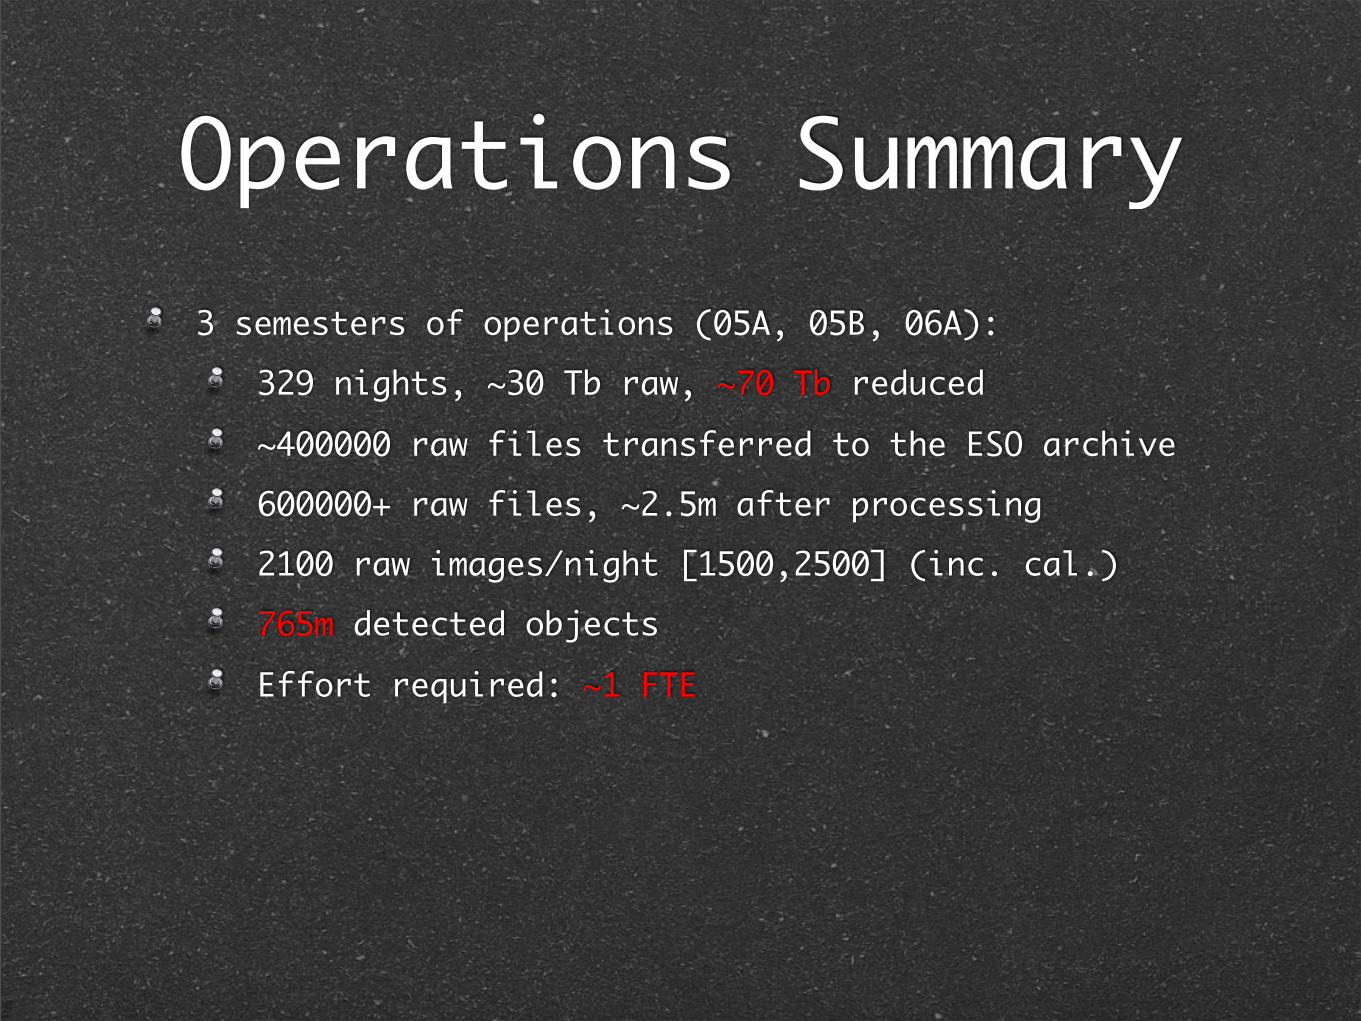
3 semesters of operations (05A, 05B, 06A):329 nights, ~30 Tb raw, ~70 Tb reduced~400000 raw files transferred to the ESO archive600000+ raw files, ~2.5m after processing2100 raw images/night [1500,2500] (inc. cal.)765m detected objectsEffort required: ~1 FTE
Operations Summary
3 semesters of operations (05A, 05B, 06A):329 nights, ~30 Tb raw, ~70 Tb reduced~400000 raw files transferred to the ESO archive600000+ raw files, ~2.5m after processing2100 raw images/night [1500,2500] (inc. cal.)765m detected objectsEffort required: ~1 FTE
Processed data:Images (stacked/interleaved) + confidence mapsSource catalogues (FITS binary tables, 80 cols.)QC measures (FITS headers) + summary plots/ascii
Operations Summary
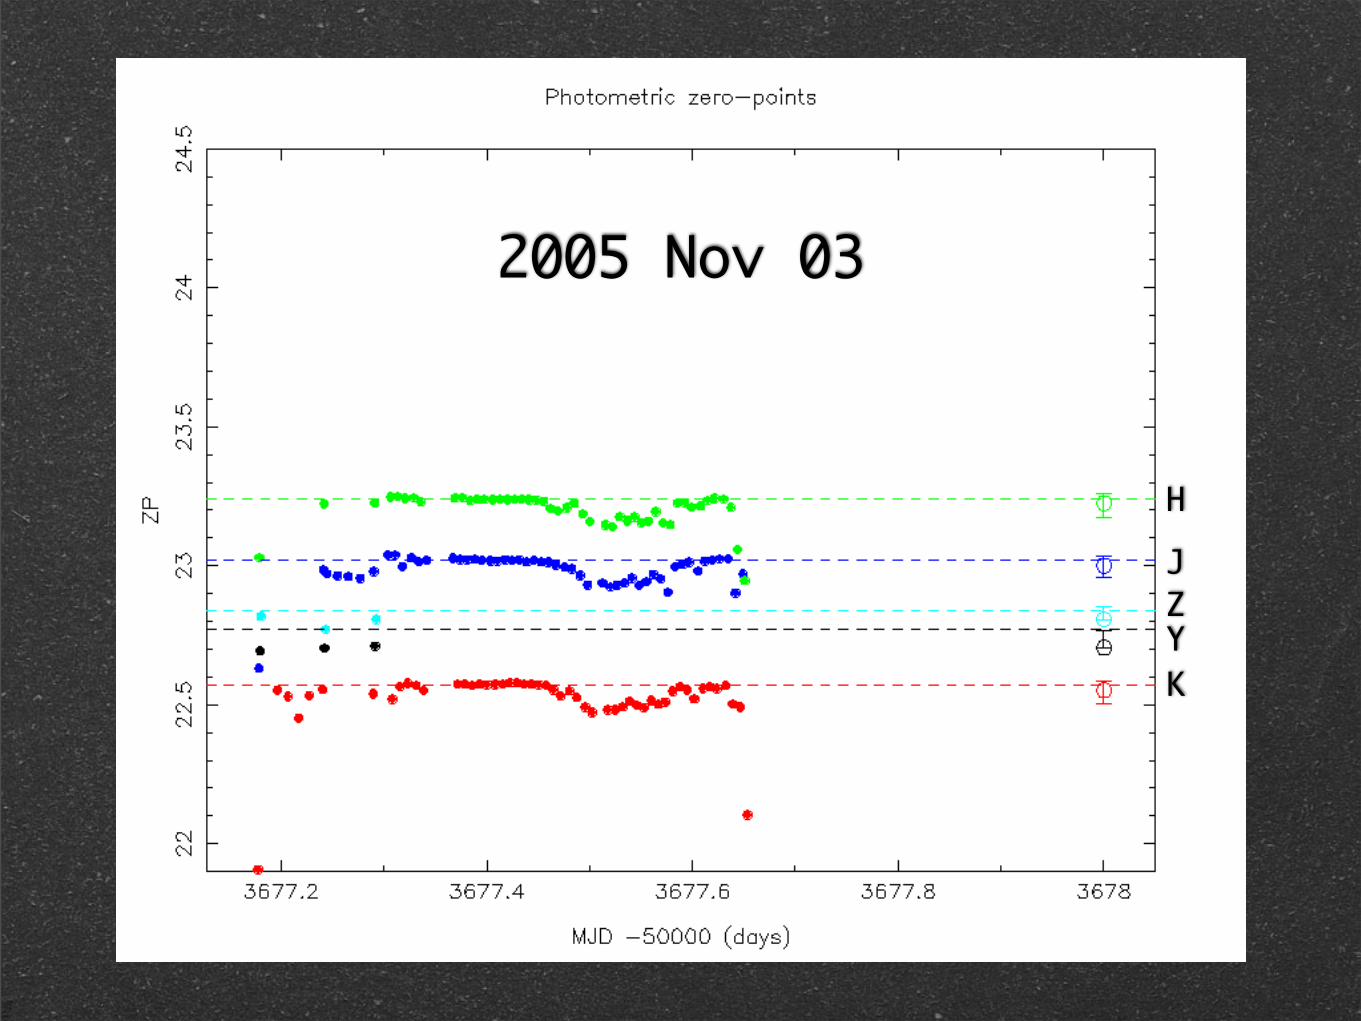
J
H
KYZ
2005 Nov 03

Attenuation (SkyProbe@CFHT)
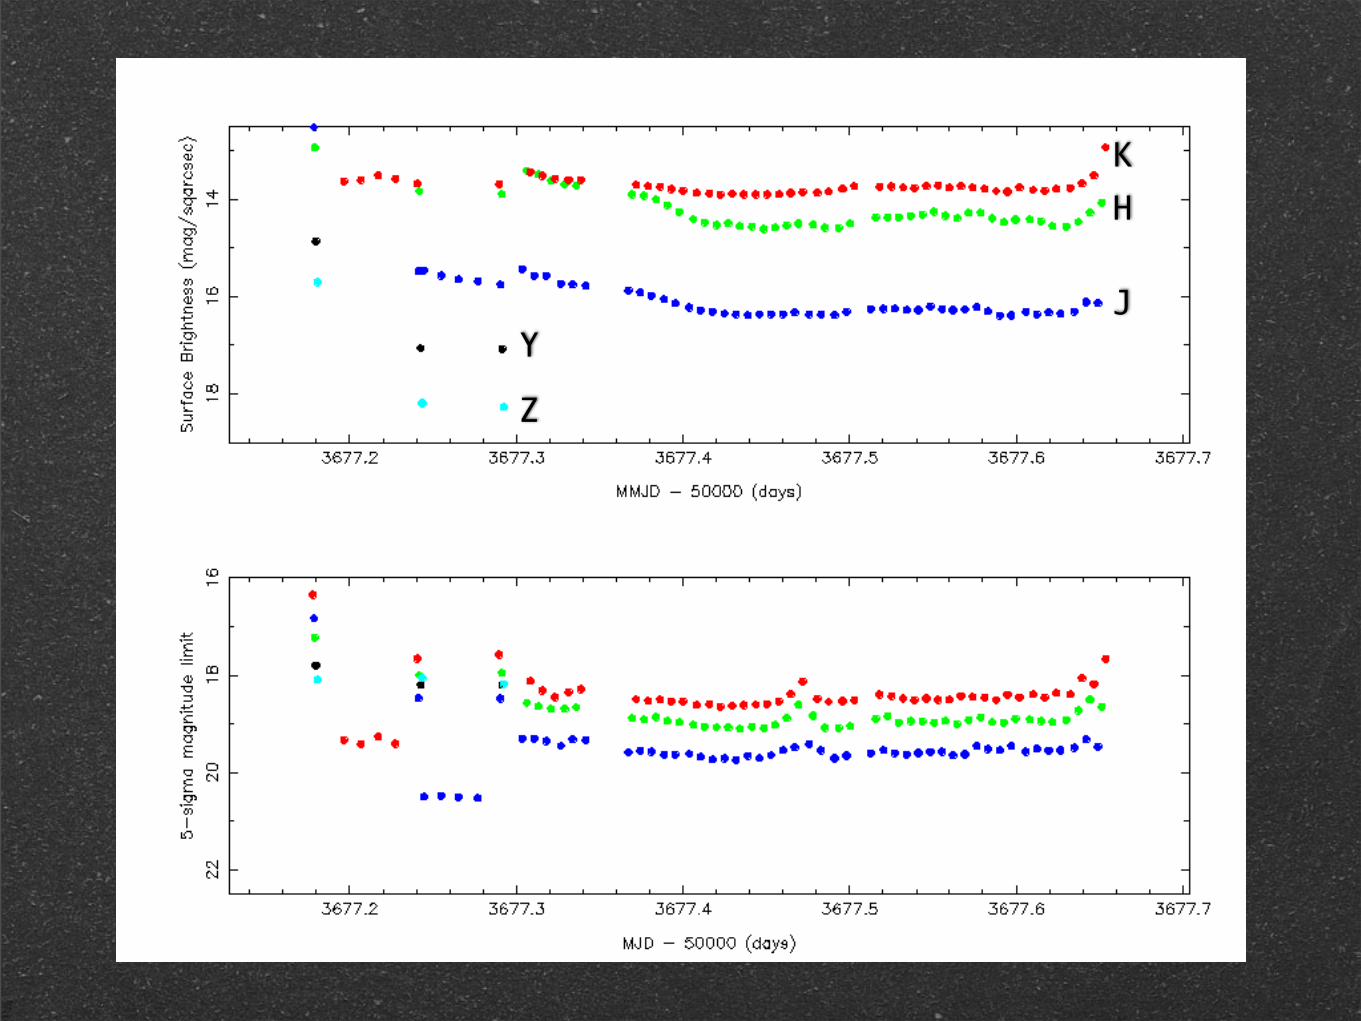
J
HK
Y
Z

Chips colour codes: #1 #2 #3 #4

PostgreSQL Database
Normalised, Materialised Views
Ingestion layer validates data
Only image metadata not the catalogues

PostgreSQL Database
Normalised, Materialised Views
Ingestion layer validates data
Only image metadata not the catalogues
Feeding/allowing:
Internal data management
Data processing status (night basis)
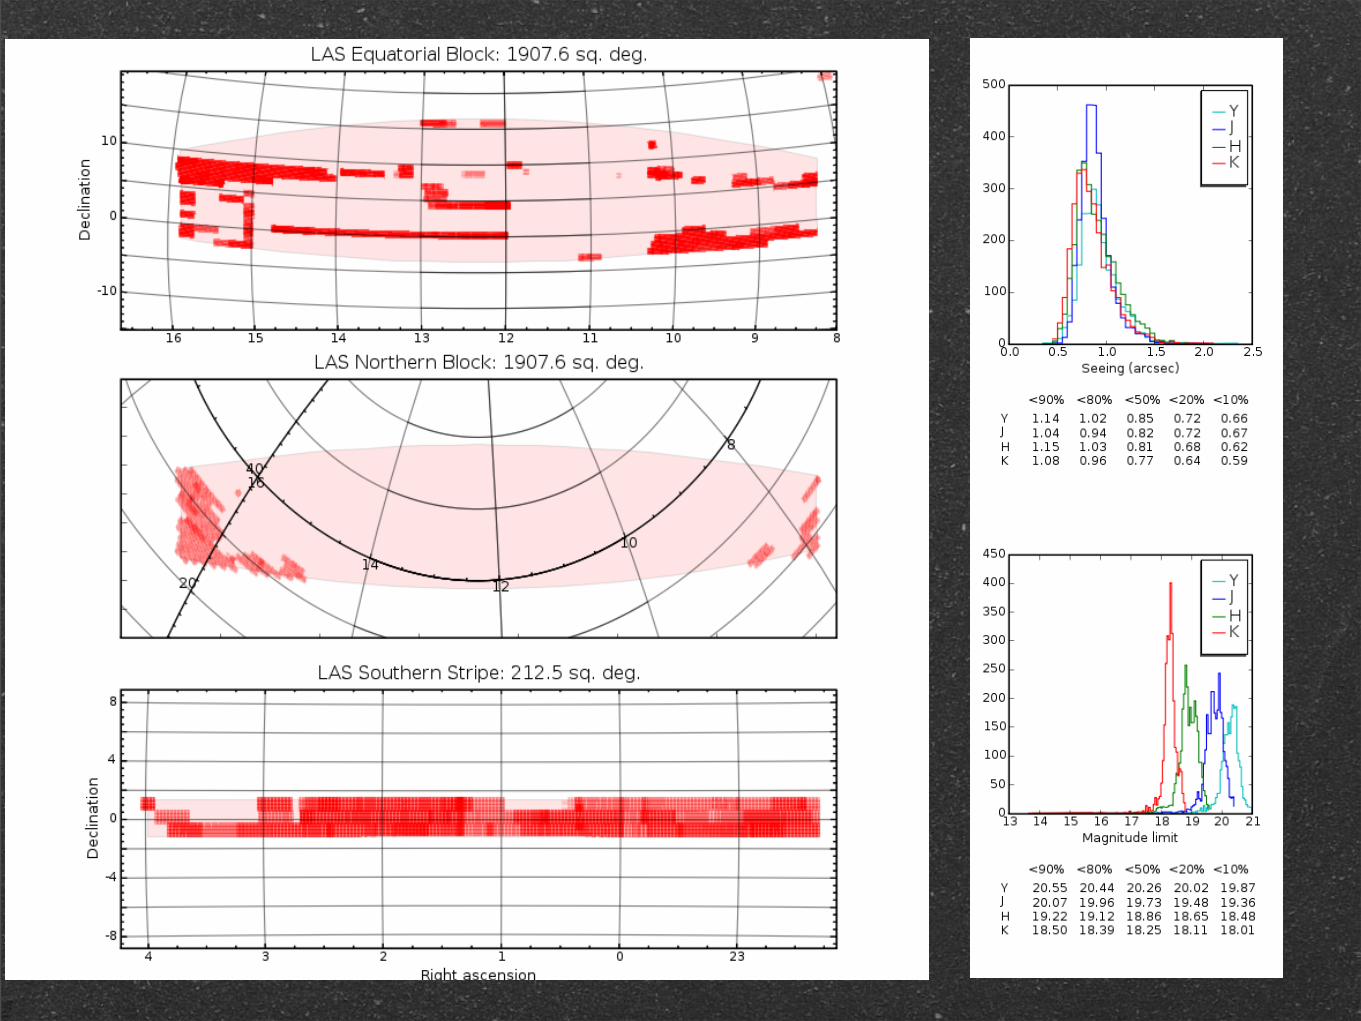
UKIDSS Survey progress
Feedback on survey efficiency/statistics
Sky brightness analysis
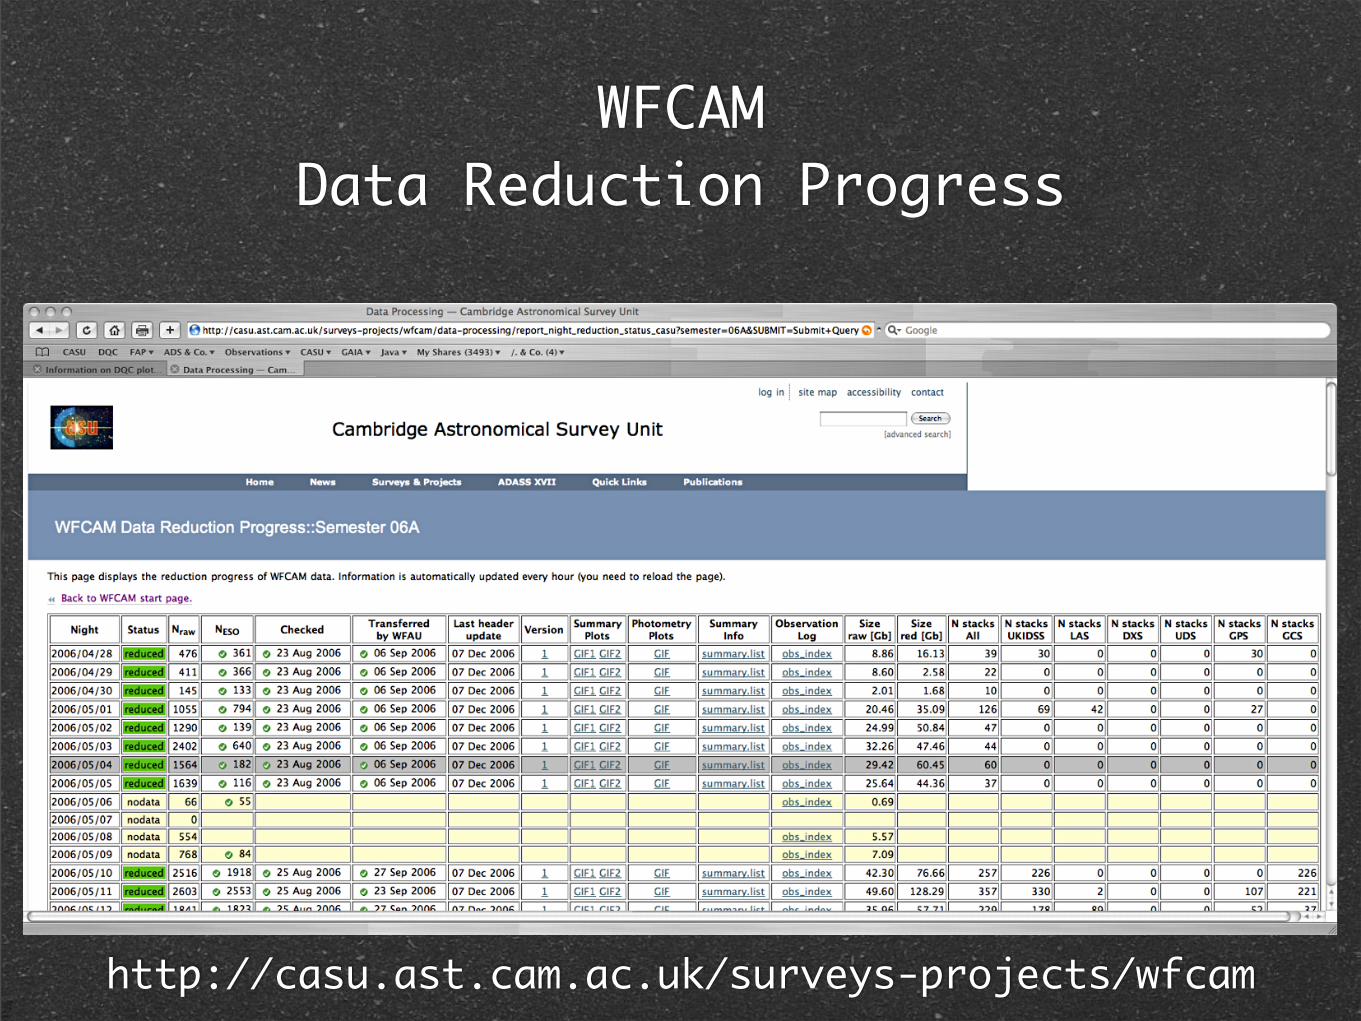
WFCAMData Reduction Progress
http://casu.ast.cam.ac.uk/surveys-projects/wfcam
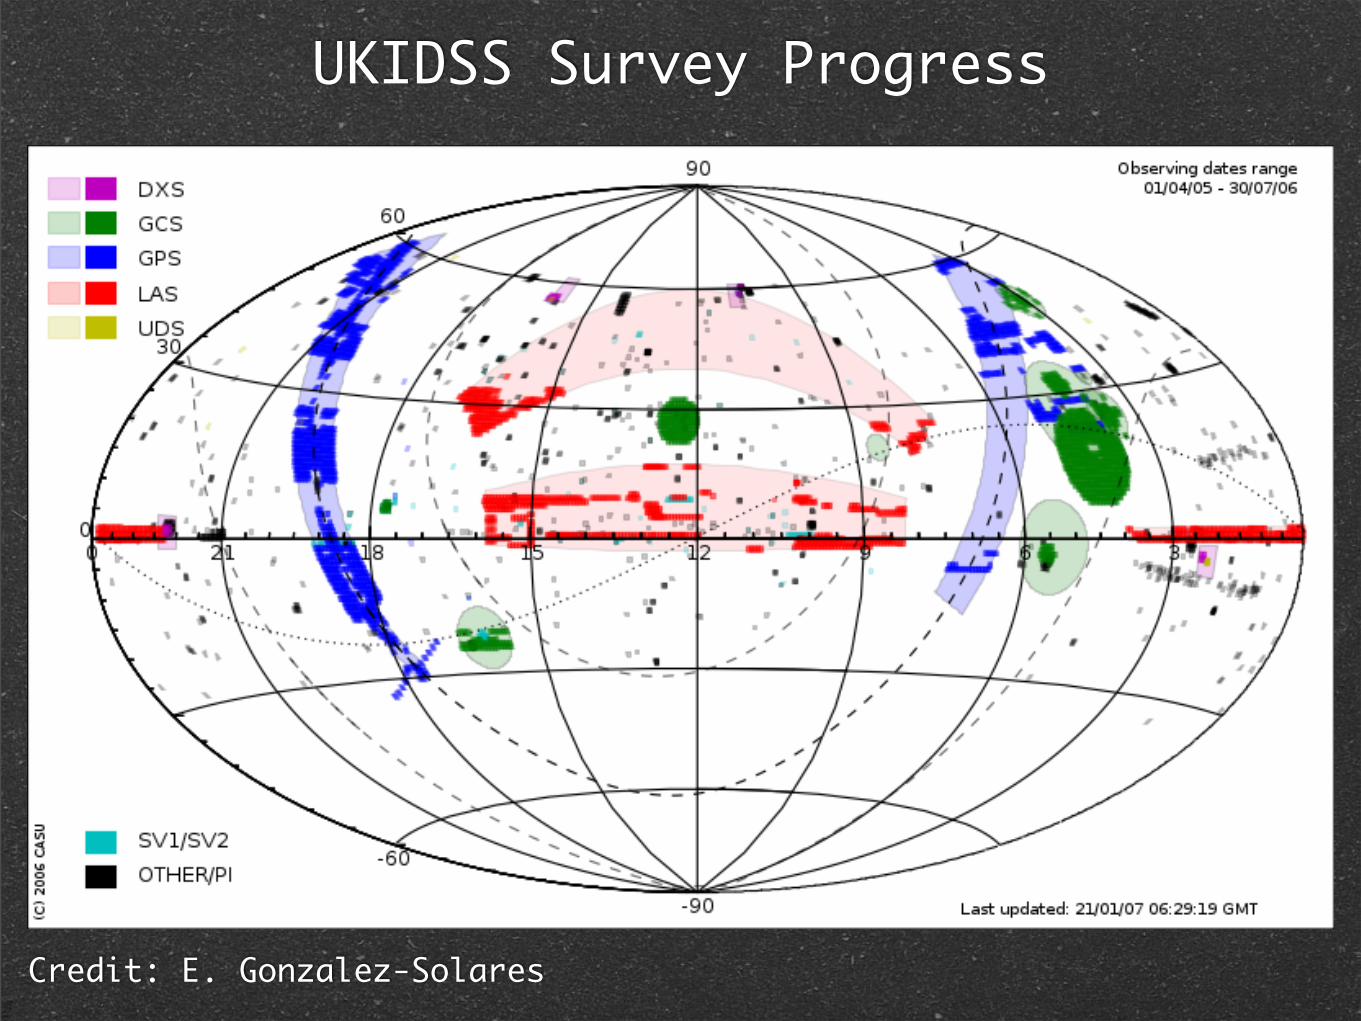
UKIDSS Survey Progress
Credit: E. Gonzalez-Solares

Sky Brightnessat Mauna Kea
(work in progress)
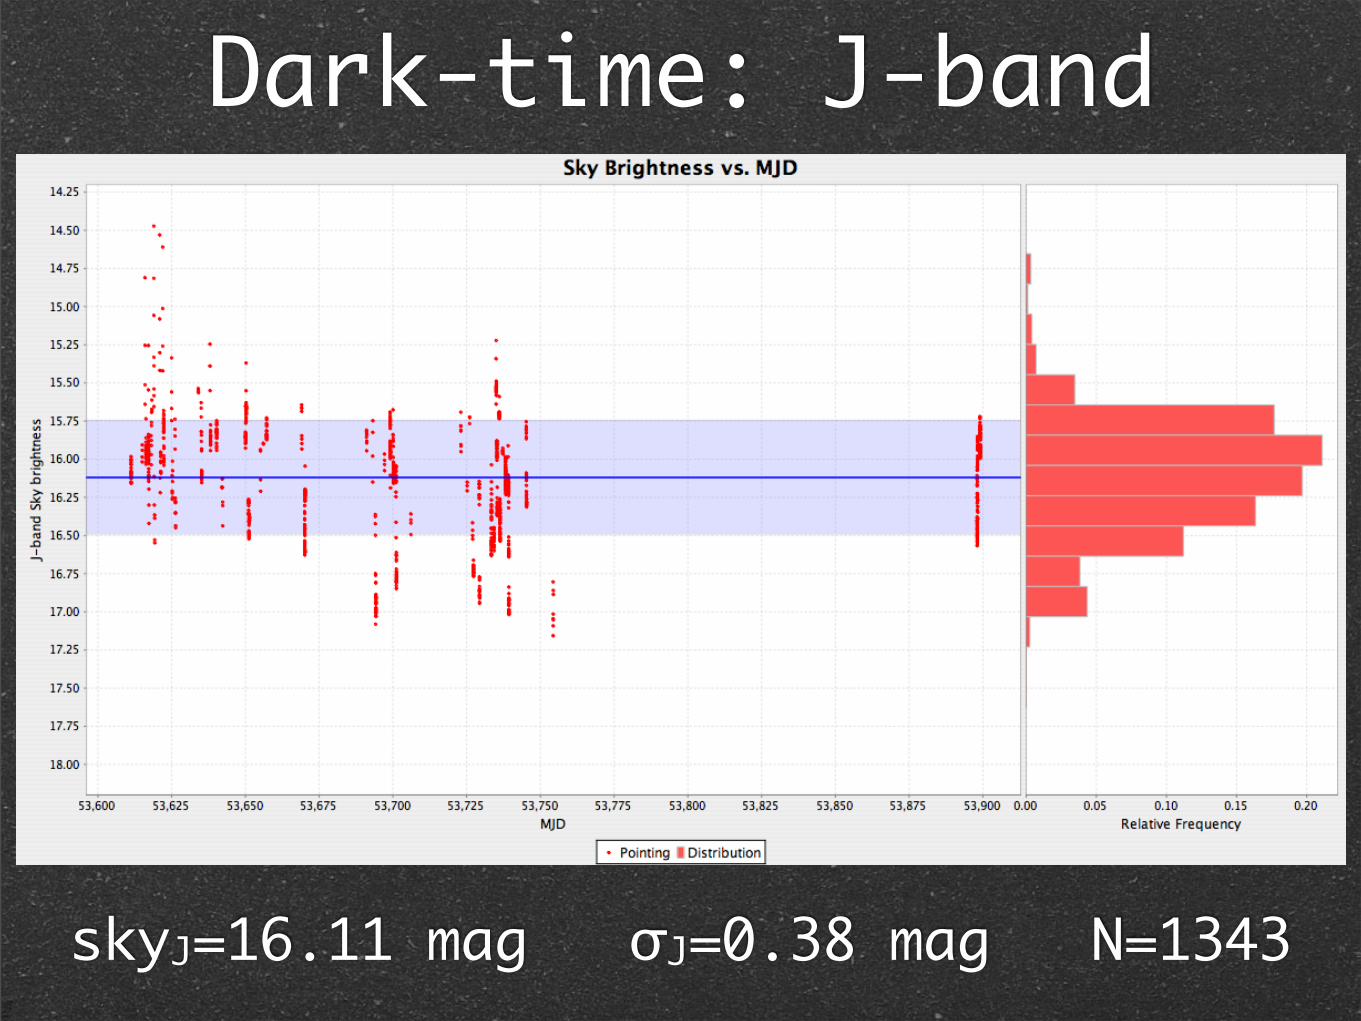
Dark-time: J-band
skyJ=16.11 mag σJ=0.38 mag N=1343
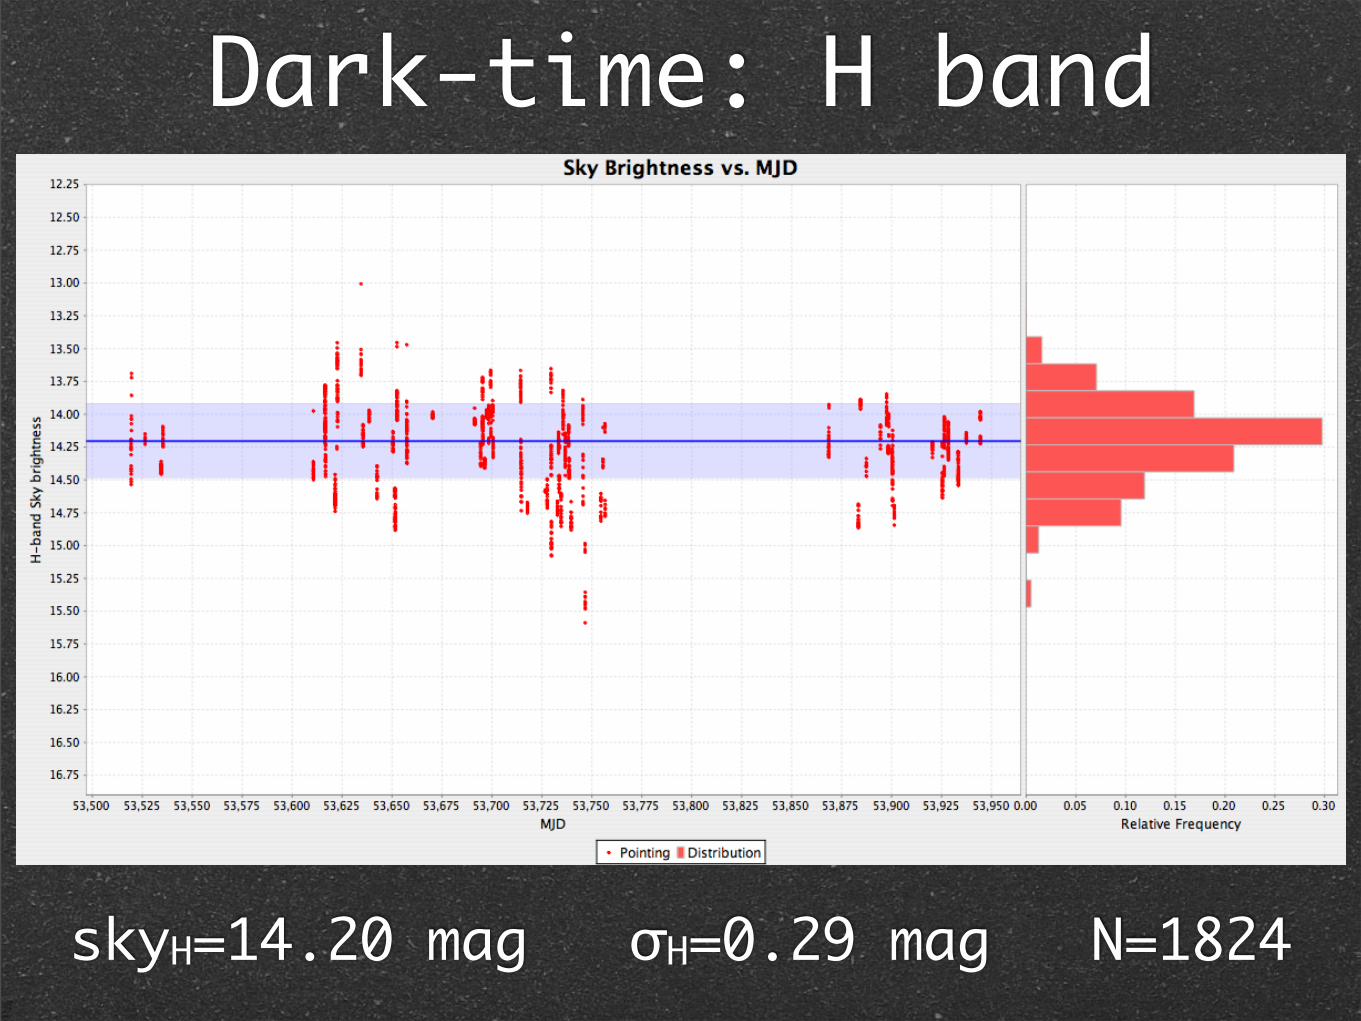
Dark-time: H band
skyH=14.20 mag σH=0.29 mag N=1824

Dark-time: K band
skyK=13.59 mag σK=0.16 mag N=2423
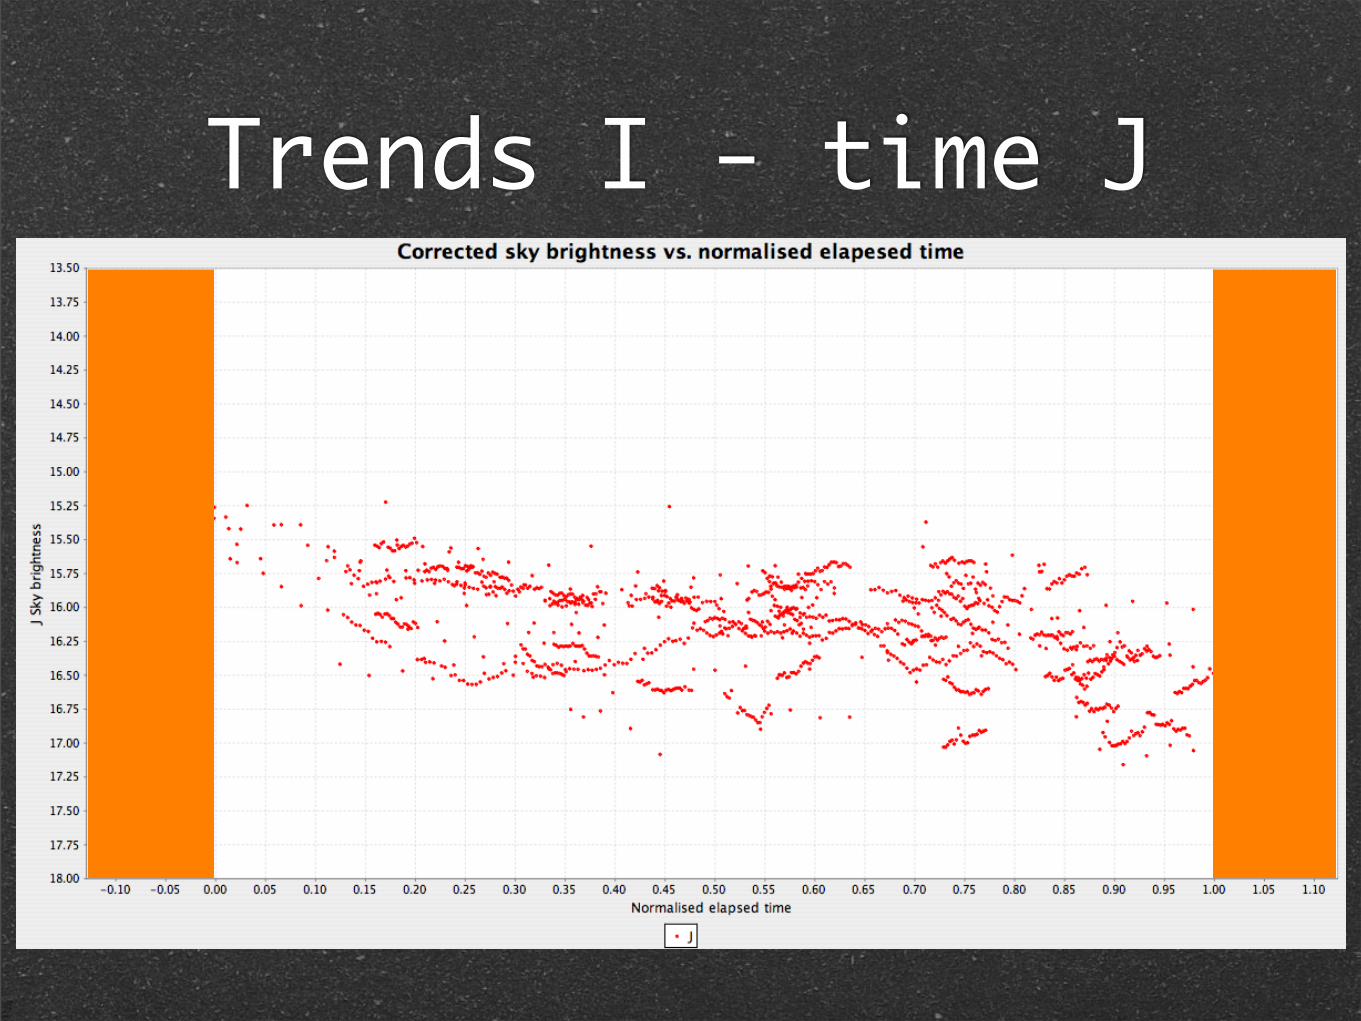
Trends I - time J
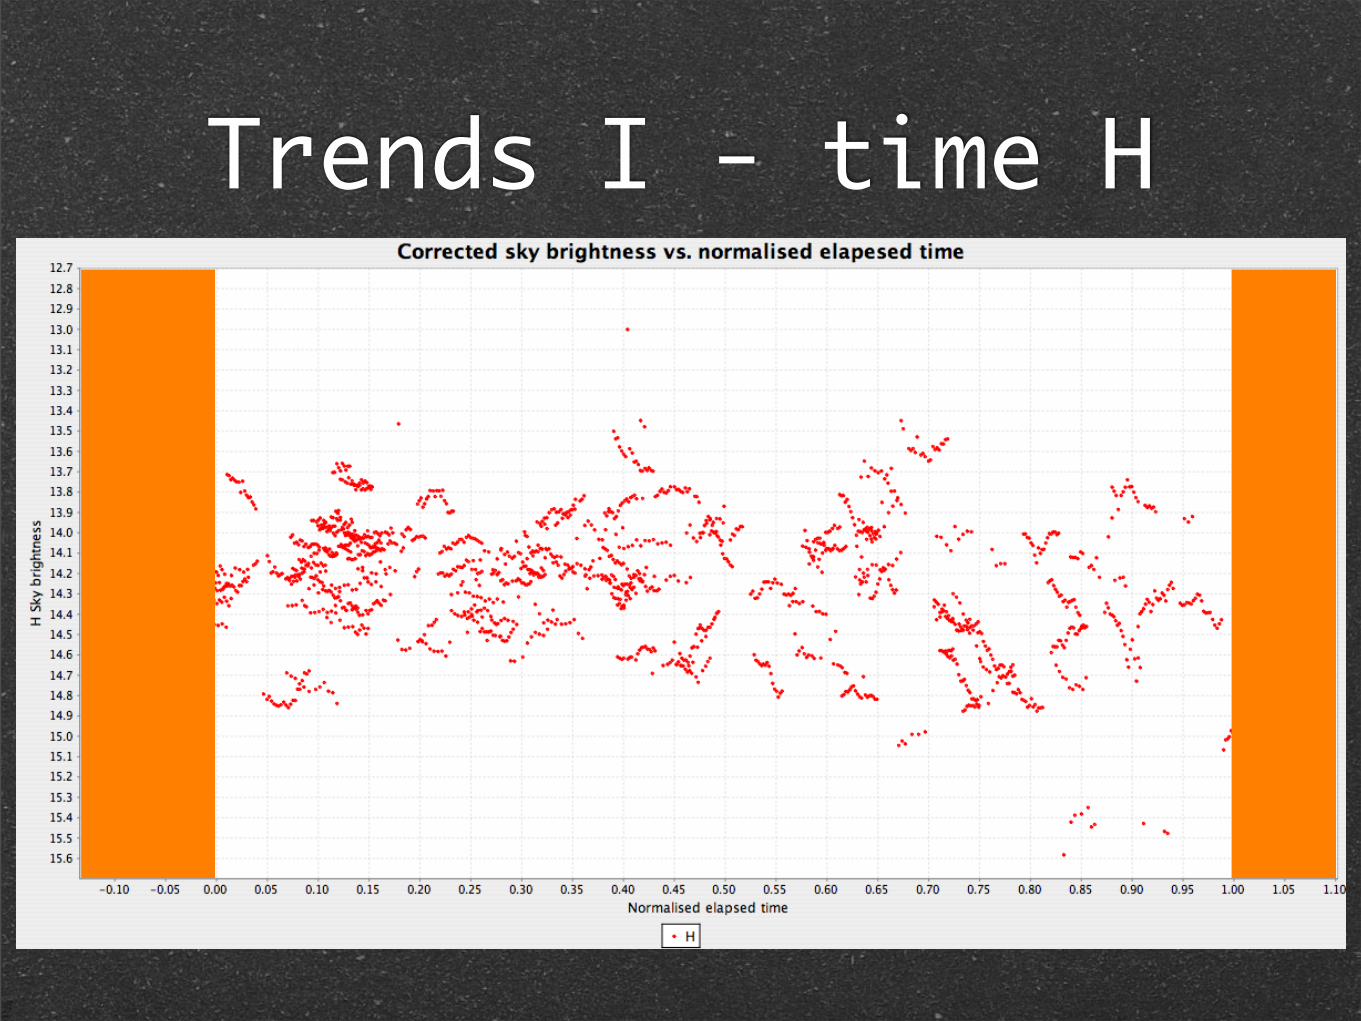
Trends I - time H
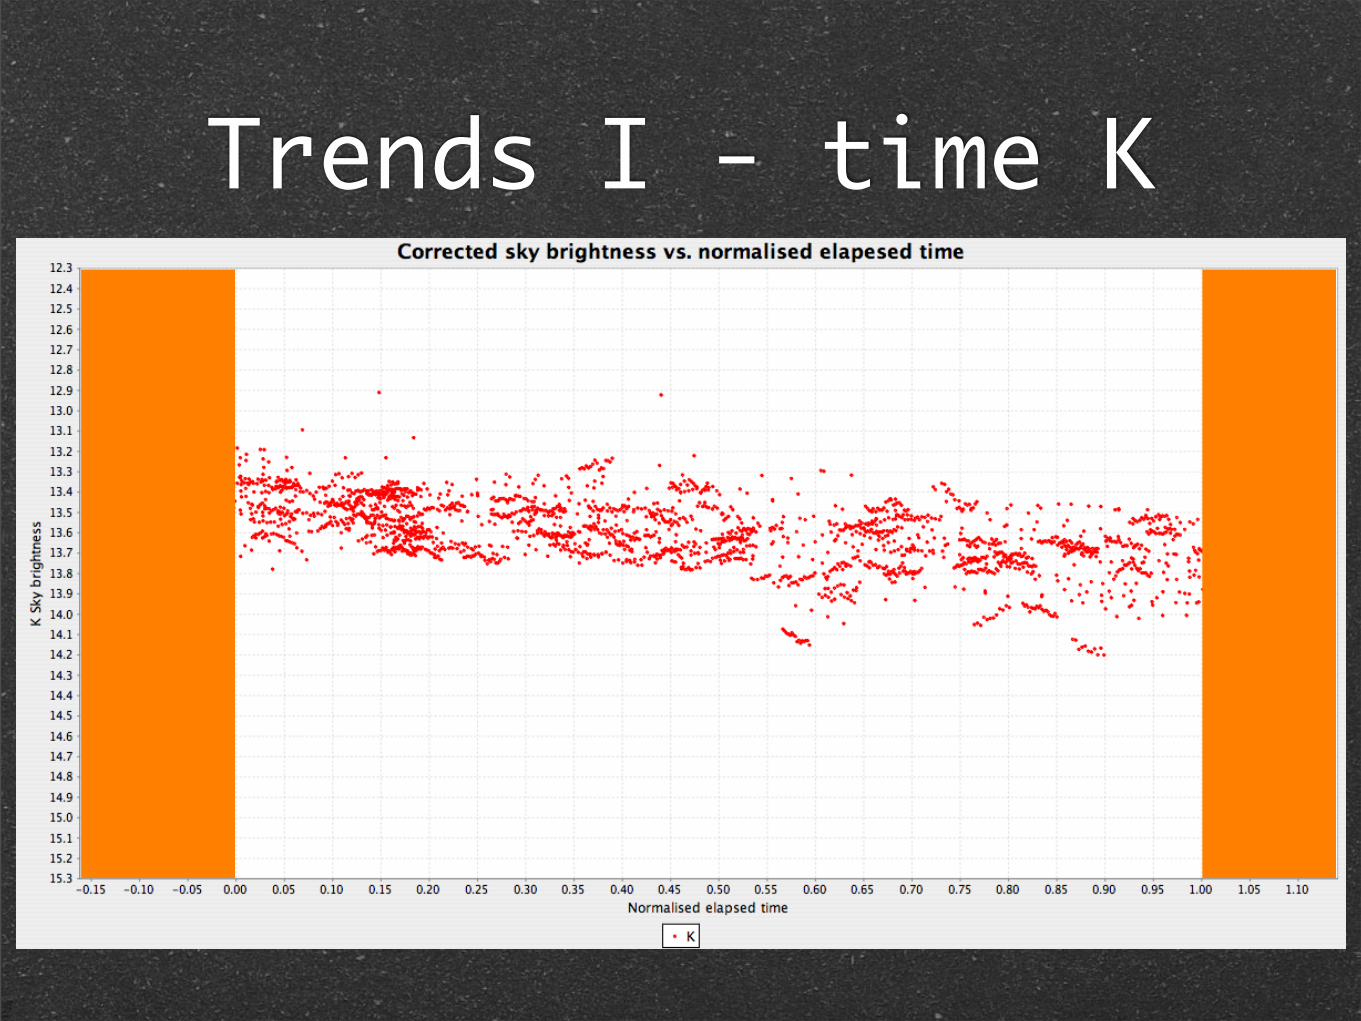
Trends I - time K
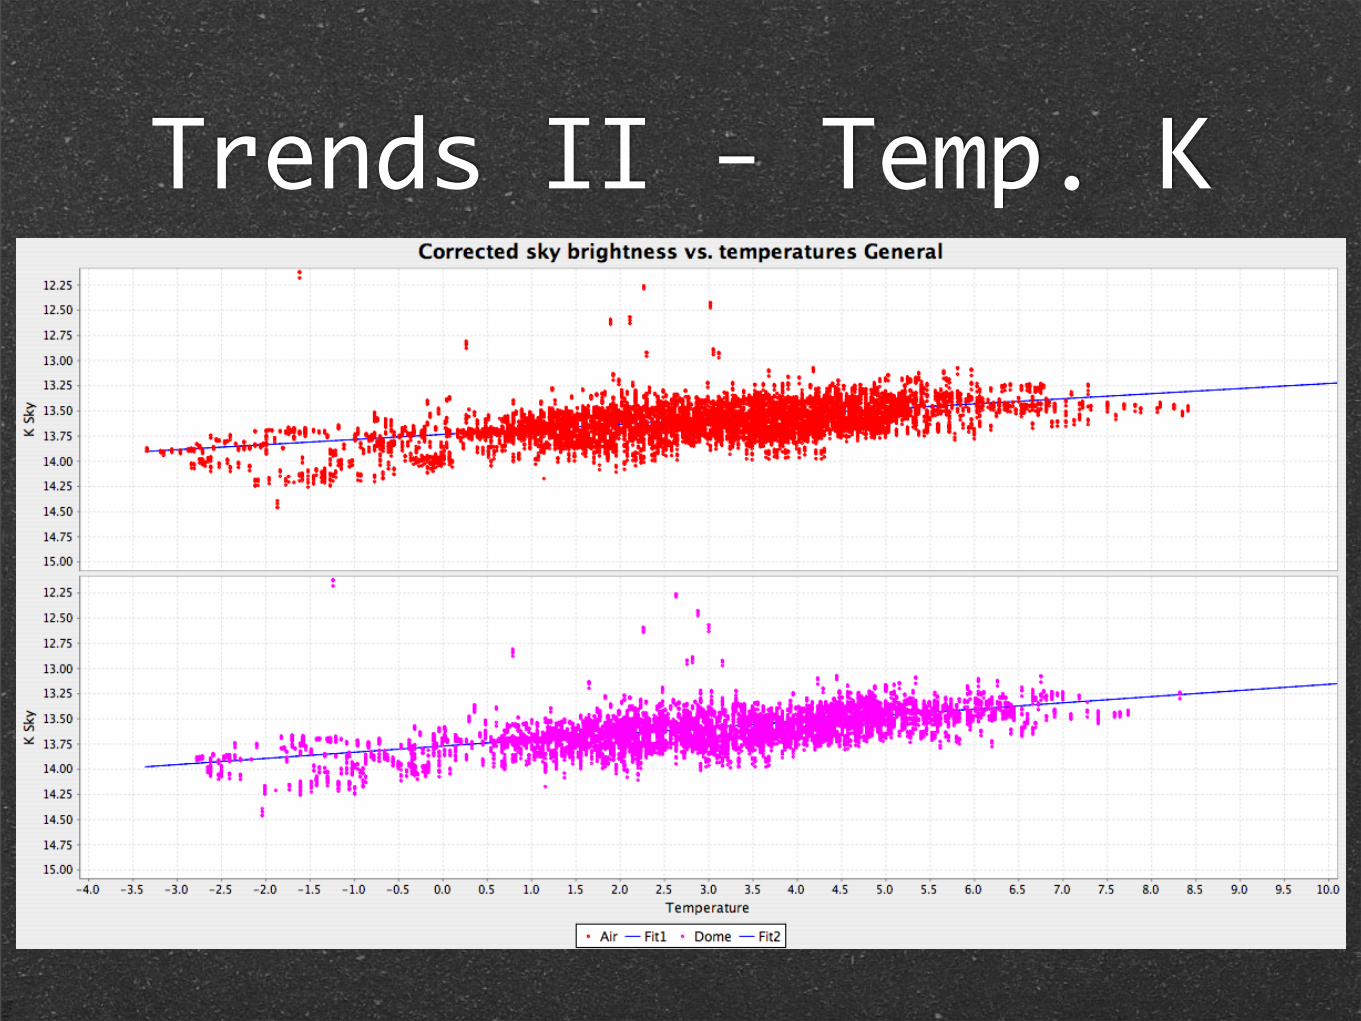
Trends II - Temp. K

Sky brightness trends Conclusions
Sky gets darker toward the end of the night
HK see “dark” twilights
K sky gets brighter with increasing T at a rate of ~0.03 mag/deg
Moon does not make an appreciable difference

Thanks for your attention
Any questions ?
http://www.ukidss.org
CASU: http://casu.ast.cam.ac.uk
http://www.vista.ac.uk