Embed Size (px)
Citation preview

`
Quality Control of H2F Treated Timber via NIR Spectroscopy
PROJECT NUMBER: PNB204-1011 MARCH 2013
PROCESSING
This report can also be viewed on the FWPA website
www.fwpa.com.au FWPA Level 4, 10-16 Queen Street,
Melbourne VIC 3000, Australia T +61 (0)3 9927 3200 F +61 (0)3 9927 3288
E [email protected] W www.fwpa.com.au

Quality Control of H2F Treated Timber via NIR Spectroscopy
Prepared for
Forest & Wood Products Australia
by
Roger Meder and Nicholas Ebdon

Forest & Wood Products Australia Limited Level 4, 10-16 Queen St, Melbourne, Victoria, 3000 T +61 3 9927 3200 F +61 3 9927 3288 E [email protected] W www.fwpa.com.au
Publication: Quality Control of H2F Treated Timber via NIR Spectroscopy Project No: PNB204-1011 This work is supported by funding provided to FWPA by the Australian Government Department of Agriculture, Fisheries and Forestry (DAFF). © 2013 Forest & Wood Products Australia Limited. All rights reserved. Whilst all care has been taken to ensure the accuracy of the information contained in this publication, Forest and Wood Products Australia Limited and all persons associated with them (FWPA) as well as any other contributors make no representations or give any warranty regarding the use, suitability, validity, accuracy, completeness, currency or reliability of the information, including any opinion or advice, contained in this publication. To the maximum extent permitted by law, FWPA disclaims all warranties of any kind, whether express or implied, including but not limited to any warranty that the information is up-to-date, complete, true, legally compliant, accurate, non-misleading or suitable. To the maximum extent permitted by law, FWPA excludes all liability in contract, tort (including negligence), or otherwise for any injury, loss or damage whatsoever (whether direct, indirect, special or consequential) arising out of or in connection with use or reliance on this publication (and any information, opinions or advice therein) and whether caused by any errors, defects, omissions or misrepresentations in this publication. Individual requirements may vary from those discussed in this publication and you are advised to check with State authorities to ensure building compliance as well as make your own professional assessment of the relevant applicable laws and Standards. The work is copyright and protected under the terms of the Copyright Act 1968 (Cwth). All material may be reproduced in whole or in part, provided that it is not sold or used for commercial benefit and its source (Forest & Wood Products Australia Limited) is acknowledged and the above disclaimer is included. Reproduction or copying for other purposes, which is strictly reserved only for the owner or licensee of copyright under the Copyright Act, is prohibited without the prior written consent of FWPA. ISBN: 978-1-921763-69-4 Researcher/s: Roger Meder CSIRO Plant Industry 306 Carmody Rd, St Lucia 4067 Nicholas Ebdon CSIRO Materials Science & Engineering Bayview Ave, Clayton 3168 Final report received by FWPA in March 2013

i
Executive Summary The use of near infrared (NIR) spectroscopy for the non-destructive, rapid prediction of
pyrethroid active ingredient in radiata pine (P. radiata) sapwood has been examined. Using
laboratory-prepared calibration samples at a range of target retention levels, correlations were
established between the:
• Theoretical retention and target retention levels for both bifenthrin and permethrin
with coefficients of determination of 0.91 and 0.91 respectively.
• Actual retention and target retention for both bifenthrin and permethrin with
coefficients of determination of 0.01 and 0.91 respectively.
• Actual retention and NIR-predicted retention for both bifenthrin and permethrin with
coefficients of determination of 0.94 and 0.97 respectively for the calibration step and
0.74 and 0.87 respectively for the validation step. These calibrations were then used
for prediction of retention levels in run-of-mill samples.
When the NIR calibrations for bifenthrin and permethrin established above were used to
predict the retention level of active compound in run-of-mill samples, NIR spectra obtained
from unknown samples were:
• Able to predict the retention of permethrin in the surface 5 mm of seventeen (17)
radiata pine sapwood samples with a coefficient of determination of 0.3.
o NIR predicted all samples as passing the retention standard for permethrin,
which was consistent with the analytically measured result.
• Able to predict the retention of bifenthrin in the surface 2 mm of forty (40) radiata
pine sapwood samples with a coefficient of determination of 0.01.
o NIR predicted all but one sample as passing the retention standard for
bifenthrin, while the analytically measured result showed all samples as
passing.
o The possible reason for the low coefficient of determination is that a number of
the samples had high (>0.04%) retention and are beyond the calibration range.

ii
No viable calibrations were able to be developed for the azole treatment (propiconazole and
tebuconazole) despite the coefficients of determination for the calibration being 0.99, as the
value for the validation ranged from 0.57 for tebuconazole to 0.52 for propiconazole.
The lack of sample preparation required for NIR determination of retention overcomes two of
the primary sources of error in the traditional method of analysis. The NIR fibre optic cable,
fitted with a depth gauge, allows a consistent depth of treated solid wood to be analysed and
removed the error associated with depth sampling and extraction. Despite NIR having the
analytical accuracy of the Standard method it does allow rapid determination of retention and
this could be performed in-mill allowing rapid feedback of treatment efficiency. In turn this
would allow treatment operators to optimise the treatment process to avoid under-treatment
and to minimise the extent of over-treatment which is a chemical cost to the operation.
The current results suggest that NIR spectroscopy could potentially be used to rapidly
determine the permethrin and bifenthrin retention in radiata pine, and with additional
sampling, and careful wet chemical analysis, this could provide a robust calibration that
would be suitable for at-line quality control in a treatment process.
One of the initial aims of the project was to determine whether a simple filter-based NIR
system would be sufficient for determination of H2F retention. Given the need for second
derivative spectra to be used in order to obtain a suitable calibration it is not possible to use a
filter instrument, However, there are a number of commercially-available, low-cost portable
NIR systems that could be calibrated to predict the retention levels in pine timber to provide
operators with in-mill quality control of retention. The calibration samples, archived at
CSIRO, would enable an initial calibration to be established on any such instrument with
minimal effort and this calibration could be improved over time as part of the regular quality
control sampling.

Table of Contents Executive Summary .................................................................................................................... i
Figures .................................................................................................................................... 1
Tables ..................................................................................................................................... 2
Definitions and Abbreviations ............................................................................................... 3
Introduction ................................................................................................................................ 4
NIR Spectroscopy .................................................................................................................. 6
Methodology ............................................................................................................................ 11
Preservative Treatment ......................................................................................................... 11
Sectioning of samples for NIR and retention analysis ......................................................... 11
Preservative Analysis ........................................................................................................... 13
Potential sources of error .................................................................................................. 13
NIR Spectroscopy ................................................................................................................ 14
Calibration samples .......................................................................................................... 14
Run-of-mill samples ......................................................................................................... 15
Results ...................................................................................................................................... 17
Theoretical Retention ........................................................................................................... 17
NIR Calibration of Actual Retention ................................................................................... 19
Retention calibration – CDI instrument ........................................................................... 22
Assignment of NIR bands ................................................................................................ 22
NIR Prediction of Retention in Run-of-mill Samples .......................................................... 26
Conclusions .............................................................................................................................. 31
Recommendations .................................................................................................................... 32
References ................................................................................................................................ 33
Acknowledgements .................................................................................................................. 36
Appendices ............................................................................................................................... 37
Appendix 1. Hazard class selection guide ............................................................................ 37
Appendix 2. Actual and NIR-predicted retention rates for permethrin-treated run-of-mill
timber. .................................................................................................................................. 38
Appendix 3. Actual and NIR-predicted retention rates for bifenthrin-treated run-of-mill
timber. .................................................................................................................................. 39

1
Figures Figure 1 Structure of the two pyrethroids, permethrin (top) and bifenthrin (bottom). ......................... 4
Figure 2 Structure of the two azoles, propiconazole (left) and tebuconazole (right). ........................... 5
Figure 3 The electromagnetic spectrum showing the location of the near IR region. .......................... 6
Figure 4 Schematic of some common bending and stretching modes of molecules. .......................... 7
Figure 5 Representative NIR spectrum of P. Radiata sapwood (Bruker MPA). .................................. 8
Figure 6 Representative NIR spectrum of permethrin and bifenthrin neat solutions (Bruker MPA). ..................................................................................................................................... 8
Figure 7 NIR spectra of radiata pine sapwood control and radiata pine sapwood treated with 50% solutions of bifenthrin and permethrin. .......................................................................... 9
Figure 8 Schematic of sampling of an individual test specimen for NIR and wet chemical analysis. ................................................................................................................................ 12
Figure 9 Schematic of NIR radial scanning. NIR spectra were obtained every 1 mm along the length of the excised strips. .................................................................................................. 12
Figure 10 Photograph of (left) the aluminium depth gauge for the fibre optic probe and (right) a sample being presented to the gauge. The sample edge is held firmly against the stop for spectral acquisition. ........................................................................................................ 14
Figure 11 Plot of (left) theoretical retention vs target retention and (right) actual retention vs target retention for permethrin treated calibration samples. ................................................. 17
Figure 12 Plot of (left) theoretical retention vs target retention and (right) actual retention vs target retention for bifenthrin treated calibration samples. ................................................... 18
Figure 13 Plot of analytically-determined vs theoretical retention of bifenthrin. ................................. 19
Figure 14 Predicted vs actual plot of the theoretical bifenthrin retention based on uptake data. ......... 20
Figure 15 Predicted vs actual plots of (left) permethrin and (right) bifenthrin based on analytical values of retention. ............................................................................................... 21
Figure 16 Raw spectrum of treated P. radiata sapwood plus PLS loading weights of NIR X-matrix for calibration of bifenthrin retention (Components 1 and 2). .................................. 23
Figure 17 Raw spectrum of treated P. radiata sapwood plus PLS loading weights of NIR X-matrix for calibration of permethrin retention (Components 1 and 2). ................................ 24
Figure 18 Raw spectra of bifenthrin and permethrin and the first principal component for permethrin and bifenthrin calibrations based on second derivative NIR spectra. ................ 25
Figure 19 Plot of NIR-predicted retention vs actual retention for permethrin in run-of-mill samples. The dashed lines represent the required standard retention of 0.02%. .................. 26
Figure 20 Plot of NIR-predicted retention vs actual retention for bifenthrin in run-of-mill samples. The dashed lines represent the required standard retention of 0.02%. The shaded region is outside of the range of the calibration. ...................................................... 27
Figure 21 Predicted vs actual plots of bifenthrin based on analytical values of retention for run-of-mill samples including samples with high analytically-determined retention. ................ 28

2
Tables Table 1 Sapwood retention levels and penetration depths for H2F treatment using
permethrin, bifenthrin and LOSP mixed azole. ........................................................................ 5
Table 2 Tentative assignment of NIR absorbances for bifenthrin and permethrin. ............................... 9
Table 3 Target retention levels for calibration treatments. .................................................................. 11
Table 4 Summary statistics for calibration of active retention (%) by NIR. Full range NIR (1,000-2,500 nm), 2nd derivative. ............................................................................................ 21
Table 5 Summary statistics for calibration of active retention (%) by NIR. Reduced range NIR (MPA lab instrument), 2nd derivative. ............................................................................. 22
Table 6 Summary statistics for calibration of active retention (%) by NIR (CDI 1,100-2,200 nm). ............................................................................................................................... 22
Table 7 % variance explained for the X-block (NIR) and Y-block (% active) data for the first three principal components for correlation of NIR with pyrethroid retention. ................ 24
Table 8 Loadings for 2nd derivative PLS calibration of pyrethroid retention (from Schwanninger et al. 2011). ...................................................................................................... 25
Table 9 Sample of available NIR instruments suitable for determination of retention in situ. .......................................................................................................................................... 32

3
Definitions and Abbreviations Definitions Active compound The generic term referring to the preservative compound. Target retention The retention value intended to be achieved for an individual sample based on the known concentration of the treatment solution. Theoretical retention The projected retention of preservative based on uptake of treatment solution of known concentration by an individual sample. Actual retention or Analytical retention or Active retention The value of the preservative retention based on analytical analysis of the individual sample. Abbreviations GC gas chromatography LCMS liquid chromatography – mass spectrometry LOSP light organic solvent preservative MIR mid infrared NIR near infrared PCA principal component analysis PLS partial least squares (regression)

4
Introduction Most species of wood used for framing and construction timber have very little natural
resistance to attack by fungi and insects. Consequently a number of chemical
compounds have been approved for use as timber preservatives in Australia (AS 1604.1
- 2000) according to their intended end-use; interior wall framing, outdoor decking, or
in-ground and marine piling (Appendix 1). Individual chemical systems are suited to a
particular end-use. The specific H2F hazard class is designed for above ground, inside
use to protect against borer and termite attack (AS 1604.1 - 2000) and as such it is
particularly suited to interior framing timber. Generally these preservatives require only
an outer envelope of a few millimetres to be treated to a specified level in order to be
effective in use with the exact retention and penetration specifications dependent on the
active ingredient(s).
Pyrethroid preservatives such as permethrin (3-Phenoxybenzyl-(1RS)-cis,trans-3-(2,2-
dichlorovinyl)-2,2-dimethylcyclopropanecarboxylate) and bifenthrin (2-
methylbiphenyl-3-ylmethyl-(1RS)-cis-3-[(Z)-2-chloro-3,3,3-trifluoroprop-1-enyl]-2,2-
dimethylcyclopropanecarboxylate) (Figure 1) are approved for H2F envelope treatment
of timber framing south of the Tropic of Capricorn. Mixed azoles such as tebuconizole
((RS)-1-(4-chlorophenyl)-4,4-dimethyl-3-(1,2,4-triazol-1-ylmethyl)pentan-3-ol ) and
propiconazole (1-[ [2-(2,4-dichlorophenyl)-4-propyl-1,3-dioxolan-2-yl]methyl]-1,2,4-
triazole) (Figure 2) are approved for LOSP (light organic solvent preservative)
treatment. The retention of H2F treatment differs for the two pyrethroids and is
summarized in Table 1 along with the azole retention standard.
OO
Cl
Cl
O
O
Cl
F
FOF
Figure 1 Structure of the two pyrethroids, permethrin (top) and bifenthrin (bottom).

5
Cl
Cl
O
O
N
N N
Cl
HON
NN
Figure 2 Structure of the two azoles, propiconazole (left) and tebuconazole (right).
Table 1 Sapwood retention levels and penetration depths for H2F treatment using permethrin, bifenthrin and LOSP mixed azole.
ACTIVE INGREDIENT RETENTION (% w/w) RETENTION DEPTH (mm)
Permethrin 0.02 5
Bifenthrin 0.02 2
Tebuconazole/Propiconazole 0.03 Full penetration (LOSP)
Source: AS1604.1-2000
The current method for the analysis of retention (AS/NZS 1605.3:2006) requires a surface
sample to be taken (5 mm deep for permethrin or 2 mm for bifenthrin). The active compounds
are extracted from this surface sample using an appropriate solvent system and the extract
analysed by either gas chromatography (GC) or liquid chromatography coupled with mass
spectrometry (LCMS). More complete details of the method are found in the Methods section
and in the Australian Standard (AS/NZS 1605.3:2006). There are several potential sources of
error in the method which are discussed in detail in the Methods section. These errors can
arise from three primary sources; sub-sampling of the wood section to provide the appropriate
depth, variable efficiency in extraction of the active compound(s) from the wood sub-sample,
and analytical error in the quantification of the extract (Crimp, Lobb, Hague; all pers comm.).
Analysis can also be a lengthy process from time of sampling in the mill to receipt of the
analytical results, during which time the mill is unaware of any under- or over-treatment that
may be occurring. An in-mill, real-time, low-cost method for determining the retention of the
active compound would provide tighter control during production.

6
Near infrared (NIR) spectroscopy is routinely used in a number of industries including the
petrochemical, food and pharmaceutical sectors to rapidly provide quality control of raw
materials and final product and is being applied to tree breeding as a means to rapidly
phenotype individual trees for otherwise costly or destructive analyses (Kraft pulp yield,
microfibril angle etc). It is proposed that NIR could be suitably calibrated to provide a rapid
method for quality control of H2F treatment.
NIR Spectroscopy Near infrared spectroscopy is a molecular vibrational spectroscopy arising from interaction of
molecules and infrared radiation. The near infrared region of the electromagnetic spectrum
lies just beyond the red end of the visible spectrum (Figure 3) and is energetically associated
with the sensation of heat from a light source. Near infrared energy incident on a material
surface, such as wood, is either absorbed or reflected. The wavelengths of the energy that are
absorbed by the material depend on the chemical composition of the material surface. In the
case of wood, which is composed of cellulose, hemicellulose, lignin and extractives, the
energy absorbed is characteristic of these compounds. The absorbed energy results in
excitation of molecular motion such as molecular bond stretching and bending as illustrated in
Figure 4. The amount of energy absorbed is dependent on the overall amount of compound in
the material and hence it allows, in theory, for quantitation of the amount of chemical to be
determined. When compared to a totally reflective standard, near infrared spectra record the
intensity spectrum of the reflected wavelengths in the range from 1,000 – 2,500 nm or 4,000 –
10,000 cm-1 (although the actual range is dependent on the configuration of the actual
spectrometer). Wavelength (nm) and wavenumber (cm-1) are used interchangeably dependent
on the type of NIR instrument.
Figure 3 The electromagnetic spectrum showing the location of the near IR region.

7
Figure 4 Schematic of some common bending and stretching modes of molecules.
While near infrared spectroscopy is not a quantitative technique per se, it does have the ability
to be calibrated using samples with known chemical (or physical) properties. NIR has
previously been calibrated to predict key wood properties such as chemical composition
(Poke and Raymond 2006, Thumm et al. 2011), Kraft pulp yield (Meder 1994, Michell 1995,
Downes et al 2009, 2010, 2011), stiffness (Thumm and Meder 2001, Meder et al. 2003),
density (Hoffmeyer and Pedersen 1995, Mora et al. 2008), microfibril angle (Schimleck and
Evans 2002, Meder et al. 2010), durability (Jones et al. 2011; Bush et al. 2011), compression
wood severity (Meder and Meglen, 2012) and CCA preservative retention (So et al. 2004 ).
As such, NIR lends itself to potentially being calibrated to determine the retention of
pyrethroid preservatives in pine. Given the unique halogen moieties present in the active
compounds there could potentially be unique NIR signals associated only with the active
compounds. This is better evidenced by the differences in NIR spectra of wood (Figure 5)
along with spectra of bifenthrin and permethrin in Figure 6.
Note however that the fundamental stretching frequencies of C-F and C-Cl occur in the mid
infrared (MIR) region 1,000-1,400 cm-1 (10,000-7140 nm) and 600-800 cm-1 (16,666-12,500
nm) respectively and as such are outside the range of the NIR. Consequently it would only be
the 4th or 5th overtone stretches that would occur in the NIR region of the electromagnetic
spectrum (4,000-10,000 cm-1 / 1,000-2,500 nm) and consequently the absorbances would be
considerably weaker than the stronger 1st and 2nd overtones of C-H moieties. From a practical
point of view it is unlikely therefore that direct observance of C-F or C-Cl stretching
absorbances will be observed in the NIR spectra of bifenthrin or permethrin.
The advantages of NIR spectroscopy lie in its speed of analysis (a few seconds) and the
minimal preparation required to present a sample to the NIR spectrometer. NIR spectrometers

8
fitted with fibre optic probes can readily acquire spectra from a solid surface such as the face
of end of lumber.
Wavelength (nm)
1000 1200 1400 1600 1800 2000 2200 2400
Abso
rban
ce
0.0
0.1
0.2
0.3
0.4
0.5
0.6
0.7
Figure 5 Representative NIR spectrum of P. Radiata sapwood (Bruker MPA).
Figure 6 Representative NIR spectrum of permethrin and bifenthrin neat solutions (Bruker MPA).
Figure 7 shows the NIR spectra of radiata pine sapwood treated with 50% solutions of either
bifenthrin or permethrin compared to an untreated sample of sapwood, in order to maximise
the spectral differences, which are attributable to the respective pyrethroid. This shows
particularly increased absorbances at 1208, 1640-1670 and 2140 nm.

9
Wavelength (nm)
1000 1200 1400 1600 1800 2000 2200 2400
Abs
orba
nce
0.0
0.2
0.4
0.6
0.8
1.0
Control Bifenthrin Permethrin
Figure 7 NIR spectra of radiata pine sapwood control and radiata pine sapwood treated with 50% solutions of bifenthrin and permethrin.
Table 2 Tentative assignment of NIR absorbances for bifenthrin and permethrin.
WAVENUMBER (CM-1) WAVELENGTH (nm) ASSIGNMENT
BIFENTHRIN
8258 1211 C-H 3rd overtone stretch of methylene, -CH2-
7092 1410 ?
5797 (st) 1725 (st) C-H 2nd overtone stretch of methylene, -CH2-
5650 1770 C-H stretch of CH3 in Ar-CH3
4660 (wk) 2145 (wk) C=O stretch combination of carbonyl in ester, –C=O(OR)
PERMETHRIN
8778 1139 C-H 3rd overtone stretch of aromatic, Ar-H
6110 (sh) 1637 (sh) C-H stretch of vinyl C-H, -CH=CX-
5980 (st) 1672 (st) C-H 1st overtone stretch of aromatic, Ar-H
5812 1720 C-H 1st overtone stretch of methyl, - CH3
5669 (wk) 1766 (wk) C-H 2nd overtone stretch of methylene, -CH2-
4670 (st) 2142 (st) C=O stretch combination of carbonyl in ester, –C=O(OR)
4532 2208 C-H combination of aromatic, Ar-H
Source: Shenk et al. 2008; Gowan et al. 2011; Workman Jr and Weyer, 2012 sh – shoulder st – strong wk - weak

10
This report presents the results of calibrating an NIR spectrometer to determine permethrin,
bifenthrin and total azoles (tebuconazole + propiconazole) in radiata pine sapwood.

11
Methodology
Preservative Treatment Samples of P. radiata sapwood (nominal 97x47 mm, ~100 mm long) were treated to a
range of target retentions with bifenthrin or permethrin according to the schedule in
Table 3. Five boards were treated per target retention level. Additional samples were
LOSP treated using a combined tebuconazole/ propiconazole solution.
Table 3 Target retention levels for calibration treatments.
ACTIVE INGREDIENT STANDARD RETENTION (% w/w) TARGET RETENTION (% w/w)
Permethrin 0.02 0.005, 0.010, 0.015, 0.020, 0.030
Bifenthrin 0.02 0.015, 0.020, 0.025, 0.030
Tebuconazole/Propiconazole 0.03 0.020, 0.030, 0.050, 0.060, 0.070
Source: AS1604.1-2000
Note: H2F requires envelope treatment of sapwood and any heartwood faces, so test specimens were selected to include samples of (i) all sapwood and (ii) mixed heartwood/sapwood.
Sectioning of samples for NIR and retention analysis
Cross-sectional biscuits were selected at the mid-length point of each board and
provided for retention analysis and NIR scanning. Biscuits were end- and face-matched
to enable registration of the retention values with the respective NIR spectra (Figure 8).
Figure 9 shows in detail the location of the series of NIR spectra obtained at 1 mm
intervals from the board surface into the board interior for each strip obtained (4 strips
per board). Spectra were then averaged for correlation with actual retention data (outer
2 mm averaged for bifenthrin, outer 5 mm averaged for permethrin). The actual spot
size of the NIR acquisition region is ~1 x 3 mm.

12
Figure 8 Schematic of sampling of an individual test specimen for NIR and wet chemical analysis.
Figure 9 Schematic of NIR radial scanning. NIR spectra were obtained every 1 mm along the length of the excised strips.
Actual retention values of permethrin were determined in-house by Arch and for
bifenthrin by Symbio Alliance and the Australian Forest Research Company (AFRC)
according to AS 1605.3. Retention values were used as received for reference in the NIR
calibration.
~100 mm
Strips for NIR (15-20 mm deep) from each face
Regions for preservative analysis (surface to 2 mm (bifenthrin) or surface to 5 mm (permethrin))
~10-15 mm ~5 mm
For NIR camera
10 mm
P1
P3
P2
P4
N1
N3
N2 N4
Permethrin average
Bifenthrin average
~3
10 mm
1 mm
Board outer surface

13
Preservative Analysis
The analysis of pyrethroid retention according to AS1605.3 requires the sectioning of
the surface to the required depth (2 mm bifenthrin, 5 mm permethrin) and extraction of
the active via sonication in a solvent (acetone in the case of bifenthrin and ethanol in the
case of permethrin). The extracts are analysed for active concentration via GC-ECD
(bifenthrin) or HPLC with detection at 232 nm (permethrin) calibrated against solutions
of known concentration. The retention values are presented as % m/m on an oven dry
basis.
Potential sources of error When only a single measurement is performed such as during routine analysis, it is
impossible to differentiate between the systematic and random sources of influences.
The determination of retention of active pyrethroid in wood is based on extraction from a
surface subsample of wood, namely 2 mm depth for bifenthrin or 5 mm depth for permethrin.
The wood subsamples are then extracted using sonication in a solvent system and the extract
analysed by liquid or gas chromatography.
Several possible sources of error may exist in this analysis:
1. Sectioning of analytical subsample. Particularly in the case of bifenthrin where the
depth of sample is only 2 mm, there is considerable opportunity for error with analysts
reporting that sectioning of subsamples can readily vary between 1.5 and 2.5 mm,
representing an error of ±25% (Crimp, pers comm.).
2. Efficiency of active extraction. Extraction of the active from the wood matrix is highly
variable and is dependent on both solvent system and extraction type (sonication vs
Soxhlet extraction) and has been estimated at between 50 and 80% efficient (Hague,
pers comm.; Schoknecht et al. 2008).
3. Stability of calibration standards. Anecdotal evidence suggests that calibration
standards for GC or LC are unstable unless stored in dark glass bottles in the dark
(Lobb, pers comm.).
Each of these presents a significant source of potential error, but in combination they
constitute a considerable source of error in the classical determination of retention. This in

14
turn represents a considerable source of error when attempting to calibrate NIR spectra with
the analytically determined retention values.
NIR Spectroscopy NIR spectroscopy was performed using two separate instruments, both equipped with fibre
optic probes: a Bruker MPA (Bruker Optics, Ettlingen, Germany, www.bruker.com), which is
a laboratory instrument operating in the spectral range 12,500 – 4,000cm-1 at 16 cm-1 spectral
resolution; or a Control Development Inc (CDI) portable NIR (Control Development Inc,
South Bend, IN, USA, www.controldevelopment.com). The CDI uses an InGaAs detector
with a spectral range of 1,100–2,200 nm at 4 nm spectral resolution and is a low cost
(~$20,000) portable instrument. In order to sample the outer 2 or 5 mm, an aluminium
depth gauge was made to fit the end of the fibre optic probes on the MPA and CDI (Figure
10).
Figure 10 Photograph of (left) the aluminium depth gauge for the fibre optic probe and (right) a sample being presented to the gauge. The sample edge is held firmly against the stop for spectral acquisition.
Calibration samples Samples for calibration of NIR were of two types. The first used a depth gauge machined
to fit the end of the NIR fibre optic probe. This allowed spectra to be obtained from the
surface to a fixed depth with spectra being acquired on all four faces of the board. These
spectra were either used separately for correlation with individual faces or averaged to
correlate with the whole board average value of retention. (MPA probe Average 4 faces x
32 scans).

15
The second approach used the strips sectioned from the face to a depth of ca. 10 mm as
shown in Figure 9. NIR spectra were obtained at 1 mm intervals from the face-end of
each strip using a linear transport accessory with fibre optic probe (Meder et al. 2010)
to acquire spectra in the range 10,000 – 4,000 cm-1 (1,000 – 2,500 nm) at 8 cm-1 spectral
resolution (Bruker MPA, Bruker Optics, Ettlingen, Germany, www.bruker.com). In order
to match the retention depth with the NIR spectra, the NIR spectra were averaged at
either 2 mm intervals (bifenthrin) or 5 mm intervals (permethrin).
Individual or board-average spectra were used to develop partial least squares (PLS)
regression calibrations with the actual retention (or theoretical retention) values, using
The Unscrambler v9.8 and 10.2 (Camo AS, Oslo, Norway, www.camo.com).
Run-of-mill samples Samples of H2F treated P. radiata framing timber (97 x 47 mm) were selected from
production lines at CHH (bifenthrin) and Hyne & Son (permethrin) mills according to
standard QC sampling protocols. End-matched samples were submitted for NIR analysis
and for standard wet-chemical analysis in a blind analysis. The wet chemical analyses
were undertaken by Arch (permethrin) and Symbio for Osmose (bifenthrin).
NIR spectra were acquired on the matched samples and values of retention were
predicted using the NIR calibrations established in the previous section. The NIR-
predicted values were submitted to Arch and Hyne & Son in the case of permethrin and
Osmose and CHH in the case of bifenthrin for comparison with retention levels
determined by traditional chemical analysis. The actual retention levels were then
released to CSIRO for final data analysis to determine the accuracy of the NIR
predictions.
Multivariate Analysis Partial least squares regression (PLS) was performed using the individual NIR spectra as the
X-matrix and the respective retention values (target, theoretical or actual) as the Y-vector, or
predictor variable. PLS regression of NIR spectra operates by reducing the dimension of the
spectrum (often hundreds of data points) to a few principal components that represent the
greatest variance in the spectra while at the same time ensuring that the principal components
correlate with the variance observed in the predictor variable. This is achieved in practicality
by successive iterations of data reduction and variance extraction until the model “converges”

16
to an minimum value of residual variance, after which any additional attempt to extract
variance results in an increase in the residual variance. The point at which the first minimum
occurs is generally selected as being the optimum calibration model. This point is
characterised by; the number of principal component required to reach this minimum, the
coefficient of determination (r2) and the root-mean-square-error-of-prediction. In addition the
Scores plot provides a visual overview as to the relationship between individual samples in
terms of their distance from the mean value, while the Loadings plot provides visual overview
of the region(s) within the spectrum that give rise to the greatest variance. More detail can be
found in Martens and Næs (1991).

17
Results Unless otherwise specified the results presented are based on spectra acquired using the
laboratory MPA instrument.
Theoretical Retention
Plots of theoretical retention, and actual retention, of permethrin vs target retention
levels are shown in Figure 11. This shows strong correlation between the theoretical
retention and the target retention with an r2 value of 0.908 and between the actual retention
and the target retention with an r2 value of 0.907. The correlation between theoretical and
actual retention values (not shown) is similar with an r2 value of 0.909. Note that coincident
points account for the impression of missing points for target retentions of 0.02 and 0.03 %
retention between the two plots.
Target permethrin retention (% w/w)
0.005 0.010 0.015 0.020 0.025 0.030 0.035
Ther
oetic
al p
erm
ethr
in re
tent
ion
(% w
/w)
0.000
0.005
0.010
0.015
0.020
0.025
0.030
0.035
Target permethrin retention (% w/w)
0.005 0.010 0.015 0.020 0.025 0.030 0.035
Ana
lyse
d pe
rmet
hrin
rete
ntio
n (%
w/w
)
0.005
0.010
0.015
0.020
0.025
0.030
0.035
Figure 11 Plot of (left) theoretical retention vs target retention and (right) actual retention vs target retention for permethrin treated calibration samples.
By contrast, plots of theoretical retention, and actual retention, of bifenthrin vs target
retention levels are shown in Figure 12. In the case of the theoretical retention for
bifenthrin there is good correlation with the four target levels chosen for calibration
purposes (r2 = 0.912). However it clearly shows poor agreement between the actual
retention values for bifenthrin (as determined by GC-MS of the extract) and the target
retention levels (r2 = 0.01). Even allowing for the abnormally high value (0.069 %) for

18
the target retention of 0.015 % the correlation coefficient is still only 0.08, due to the
very low analytical values for samples with nominally high target loadings.
Target bifenthrin retention (% w/w)
0.010 0.015 0.020 0.025 0.030 0.035
Ther
oetic
al b
ifent
hrin
rete
ntio
n (%
w/w
)
0.010
0.015
0.020
0.025
0.030
0.035
Target bifenthrin retention (% w/w)
0.010 0.015 0.020 0.025 0.030 0.035A
naly
sed
bife
nthr
in re
tent
ion
(% w
/w)
0.00
0.01
0.02
0.03
0.04
0.05
0.06
0.07
0.08
Figure 12 Plot of (left) theoretical retention vs target retention and (right) actual retention vs target retention for bifenthrin treated calibration samples.
In order to explore the error in the bifenthrin data, the samples were re-analysed by a second
laboratory. The results of the analyses from both laboratories is given in Figure 13. Both
laboratories show the identical samples as having an elevated retention while all other
samples show very low retention. The reasons for this are not obvious at this stage but may
stem from any of the possible sources of analytical error mentioned previously.

19
Target bifenthrin retention (% m/m)
0.010 0.015 0.020 0.025 0.030 0.035
Ana
lytic
al re
tent
ion
(AS
1605
.3) (
% m
/m)
0.00
0.05
0.10
0.15
0.200.60
0.65
0.70
Lab A Lab S
Figure 13 Plot of analytically-determined vs theoretical retention of bifenthrin.
The analysis of pyrethroid retention according to AS1605.3 requires the sectioning of
the surface to the required depth (2 mm bifenthrin, 5 mm permethrin) and extraction of
the active via sonication in a solvent (acetone in the case of bifenthrin and ethanol in the
case of permethrin). The extracts are analysed for active concentration via GC-ECD
(bifenthrin) or HPLC with detection at 232 nm (permethrin) calibrated against solutions
of known concentration.
NIR Calibration of Actual Retention Initial attempts to calibrate the NIR spectra with bifenthrin and/or permethrin retention are
based solely on the use of theoretical retention values from solution uptake data. The plot of
NIR-predicted bifenthrin retention vs the bifenthrin retention based on uptake data is shown
in Figure 14. While the calibration data is excellent (R2 = 0.991) the cross-validation data is
only moderate (r2 = 0.74) indicating that the model is potentially not very robust. For
permethrin however the coefficients of determination for calibration and validation are R2 =
0.974 and r2 = 0.87 respectively, indicating that the model is potentially stable.

20
Theoretical bifenthrin retention (% m/m)
0.012 0.014 0.016 0.018 0.020 0.022 0.024 0.026 0.028 0.030 0.032
NIR
-pre
dict
ed th
eore
tical
bife
nthr
in re
tent
ion
(% m
/m)
0.012
0.014
0.016
0.018
0.020
0.022
0.024
0.026
0.028
0.030
0.032
Calibration, R2 = 0.99Cross validation, r2 = 0.74
Figure 14 Predicted vs actual plot of the theoretical bifenthrin retention based on uptake data.
Table 4 shows the summary calibration statistics for NIR determination of active
compound retention in P. radiata. This shows that the calibrations for the pyrethroid
actives are well correlated and have errors ~15-20% of the target retention. That is to
say for bifenthrin the error is ±0.003% on the target retention of 0.02% and for
permethrin the error is ±0.002%. No outliers were detected in the calibration set. The
predicted vs actual retention plots for the calibration and cross-validation of permethrin
and bifenthrin are shown in Figure 15.
However for the azole treatment, four outliers (from 25 total) were removed due to
erroneous spectral data. With these removed the calibration statistics appear
reasonable with an error of ±0.02% for total azole with a target retention of 0.06% (i.e. a
relative error of 30%). The reason for this high error and for the calibration not
performing well is not yet apparent. Again the calibration coefficient of determination is
high (R2 ≥ 0.99) but for validation the r2 value is less than 0.6, indicating a poor performing
model. All further results and discussion will be confined to the pyrethroids.

21
Table 4 Summary statistics for calibration of active retention (%) by NIR. Full range NIR (1,000-2,500 nm), 2nd derivative.
ACTIVE INGREDIENT N PCS REQD R2 (Calib) r2 (Valid) RMSECV
Bifenthrin 28 5 0.991 0.74 0.003
Permethrin 20 4 0.974 0.87 0.002
Tebuconazole 25 6 0.990 0.57 0.008
Propiconazole 25 6 0.992 0.52 0.009
Total azole* 25 6 0.990 0.55 0.02
* The azole calibration converged once 5 validation outlier samples were removed. The reason for them being outliers is not obvious from either the NIR spectra or wood samples.
Actual permethrin retention (% m/m)
0.000 0.005 0.010 0.015 0.020 0.025 0.030
NIR
-pre
dict
ed p
erm
ethr
in re
tent
ion
(% m
/m)
0.000
0.005
0.010
0.015
0.020
0.025
0.030
Calibration, R2 = 0.97 Cross validation, r2 = 0.87
Actual bifenthrin retention (% m/m)
0.010 0.015 0.020 0.025 0.030 0.035
NIR
-pre
dict
ed b
ifent
hrin
rete
ntio
n (%
m/m
)
0.010
0.015
0.020
0.025
0.030
0.035
Calibration, R2 = 0.94Cross validation, r2 = 0.74
Figure 15 Predicted vs actual plots of (left) permethrin and (right) bifenthrin based on analytical values of retention.
Table 5 summarises the calibration statistics for calibration models of permethrin and
bifenthrin prediction using a subset of the MPA’s full spectral range in order to simulate the
two common spectral ranges found in lower cost portable instruments, namely 1,000-1,800
nm and 1,600-2,400 nm. This shows that there is only a slight decrease in the calibration
performance, but this is achieved through an increase in the number of principal components
required for the model to converge (i.e. reach an optimum low value of residual variance).
The use of a portable instrument is discussed in the next section.

22
Table 5 Summary statistics for calibration of active retention (%) by NIR. Reduced range NIR (MPA lab instrument), 2nd derivative.
ACTIVE INGREDIENT PCS REQD R2 (Calib) r2 (Valid) RMSECV
Bifenthrin
1,000-1,800 nm 8 0.99 0.73 0.003
1,600-2,400 nm 5 0.96 0.82 0.002
Permethrin
1,000-1,800 nm 8 0.97 0.80 0.003
1,600-2,400 nm 5 0.98 0.85 0.0025
Retention calibration – CDI instrument Table 6 shows the calibration statistics for the calibration of bifenthrin and permethrin
retention in the calibration samples using the Control Development Inc (CDI) instrument.
This shows that while it is still possible to develop a calibration model for retention using the
portable CDI instrument, the calibrations are of poorer quality than the laboratory-based MPA
for all aspects of the model. The models require more principal components to converge the
model, the coefficients of determination for both the calibration and validation set are lower
and the RMSEP is higher. Given further sampling for the calibration it should however be
possible to improve the quality of these calibrations.
Table 6 Summary statistics for calibration of active retention (%) by NIR (CDI 1,100-2,200 nm).
ACTIVE INGREDIENT PCS REQD R2 (Calib) r2 (Valid) RMSECV
Bifenthrin 7 0.92 0.70 0.005
Permethrin 6 0.93 0.79 0.003
Assignment of NIR bands The regions that contribute to the correlation between %active and NIR spectrum,
referred to as the PLS loadings can be interpreted to provide an understanding of what
is giving rise to the correlation from a chemical perspective. The NIR loadings for the 2nd
derivative PLS calibration of bifenthrin and permethrin are given in Figure 16 and
Figure 17 respectively for the first two principal components. The corresponding
percentage explained variance for the first three principal components are given in
Table 7, indicating that for the first three principal components approximately 90% of

23
the variance in the NIR spectra explains 85% of the variance observed in the
corresponding retention values.
Tentative assignment of the key absorbances in the loadings for the first two principal
components are given in Table 8. Surprisingly they do not depict absorbances identified
with the pyrethroid itself (eg aromatic or halogen absorbances) but instead relate to the
cellulose composition in particular.
Figure 16 Raw spectrum of treated P. radiata sapwood plus PLS loading weights of NIR X-matrix for calibration of bifenthrin retention (Components 1 and 2).

24
Figure 17 Raw spectrum of treated P. radiata sapwood plus PLS loading weights of NIR X-matrix for calibration of permethrin retention (Components 1 and 2).
Table 7 % variance explained for the X-block (NIR) and Y-block (% active) data for the first three principal components for correlation of NIR with pyrethroid retention.
ACTIVE INGREDIENT % X EXPLAINED % Y EXPLAINED
Bifenthrin
PC 1 52 20
PC 2 28 32
PC 3 9 32
Total for 3 PCs 89 84
Permethrin
PC 1 77 33
PC 2 5 51
PC3 9 3
Total for 3 PCs 91 87
Figure 18 displays the raw spectra for both permethrin and bifenthrin as well as the loading
for the first principal component of the calibrations for permethrin and bifenthrin retention.

25
This clearly shows that the absorbances identified in the loadings plots do not correlate with
the key absorbances of either permethrin or bifenthrin.
Table 8 Loadings for 2nd derivative PLS calibration of pyrethroid retention (from Schwanninger et al. 2011).
WAVENUMBER (CM-1) WAVELENGTH (nm) ASSIGNMENT
BIFENTHRIN
4446 2248 ?
5347 1870 Water and –O-H stretch
7246 1380 C-H 2nd overtone stretch of methyl, - CH3
PERMETHRIN
4444 2250 ?
5263 1900 C=O 3rd overtone stretch
These absorbance frequencies do not appear to be characteristic of the pyrethroids per se, as
they do not appear in the spectra of the neat solutions of permethrin or bifenthrin. This may
explain in part the poor validation statistics with respect to the calibration statistics.
Figure 18 Raw spectra of bifenthrin and permethrin and the first principal component for permethrin and bifenthrin calibrations based on second derivative NIR spectra.

26
NIR Prediction of Retention in Run-of-mill Samples The calibration algorithms developed using the standard samples were used to predict the
retention values of run-of-mill samples and the results are given in Appendix 2 and Appendix
3 and Figure 19 and Figure 20 for permethrin and bifenthrin respectively. In the case of
permethrin, the NIR predicts all the samples to have retention values greater than the requisite
0.02% and this is supported by the analytical data. However the correlation between the NIR-
predicted values and the analytical values is low, r2 = 0.3.
Actual permethrin retention (% m/m)
0.01 0.02 0.03 0.04 0.05
NIR
-pre
dict
ed p
erm
ethr
in (%
m/m
)
0.01
0.02
0.03
0.04
0.05
Figure 19 Plot of NIR-predicted retention vs actual retention for permethrin in run-of-mill samples. The dashed lines represent the required standard retention of 0.02%.

27
The results of the actual retention of bifenthrin show a number of samples to be well over the
required retention of 0.02%, with a number of samples being well above 0.05%. This would
lead to comsumption of active compound being far more than is practicably required.
Actual bifenthrin retention (% m/m)
0.01 0.02 0.03 0.04 0.05 0.06 0.07 0.08
NIR
-pre
dict
ed b
ifent
hrin
rete
ntio
n (%
m/m
)
0.01
0.02
0.03
0.04
0.05
0.06
0.07
0.08
Figure 20 Plot of NIR-predicted retention vs actual retention for bifenthrin in run-of-mill samples, using the laboratory calibration. The dashed lines represent the required standard retention of 0.02%. The shaded region is outside of the range of the calibration.
For the bifenthrin run-of-mill samples, the NIR predicts all the samples to have retentions
greater than 0.02% (Figure 20, Appendix 3) with the exception of one sample, predicted by
NIR as having a retention of 0.018%, while having an analytically determined retention of
0.028%. All of the samples have analytically determined retentions greater than 0.02% for
bifenthrin, in fact many have considerably high retentions, which are outside of the range of
the initial calibration (0.014 – 0.033%, Figure 15). As a result there is considerable error in
the predictions for those samples with exceedingly high actual retention despite them being
predicted as being above the required minimum for the standard.

28
A new NIR calibration was developed for bifenthrin to accommodate the high retention
values exhibited by some of the run-of-mill samples (Figure 21). This calibration is based on
the initial calibration set plus the run-of-mill samples. Note that the calibration range now
extends from ca. 0.01 to 0.06 % retention, although there is a gap in the range between 0.045
and 0.055. The validation set of this extended model shows that it is able to predict high
retention values and this calibration could now be used to predict retention in fresh run-of-
mill samples, particularly where high retention values may exist.
Actual bifenthrin retention (% m/m)
0.00 0.01 0.02 0.03 0.04 0.05 0.06 0.07
NIR
-pre
dict
ed b
ifent
hrin
rete
ntio
n (%
m/m
)
0.00
0.01
0.02
0.03
0.04
0.05
0.06
0.07
Calibration, R2 = 0.82Validation, r2 = 0.66
Figure 21 New calibration plot of predicted vs actual plots of bifenthrin based on analytical values of retention for run-of-mill samples including samples with high analytically-determined retention.

29
Discussion
Calibration of an NIR spectrometer to predict pyrethroid retention in pine sapwood has shown
encouraging results. Calibration using the theoretical retention data for bifenthrin is superior
to that using actual retention data, suggesting there is error in the analytical values. Šťávová et
al. (2011) have studied the extraction and analysis of a number of wood preservatives and
have shown that there is indeed considerable source of potential error. In particular they claim
that simple sonication of wood samples has the lowest extraction efficiency, and is even
worse when samples are not milled. Their recommended analytical protocol requires (i)
grinding of the wood samples, (ii) Soxhlet extraction with acetone (not sonication), (iii)
purification of the analyte with MCAX SPE1 followed by (iv) GC-MS analysis. Note that
mass-selective detection is used and not electron capture detection, providing an additional
level of specificity. In addition it is believed that standard solutions for calibration of
chromatography systems are prone to degradation unless they are stored in dark bottles in the
dark (Powell, pers comm.). Furthermore there is potential for considerable error to be
introduced when sectioning the surface layer (2 mm or 5 mm) of the test boards (Lobb, pers
comm.). All of these potentially contribute to the total error of analysis.
Given that the depth sectioning and extraction processes may contribute significantly to the
error in analysis, the use of NIR with a preset depth gauge removes any variance error due to
sectioning and replaces the error with a constant, but reproducible bias. Similarly the ability
of NIR to determine retention in situ without the need for extraction removes another source
of error.
Retention calibrations developed using the portable, low-cost Control Development Inc (CDI)
instrument, had poorer quality than the laboratory-based MPA. It is likely however that
additional calibration samples could improve the quality of these models for bifenthrin and
particularly permethrin retention.
The calibration loadings for both bifenthrin and permethrin are not readily ascribable to the
respective spectra of the neat compounds although the loadings for both of the pure
compounds show absorbances around 1860 nm which is attributable to C-halide stretching. In
the spectra of the treated wood samples this however is swamped by the very broad O-H
stretching overtone and combination bands from water (1940 nm), cellulose (1820 nm) and
1 MCAX SPE – Mixed-Mode Cation Exchange Solid Phase Extraction

30
hemicellulose (1930 nm). Treated samples however do show sufficient variation to give rise
to correlation with the variance observed in the pyrethroid retention.
While all of the run-of-mill samples had retention values for both bifenthrin and permethrin
above the level required in the Standard, there were instances for both treatments where the
retention levels were double that required. This represents an increased chemical cost to the
producer which is explained in part by the lead time between sampling and analytical
reporting using the Standard method that results in producers erring on the conservative side
of treatment. While NIR lacks the analytical accuracy to replace the Standard method
(although there are questions around the error of this Standard), it does provide a method that
would allow at-mill quality control to be performed thereby enabling rapid feedback on
retention to treatment operators. This in turn would allow the operators to better control
treatment to reduce the amount of over-treatment that occurs. Note that this would not remove
the need for sampling and testing via Standard methods, it would be an aid to the operator in
optimising the treatment process by allowing more frequent and rapid feedback on treatment
performance.

31
Conclusions Near infrared spectra of pyrethroid treated radiata pine, with known retention, have been used
to develop calibration models to predict retention in unknown samples, using second
derivative spectra. Using laboratory-prepared calibration samples at a range of target retention
levels, correlations were established between the:
• Theoretical retention and target retention levels for both bifenthrin and permethrin
with coefficients of determination of 0.91 and 0.91 respectively.
• Actual retention and target retention for both bifenthrin and permethrin with
coefficients of determination of 0.01 and 0.91 respectively.
• Actual retention and NIR-predicted retention for both bifenthrin and permethrin with
coefficients of determination of 0.94 and 0.97 respectively for the calibration step and
0.74 and 0.87 respectively for the validation step. These calibrations were then used
for prediction of retention levels in run-of-mill samples.
When the NIR calibrations established above were used to predict the retention level of active
compound in run-of-mill samples, NIR spectra obtained from unknown samples predicted:
• all samples as passing the retention standard for permethrin, which was consistent
with the analytically measured result.
• all but one sample as passing the retention standard for bifenthrin, whereas the
analytically measured results suggested that all 40 samples passed the standard.
The current results suggest that NIR could potentially be used to rapidly determine the
permethrin retention in radiata pine, but additional sampling, and careful wet chemical
analysis, is required to establish a similarly suitable calibration for bifenthrin retention.
Potentially, low-cost transportable NIR systems could be calibrated to predict the retention
levels in pine timber instead of (or maybe in addition to) classical quality control sampling.
Given the ease and speed of NIR sampling it could potentially provide in-mill quality control
in near real-time as opposed to costly and slow traditional analysis in off-site laboratories.
32
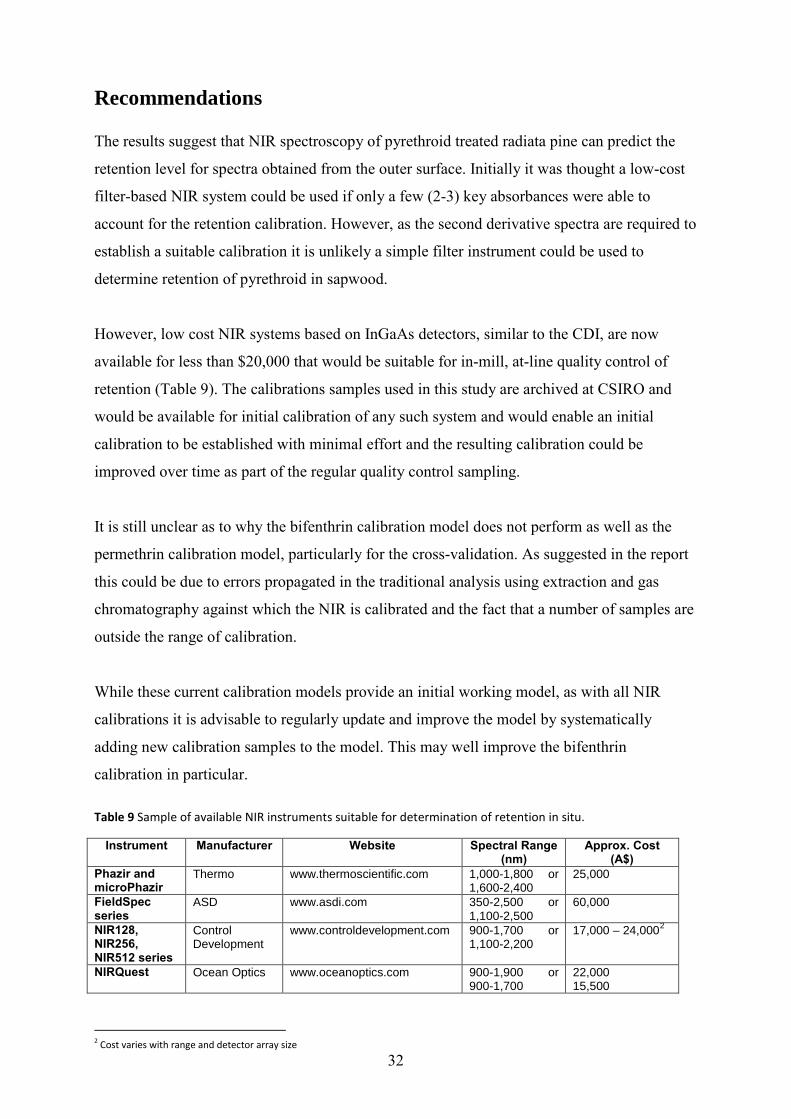
Recommendations The results suggest that NIR spectroscopy of pyrethroid treated radiata pine can predict the
retention level for spectra obtained from the outer surface. Initially it was thought a low-cost
filter-based NIR system could be used if only a few (2-3) key absorbances were able to
account for the retention calibration. However, as the second derivative spectra are required to
establish a suitable calibration it is unlikely a simple filter instrument could be used to
determine retention of pyrethroid in sapwood.
However, low cost NIR systems based on InGaAs detectors, similar to the CDI, are now
available for less than $20,000 that would be suitable for in-mill, at-line quality control of
retention (Table 9). The calibrations samples used in this study are archived at CSIRO and
would be available for initial calibration of any such system and would enable an initial
calibration to be established with minimal effort and the resulting calibration could be
improved over time as part of the regular quality control sampling.
It is still unclear as to why the bifenthrin calibration model does not perform as well as the
permethrin calibration model, particularly for the cross-validation. As suggested in the report
this could be due to errors propagated in the traditional analysis using extraction and gas
chromatography against which the NIR is calibrated and the fact that a number of samples are
outside the range of calibration.
While these current calibration models provide an initial working model, as with all NIR
calibrations it is advisable to regularly update and improve the model by systematically
adding new calibration samples to the model. This may well improve the bifenthrin
calibration in particular.
Table 9 Sample of available NIR instruments suitable for determination of retention in situ.
Instrument Manufacturer Website Spectral Range (nm)
Approx. Cost (A$)
Phazir and microPhazir
Thermo www.thermoscientific.com 1,000-1,800 or 1,600-2,400
25,000
FieldSpec series
ASD www.asdi.com 350-2,500 or 1,100-2,500
60,000
NIR128, NIR256, NIR512 series
Control Development
www.controldevelopment.com 900-1,700 or 1,100-2,200
17,000 – 24,0002
NIRQuest Ocean Optics www.oceanoptics.com 900-1,900 or 900-1,700
22,000 15,500
2 Cost varies with range and detector array size

33
References
AS 1604.1 (2012) Specification for preservative treatment, Part 1: Sawn and round
timber.
AS/NZS 1605.3 (2006) Methods for sampling and analysing timber preservatives and
preservative-treated timber. Part 3: Analysis methods for determination of
preservative retention.
Bush D, McCarthy K and Meder R (2011) Genetic variation of natural durability traits in
Eucalyptus cladocalyx (sugar gum). Annals of Forestry Science, 68(6):1057-1066.
Downes GM, Meder R, Hicks C and Ebdon N (2009) Developing and evaluating a
multisite and multispecies NIR calibration for the prediction of Kraft pulp yield in
Eucalypts. Southern Forests, 71(2):155-164.
Downes GM, Meder R, Harwood CE, Evans R, Ebdon N, Bond H, Joyce K and Southerton S
(2010) Radial variation in cellulose content and Kraft pulp yield in Eucalyptus
nitens using NIR spectral analysis of air-dry wood surfaces. Journal of Near Infrared
Spectroscopy, 18(2):147-155.
Downes GM, Meder R, Bond H, Ebdon N, Hicks C, Harwood CE and Evans R (2011)
Measurement of cellulose content, Kraft pulp yield and basic density in eucalypt
woodmeal using multi-site and species near infra-red spectroscopic calibrations.
Southern Forests, 73(3&4):181-186.
Gowan AA, Tsuchikawa Y, O’Donnell C and Tsenkova R (2011) Investigation of the
potential of Near Infrared spectroscopy for the detection and quantification of
pesticides in aqueous solution. American Journal of Analytical Chemistry, 2:53-62.
Hoffmeyer P and Pedersen JG (1995) Evaluation of density and strength of Norway
spruce wood by near infrared reflectance spectroscopy. European Journal of Wood
and Wood Products, 53(3):165-170.
Hunt AC, Humphrey DG, Wearne R and Cookson LJ (2005) Permenance of Permethrin
and Bifenthrin in Framing Timbers Subjected to Hazard Class 3 Exposure.
International Research Group on Wood Protection, IRG/WP 11-20467, Stockholm,
Sweden. 10 pp.
Jones TG, Meder R, Low CB, O’Callahan DR, Chittenden CM, Ebdon N, Thumm A and
Riddell M (2011) Natural durability of the heartwood of coast redwood [Sequoia
sempervirons (D. Don) Endl.] in New Zealand and its prediction using near-infrared
spectroscopy. Journal of Near Infrared Spectroscopy, 19(5):381-389.

34
Martens H and Næs T (1991) Multivariate Calibration. John Wiley & Sons, Chichester, UK.
Meder R, Gallagher S, Kimberley M, Uprichard M and Mackie K (1994) Prediction of wood
chip and pulp and paper properties via multivariate analysis of spectral data. 48th
Appita Annual General Conference, May 2-6, Melbourne, Australia, pp 479-484.
Meder R, Thumm A and Marston D (2003) Sawmill trial of at-line prediction of recovered
lumber stiffness by NIR spectroscopy of radiata pine cants. Journal of Near Infrared
Spectroscopy, 11(2):137-143.
Meder R, Ebdon N, Marston D and Evans R (2010) Spatially-resolved radial scanning of
tree increment cores for NIR prediction of wood properties. Journal of Near
Infrared Spectroscopy, 18(6):499–505.
Meder R and Meglen RR (2012) NIR spectroscopic and hyperspectral imaging of
compression wood in Pinus radiata. Journal of Near Infrared Spectroscopy, 20(4), in
press.
Michell AJ (1995) Pulpwood quality estimation by near-infrared spectroscopic measurements
on eucalypt woods. Appita Journal, 48(6):425.
Mora CR, Schimleck LR and Isik F (2008) Near infrared calibration models for the
estimation of wood basic density in Pinus taeda using repeated sample
measurements. Journal of Near Infrared Spectroscopy, 16(6):517-528.
Moros J, Armenta S, Garrigues S and de la Guardia M (2006) Univariate near infrared
methods for determination of pesticides in agrochemicals. Analytica Chimica Acta,
579:17-24.
Morrell JJ, Bell L, Norton J and Shaw C (2011) Investigating Extraction of Bifenthrin from
Composite Wood Products. International Research Group on Wood Protection, IRG/WP
11-20467, Stockholm, Sweden. 10 pp.
Poke FS and Raymond CA (2006) Predicting extractives, lignin, and cellulose contents
using near infrared spectroscopy on solid wood in Eucalyptus globulus. Journal of
Wood Chemistry and Technology, 26:187-199.
Shenk JS, Workman JJ Jr and Westerhaus MO (2008) Application of NIR spectroscopy to
agricultural products. In: Handbook of Near-Infrared Analysis. Third Edition. Burns
DA and Ciurczak EW (Eds). CRC Press, Boca Raton. pp. 347-386.
Schimleck LR and Evans R (2002) Estimation of microfibril angle of increment cores by
near infrared spectroscopy. IAWA Journal, 23(3):225-234.
Schoknecht U, Fürhapper C, Gunschera J, Härtner H, Hill R, Melcher E, Schwarz G,
Spetmann P, Wilken U, Wittenzellner J and Wobst M (2008) Bestimmung von
Permethrin in Holz – Ergebnisse von Vergleichsanalysen (Determination of
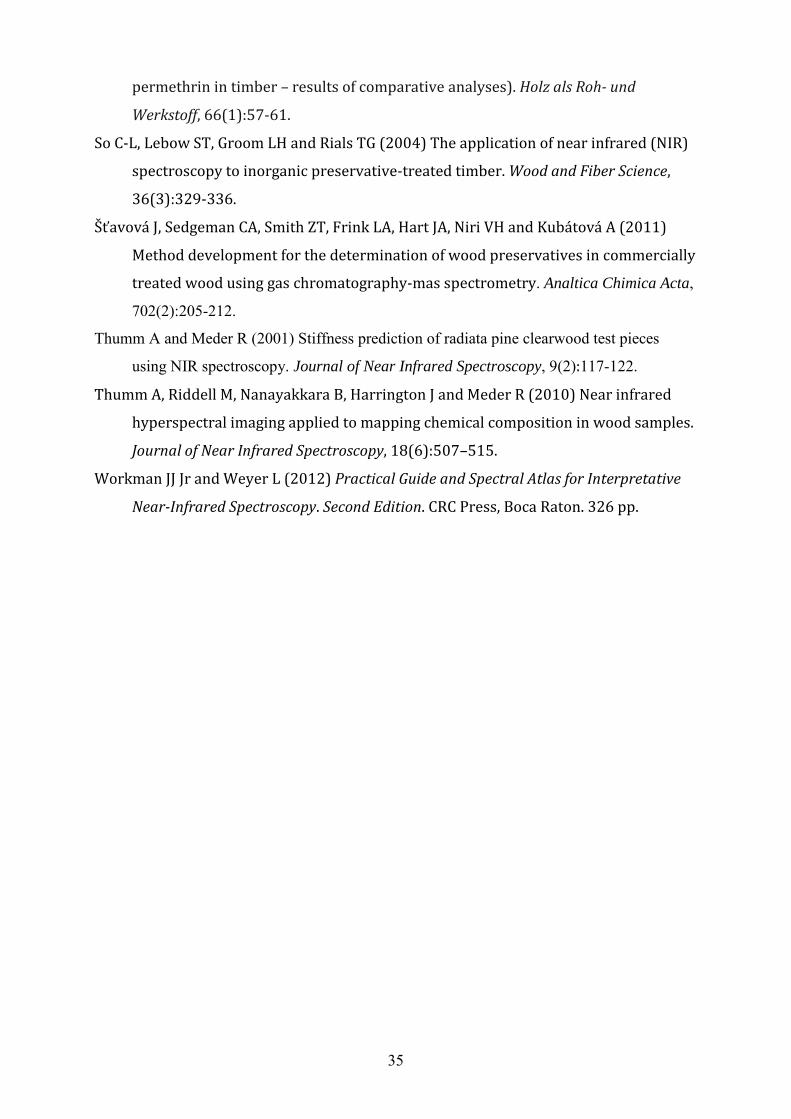
35
permethrin in timber – results of comparative analyses). Holz als Roh- und
Werkstoff, 66(1):57-61.
So C-L, Lebow ST, Groom LH and Rials TG (2004) The application of near infrared (NIR)
spectroscopy to inorganic preservative-treated timber. Wood and Fiber Science,
36(3):329-336.
Šťavová J, Sedgeman CA, Smith ZT, Frink LA, Hart JA, Niri VH and Kubátová A (2011)
Method development for the determination of wood preservatives in commercially
treated wood using gas chromatography-mas spectrometry. Analtica Chimica Acta,
702(2):205-212.
Thumm A and Meder R (2001) Stiffness prediction of radiata pine clearwood test pieces
using NIR spectroscopy. Journal of Near Infrared Spectroscopy, 9(2):117-122.
Thumm A, Riddell M, Nanayakkara B, Harrington J and Meder R (2010) Near infrared
hyperspectral imaging applied to mapping chemical composition in wood samples.
Journal of Near Infrared Spectroscopy, 18(6):507–515.
Workman JJ Jr and Weyer L (2012) Practical Guide and Spectral Atlas for Interpretative
Near-Infrared Spectroscopy. Second Edition. CRC Press, Boca Raton. 326 pp.

36
Acknowledgements Partial funding for this project from Forest and Wood Products Australia (FWPA) is
gratefully acknowledged.
Supply of mill-treated samples from Carter Holt Harvey and Hyne & Son and the supply of
calibration samples along with the analysis of the preservative retention levels of the
calibration samples by Arch (now Lonza) and Osmose is also gratefully acknowledged, as is
the assistance of David Humphrey (Lonza) and Steve Crimp (Osmose).
Several valuable discussions and communications are acknowledged during the preparation of
this report, specifically; David Humphrey, Steve Crimp, Kim Harris (CHH), Steven Holtorf
(Hyne & Son), Alan Preston (ex Viance, Apterus), James Hague (AFRC), Paul Lobb and
Noel Coxhead (Zelam) and Michael Powell (Biotica EC).

37
Appendices
Appendix 1. Hazard class selection guide
HAZZARD CLASS EXPOSURE BIOLOGICAL HAZARD TYPICAL USES
H1 Inside, above ground Insects other than termites Framing, flooring, interior joinery
H2 & H2F Inside, above ground Borers and termites Framing, flooring
H3 Outside, above ground Moderate decay, borers and termites
Weatherboard, fascia, window joinery, framing and decking
H4 Outside, in-ground Severe decay, borers and termites Fence posts, pergolas, landscape timbers
H5 Outside, in-ground, with or in fresh water
Very severe decay, borers and termites
Retaining walls, piling, stumps
H6 Marine water exposure Marine wood borers and decay Marine piles, jetty cross-bracing
Source: taken from AS1604.1-2000

38
Appendix 2. Actual and NIR-predicted retention rates for permethrin-treated run-of-mill timber.
NIR ID MILL ID ACTUAL RETENTION (% w/w) NIR-PREDICTED RETENTION (% w/w)
1104074 1 0.031 0.030
1104075 2 0.027 0.032
1104076 3 0.042 0.037
1104077 4 0.046 0.037
1104078 5 0.037 0.043
1104079 6 0.039 0.039
1104080 7 0.043 0.032
1104081 8 0.027 0.033
1104082 9 0.038 0.041
1104083 10 0.033 0.031
1104087 U29A 0.039 0.033
1104088 U29B 0.028 0.029
1104089 31A 0.024 0.032
1104090 32A 0.024 0.033
1104091 33A 0.024 0.030
1104092 35A 0.029 0.033
1104093 36A 0.046 0.034

39
Appendix 3. Actual and NIR-predicted retention rates for bifenthrin-treated run-of-mill timber.
NIR ID MILL ID ACTUAL RETENTION (% w/w) NIR-PREDICTED RETENTION (% w/w)
1104094 O-S1 0.020 0.035
1104095 O-S2 0.021 0.029
1104096 O-S3 0.021 0.024
1104097 O-S4 0.028 0.026
1104098 O-S5 0.024 0.024
1104099 O-S6 0.020 0.026
1104100 O-S7 0.024 0.025
1104101 O-S8 0.020 0.026
1104102 O-S9 0.026 0.026
1104103 O-S10 0.030 0.026
1104104 M2834 S1 0.040 0.025
1104105 M2835 S2 0.054 0.025
1104106 M2836 S3 0.038 0.027
1104107 M2837 S4 0.054 0.025
1104108 M2838 S5 0.057 0.027
1104109 M2839 S6 0.041 0.025
1104110 M2840 S7 0.041 0.024
1104111 M2841 S8 0.057 0.024
1104112 M2842 S9 0.068 0.025
1104113 M2843 S10 0.066 0.024
1104114 CS1 0.035 0.026
1104115 CS2 0.037 0.025
1104116 CS3 0.038 0.029
1104117 CS4 0.043 0.025
1104118 CS5 0.031 0.026
1104119 CS6 0.029 0.019
1104120 CS7 0.026 0.027
1104121 CS8 0.029 0.023
1104122 CS9 0.024 0.026
1104123 CS10 0.021 0.024
1104124 TS1 0.067 0.025
1104125 TS2 0.067 0.025
1104126 TS3 0.073 0.024
1104127 TS4 0.050 0.024
1104128 TS5 0.043 0.023
1104129 TS6 0.044 0.025
1104130 TS7 0.030 0.024
1104131 TS8 0.039 0.024
1104132 TS9 0.038 0.024
1104133 TS10 0.032 0.024