Embed Size (px)
Citation preview
When your company is a link in the middle of a multi-billion-dollar sup-ply chain, mastery of supplier qual-ity management is paramount to your ability to satisfy the demands of your downstream customers. If your clients are among the most sought-after consumer brands, you are under constant pressure to deliver high quality products at competitive prices. Suppliers’ quality determines your own, so the ability to pinpoint and eliminate potential problems is a critical success factor to you.
Pennsylvania-based Graham Packaging Company manufactures more than 20 billion blow-molded containers annually for a marquis client list that includes The Coca-Cola Company, H. J. Heinz Company, PepsiCo, Unilever and Pennzoil. The inde-pendent, privately-held company operates 81 plants in 16 countries, generating more than $2 billion in annual sales. Graham Packaging has hundreds of vendors that supply raw materials such as resins and color and finished parts such as caps and labels. The company uses multiple vendors for each component in order to support its distributed production facilities and foster competition among the vendors. However, in order to maintain high quality standards, Graham Packaging needed a consistent way for the plant managers and the Global Supplier Quality team to collectively drive performance.
Supplier Quality Management Team Hindered by Difficulty Accessing and Consolidating InformationInformation required by the Global Supplier Quality team was dispersed throughout the organization in SAP, in spreadsheets and in other informal systems. Numerous technol-ogy challenges had to be overcome in order to systematically improve supplier manage-ment, including:
� A user-friendly front end was needed to enable access to Graham Packaging’s SAP and other applications. Plant managers, quality engineers, the global sup-plier quality team or executive management were unable to view quality trends or drill into other KPIs such as PPM defects or on-time delivery. These applications required IT resources for minor report modifications such as to add KPIs or change a view.
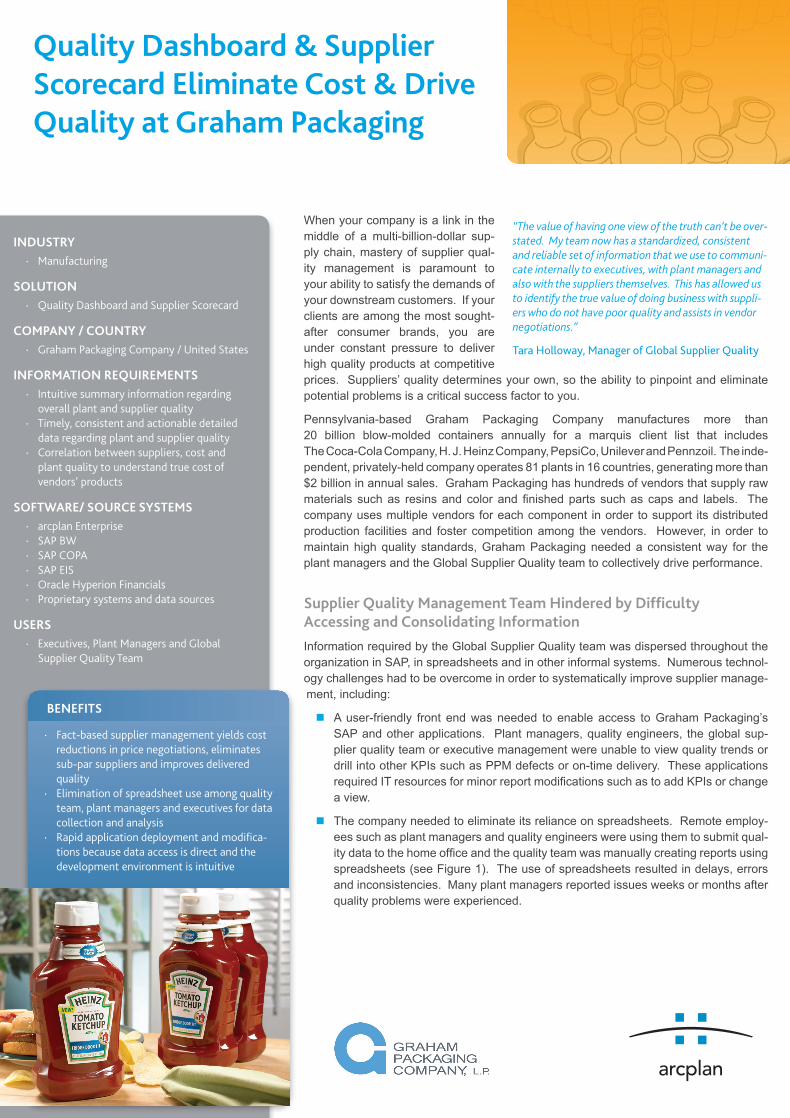
� The company needed to eliminate its reliance on spreadsheets. Remote employ-ees such as plant managers and quality engineers were using them to submit qual-ity data to the home office and the quality team was manually creating reports using spreadsheets (see Figure 1). The use of spreadsheets resulted in delays, errors and inconsistencies. Many plant managers reported issues weeks or months after quality problems were experienced.
INDUSTRY · Manufacturing
SOLUTION · Quality Dashboard and Supplier Scorecard
COMPANY / COUNTRY · Graham Packaging Company / United States
INFORMATION REQUIREMENTS · Intuitive summary information regarding
overall plant and supplier quality · Timely, consistent and actionable detailed
data regarding plant and supplier quality · Correlation between suppliers, cost and
plant quality to understand true cost of vendors’ products
SOFTWARE/ SOURCE SYSTEMS · arcplan Enterprise · SAP BW · SAP COPA · SAP EIS · Oracle Hyperion Financials · Proprietary systems and data sources
USERS · Executives, Plant Managers and Global
Supplier Quality Team
Quality Dashboard & Supplier Scorecard Eliminate Cost & Drive Quality at Graham Packaging
BENEFITS
· Fact-based supplier management yields cost reductions in price negotiations, eliminates sub-par suppliers and improves delivered quality
· Elimination of spreadsheet use among quality team, plant managers and executives for data collection and analysis
· Rapid application deployment and modifica-tions because data access is direct and the development environment is intuitive
“The value of having one view of the truth can’t be over-stated. My team now has a standardized, consistent and reliable set of information that we use to communi-cate internally to executives, with plant managers and also with the suppliers themselves. This has allowed us to identify the true value of doing business with suppli-ers who do not have poor quality and assists in vendor negotiations.”
Tara Holloway, Manager of Global Supplier Quality
cs_graham_EN.indd 1 05.03.2010 15:26:02
arcplan-Powered Quality Dashboard and Supplier Scorecard Save Millions and Revolutionize Supplier ManagementSAP Analyst Eric Glenn explains, “SAP eliminated some of the troublesome data collection and infrastructure issues, yet we needed a simple and intuitive way to access it. It was too dif-ficult for the Quality Team to create reports and dashboards that contained SAP data along with data from some of the company’s other vital systems, such as Hyperion. We needed a more robust – yet user-empowering – front end.”
The company’s Supplier Quality team worked closed with IT to implement an arcplan-powered Supplier Quality Dashboard and Scorecard that has saved millions and vastly improved supplier performance. “We knew we had supplier issues, but we could not quantify them,” recalls Tara Holloway, Manager of Global Supplier Quality. “The aggregate view of quality could not be created in Excel so no one could analyze overall performance. We could only see individual plants. Without concrete information about supplier performance, we did not have the leverage we now have to take action with suppliers. As a result, the plants stopped com-plaining and worked through supplier quality issue, which cost us real dollars in waste and reduced productivity.”
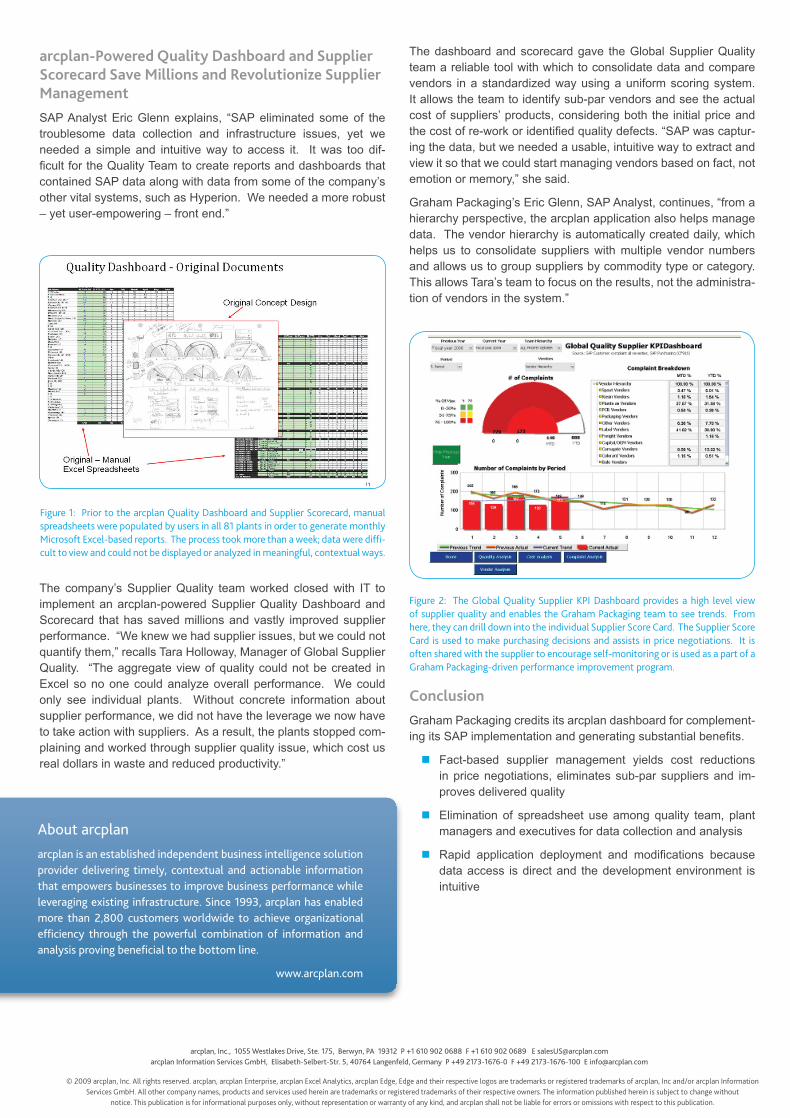
The dashboard and scorecard gave the Global Supplier Quality team a reliable tool with which to consolidate data and compare vendors in a standardized way using a uniform scoring system. It allows the team to identify sub-par vendors and see the actual cost of suppliers’ products, considering both the initial price and the cost of re-work or identified quality defects. “SAP was captur-ing the data, but we needed a usable, intuitive way to extract and view it so that we could start managing vendors based on fact, not emotion or memory,” she said.
Graham Packaging’s Eric Glenn, SAP Analyst, continues, “from a hierarchy perspective, the arcplan application also helps manage data. The vendor hierarchy is automatically created daily, which helps us to consolidate suppliers with multiple vendor numbers and allows us to group suppliers by commodity type or category. This allows Tara’s team to focus on the results, not the administra-tion of vendors in the system.”
ConclusionGraham Packaging credits its arcplan dashboard for complement-ing its SAP implementation and generating substantial benefits.
� Fact-based supplier management yields cost reductions in price negotiations, eliminates sub-par suppliers and im-proves delivered quality
� Elimination of spreadsheet use among quality team, plant managers and executives for data collection and analysis
� Rapid application deployment and modifications because data access is direct and the development environment is intuitive
About arcplanarcplan is an established independent business intelligence solution provider delivering timely, contextual and actionable information that empowers businesses to improve business performance while leveraging existing infrastructure. Since 1993, arcplan has enabled more than 2,800 customers worldwide to achieve organizational efficiency through the powerful combination of information and analysis proving beneficial to the bottom line.
www.arcplan.com
arcplan, Inc., 1055 Westlakes Drive, Ste. 175, Berwyn, PA 19312 P +1 610 902 0688 F +1 610 902 0689 E [email protected] arcplan Information Services GmbH, Elisabeth-Selbert-Str. 5, 40764 Langenfeld, Germany P +49 2173-1676-0 F +49 2173-1676-100 E [email protected]
Figure 1: Prior to the arcplan Quality Dashboard and Supplier Scorecard, manual spreadsheets were populated by users in all 81 plants in order to generate monthly Microsoft Excel-based reports. The process took more than a week; data were diffi-cult to view and could not be displayed or analyzed in meaningful, contextual ways.
Figure 2: The Global Quality Supplier KPI Dashboard provides a high level view of supplier quality and enables the Graham Packaging team to see trends. From here, they can drill down into the individual Supplier Score Card. The Supplier Score Card is used to make purchasing decisions and assists in price negotiations. It is often shared with the supplier to encourage self-monitoring or is used as a part of a Graham Packaging-driven performance improvement program.
© 2009 arcplan, Inc. All rights reserved. arcplan, arcplan Enterprise, arcplan Excel Analytics, arcplan Edge, Edge and their respective logos are trademarks or registered trademarks of arcplan, Inc and/or arcplan InformationServices GmbH. All other company names, products and services used herein are trademarks or registered trademarks of their respective owners. The information published herein is subject to change without
notice. This publication is for informational purposes only, without representation or warranty of any kind, and arcplan shall not be liable for errors or omissions with respect to this publication.
cs_graham_EN.indd 2 05.03.2010 15:26:02