Embed Size (px)
Citation preview

�
1
QUALITY DATA COLLECTION AND MANAGEMENT
Carlo Noè
Università Carlo Cattaneo
e-mail: [email protected]
“Manufacturing Strategy”
Scuola di Ingegneria

�
2
QUALITY CONTROL
TOOLS FOR DATA QUALITY COLLECTION AND MANAGEMENT
Fish-bone diagramsBar graphsHistogramsPareto charts (curves ABC)Correlation diagramsCheck listsControl chartsSampling

�
3
CORRELATION DIAGRAMS
CORRELATION DIAGRAMS
The correlation diagrams are used to put in evidence links between two elements (e.g.: the force applied to a body and the deformation that follows or a cause and its effect, etc.).On a two-axis correlation diagram each point represents the data pairs detected. The arrangement of the points allows to evaluate the relationship between the two elements considered
�
4
CORRELATION DIAGRAMS
CORRELATION DIAGRAMS
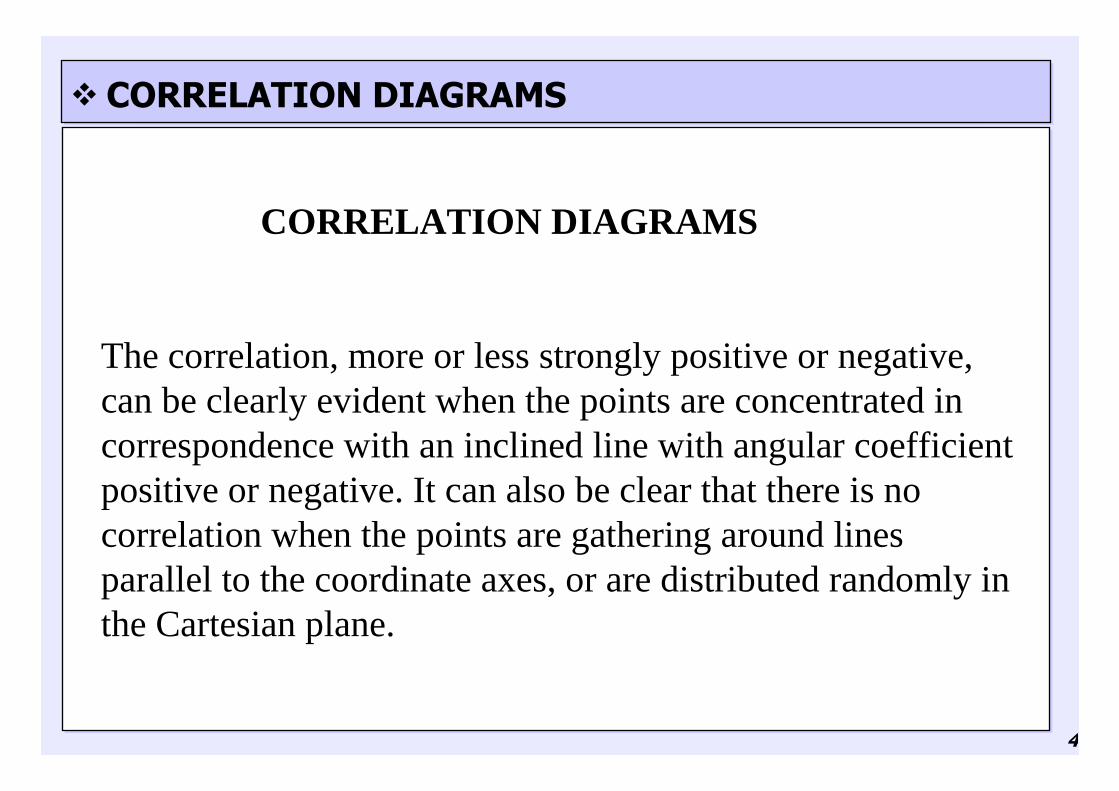
The correlation, more or less strongly positive or negative, can be clearly evident when the points are concentrated in correspondence with an inclined line with angular coefficient positive or negative. It can also be clear that there is no correlation when the points are gathering around lines parallel to the coordinate axes, or are distributed randomly in the Cartesian plane.

�
5
CORRELATIONS DIAGRAMS
CORRELATION DIAGRAMS
In a more practical way, it is possible to assess the actual correlation, for example, drawing straight lines parallel to theaxes in correspondence with the median values of the two values. Hence the plane will be divided into four quadrants. With the count of the points that appear in each quadrant can be evaluated correlation.

�
6
CORRELATION DIAGRAMS
CORRELATIONS DIAGRAMS

�
7
CHECK LISTS
CHECK LISTS
The check lists are used for the organized collection of data which can then be synthesized and represented possibly through the diagrams mentioned above.

�
8
CHECK LISTS
The check lists can be designed, for example, so as to:
•Locate where you have defects directly on a sketch of the controlled object;•Highlight different types of defects;•Highlight the causes of defect in an organized way (e.g.: for the machine, for working period, for the worker, etc.);•Serve as a list of tests performed, the presence of components, the compliance with regulations, etc.•Control the state of a production process.

�
9
CHECK LISTS

�
10
CHECK LISTS
�
11
CONTROL CHARTS
CONTROL CHARTS
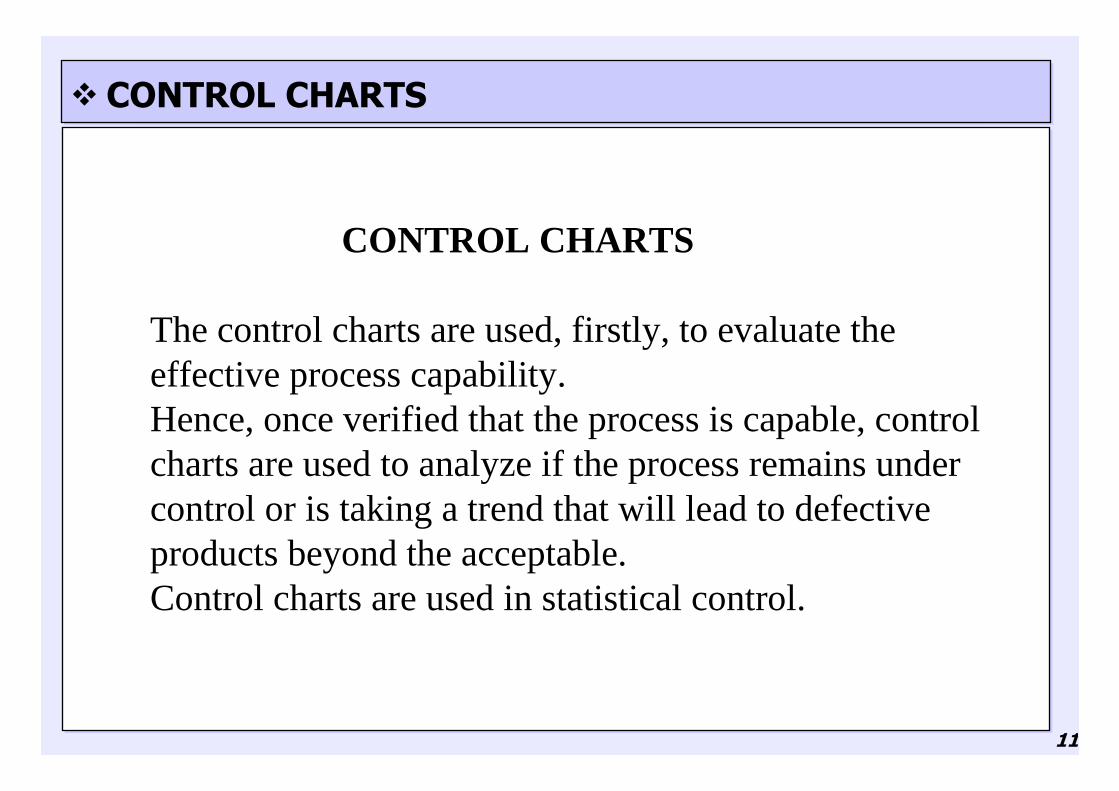
The control charts are used, firstly, to evaluate the effective process capability.Hence, once verified that the process is capable, control charts are used to analyze if the process remains under control or is taking a trend that will lead to defective products beyond the acceptable.Control charts are used in statistical control.
�
12
CONTROL CHARTS
Control charts can be:
•for variables (a magnitude, the variable, is measured)
•for attributes (the presence or absence of something, the attribute, is detected)
The two types of control charts are constructed and are interpreted in a similar way by taking, however, for their construction, different references.
�
13
CONTROL CHARTS
CONTROL CHARTS FOR VARIABLES
Most used are:
•Xm chart: Xm is the average value of the taken measures.
•R chart: R, range, is the difference between the largest and the lower values of the taken measures.
The control charts report on the abscissas the sequence of measurements and on the ordinate the value of Xm or R.

�
14
CONTROL CHARTS
Construction of control charts for variables
1.Data collection:in sufficient quantity;in such a way that it can be gathered in homogeneous subgroups.
2.For Xm chart calculate the average value of the variable general among all the mean values of the subgroups (Xm2).For R chart the average value of the ranges of the variable between all subgroups (Rm).

�
15
CONTROL CHARTS
3. In correspondence of the previously calculated average values, parallel lines to the abscissa are drawn. These are the reference values for the process control.
4. Upper and lower limits of control of the process (UCL, LCL). To determine these limits, for the Xm chart, the parallel lines to the abscissa corresponding to Xm + 3σand Xm - 3σ are drawn on the chart.
5. The mean values calculated for each subgroup in the sequence of the taken measurements are reported in the card.

�
16
CONTROL CHARTS
�
17
CONTROL CHARTS
CONTROL CHARTS FOR ATTRIBUTES
Control charts for attributes serve to highlight, regardless of any measures:
Lack of attribute (e.g.: was applied or not the label on a package)Presence of defect (e.g.: printing on packaging is wrong)

�
18
CONTROL CHARTS
�
19
CONTROL CHARTS
ASSESSMENT OF PROCESS CAPABILITY
Control charts themselves are able to detect if the process is stable and well-calibrated with respect to the performances it can provide.The control charts can give sufficient information about the fact that the production meets the design specifications, that is, the process is capable.

�
20
SAMPLING
For sampling, apart from the definition of the measurement cycle and the choice of instruments for measurement, should be established in order to build effective control charts:
1.the number of subgroups in the sample;2.the number of sample for each subgroup;3.when to take samples.
�
21
SAMPLING
The sampling must be done perform in a correct and reliable way, trying to meet the criteria of speed and economy.
The fundamental principle of correct and reliable sampling is the randomness of the generation of the sample.
A sampling is much more random, the more it is guaranteed the possibility that each component of the whole to be controlled has the same probability of all other to be part of the sample. This goal is not so easy to achieve and sometimes is in contrast with speed and economy.
�
22
SAMPLING
Sampling errors are very insidious because in most cases are highlighted only doing a control over the whole production.
The accuracy of sampling can practically only be acquired by experimentation and experience of inspection staff.