Embed Size (px)
Citation preview
Edited by Steve Kitchen, John D. Olson and F. Eric Preston
Quality in Laboratory Hemostasis and ThrombosisSecond Edition


Quality in Laboratory Hemostasis and Thrombosis

Quality in LaboratoryHemostasis andThrombosis
Second Edition
Edited by
Steve Kitchen, PhDClinical ScientistSheffield Hemophilia and Thrombosis CentreRoyal Hallamshire HospitalSheffield; andScientific Director, UK National External Quality Assessment Scheme (NEQAS)for Blood CoagulationScientific Director, WHO and WFH International External Quality AssessmentPrograms for Blood CoagulationSheffield, UK
John D. Olson, MD, PhDProfessor and Vice Chair for Clinical AffairsDepartment of PathologyUniversity of Texas Health Science Center; andDirector of Clinical LaboratoriesUniversity Health SystemSan Antonio, TX, USA
F. Eric Preston, MD, FRCPath, FRCPEmeritus Professor of HematologyUniversity of SheffieldSheffield; andDirector, WHO and WFH International External Quality Assessment Programsfor Blood CoagulationSheffield, UK
Foreword by Professor Dr Frits R. Rosendaal
A John Wiley & Sons, Ltd., Publication
This edition first published 2013 C© 2009 C© Blackwell Publishing Ltd; 2013 by John Wiley & Sons, Ltd
Wiley-Blackwell is an imprint of John Wiley & Sons, formed by the merger of Wiley’s global Scientific,Technical and Medical business with Blackwell Publishing.
Registered office: John Wiley & Sons, Ltd, The Atrium, Southern Gate, Chichester, West Sussex,PO19 8SQ, UK
Editorial offices: 9600 Garsington Road, Oxford, OX4 2DQ, UKThe Atrium, Southern Gate, Chichester, West Sussex, PO19 8SQ, UK111 River Street, Hoboken, NJ 07030-5774, USA
For details of our global editorial offices, for customer services and for information about how to applyfor permission to reuse the copyright material in this book please see our website atwww.wiley.com/wiley-blackwell
The right of the author to be identified as the author of this work has been asserted in accordance withthe UK Copyright, Designs and Patents Act 1988.
All rights reserved. No part of this publication may be reproduced, stored in a retrieval system, ortransmitted, in any form or by any means, electronic, mechanical, photocopying, recording orotherwise, except as permitted by the UK Copyright, Designs and Patents Act 1988, without the priorpermission of the publisher.
Designations used by companies to distinguish their products are often claimed as trademarks. Allbrand names and product names used in this book are trade names, service marks, trademarks orregistered trademarks of their respective owners. The publisher is not associated with any product orvendor mentioned in this book. This publication is designed to provide accurate and authoritativeinformation in regard to the subject matter covered. It is sold on the understanding that the publisher isnot engaged in rendering professional services. If professional advice or other expert assistance isrequired, the services of a competent professional should be sought.
The contents of this work are intended to further general scientific research, understanding, anddiscussion only and are not intended and should not be relied upon as recommending or promoting aspecific method, diagnosis, or treatment by physicians for any particular patient. The publisher and theauthor make no representations or warranties with respect to the accuracy or completeness of thecontents of this work and specifically disclaim all warranties, including without limitation any impliedwarranties of fitness for a particular purpose. In view of ongoing research, equipment modifications,changes in governmental regulations, and the constant flow of information relating to the use ofmedicines, equipment, and devices, the reader is urged to review and evaluate the information providedin the package insert or instructions for each medicine, equipment, or device for, among other things,any changes in the instructions or indication of usage and for added warnings and precautions. Readersshould consult with a specialist where appropriate. The fact that an organization or Website is referredto in this work as a citation and/or a potential source of further information does not mean that theauthor or the publisher endorses the information the organization or Website may provide orrecommendations it may make. Further, readers should be aware that Internet Websites listed in thiswork may have changed or disappeared between when this work was written and when it is read. Nowarranty may be created or extended by any promotional statements for this work. Neither thepublisher nor the author shall be liable for any damages arising herefrom.
Library of Congress Cataloging-in-Publication Data
Quality in laboratory hemostasis and thrombosis / edited by Steve Kitchen, John D. Olson,F. Eric Preston ; foreword by Frits R. Rosendaal. – 2nd ed.
p. ; cm.Includes bibliographical references and index.ISBN 978-0-470-67119-1 (hardback : alk. paper)I. Kitchen, Steve, Dr. II. Olson, John David, 1944- III. Preston, F. E.[DNLM: 1. Hemostatic Techniques. 2. Anticoagulants. 3. Blood Coagulation Disorders,
Inherited–diagnosis. 4. Blood Coagulation Factors. 5. Clinical Laboratory Techniques.6. Thrombophilia–diagnosis. WH 310]
616.1′57075–dc232012044510
A catalogue record for this book is available from the British Library.
Wiley also publishes its books in a variety of electronic formats. Some content that appears in printmay not be available in electronic books.
Cover image: Internal. Top: courtesy of Bert Verbuggen; bottom: courtesy of Wayne Chandler.Cover design by Andrew Magee Design Ltd
Set in 9/11.5 pt Sabon by Aptara® Inc., New Delhi, India
1 2013
Contents
Contributors, vii
Foreword, x
Preface, xiiSteve Kitchen, John D. Olson, & F. Eric Preston
Part 1: General Quality Program
1 General quality planning in the hemostasis laboratory, 3John D. Olson
2 Hemostasis test validation, performance, and reference intervals:international recommendations and guidelines, 12Richard A. Marlar
3 Causes of errors in medical laboratories, 22Giuseppe Lippi & Emmanuel J. Favaloro
4 International standards in hemostasis, 32Trevor W. Barrowcliffe & Anthony R. Hubbard
5 Sample integrity and preanalytical variables, 45Dorothy (Adcock) Funk
6 Internal quality control in the hemostasis laboratory, 57Steve Kitchen, F. Eric Preston, & John D. Olson
7 External quality assessment in hemostasis: its importance and significance, 65F. Eric Preston, Steve Kitchen, & Alok Srivastava
8 The unique challenges of hemostatic testing in children, 77M. Patricia Massicotte, Mary E. Bauman, Vanessa Chan, &
Anthony K.C. Chan
Part 2: Quality in Coagulation Testing
9 Initial evaluation of hemostasis: reagent and method selection, 95Wayne L. Chandler
10 Assay of factor VIII and other clotting factors, 105Steve Kitchen & F. Eric Preston
11 Application of molecular genetics to the investigation of inheritedbleeding disorders, 115Stefan Lethagen, Morten Dunø, & Lars Bo Nielsen
12 Detecting and quantifying acquired functional inhibitors in hemostasis, 124Bert Verbruggen, Myriam Dardikh, & Britta Laros-van Gorkom
v
CONTENTS
13 Standardization of d-dimer testing, 136Guido Reber & Philippe de Moerloose
14 Point-of-care testing in hemostasis, 147Chris Gardiner, Dianne Kitchen, Samuel Machin, & Ian Mackie
Part 3: Quality in Testing for Platelet Function andvon Willebrand Disease
15 Diagnostic assessment of platelet function, 159Paquita Nurden, Alan Nurden, & Martine Jandrot-Perrus
16 Laboratory evaluation of heparin-induced thrombocytopenia, 174Theodore (Ted) E. Warkentin & Jane C. Moore
17 Laboratory evaluation of von Willebrand disease: phenotypic analysis, 192Emmanuel J. Favaloro
18 Laboratory analysis of von Willebrand disease: molecular analysis, 204Anne C. Goodeve & Ian R. Peake
Part 4: Quality in Thrombophilia Testing and MonitoringAnticoagulation
19 Quality issues in heritable thrombophilia testing, 219Isobel D. Walker & Ian Jennings
20 Evaluation of antiphospholipid antibodies, 233Michael Greaves
21 Monitoring heparin therapy, 244Marilyn Johnston
22 Monitoring oral anticoagulant therapy with vitamin K antagonists, 253Armando Tripodi
23 Monitoring new anticoagulants, 264Elaine Gray & Trevor W. Barrowcliffe
Index, 273
vi
Contributors
Trevor W. Barrowcliffe MA, PhD
Formerly National Institute for Biological Standardsand Control (NIBSC)
Potters Bar, Hertfordshire, UK
Mary E. Bauman RN, MN, NP
Stollery Childen’s HospitalUniversity of AlbertaEdmonton, AB, Canada
Anthony K.C. Chan MBBS, FRCPC, FRCPath
McMaster Children’s Hospital/Hamilton HealthSciences Foundation
Chair in Pediatric Thrombosis and HemostasisDepartment of Pediatrics, McMaster UniversityHamilton, ON, Canada
Vanessa Chan BSc, MLT
Department of Paediatric Laboratory MedicineThe Hospital for Sick ChildrenToronto, ON, Canada
Wayne L. Chandler MD
Coagulation LaboratoryDepartment of Pathology and Genomic MedicineThe Methodist Hospital Physician OrganizationHouston, TX, USA
Myriam Dardikh MSc
Department of Laboratory MedicineLaboratory of HaematologyRadboud University Nijmegen Medical CentreNijmegen, The Netherlands
Philippe de Moerloose MD
Haemostasis UnitDepartment of Internal MedicineUniversity Hospital and Faculty of MedicineGeneva, Switzerland
Morten Dunø MD, PhD
Department of Clinical GeneticsCopenhagen University Hospital (Rigshospitalet)Copenhagen, Denmark
Emmanuel J. Favaloro PhD, FFSc (RCPA)
Department of HematologyICPMR, Westmead HospitalWestmead, NSW, Australia
Dorothy (Adcock) Funk MD
Colorado Coagulationa business unit of Esoterix, Inc., Englewood, CO,
USA
Chris Gardiner PhD
Haematology DepartmentUniversity College London Hospitals NHS Trust; andNuffield Department of Obstetrics and GynaecologyJohn Radcliffe HospitalOxford, UK
Anne C. Goodeve PhD
Sheffield Haemostasis Research GroupDepartment of Cardiovascular ScienceUniversity of SheffieldSheffield; andSheffield Diagnostic Genetics ServiceSheffield Children’s NHS Foundation TrustSheffield, UK
Elaine Gray PhD
National Institute for Biological Standards andControl
Potters Bar, Hertfordshire, UK
Michael Greaves MD FRCP FRCPath
Aberdeen Royal InfirmaryHead of College of Life Sciences and Medicine,University of Aberdeen, Scotland, UK
vii
CONTRIBUTORS
Anthony R. Hubbard PhD
National Institute for Biological Standards andControl
Hertfordshire, UK
Martine Jandrot-Perrus MD, PhD
INSERM U698 and Paris 7 UniversityParis, France
Ian Jennings PhD
UK NEQAS for Blood CoagulationSheffield, UK
Marilyn Johnston MLT, ART
Hemostasis Reference LaboratoryHamilton, ON, Canada
Dianne Kitchen FIBMS
UK NEQAS Blood CoagulationSheffield, UK
Steve Kitchen PhD
Sheffield Hemophilia and ThrombosisCentre
Royal Hallamshire HospitalSheffield; andUK National External Quality Assessment Scheme
(NEQAS) for Blood CoagulationWHO and WFH International External
Quality Assessment Programs for BloodCoagulation
Sheffield, UK
Britta Laros-van Gorkom MD, PhD
Department of HaematologyRadboud University Nijmegen Medical
CentreNijmegen, The Netherlands
Stefan Lethagen MD, PhD
Copenhagen UniversityCopenhagen; andMedical and ScienceHaemophilia R&DNovo Nordisk A/S, Denmark
Giuseppe Lippi MD
Clinical Chemistry and Haematology LaboratoryDepartment of Pathology and Laboratory MedicineAcademic Hospital of ParmaParma, Italy
Samuel Machin MB ChB, FRCP, FRCPath
Haematology DepartmentUniversity College London Hospitals NHS Trust; andHaemostasisResearchUnit,HaematologyDepartmentUniversity College LondonLondon, UK
Ian Mackie PhD, FRCPath
Haematology DepartmentUniversity College London Hospitals NHS TrustHaemostasis Research UnitHaematology DepartmentUniversity College LondonLondon, UK
Richard A. Marlar PhD
Pathology and Laboratory MedicineOklahoma City VA Medical Center; andDepartment of PathologyUniversity of Oklahoma Health Sciences CenterOklahoma City, OK, USA
M. Patricia Massicotte MD, MHSc
Stollery Childen’s HospitalUniversity of AlbertaEdmonton, AB, Canada
Jane C. Moore ART, BSc
Departments of Pathology and Molecular Medicine,and Medicine
Michael G. DeGroote School of Medicine, McMasterUniversity
Hamilton Regional Laboratory Medicine ProgramHamilton, ON, Canada
Lars Bo Nielsen MD, PhD
Department of Clinical BiochemistryRigshospitalet and Department of Biomedical
Sciences; andUniversity of CopenhagenCopenhagen University Hospital (Rigshospitalet)Copenhagen, Denmark
viii
CONTRIBUTORS
Alan Nurden PhD
Centre de Reference des Pathologies PlaquettairesPlateforme Technologique d’Innovation BiomedicaleHopital Xavier ArnozanPessac, France
Paquita Nurden MD, PhD
Centre de Reference des Pathologies PlaquettairesPlateforme Technologique d’Innovation BiomedicaleHopital Xavier ArnozanPessac, France
John D. Olson MD, PhD
Department of PathologyUniversity of Texas Health Science CenterSan Antonio, TX, USA
Ian R. Peake PhD
Sheffield Haemostasis Research GroupDepartment of Cardiovascular ScienceUniversity of SheffieldSheffield, UK
F. Eric Preston MD, FRCPath, FRCP
University of SheffieldSheffield; andWHO and WFH International External Quality
Assessment Programs for Blood CoagulationSheffield, UK
Guido Reber PhD
Haemostasis UnitDepartment of Internal MedicineUniversity Hospital and Faculty of MedicineGeneva, Switzerland
Alok Srivastava MD, FRACP, FRCPA, FRCP
Department of HematologyChristian Medical SchoolVellore, India
Armando Tripodi PhD
Angelo Bianchi Bonomi Hemophilia and ThrombosisCenter
Department of Internal MedicineUniversity School of Medicine and IRCCS Ca
Granda Maggiore Hospital FoundationMilan, Italy
Bert Verbruggen PhD
Laboratory of Clinical Chemistry and HaematologyJeroen Bosch Hospital’s-Hertogenbosch,The Netherlands
Isobel D. Walker MD MPhil (Medical Law),
FRCPath
University of Glasgow, Glasgow; andNEQAS for Blood CoagulationSheffield, UK
Theodore (Ted) E. Warkentin MD
Departments of Pathology and Molecular Medicine,and Medicine
Michael G. DeGroote School of MedicineMcMaster UniversityTransfusion MedicineHamilton Regional Laboratory Medicine ProgramHamilton, ON, Canada
ix
Foreword
Thou art always figuring diseases in me, but thouart full of error: I am sound
(William Shakespeare. Measure formeasure (1604); Act I, Scene II)
A correct diagnosis is the cornerstone of medicine.Without it, no remedy can be prescribed, or prognosisgiven. Although laboratory tests are only a part of thediagnostic arsenal, together with history taking, clin-ical examination, and imaging techniques, few diag-noses are arrived at without some form of laboratorytest. Inadequate tests may lead to either false reassur-ance or false alarm. They may lead to the erroneouschoice not to give treatment when treatment would bebeneficial, or even to prescribe the wrong treatment,which is likely to be harmful. It is therefore of theutmost importance that whenever laboratory tests areperformed, the results are reliable.
Laboratory tests in the field of thrombosis andhemostasis are notoriously difficult, which is relatedto the large variety in techniques that are used, andthe sensitivity of many assays to small preanalyticaland analytical variation. Therefore, quality assuranceis crucial, and no hemostasis laboratory can afford notto invest in internal and external quality control. Thebook, Quality in Laboratory Hemostasis and Throm-bosis, edited and written by authorities in the field,since its first edition in 2008, has become a indispens-able help for those who wish to set up a hemostasislaboratory, as well as those who already work in sucha place. For, to quote from the first chapter: “Processis never optimized; it can always be improved.”
The book has two parts: the first eight chaptersgive a scholarly overview of the concepts that under-lie quality assurance, explaining the various aspects oftest validation, with its components, of which accu-racy and precision are the most important: does a testmeasure what it is supposed to measure, and doesit do so with acceptable reproducibility. Subsequentchapters in this first part explain in detail how inter-nal quality control deals with precision and externalquality control with accuracy. The development ofinternational standards is an important and ongoing
development in improving accuracy and comparabil-ity of hemostasis laboratory tests. Here, the Scien-tific and Standardization Committee of the Interna-tional Society on Thrombosis and Haemostasis, work-ing together with the World Health Organization, hasplayed a major role. Over the years we have witnessedthe emergence of large external quality assurance pro-grams, in which samples are sometimes sent to morethan a thousand participating laboratories. Such pro-grams not only allow laboratories to evaluate theirperformance, but also to group results by reagent orinstrument, which leads to valuable insights, and fur-ther quality improvement. Newly added chapters tothe second edition deal with the causes of labora-tory error, the understanding of which is indispens-able in optimizing laboratory performance, and theperformance and interpretation of hemostatic testsin children.
In the second part of the book, Chapters 9 through23, a detailed description is given of all major assaysin hemostasis, grouped in a series of chapters oncoagulation factor assays, on primary hemostasis(platelets and von Willebrand factor), and on throm-bophilia testing and anticoagulant treatment monitor-ing. These chapters give the reader invaluable infor-mation on the performance and interpretation of thesetests. A newly added chapter that was much missed inthe first edition deals with heparin-induced thrombo-cytopenia.
The ultimate test for a laboratory test is whether itimproves medical care, that is, reduces morbidity andmortality, which depends on the effect a negative orpositive test result has on the treatment of a patient.A test that does not affect clinical management is awaste of resources. Both at the beginning and the endof laboratory tests there is usually a clinician, whofirst makes the decision to order a test, and subse-quently has to interpret the test result. Although theseclinical decisions and interpretation are not part ofthe content of this book, which would have made itunwieldy to say the least, these are of obvious impor-tance, and one of the tasks of the individuals work-ing in hemostasis laboratories is to educate clinicians
x
FOREWORD
about the clinical value of the various assays. I amquite confident that in the field of hemostasis andthrombosis more useless than useful testing is done,and that in medicine as a whole the greatest waste ofmoney is on redundant diagnostics. The practice ofmedicine knows a wide variety of tests, which gener-ally serve three purposes, either to diagnose a disease,or to test for a risk factor for disease, or to screenfor either of these. This distinction is rarely sharplymade, while it seems that clinically one type (diag-nosing a disease) is almost always indicated and use-ful, and another type (testing for risk factors) onlyrarely is. While it is logical to find out which diseasea patient with complaints has, it is not so logical totry and identify the causes of that disease, or even totry and identify those risk factors in nondiseased indi-viduals, such as relatives of individuals with throm-bosis. The reason the distinction between diagnosinga disease and identifying a risk factor is not alwayssharply made, is possibly because in some diseases inthe field, notably bleeding disorders, there is an almostone-to-one relationship between the cause of the dis-ease and the disease itself. While excessive bleedingis the disease and the clotting factor level a cause,individuals with no factor VIII or IX will invariablyhave the clinical disease of hemophilia, and therefore,measuring the clotting factor level has become synony-mous to diagnosing hemophilia. This is quite differentfor thrombosis. Thrombosis (deep vein thrombosis orpulmonary embolism) is a disease, whereas throm-bophilia is not. Given the multicausal nature of theetiology of thrombosis, in which multiple risk factorsneed to be present to lead to disease, it is far fromself-evident that testing for thrombophilic abnormali-ties has any clinical value. So far, there are no clinicalstudies that show a benefit of such testing, althoughit is performed on a broad scale. Whenever you ordera test or are requested to perform a test, questionwhether the result could possibly change anything. Ifnot, or if the only benefit is to satisfy the doctor’scuriosity, the test should not be done.
The reliability of a particular assay should beviewed in the context in which the test is ordered.Suppose one would order a test for high factor VIIIas a prothrombotic risk factor, the above mentionednotwithstanding, an error of five IU/dL would be irrel-
evant, since the purpose is to discriminate betweenlevels of over 150 or 200 IU/dL versus plasma con-centrations around 100 IU/dL. The same error in afactor VIII assay to diagnose hemophilia A could bedisastrous.
A clinician, when ordering a test, will have to dealwith so-called prior probabilities, which is of partic-ular relevance in screening tests. A slightly prolongedaPTT has a vastly different meaning when found ina healthy woman who had four uneventful deliver-ies who has come to the hospital for a tubal ligation,than in an 18-month-old boy who needs to undergo aduodenoscopy with possible biopsies. She is unlikelyto have a bleeding tendency, even when the aPTTis prolonged, while the young boy may suffer fromhemophilia. Screening tests affect the likelihood ofdisease, which, according to Bayes’ theorem, is alsoa function of the prior probability of disease. Virtu-ally, all tests that use reference ranges based on statis-tical cutoff values, such as the population mean plusor minus two standard deviations, are screening tests,that do neither establish a risk factor or a disease,but only, when abnormal, affect the likelihood of thatstate. Nature does not use standard deviations, andusing a cutoff of two standard deviations by definitionfinds 2.5% of the population below, or over, such acutoff. In reality, diseases and risk factors may haveprevalences that exceed, or, more usual, lie far belowthis figure. Tests using “normal ranges” therefore cannever establish an abnormality, and should be fol-lowed by more specific tests, such as clotting factorassays or genetic tests.
Over the last decades, major progress has beenmade in quality assurance of hemostatic laboratoryassays. In this new edition of Quality in Labora-tory Hemostasis and Thrombosis, all chapters havebeen updated and several new chapters have beenadded. This book will remain an indispensable partof every hemostasis laboratory, where, given its hand-on nature, it will rarely sit to get dusty on the shelves.
Frits R. RosendaalFormer Chairman ISTH Council, President XXIV
ISTH Congress, Former Chairman NetherlandsSociety of Thrombosis & Haemostasis, Leiden
University Medical Centre, The Netherlands
xi
Preface
In the past two to three decades, few disciplines, if any,in laboratory medicine have seen the growth in thenumber and complexity of testing as that experiencedin the discipline of hemostasis and thrombosis. Theserapid changes have presented challenges for laborato-ries as they develop quality programs for the oversightof this testing. The quality issues extend across all lev-els of testing and all sizes of laboratories. The fieldof laboratory medicine continues to evolve and therehave been important advances since the first editionof this text was published. We, therefore, accepted theinvitation to bring this text up to date in the secondedition.
In our original discussions about a title for the firstedition, we had an interesting discussion regardingpossibilities of “ . . . the Hemostasis and Thrombo-sis Laboratory” and “ . . . Laboratory Hemostasis andThrombosis.” The distinction is subtle but relevant,the former being a place and the latter a discipline.Quality issues in this discipline extend well beyondthe walls of the laboratory. In this second edition, wehave retained contributions from all the original rec-ognized experts which have been updated, and addeda few new chapters based on the comments received inthe intervening years since the first edition appeared.These experts have provided information on elements
of managing quality as it relates to individual testsor groups of tests extending from nuances of internalquality control to the challenges in many areas wherestandardization may be absent or inadequate. There isinformation on all aspects of testing from preanalyticto analytic and results reporting as well as externalquality assurance. In addition, chapters are includedregarding the development of international guidelinesfor methods as well as the preparation of internationalstandard plasmas and reagents.
Quality is a changing process, continually strivingto improve the product while reducing errors andimproving safety. This book represents an event inthis continuum, and is intended to capture the ele-ments of quality at all levels of the practice of Lab-oratory Hemostasis and Thrombosis, bringing theseup to date since the construction of the first edi-tion during 2008. We believe that it will continue toprovide a useful guide for those involved hemostasisand thrombosis testing, whether very simple, like thepoint of care, or complex, like the major referencelaboratory.
Steve KitchenJohn D. OlsonF. Eric Preston
xii

PART 1
General Quality Program

1 General quality planning in thehemostasis laboratoryJohn D. Olson1,2
1Department of Pathology, University of Texas Health Science Center, San Antonio, TX, USA2University Health System, San Antonio, TX, USA
Introduction
Quality:Invisible when it is good.Impossible to ignore when it is bad.
“So,” you might ask, “What is quality, anyway?” Theword quality repeatedly infiltrates our discussions andinteractions as we work to produce or choose a prod-uct. The Oxford English Dictionary devotes morethan 3000 words in its effort to define the many vari-ations on the use of this word [1]. We may all havedifficulty with a definition, but we do know what wemean. The customer of the product or service definesmany aspects of its quality while those who are pro-ducing define many others. Stated in its simplest terms,quality is the condition or state of a person, thing, orprocess.
The principles
As early as the middle of the 1400s, boat makersin Venice, Italy, introduced the principle of “massproduction” with the manufacture of boats in thesequential assembly of preproduced parts. This assem-bly line process was refined in the modern sense byHenry Ford between 1900 and 1910. The scientificelements of quality management systems began in the1930s with the publication of Shewhart in 1931 [2],
providing a scientific and statistical basis for qualityprocesses. He stated:
A phenomenon will be said to be controlled when,through the use of past experience, we can predict,at least within limits, how the phenomenon may beexpected to vary in the future. Here it is understoodthat prediction means that we can state, at leastapproximately, the probability that the observedphenomenon will fall within given limits. [1]
The evolution of quality management systems wasinfluenced by experiences in World War II. During thewar, individuals involved in the production of reliableproducts for the consumer (soldier) to effectively dotheir job tied the entire system from raw material tothe use of the finished product in a unique “team”from start to finish. Few circumstances can link theperson in production so directly to the importanceof the outcome. The success of the soldier was tiedto the long-term well-being of the person making thetools used by that soldier. This ability to build the tightkinship and team performance on the part of people inproduction to the quality of the product is the goal ofquality programs in all sectors of the economy today.It is, of course, very difficult to achieve this attitude inthe workplace in the same way that it could be whenthe outcome could so directly benefit the producers.
Following World War II, the effort of reconstruc-tion of the industry and economy of the affectedcountries became a major international effort and
Quality in Laboratory Hemostasis and Thrombosis, Second Edition. Edited by Steve Kitchen, John D. Olson and F. Eric Preston.C© 2013 John Wiley & Sons, Ltd. Published 2013 by Blackwell Publishing Ltd.
3
CHAPTER 1
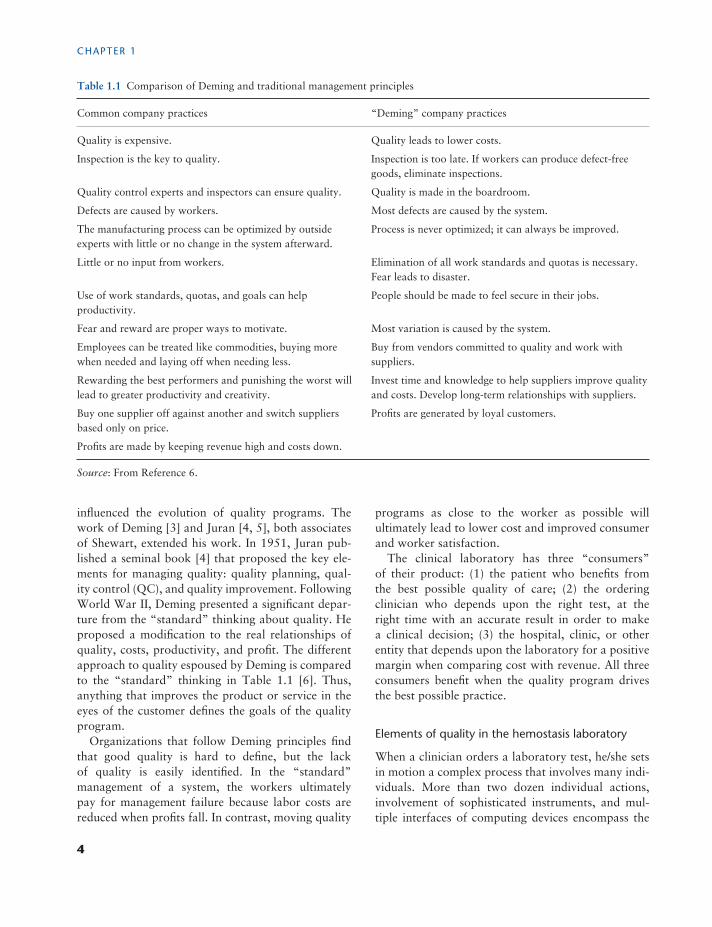
Table 1.1 Comparison of Deming and traditional management principles
Common company practices “Deming” company practices
Quality is expensive. Quality leads to lower costs.
Inspection is the key to quality. Inspection is too late. If workers can produce defect-freegoods, eliminate inspections.
Quality control experts and inspectors can ensure quality. Quality is made in the boardroom.
Defects are caused by workers. Most defects are caused by the system.
The manufacturing process can be optimized by outsideexperts with little or no change in the system afterward.
Process is never optimized; it can always be improved.
Little or no input from workers. Elimination of all work standards and quotas is necessary.Fear leads to disaster.
Use of work standards, quotas, and goals can helpproductivity.
People should be made to feel secure in their jobs.
Fear and reward are proper ways to motivate. Most variation is caused by the system.
Employees can be treated like commodities, buying morewhen needed and laying off when needing less.
Buy from vendors committed to quality and work withsuppliers.
Rewarding the best performers and punishing the worst willlead to greater productivity and creativity.
Invest time and knowledge to help suppliers improve qualityand costs. Develop long-term relationships with suppliers.
Buy one supplier off against another and switch suppliersbased only on price.
Profits are generated by loyal customers.
Profits are made by keeping revenue high and costs down.
Source: From Reference 6.
influenced the evolution of quality programs. Thework of Deming [3] and Juran [4, 5], both associatesof Shewart, extended his work. In 1951, Juran pub-lished a seminal book [4] that proposed the key ele-ments for managing quality: quality planning, qual-ity control (QC), and quality improvement. FollowingWorld War II, Deming presented a significant depar-ture from the “standard” thinking about quality. Heproposed a modification to the real relationships ofquality, costs, productivity, and profit. The differentapproach to quality espoused by Deming is comparedto the “standard” thinking in Table 1.1 [6]. Thus,anything that improves the product or service in theeyes of the customer defines the goals of the qualityprogram.
Organizations that follow Deming principles findthat good quality is hard to define, but the lackof quality is easily identified. In the “standard”management of a system, the workers ultimatelypay for management failure because labor costs arereduced when profits fall. In contrast, moving quality
programs as close to the worker as possible willultimately lead to lower cost and improved consumerand worker satisfaction.
The clinical laboratory has three “consumers”of their product: (1) the patient who benefits fromthe best possible quality of care; (2) the orderingclinician who depends upon the right test, at theright time with an accurate result in order to makea clinical decision; (3) the hospital, clinic, or otherentity that depends upon the laboratory for a positivemargin when comparing cost with revenue. All threeconsumers benefit when the quality program drivesthe best possible practice.
Elements of quality in the hemostasis laboratory
When a clinician orders a laboratory test, he/she setsin motion a complex process that involves many indi-viduals. More than two dozen individual actions,involvement of sophisticated instruments, and mul-tiple interfaces of computing devices encompass the
4
GENERAL QUALITY PLANNING IN THE HEMOSTASIS LABORATORY
Sample identification
Sample processing
Sample aliquots
Conversation
Computer/instrument
Work list
Manual analysis
Automated analysis
CalculationResult
Calculation
Computerconversation
Result
Verify
Analyticphase
Prepare report
Senior staffassessment
Transport/transmit
Inform
File/print report
Billing record
Postanalyticphase
Interpret data
Action
ClinicianOrder
Complete requisition
Gather equipment
Patient id.
Preanalytic phase
Transport
Phlebotomist
Collect specimen
Label specimen
Requisition/specimen Transport
Accession specimen
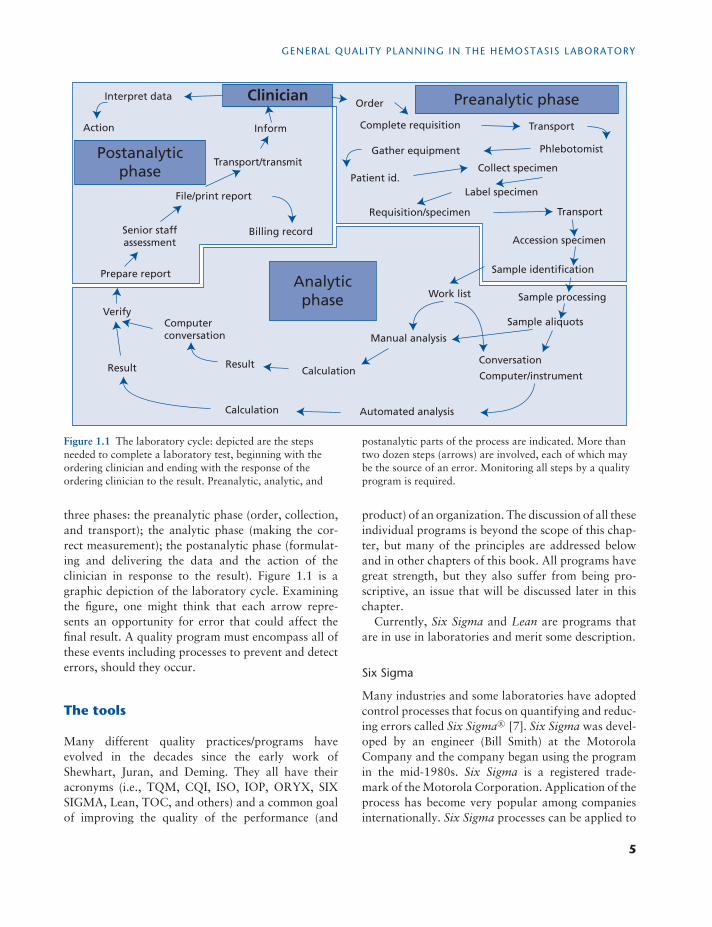
Figure 1.1 The laboratory cycle: depicted are the stepsneeded to complete a laboratory test, beginning with theordering clinician and ending with the response of theordering clinician to the result. Preanalytic, analytic, and
postanalytic parts of the process are indicated. More thantwo dozen steps (arrows) are involved, each of which maybe the source of an error. Monitoring all steps by a qualityprogram is required.
three phases: the preanalytic phase (order, collection,and transport); the analytic phase (making the cor-rect measurement); the postanalytic phase (formulat-ing and delivering the data and the action of theclinician in response to the result). Figure 1.1 is agraphic depiction of the laboratory cycle. Examiningthe figure, one might think that each arrow repre-sents an opportunity for error that could affect thefinal result. A quality program must encompass all ofthese events including processes to prevent and detecterrors, should they occur.
The tools
Many different quality practices/programs haveevolved in the decades since the early work ofShewhart, Juran, and Deming. They all have theiracronyms (i.e., TQM, CQI, ISO, IOP, ORYX, SIXSIGMA, Lean, TOC, and others) and a common goalof improving the quality of the performance (and
product) of an organization. The discussion of all theseindividual programs is beyond the scope of this chap-ter, but many of the principles are addressed belowand in other chapters of this book. All programs havegreat strength, but they also suffer from being pro-scriptive, an issue that will be discussed later in thischapter.
Currently, Six Sigma and Lean are programs thatare in use in laboratories and merit some description.
Six Sigma
Many industries and some laboratories have adoptedcontrol processes that focus on quantifying and reduc-ing errors called Six Sigma R© [7]. Six Sigma was devel-oped by an engineer (Bill Smith) at the MotorolaCompany and the company began using the programin the mid-1980s. Six Sigma is a registered trade-mark of the Motorola Corporation. Application of theprocess has become very popular among companiesinternationally. Six Sigma processes can be applied to
5
CHAPTER 1
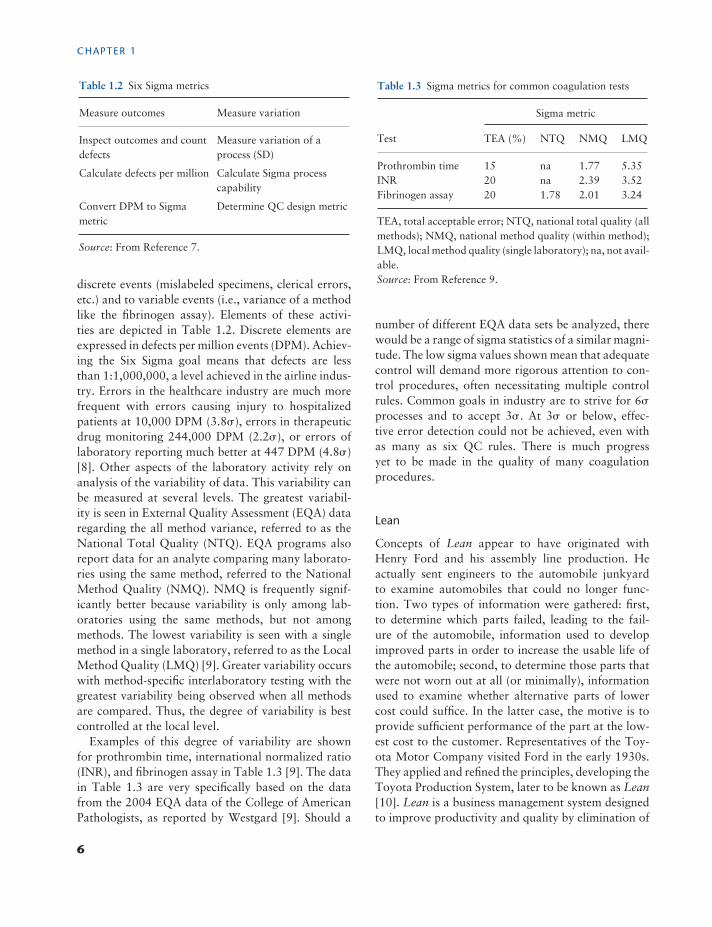
Table 1.2 Six Sigma metrics
Measure outcomes Measure variation
Inspect outcomes and countdefects
Measure variation of aprocess (SD)
Calculate defects per million Calculate Sigma processcapability
Convert DPM to Sigmametric
Determine QC design metric
Source: From Reference 7.
discrete events (mislabeled specimens, clerical errors,etc.) and to variable events (i.e., variance of a methodlike the fibrinogen assay). Elements of these activi-ties are depicted in Table 1.2. Discrete elements areexpressed in defects per million events (DPM). Achiev-ing the Six Sigma goal means that defects are lessthan 1:1,000,000, a level achieved in the airline indus-try. Errors in the healthcare industry are much morefrequent with errors causing injury to hospitalizedpatients at 10,000 DPM (3.8�), errors in therapeuticdrug monitoring 244,000 DPM (2.2�), or errors oflaboratory reporting much better at 447 DPM (4.8�)[8]. Other aspects of the laboratory activity rely onanalysis of the variability of data. This variability canbe measured at several levels. The greatest variabil-ity is seen in External Quality Assessment (EQA) dataregarding the all method variance, referred to as theNational Total Quality (NTQ). EQA programs alsoreport data for an analyte comparing many laborato-ries using the same method, referred to the NationalMethod Quality (NMQ). NMQ is frequently signif-icantly better because variability is only among lab-oratories using the same methods, but not amongmethods. The lowest variability is seen with a singlemethod in a single laboratory, referred to as the LocalMethod Quality (LMQ) [9]. Greater variability occurswith method-specific interlaboratory testing with thegreatest variability being observed when all methodsare compared. Thus, the degree of variability is bestcontrolled at the local level.
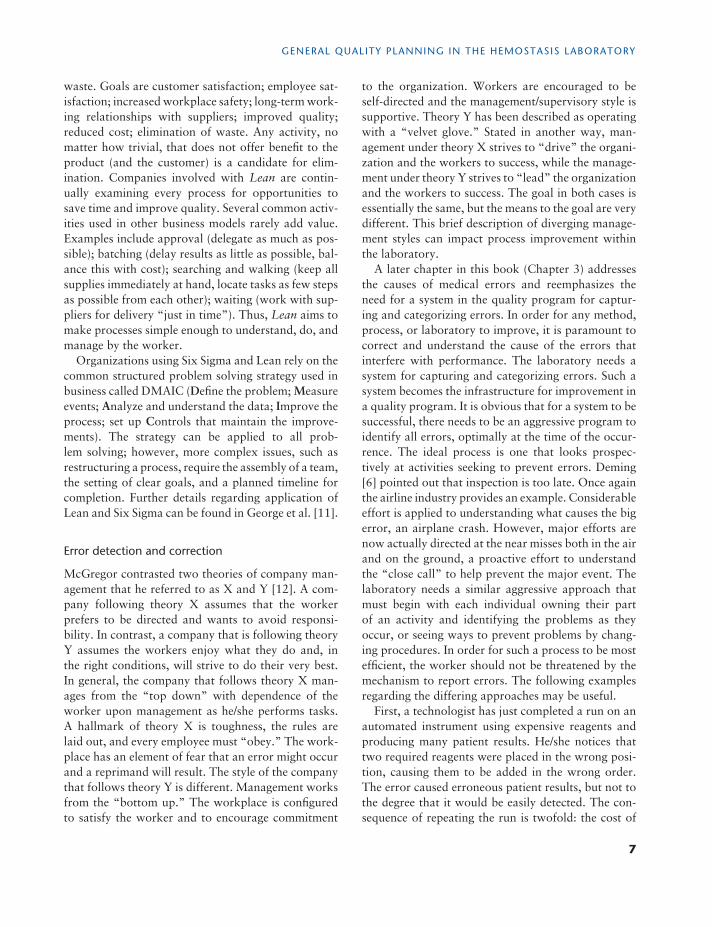
Examples of this degree of variability are shownfor prothrombin time, international normalized ratio(INR), and fibrinogen assay in Table 1.3 [9]. The datain Table 1.3 are very specifically based on the datafrom the 2004 EQA data of the College of AmericanPathologists, as reported by Westgard [9]. Should a
Table 1.3 Sigma metrics for common coagulation tests
Sigma metric
Test TEA (%) NTQ NMQ LMQ
Prothrombin time 15 na 1.77 5.35INR 20 na 2.39 3.52Fibrinogen assay 20 1.78 2.01 3.24
TEA, total acceptable error; NTQ, national total quality (allmethods); NMQ, national method quality (within method);LMQ, local method quality (single laboratory); na, not avail-able.Source: From Reference 9.
number of different EQA data sets be analyzed, therewould be a range of sigma statistics of a similar magni-tude. The low sigma values shown mean that adequatecontrol will demand more rigorous attention to con-trol procedures, often necessitating multiple controlrules. Common goals in industry are to strive for 6�
processes and to accept 3�. At 3� or below, effec-tive error detection could not be achieved, even withas many as six QC rules. There is much progressyet to be made in the quality of many coagulationprocedures.
Lean
Concepts of Lean appear to have originated withHenry Ford and his assembly line production. Heactually sent engineers to the automobile junkyardto examine automobiles that could no longer func-tion. Two types of information were gathered: first,to determine which parts failed, leading to the fail-ure of the automobile, information used to developimproved parts in order to increase the usable life ofthe automobile; second, to determine those parts thatwere not worn out at all (or minimally), informationused to examine whether alternative parts of lowercost could suffice. In the latter case, the motive is toprovide sufficient performance of the part at the low-est cost to the customer. Representatives of the Toy-ota Motor Company visited Ford in the early 1930s.They applied and refined the principles, developing theToyota Production System, later to be known as Lean[10]. Lean is a business management system designedto improve productivity and quality by elimination of
6
GENERAL QUALITY PLANNING IN THE HEMOSTASIS LABORATORY
waste. Goals are customer satisfaction; employee sat-isfaction; increased workplace safety; long-term work-ing relationships with suppliers; improved quality;reduced cost; elimination of waste. Any activity, nomatter how trivial, that does not offer benefit to theproduct (and the customer) is a candidate for elim-ination. Companies involved with Lean are contin-ually examining every process for opportunities tosave time and improve quality. Several common activ-ities used in other business models rarely add value.Examples include approval (delegate as much as pos-sible); batching (delay results as little as possible, bal-ance this with cost); searching and walking (keep allsupplies immediately at hand, locate tasks as few stepsas possible from each other); waiting (work with sup-pliers for delivery “just in time”). Thus, Lean aims tomake processes simple enough to understand, do, andmanage by the worker.
Organizations using Six Sigma and Lean rely on thecommon structured problem solving strategy used inbusiness called DMAIC (Define the problem; Measureevents; Analyze and understand the data; Improve theprocess; set up Controls that maintain the improve-ments). The strategy can be applied to all prob-lem solving; however, more complex issues, such asrestructuring a process, require the assembly of a team,the setting of clear goals, and a planned timeline forcompletion. Further details regarding application ofLean and Six Sigma can be found in George et al. [11].
Error detection and correction
McGregor contrasted two theories of company man-agement that he referred to as X and Y [12]. A com-pany following theory X assumes that the workerprefers to be directed and wants to avoid responsi-bility. In contrast, a company that is following theoryY assumes the workers enjoy what they do and, inthe right conditions, will strive to do their very best.In general, the company that follows theory X man-ages from the “top down” with dependence of theworker upon management as he/she performs tasks.A hallmark of theory X is toughness, the rules arelaid out, and every employee must “obey.” The work-place has an element of fear that an error might occurand a reprimand will result. The style of the companythat follows theory Y is different. Management worksfrom the “bottom up.” The workplace is configuredto satisfy the worker and to encourage commitment
to the organization. Workers are encouraged to beself-directed and the management/supervisory style issupportive. Theory Y has been described as operatingwith a “velvet glove.” Stated in another way, man-agement under theory X strives to “drive” the organi-zation and the workers to success, while the manage-ment under theory Y strives to “lead” the organizationand the workers to success. The goal in both cases isessentially the same, but the means to the goal are verydifferent. This brief description of diverging manage-ment styles can impact process improvement withinthe laboratory.
A later chapter in this book (Chapter 3) addressesthe causes of medical errors and reemphasizes theneed for a system in the quality program for captur-ing and categorizing errors. In order for any method,process, or laboratory to improve, it is paramount tocorrect and understand the cause of the errors thatinterfere with performance. The laboratory needs asystem for capturing and categorizing errors. Such asystem becomes the infrastructure for improvement ina quality program. It is obvious that for a system to besuccessful, there needs to be an aggressive program toidentify all errors, optimally at the time of the occur-rence. The ideal process is one that looks prospec-tively at activities seeking to prevent errors. Deming[6] pointed out that inspection is too late. Once againthe airline industry provides an example. Considerableeffort is applied to understanding what causes the bigerror, an airplane crash. However, major efforts arenow actually directed at the near misses both in the airand on the ground, a proactive effort to understandthe “close call” to help prevent the major event. Thelaboratory needs a similar aggressive approach thatmust begin with each individual owning their partof an activity and identifying the problems as theyoccur, or seeing ways to prevent problems by chang-ing procedures. In order for such a process to be mostefficient, the worker should not be threatened by themechanism to report errors. The following examplesregarding the differing approaches may be useful.
First, a technologist has just completed a run on anautomated instrument using expensive reagents andproducing many patient results. He/she notices thattwo required reagents were placed in the wrong posi-tion, causing them to be added in the wrong order.The error caused erroneous patient results, but not tothe degree that it would be easily detected. The con-sequence of repeating the run is twofold: the cost of
7
CHAPTER 1
the reagents and time of the technologist are expen-sive and the delay in completing the testing results incomplaints from clinicians. In this scenario, manage-ment under theory X results in a reprimand from thesupervisor and a letter being placed in the technolo-gist’s personnel file for negative consideration at thenext performance evaluation. The consequences maybe severe enough for the technologist to consider notreporting the error. In contrast, management undertheory Y would result in the supervisor complimentingthe technologist for detecting the problem and engag-ing the technologist in an investigation of the reasonthat the error occurred. The supervisor and the tech-nologist understand that the goal is to prevent thisfrom happening in the future, whether this person oranother performs the procedure. The assumption isthat the process contributed to the error.
Second is a case in which the error that occurredabove was not detected by the technologist perform-ing the test, but at a later time during the supervisor’sinspection of reported results. Managing under the-ory X, the supervisor will confront the technologistwith the data and, just as in the prior example, willissue a reprimand and a letter. Managing under the-ory Y, the supervisor will present the information tothe technologist and ask the technologist to assist inunderstanding how the problem occurred and how itmight be avoided in the future.
Errors like those described that are detected andinvestigated are most frequently found to be prob-lems in the process, not exclusively with the individ-ual doing the procedure at the time. Improving theprocess to help workers prevent errors is the goal andcan only succeed if errors are detected and investi-gated. Contrasting the approaches, one can see thatpunishing the worker and failing to examine processwill not improve the quality and the worker will notbe enthused about reporting future errors. The secondapproach engages the workers and rewards activitiesthat improve quality in the laboratory.
Internal quality control
The control of the testing procedure (QC) evolvedwith the transition of research testing into the clini-cal arena. In general, internal QC provides a methodto verify the imprecision of a test. To be confidentthat the method returns the correct result requiresthat steps be taken to ensure all elements are within
the control of the operator. Technologists are taughtthat instruments/methods are designed to fail andthat they can rely upon results only if the entiremethod performs within defined limits with specimensof known value. The frequency of these control eventsare method specific and a function of the stability ofall of the elements (reagent, specimen, instrument) andmust be driven by historical data from the methoditself. Internal QC is the grandfather of quality pro-grams in the laboratory and is detailed elsewhere inthis book (Chapter 6).
Quality assurance
During the 1980s, laboratories began looking beyondthe analytic procedure with quality programs calledQuality Assurance. QC remained a part of the Qual-ity Assurance program, but the program expandedto consider such items as laboratory orders, requisi-tions, collection techniques, and other issues directlyimpacting the result of the test but not always directlyin the control of the laboratory. Preanalytic issues aredetailed elsewhere in this book (Chapter 5). Postan-alytic issues also became a part of quality initiativesthis same era: such issues as reporting formats, verifi-cation of calculated results, timely reporting, and evenaction taken as a result of the data reported. It wasduring this period that computer applications in boththe laboratory and the clinical environments began togrow, requiring the validation and continued verifi-cation of computer function and interfaces for elec-tronic result reporting between computers as well asbetween instruments and computers. Encouraged (ordemanded) by accreditation and/or regulatory agen-cies, laboratory professionals also began asking ques-tions of and listening to clinicians regarding the qual-ity of service and needs to provide new tests shownto have clinical value and to remove antiquated teststhat no longer offer added clinical information. Theseactivities started the interaction of the quality pro-grams in the laboratory with similar programs in therest of the healthcare institutions.
External quality assessment
In the 1930s [13], the need for interlaboratory stan-dardization for public health programs (a method toverify accuracy) led to early efforts at External Qual-ity Assurance. The concept of an unknown specimen
8
GENERAL QUALITY PLANNING IN THE HEMOSTASIS LABORATORY
being sent from a central EQA agency to the labo-ratory for testing with the results sent back to theagency for evaluation added an important new levelof assurance for the quality of analysis. In addition,results were reported in a way that allowed a labo-ratory to compare their performance to other labora-tories using the same or similar methods. Laboratoryparticipation in EQA programs grew rapidly in the1950s and 1960s. In large part this growth was dueto the development accreditation and regulatory pro-grams requiring EQA; however, the recognition byunregulated laboratories that EQA was vital to thequality of their own programs has also led to widen-ing acceptance.
EQA is generally viewed as a process to examine theanalytic phase of testing, offering little or no infor-mation regarding the pre- and postanalytic phases.Described below is a method to examine a portionof the preanalytic process and all of the postanalyticprocess if the laboratory uses a laboratory informationsystem (LIS) with electronic reporting to an electronicmedical record (EMR).
Within the LIS and the EMR, one can create anadditional floor on the hospital, or clinic in the outpa-tient department. Doing so allows for development ofas many “beds” or clinic visits as necessary to handleall EQA challenges. Next, the Medical Records and/orbilling departments assign a block of medical recordnumbers for laboratory use only. The laboratory thenassigns a medical record number and name to each ofthe EQA challenges to which it subscribes (coagula-tion limited, coagulation special, etc.). Each challengemay have several analytes.
Having created this for each challenge, when thespecimen arrives, the specimen is accessioned into thecomputer with the same method as a patient, the test-ing is performed in the same manner as a patient, andthe reporting into the LIS and the EMR will occur inthe same manner as a patient. The data reported tothe EQA provider can be that reported to the EMR.
The advantage of such an approach is that all instru-ment/computer interfaces are validated and the eval-uating, accessioning, and reporting process becomesa part of the EQA program. In addition, with time,the laboratory can query the EMR by the name andmedical record number of the EQA challenge to seethe longitudinal data reported by analyte.
Detailed discussion of EQA programs is addressedelsewhere in this book (Chapter 7).
The application of the tools in thelaboratory
Quality system essentials
Development and maintenance of a quality pro-gram in a laboratory requires that there be aninfrastructure of support in order for internal andexternal QC and quality assurance to be successful.The field of hemostasis provides an excellent exam-ple of this issue. The hemostasis laboratory has theentire spectrum of testing from the highly automatedto the complex manual tests that are time-consumingand demand a different skill set. Thus, in addition toa good QC program, there is need for an effectiveprogram for development and continuing educationof the staff. The same can be said of a host of essen-tial activities in the laboratory including such thingsas acquisition and maintenance of capital equipment;supply inventory; safety of staff and patients; andothers. In the late 1990s and early 2000s, recom-mendations began to appear for the comprehensivemanagement of the quality of all aspects of the labo-ratory operations. International Standards Organiza-tion (ISO) developed the ISO 17025 (primarily a lab-oratory management program) [14] and ISO 15189(a program specifically for clinical laboratories) [15].The Clinical Laboratory Standards Institute (CLSI),at the time named NCCLS, published the Quality Sys-tem Essentials (QSE) [16]. The ISO programs haveachieved acceptance in Europe and internationally,while the QSE programs are more commonly in usein North America. Both approach the issues of qualitywith a very broad perspective, covering all elementsof laboratory operations.
The list presented in Table 1.4 is an example of theQSE for a given laboratory. The list is not intended tobe the list for use in every laboratory. Each laboratoryneeds to develop its own essentials, formulated to helpmanage issues within their own laboratory. The list isordinarily 9–12 items in length and the types of issuesto be addressed are encompassed in Table 1.4. Eachof the items on this list will be controlled by a set ofthree levels of documents:Policies: Statement of intent with regard to rules
and requirements of regulations, accreditation, andstandards. Each QSE will have one or a small num-ber of policies that will provide the framework forall activities within the QSE. In the case of test
9
CHAPTER 1
Table 1.4 Quality system essentials (CLSI—1999)
Purchasing and inventory Information management
Organization Deviations, nonconformance
Personnel Assessments: internal andexternal
Equipment Process improvement
Document and records Customer service
Process control Facilities and safety
Source: From Reference 14.
development, policies may address such things asvalidation, QC, EQA, and others.
Process descriptions: This is a description of howthe policies are implemented. Process descriptionswill often cross more than one department, sectionof departments, and procedures within a section.Flowcharts and tables are often used to describeprocesses. An example of a process requiring con-trol is given below.
Procedures and related forms: The standard operatingprocedure (SOP) is a step-by-step description ofhow to perform a method or task.
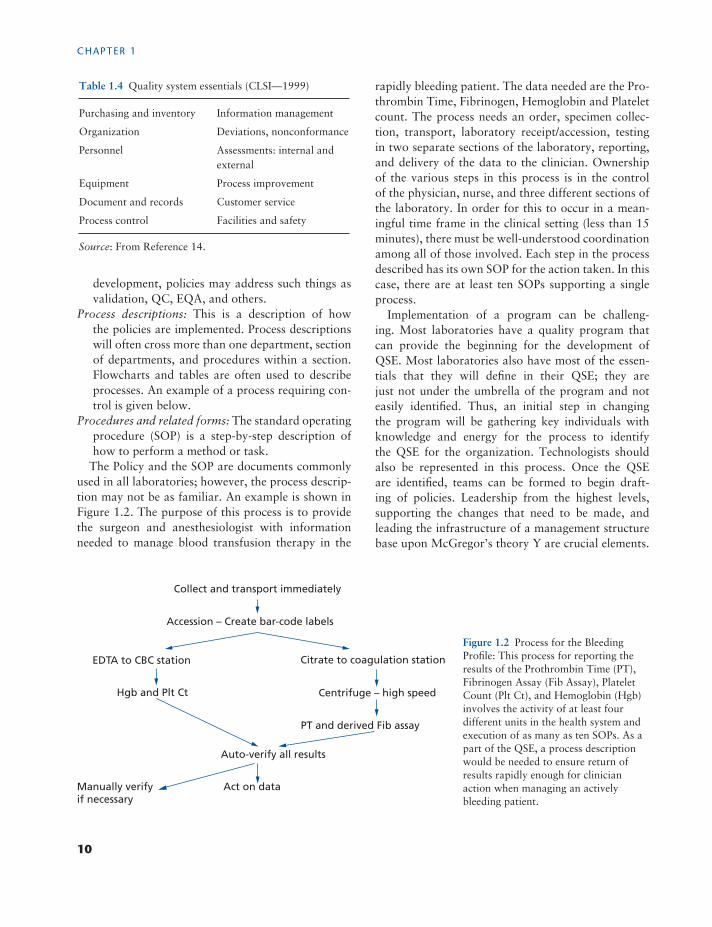
The Policy and the SOP are documents commonlyused in all laboratories; however, the process descrip-tion may not be as familiar. An example is shown inFigure 1.2. The purpose of this process is to providethe surgeon and anesthesiologist with informationneeded to manage blood transfusion therapy in the
rapidly bleeding patient. The data needed are the Pro-thrombin Time, Fibrinogen, Hemoglobin and Plateletcount. The process needs an order, specimen collec-tion, transport, laboratory receipt/accession, testingin two separate sections of the laboratory, reporting,and delivery of the data to the clinician. Ownershipof the various steps in this process is in the controlof the physician, nurse, and three different sections ofthe laboratory. In order for this to occur in a mean-ingful time frame in the clinical setting (less than 15minutes), there must be well-understood coordinationamong all of those involved. Each step in the processdescribed has its own SOP for the action taken. In thiscase, there are at least ten SOPs supporting a singleprocess.
Implementation of a program can be challeng-ing. Most laboratories have a quality program thatcan provide the beginning for the development ofQSE. Most laboratories also have most of the essen-tials that they will define in their QSE; they arejust not under the umbrella of the program and noteasily identified. Thus, an initial step in changingthe program will be gathering key individuals withknowledge and energy for the process to identifythe QSE for the organization. Technologists shouldalso be represented in this process. Once the QSEare identified, teams can be formed to begin draft-ing of policies. Leadership from the highest levels,supporting the changes that need to be made, andleading the infrastructure of a management structurebase upon McGregor’s theory Y are crucial elements.
Collect and transport immediately
Accession – Create bar-code labels
EDTA to CBC station Citrate to coagulation station
Hgb and Plt Ct Centrifuge – high speed
PT and derived Fib assay
Auto-verify all results
Act on dataManually verifyif necessary
Figure 1.2 Process for the BleedingProfile: This process for reporting theresults of the Prothrombin Time (PT),Fibrinogen Assay (Fib Assay), PlateletCount (Plt Ct), and Hemoglobin (Hgb)involves the activity of at least fourdifferent units in the health system andexecution of as many as ten SOPs. As apart of the QSE, a process descriptionwould be needed to ensure return ofresults rapidly enough for clinicianaction when managing an activelybleeding patient.
10
GENERAL QUALITY PLANNING IN THE HEMOSTASIS LABORATORY
Possibly the most important issue is putting realityinto fault-free reporting of errors, followed by aninvestigation to improve process to prevent futureoccurrences.
For many laboratories, instituting the concepts thatare described in this chapter would necessitate signifi-cant change in the quality program, the perspective ofthe manager, and the attitude of the employee. Such achange in the culture is difficult. It is tempting to tryto “buy, install and run” a program from a qualityvendor. Such an approach is likely to meet withresistance from workers who view it as “just anotherof those quality things that the administration is goingto force on us.” In the past two decades (or more)most laboratories have instituted more that one newquality program in an effort to find a solution thatworks well in their setting. One possible difficulty insuch an approach is the proscriptive nature of the pro-cess. They provide everything that is needed, policies,forms, SOPs, and so on. What they do not provide isthe personal ownership that can come from the inter-nal development of the quality process. Managers mayfind a smoother and more lasting solution in providingpolicies that allow for each unit to develop their ownapproach to the gathering of data, the identificationof errors, and the many other elements of the qualityprogram.
Summary
Over the course of the past 70 or more years, ele-ments of the quality program have evolved in asomewhat stepwise fashion, beginning with internalQC and progressing to more comprehensive pro-grams that encompass all activities in the work-place. In the remainder of this book you will findinformation regarding quality in all aspects of thehemostasis laboratory. Experts provide informationregarding the highest level of development of stan-dards (both methods and materials) to the finestdetails of the nuances of selected methods. Integratedinto a comprehensive quality program, similar tothat described above, the information should helpin the development of a “QUALITY HEMOSTASISLABORATORY.”
References
1. Oxford English Dictionary.2. Shewhart WA. Economic Control of Quality of Manu-
factured Product. New York: D. Van Nostrand; 1931.3. DeAguayo R. Deming: The American Who Taught the
Japanese about Quality. New York: Simon & Schuster;1990:1–66.
4. Juran JM. Juran’s Quality Control Handbook. 4th ed.New York: McGraw-Hill; 1988.
5. Juran JM. Juran on Leadership for Quality: An Exec-utive Handbook. New York: Collier Macmillan; 1989:1–80.
6. Travers EM, McClatchy KM. Basic laboratory man-agement. In: McClatchy KM, ed. Clinical LaboratoryMedicine. 2nd ed. Philadelphia, PA: Lippincott Williams& Wilkins; 2002:3–31.
7. Westgard JO. Six Sigmas Quality Design and Control.Madison, WI: Westgard QC; 2001:11–22.
8. Nevalainen D, Berte L, Kraft C, Leigh E, Morgan T.Evaluating laboratory performance on quality indica-tors with the Six Sigma scale. Arch Pathol Lab Med.2000;124:516–519.
9. Westgard JO, Westgard SA. The quality of laboratorytesting today: an assessment of � metrics for analyticquality using performance data from proficiency testingsurveys and the clia criteria for acceptable performance.Am J Clin Pathol. 2006;125:343–354.
10. Womack JD. The Lean Enterprise Institute. http://www.lean.org; 2009. Accessed 14 Jan 2013.
11. George ML, Rowlands D, Price M, Maxey J. The LeanSix Sigma Pocket Toolbox. New York: McGraw-Hill;2005.
12. McGregor D. The Human Side of Enterprise. New York:McGraw-Hill; 1960:1–58.
13. Cumming HS, Hazen HH, Sanford FE, et al. Evaluationof serodiagnostic tests for syphilis in the United States:report of results. Vener Dis Informat. 1935;16:189.
14. International Organization for Standardization. ISO/IEC 17025:2005: General requirements for the com-petence of testing and calibration laboratories. http://www.iso.org/iso/catalogue_detail?csnumber=39883.Accessed 14 Jan 2013.
15. International Organization for Standardization. ISO15189:2007: Medical laboratories: particular require-ments for quality and competence. http://www.iso.org/iso/iso_catalogue/catalogue_tc/catalogue_detail.htm?csnumber=42641. Accessed 14 Jan 2013.
16. National Committee for Clinical Laboratory Standards.A Quality System Model for Health Care: ApprovedGuidelines, Wayne, PA: NCCLS; NCCLS documentGP26-A; 1999.
11
2 Hemostasis test validation,performance, and referenceintervals: internationalrecommendations and guidelinesRichard A. Marlar1,2
1Pathology and Laboratory Medicine, Oklahoma City VA Medical Center, Oklahoma City,OK, USA2Department of Pathology, University of Oklahoma Health Sciences Center, Oklahoma City,OK, USA
The clinical hemostasis or coagulation laboratory isa complex testing arena that does not fit well into themold of hematology (“counting” of particles—redblood cells or platelets) or chemistry with knownconcentrations of analytes (sodium charge andalbumin mass). The hemostasis or coagulation assayinventory spans multiple test types (from clottingtests to chromogenic and immunologic assays tospecialized tests such as electrophoresis, aggregation,and radioactive-based tests) and results are expressedin a wide variety of units: time, percentage, units,mass, optical density units, and even visual interpre-tation. International standards are available for someanalytes (see Chapter 4); however, many still awaitthe development of such standards. As a result, valuesare based on local or manufacturer’s units. Theseparameters complicate the development, validation,performance of methods in the routine coagulationlaboratory, and the more complex methods of the“special” coagulation laboratory.
Modifications of assay methods such as usingone manufacturer’s kit on another manufacturer’sinstrument or in-house (“home brew”) tests orcomponents lead to many challenges of methodstandardization and validation to produce accuratediagnostic, monitoring, or therapeutic information.Before a new method can be introduced into clinicaluse, both analytical and clinical performances mustbe verified under standard operating parameters ofthe laboratory. This chapter is intended to review the
validation procedure and outline a systematicapproach for hemostatic assay validation, helpinglaboratories meet the daily needs of internal qualitystandards and external certification requirements.
The general and continuing assessment of clinicalcoagulation testing falls to accrediting agencies sanc-tioned by each country. The accreditation require-ments of “good laboratory practices” vary for eachoversight agency. For many hemostasis tests, signifi-cant problems are encountered: differences in reagentsgenerating results in different arbitrary units (pro-thrombin time (PT) and activated partial thrombo-plastin time (aPTT)); tests with multiple protocols(Bethesda vs. Nijmegen inhibitor assays); and testresults based on experience or visual interpretation(platelet aggregation or von Willebrand factor (vWF)multimers).
The processes of validation and performance evalu-ation are presented followed by a discussion of thereference interval, a difficult concept in hemostasisand coagulation. The use of a standardized validationprotocol will help to objectively evaluate method per-formance. The parameters of this validation protocolmust be established prior to any studies better defin-ing the limits of the method, reference interval, andcertainly its use in the clinical laboratory (Table 2.1).Validation is the process of proving that a procedure,process, system, equipment, reagents, and methodswork singly and together as expected to achieve theintended result. Method validation assesses not only
Quality in Laboratory Hemostasis and Thrombosis, Second Edition. Edited by Steve Kitchen, John D. Olson and F. Eric Preston.C© 2013 John Wiley & Sons, Ltd. Published 2013 by Blackwell Publishing Ltd.
12
HEMOSTASIS TEST VALIDATION, PERFORMANCE, AND REFERENCE INTERVALS
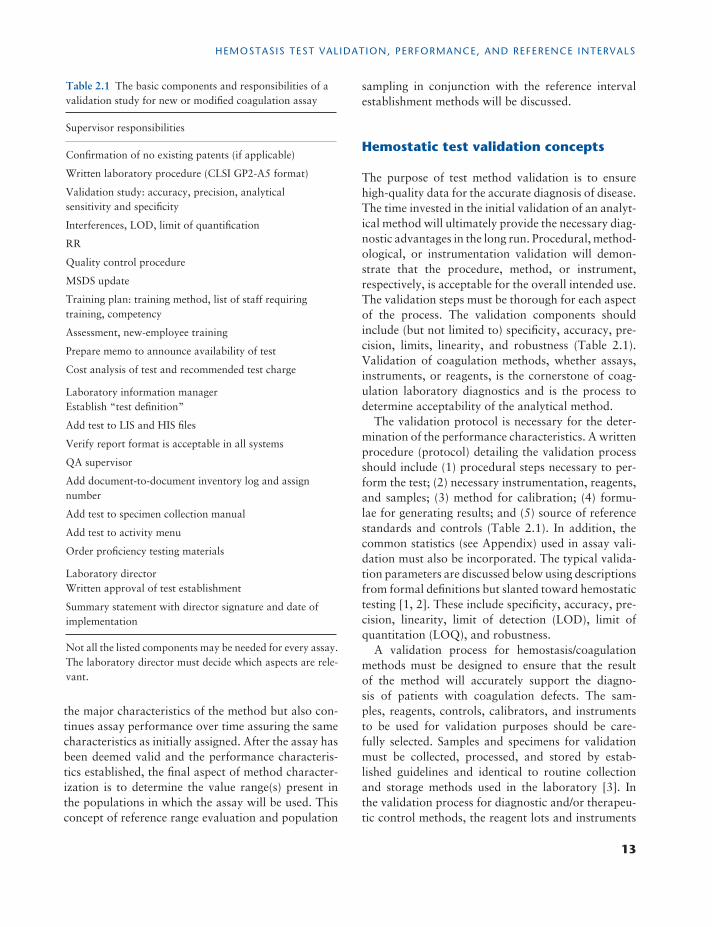
Table 2.1 The basic components and responsibilities of avalidation study for new or modified coagulation assay
Supervisor responsibilities
Confirmation of no existing patents (if applicable)
Written laboratory procedure (CLSI GP2-A5 format)
Validation study: accuracy, precision, analyticalsensitivity and specificity
Interferences, LOD, limit of quantification
RR
Quality control procedure
MSDS update
Training plan: training method, list of staff requiringtraining, competency
Assessment, new-employee training
Prepare memo to announce availability of test
Cost analysis of test and recommended test charge
Laboratory information managerEstablish “test definition”
Add test to LIS and HIS files
Verify report format is acceptable in all systems
QA supervisor
Add document-to-document inventory log and assignnumber
Add test to specimen collection manual
Add test to activity menu
Order proficiency testing materials
Laboratory directorWritten approval of test establishment
Summary statement with director signature and date ofimplementation
Not all the listed components may be needed for every assay.The laboratory director must decide which aspects are rele-vant.
the major characteristics of the method but also con-tinues assay performance over time assuring the samecharacteristics as initially assigned. After the assay hasbeen deemed valid and the performance characteris-tics established, the final aspect of method character-ization is to determine the value range(s) present inthe populations in which the assay will be used. Thisconcept of reference range evaluation and population
sampling in conjunction with the reference intervalestablishment methods will be discussed.
Hemostatic test validation concepts
The purpose of test method validation is to ensurehigh-quality data for the accurate diagnosis of disease.The time invested in the initial validation of an analyt-ical method will ultimately provide the necessary diag-nostic advantages in the long run. Procedural, method-ological, or instrumentation validation will demon-strate that the procedure, method, or instrument,respectively, is acceptable for the overall intended use.The validation steps must be thorough for each aspectof the process. The validation components shouldinclude (but not limited to) specificity, accuracy, pre-cision, limits, linearity, and robustness (Table 2.1).Validation of coagulation methods, whether assays,instruments, or reagents, is the cornerstone of coag-ulation laboratory diagnostics and is the process todetermine acceptability of the analytical method.
The validation protocol is necessary for the deter-mination of the performance characteristics. A writtenprocedure (protocol) detailing the validation processshould include (1) procedural steps necessary to per-form the test; (2) necessary instrumentation, reagents,and samples; (3) method for calibration; (4) formu-lae for generating results; and (5) source of referencestandards and controls (Table 2.1). In addition, thecommon statistics (see Appendix) used in assay vali-dation must also be incorporated. The typical valida-tion parameters are discussed below using descriptionsfrom formal definitions but slanted toward hemostatictesting [1, 2]. These include specificity, accuracy, pre-cision, linearity, limit of detection (LOD), limit ofquantitation (LOQ), and robustness.
A validation process for hemostasis/coagulationmethods must be designed to ensure that the resultof the method will accurately support the diagno-sis of patients with coagulation defects. The sam-ples, reagents, controls, calibrators, and instrumentsto be used for validation purposes should be care-fully selected. Samples and specimens for validationmust be collected, processed, and stored by estab-lished guidelines and identical to routine collectionand storage methods used in the laboratory [3]. Inthe validation process for diagnostic and/or therapeu-tic control methods, the reagent lots and instruments
13
CHAPTER 2
must be those that will be used in the laboratory whenthe methods are put in place [2, 3].
Specificity is the ability to unequivocally assess theanalyte in a standard specimen in the presence of com-ponents that may be expected to be present [2, 4]. Typ-ically this includes such components like the plasma(matrix) and degraded or inactive components. Themethod should be capable of the differentiation of sim-ilar analytes or interfering substances that could have asignificant effect on the value. In commercially avail-able methods (in the United States, especially FDA-approved methods), these evaluations should havebeen performed by the manufacturer. In “home-brew”assays, the user must demonstrate specificity, a taskthat may be a very difficult.
Accuracy is the closeness of agreement between thetest value and the true value [5]. In hemostasis testing,this can be one of the most difficult or even impos-sible parameters to determine; in fact the concept of“true value” may not even apply to many coagula-tion tests especially those that report results as timevalues (PT, aPTT, and thrombin time) [2, 6]. In addi-tion, the majority of hemostasis/coagulation tests hasno “gold” standards or even established true values.This concept is changing as international standardsare being developed and accepted (fibrinogen, fac-tor VIII, protein C, antithrombin, and vWF) [7, 8].For some standards (fibrinogen, protein C, protein S,antithrombin, and factor VIII), accuracy issues stillarise due to differences in the methods used (clottingvs. chromogenic assays). The laboratory must makecertain that their standards are linked, if available, tothe international standard through a secondary stan-dard of the manufacturer [2, 6]. Preparation of inter-national standards is addressed elsewhere in this book(Chapter 4).
Precision is defined as the closeness of agreement(degree of variability) among a series of measurementsobtained from multiple sampling from a single sam-ple or reference material [2, 9]. Imprecision is mea-sured using within-assay variability (intra-assay) andday-to-day variability (inter-assay). Intra-assay vari-ability is the imprecision determined under the sameoperating conditions. Inter-assay reproducibility is theimprecision of the method when the assay compo-nents may be slightly different (different days, differ-ent operators, and different reagent vials). Precisionis established irrespective of accuracy since it is thecloseness of the reproducibility of the result data that
is important. The imprecision is usually expressed ascoefficient of variation (CV).
Imprecision evaluation consists of a two-prongassessment: within-run variation and between-run orday-to-day variation. Variation for the within-runassessment is determined by performing the assay onthe same specimen or control sample within a sin-gle run using the same reagent batch for a minimumof 20 measurements. The CV should usually be 3–6% for clotting, chromogenic, and most immunologicanalytes but never more than 10%. However, for themore complex assays (platelet aggregation, vWF, andlupus anticoagulant), the imprecision in terms of CVmay be 10–20%.
Between-run precision is evaluated by repeating thesame specimen (usually controls) on the same instru-ment but with other variables (such as new reagentvials, different operators, and different environmentalconditions) for a minimum of 10 runs. In general, theprecision for between-run studies is greater than thatobserved for within-run precision studies. Usually, theCV for between-run studies is 4–8% but never morethan 12%. Again for the more complex assays, theprecision can increase to a significant 20–40%. Theacceptable limits of precision during the validationphase is difficult to define and will vary among labo-ratories. No hard and fast rules apply for acceptabilityof coagulation testing precision; however, the labora-tory must decide on the acceptable limits of precisionbased on publications, manufacturer’s data, or pub-lished guidelines. At least three samples that span thereportable range ((RR) including normal and abnor-mal values) must be used as part of the precision study.The acceptable levels of precision may be differentbetween normal and abnormal samples, the type ofassay, and the reagent–instrument combinations. Theprecision results should mirror the values reported bythe reagent and/or instrument manufacturer. Precisionwithin the manufacturer’s reported limits are accept-able. If the precision value obtained is greater than themanufacturer’s reported values, then the laboratorymay still accept the results if their method parametersjustify the increased imprecision.
Limits
In the validation of an assay’s performance, twotypes of “limits” must be evaluated: LOD and LOQ[2, 6, 10]. The LOD of a method is the level at which
14
HEMOSTASIS TEST VALIDATION, PERFORMANCE, AND REFERENCE INTERVALS
the assay can distinguish a sample without analytepresent (blank) from the sample with analyte present;however, the assay may not accurately quantify theamount [10]. The LOD is usually defined as 3 stan-dard deviation (SD) above the mean of the blank, mak-ing the limit above the “noise” of the method, thusthe probability of a false positive is minimal (�1%).The accuracy and precision of the method (includ-ing all components and reagents) and pre-analyticalvariables play an important role in determining theLOD. Although these components are important fora coagulation assay, an added layer of assay com-plexity occurs with the time-based result assays (PTand aPTT) as these methods have no specific analyteto determine. Some coagulation methods have poorLOD due to imprecision including poor differentia-tion at levels that are clinically relevant. The standardprotocol for determining the lower LOD is to measurea zero standard (no analyte present) multiple times (20replicates) and calculate the standard deviation. The3 SD range is considered “noise” and the value at theupper end of the 3 SD is the lower LOD. In coagula-tion, this lower limit is sometimes difficult to ascertainsince finding a true “zero” standard that is plasma-based is not available. Usually, the “zero” standardplasma is an artificially created sample since clinicallyrelevant “zero” samples are not available. It is impor-tant to understand the lower LOD of the assay in rela-tion to the clinical use of the assay. A good exampleof this relationship is found in hemophilia testing inwhich it is important to clinically distinguish betweena level of �1% and 3%. If the lower LOD is only 3%,then patients with severe hemophilia (major bleedingsymptoms) cannot be differentiated from moderatehemophilia (milder bleeding symptoms). The labora-tory must decide what analyte level is necessary forclinical utility for each method and then make surethe assay meets those criteria.
There are a number of different “detection limits”that must be taken into account in the overall eval-uation of the coagulation assay method (instrumentLOD, method LOD, reagent LOD, and plasma sub-strate LOD). Both the instrument detection limit andthe method detection limit are the main parametersfor the evaluation of a new method or new reagent–instrument system. This information is usually sup-plied by the manufacturer but should be verified bythe laboratory before using the assay. Confirmationstudies must be performed.
LOQs define the lowest amount of analyte that isquantifiable in the assay, and in addition, the LOQdefines the level at which two values can be distin-guished with acceptable precision and accuracy [10].In standard practice, the lower LOQ is statisticallydefined as 5–10 SD from the “zero” standard con-trol value; however, each method must be evalu-ated independently to determine the lowest level ofthe LOQ.
The laboratory in consultation with the clinical staffmust determine the clinically relevant lower LOQ foreach assay. For clinical purposes, the assay must beable to accurately differentiate the medical decisionpoints. However, the LOQ can be drastically differentamong methods, types of methods, types of resultsreported, and among laboratories. Coagulation assayssuch as the PT, aPTT, and some lupus anticoagulanttests have a large difference in LOQ since they areglobal assays measuring multiple factors.
The analytical measurement range (AMR) of ananalytical method is the interval between the upperand lower analyte concentrations for which the analyt-ical method has demonstrated a suitable level of pre-cision, accuracy, and linearity without pretreatment(dilutions) [2, 10]. Whereas the RR is the range ofanalyte concentration in which the analytical methoddemonstrates suitable precision, accuracy, and linear-ity with pretreatment (dilutions or concentration). ForRR, recovery studies are required to verify that pre-treatment (dilution or concentration) does not affectthe reported value. The precision and accuracy of amethod at the lower and upper limits of the RR andAMR are important, but even more important are theclinical needs (medical decision points) for the specificanalyte. The lower end of the linear range is usually themost important in coagulation, but may be the mostdifficult to establish at a clinically relevant level. Thelaboratory cannot report values lower than the loweststandard of the calibration curve. If the test methodcannot be reported to the level necessary for clinicalutility, then modifications of the method or alterna-tive methods must be used to achieve the desired levelincluding curves established for lower ranges, differentdilutions of the standards or other methods [2, 11].
The linearity is the ability to obtain results that aredirectly proportional between the instrument responseand the concentration of analyte within a givenrange [2, 12]. Linearity acceptance criteria are usuallybased on the statistical correlation coefficient of linear
15
CHAPTER 2
regression. Mathematical transformations of data canhelp to promote linearity if there is scientific evidencethat transformation is appropriate for the method. Agood example is the factor assay that may use semi-log or log–log transformations. It is important notto force the origin to zero in the calculation as thismay skew the actual best-fit slope through the clini-cally relevant range of use. For quantitative coagula-tion methods used for diagnosis and monitoring, theanalytical method must have a good proportional rela-tionship between analyte concentration and instru-ment response. The limit for the upper range mustnot exceed the level of the highest linear standard.
Methods for linearity determination of a coagula-tion quantitative method have changed over the lastdecade [2]. Linearity computations have evolved fromvisual assessment of the line to statistical analysis vialinear regression [2]. However, linear regression willnot readily define acceptable limits because many ofthe quantitative coagulation assays may be impreciseand have a poor linear fit. In the future, refined statis-tical methods including polynomial analysis will be astandard linearity assessment tool.
The robustness of an analytical procedure is a mea-sure of its capacity to remain unaffected by small tomoderate variations in method parameters and pre-analytical variables [13, 14]. It provides an indicationof the assay’s reliability during normal usage [13, 14].The important analytical parameters include differentmachines, operators, reagent lots, and sample prepa-ration, among a host of others.
Robustness is difficult to truly assess and is gener-ally associated with more problems with increasingcomplexity of the analytical system. The majority ofthe analysis for robustness is determined by the manu-facturer and usually approved by a regulatory agencysuch as the FDA. However, if the reagents are notdesigned and evaluated by the manufacturer or useddifferently than intended, then stated claims of themethod are not validated. In this case, the coagulationlaboratory must assume responsibility for determin-ing robustness. The pre-analytical variables that thelaboratory must evaluate are those encountered in theclinical setting, whereas the analytical parameters areevaluated based on the assay’s method, equipment,and reagents.
Ideally, robustness should be explored during thedevelopment of the assay method through the use of a
protocol. For such a protocol, one must first identifyvariables in the method that may influence the results.One might expect storage conditions and processingof the sample, minimal and maximal dilution, andthe type of dilutant; level of interference (hemolysis,lipemia, etc.) to have an effect on the assay. The pre-analytic issues are addressed elsewhere in this book(Chapter 4). This type of method manipulation willensure that the system components are robust.
Protocol
Before initiating any validation study, whether estab-lishing a new test, changing reagents or instruments,or changing methodology, a well-planned validationprotocol must be developed using sound scientific andclinical criteria [2, 15]. Commercial companies thatsupply the reagents and/or instruments typically pro-vide protocol outlines. The major components of avalidation protocol are presented in Table 2.1. Theprotocol must describe in detail the planned studiesincluding the statistics and defined acceptance criteria[15]. The protocol must be performed in a timely man-ner with adequate samples, standards, and calibrators.Much of the general information on validation proto-cols is described in documents provided by accreditingand standards organizations [1, 2, 6, 15].
After performing the validation protocol, the datamust be analyzed with predetermined statistical meth-ods such that the results and conclusions are presentedin a validation summary report. If the defined criteriaestablished in the protocol are met or any variationsthat might affect the overall conclusions are justified,then the method can be considered valid. The final val-idation report, along with all the data, statistical anal-yses, and the signatures and titles of all participants,including supervisors, laboratory director, sectiondirector, administrators, consultants, and reviewersare placed in the official standard operating proceduremanual or kept readily available for inspection.
Continued performance ofcoagulation/hemostasis assays
To ensure the continued accurate diagnosis and treat-ment of hemostatic disorders, long-term consistentassay precision and accuracy is necessary. For each
16