Embed Size (px)
Citation preview

Quality Management Framework in the WMO Global Atmosphere Watch
Programme
Oksana TarasovaWMO Research Department

The GAW Programme
End-to-end research programmerelated to atmospheric composition matters involving contribution from more than 100 countries
GAW groups of variables • Stratospheric Ozone and vertical
ozone distribution
• Greenhouse Gases (CO2 and its isotopes , CH4 and its isotopes, N2/O2ratio, N2O, SF6, CFCs and substitutes)
• Reactive Gases (O3, CO, VOCs, NOx, SO2)
• Total Atmospheric Deposition
• Aerosols
• UV Radiation
In total about 60 variables are included

GAW Implementation Plan (2016‐2023): “science for services”
IP builds upon the premise that atmospheric composition matters to:• climate, • weather
forecasting,• human health,• terrestrial and
aquatic ecosystems,
• agricultural productivity,
• aeronautical operations, etc

Paris Agreement – limit the temperature increase by 2C by limiting emissions
Calculations are for year in 2011
Fundamental problem – it is what you HAVE in the atmosphere, not what you PUT in the atmosphere, that controls the temperature
Human (9GtC in) – ocean (2.3GtC out) –biosphere(2.6GtC out)

How to get emissions?• “Bottom‐up” measurements
(SELF REPORTING)– Emissions reporting– Reported and “verified” offsets– Site‐specific measurements
• “Top‐down” measurements – Comprehensive atmospheric
observation system– Ecosystem and ocean
observations– Inverse modelling
• Combination of above
NDCsNDCs
Assuming that we know ocean and biosphericuptake
NDC are evaluated every 5 years -> are we on the right track?Where can we cut more?Are oceans and biosphere are working as expected?

The Integrated Global Greenhouse Gas Information System (IG3IS)
Goal: Support the success of post‐COP21 actions of nations, sub‐national governments, and the private sector to reduce climate‐disrupting GHG emissions through a sound‐scientific, measurement‐based approach that:
– reduces uncertainty of national emission inventory reporting, – identifies large and additional emission reduction opportunities, and
– provides nations with timely and quantified guidance on progress towards their emission reduction strategies and pledges (e.g., NDCs)
EC-68 endorsed the IG3IS concept paper

-
1,000
2,000
3,000
4,000
5,000
6,000
7,000
8,000
Emis
sion
s (k
t)
Mace Head - error barsrepresent the 5th and 95thpercentiles
DECC - error bars representthe 2.5th and 97.5thpercentiles
UK GHGI - error barsrepresent the 2.5th and97.5th percentiles
• Early (1990s) mismatch with the inventory.
• Difficult to understand, most likely cause is landfill emissions but retrospectively challenging to investigate.
• Inspired DECC to expand the network from 1 to 4 stations.
Example from UK report to UNFCCC: Methane

Page 9
100
50
20
Develop IG3IS System
Establish Baselines
Critical Period for detection of progress toward global emission reductions
Higher fidelity info to track and fine-tune progress
Enhance IG3IS System Maintain IG3IS System
Per
cent
of 2
016
Em
issi
ons
Time
How will UNFCCC “Global Stocktake” evaluate greenhouse gas emissions reductions?
2020 2030 2050 2100

Tier2 (Blue boxes):Aircraft spectrometers estimates local fluxes & attributes source sectors
Tier 3: Plume Imaging aircraft map point sources
50 km
500 m
Tier 1: Satelite detects hotspot region
500 km
Pixel size 1.5m
Example of additional emission reduction opportunitiesTu
rner
et a
l 201
5
Taft dairies
Kern River oil field
Elk Hills oil field
Dairies
Oil fields
Tier 4 (not shown):Surface observations
EnhancedActivity Data
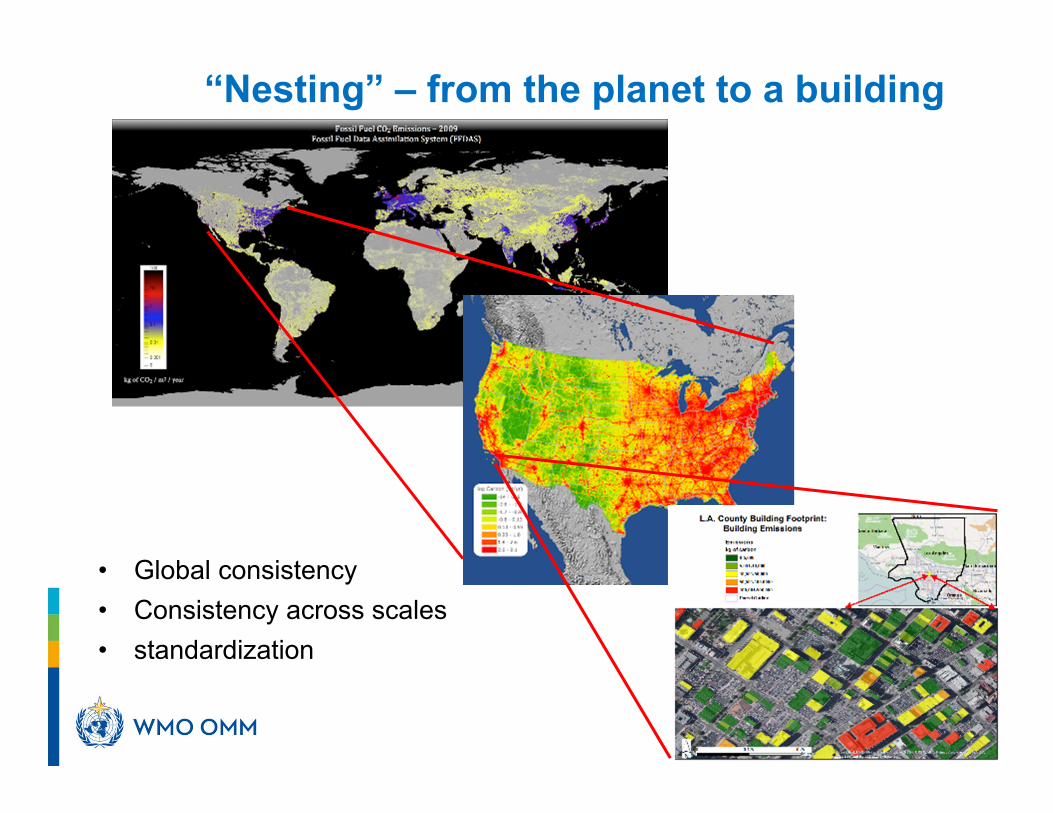
“Nesting” – from the planet to a building
• Global consistency• Consistency across scales• standardization

Motivation for the GAW Quality Assurance System
For GAW network compatibility is needed for:- Detection of small spatial gradients- Estimation of temporal trends/variability- Calculation of global averaged values- Use in inverse modelling and comparison with
model simulations - Comparison with satellite observations- Long-term stability of network reference
(possibility to joint programme at any time point without introducing the bias).
Adequate gathering of data related to state of the global atmosphere – and analysis of anthropogenic impact on a global scale – would require that all measurements be expressed in the same units and on the same scale, such that measurements performed by different countries are comparable.

Quality Management Framework principles
Network-wide use of only one reference standard or scale (primary standard).In consequence, there is only one institution that is responsible for this standard. Full traceability to the primary standard of all measurements made byGlobal, Regional and Local stations and of the primary standard of thecontributing networks. The definition of data quality objectives (DQOs). Establishment of guidelines on how to meet these quality targets, i.e.,harmonized measurement techniques based on Measurement Guidelines (MGs)and Standard Operating Procedures (SOPs). Establishment of MGs or SOPs for these measurements. Use of detailed log books for each parameter containing comprehensive metainformation related to the measurements, maintenance, and 'internal'calibrations. Regular independent assessments (system and performance audits). Timely submission of data and associated metadata to the responsible WorldData Centre as a means of permitting independent review of data by a widercommunity.

There are two realizations of network references:- reference materials- reference instruments
The reference materials are realized in the form of gas standards for long-lived greenhouse gases, some Volatile Organic Compounds (VOCs), NO, CO or reference solutions for precipitation chemistry measurements.
Measurements traceability in GAW
For ozone and for some aerosol characteristics the network references are realized though reference instruments, as direct realization of the substance is impossible or not practical.
In the area of UV Radiation measurements direct traceability to SI units has been broadly adopted.

Complexity of GAW QA implementation
• GAW has six groups of variables with completely different properties (long-lived gases, short-lived gases, total column, physical properties of aerosols, chemical properties of aerosols, chemical composition of aerosols and rain water)
• Different variables allow for different traceability chain• Different groups express requirements in a different way
Within GAW Central Calibration Laboratories are responsible for support of the network reference (standard or scale)

Data Quality Objectives for GHG
Reviewed at GGMT-2015
Component Compatibility goal Extended compatibility
goal
Range in unpolluted
troposphere
Range covered by the WMO scale
CO2 ± 0.1 ppm (Northern hemisphere)± 0.05 ppm (South. hemisphere)
± 0.2 ppm 380 - 450 ppm 250 – 520 ppm
CH4 ± 2 ppb ± 5 ppb 1750 – 2100 ppb 300 – 5900 ppbCO ± 2 ppb ± 5 ppb 30 – 300 ppb 30 - 500 ppbN2O ± 0.1 ppb ± 0.3 ppb 325 – 335 ppb 260 – 370 ppbSF6 ± 0.02 ppt ± 0.05 ppt 8 – 10 ppt 2.0 – 20 pptH2 ± 2 ppb ± 5 ppb 400 – 600 ppb 140 −1200 ppbδ13C-CO2 ± 0.01‰ ± 0.1‰ -7.5 to -9.5‰ vs.
VPDB-CO2δ18O-CO2 ± 0.05‰ ± 0.1‰ -2 to +2‰ vs.
VPDB-CO2∆14C-CO2 ± 0.5‰ ± 3‰ -50 - 50‰∆14C-CH4 ± 0.5‰ 50 - 350‰∆14C-COδ13C-CH4
± 2 molecules cm-3
± 0.03‰ ± 0.2‰0-25 molecules cm-3
δD-CH4 ± 1‰ ± 5‰O2/N2 ± 2 per meg ± 10 per meg -400 to -900 per
meg (vs. SIO scale)

Data Quality Objectives for Nitrogen Oxides
Level 1 (basic) 2 (enhanced) 3 (high)
Site characteristics Continental basic Continental background
Pristine, marine
background, free
troposphere
Mean mole fraction
NOx
> 1 nmol/mol 0.1 – 1 nmol/mol < 0.1 nmol/mol
Scope (corresponding
time resolution)
long term monitoring, trends (1 hour),
source‐receptor‐relationship, transport processes (hour‐minute),
photochemical process studies (minute)
Detection Limit
(1 hour, 3σ)
NO: 50 pmol/mol
NO2:100 pmol/mol
NO: 10 pmol/mol
NO2:20 pmol/mol
NO: 1 pmol/mol
NO2:5 pmol/mol
uncertainty
(1 hour, 2σ)2NO: 40 pmol/mol or 3%
NO2:80 pmol/mol or 5%
NO: 8 pmol/mol or 3%
NO2:15 pmol/mol or 5%
NO: 1 pmol/mol or 3%
NO2:3 pmol/mol or 5%
uncertainty
(1 month, 2σ)3NO: 2.5%
NO2: 3%
NO: 2.5%
NO2: 3%
NO: 1 pmol/mol or 2.5%
NO2:3 pmol/mol or 3%
data coverage 66%

GAW Global Central Facilities
Five types of central facilities:• Central Calibration Laboratories (CCLs)• Quality Assurance/Science Activity Centres
(QA/SACs)• World Calibration Centres (WCCs)• Regional Calibration Centres (RCCs)• World Data Centres (WDCs)

Stability of WMO Mole Fraction Scale for CO2
Courtesy of B.Hall

Propagation of WMO Mole Fraction Scale for CO2
WMO CO2 scale - Reference scale for CO2 in dry air, maintained by NOAA/GMD - Defined by 15 primary standards (~ 250 – 520 ppm)
Primary Standards Secondary Standards
Scale Transfer (NDIR)
Scale Transfer (NDIR)
Tertiary Standards
Courtesy of B.Hall

Stability of the Dobson primary instrument

Courtesy: J. Staehelin

“Health” of the observational network
GAW Station Information System (GAWSIS)
Procedures for stations and networks are in place
The observational network evolution follows the Rolling Review of Requirementprocess
GAW observational network comprises: • Global stations (31)• Regional stations• Local stations• Mobile platform• Contributing networks (10)

Implementation of the GAW QMF

Comparison campaigns• global Round Robin comparisons• regional reference gas comparisons• Laboratory Intercomparison Studies (LIS)
• regional intercomparison campaigns for Brewer and Dobson instruments
• international filter radiometer comparisons
• instrumental workshops (by World Calibration Centre for Aerosols).

• NOAA ESRL prepared 9 high pressure cylinders (3 sets) of clean dry air, collected at Niwot Ridge for the intercomparison.
• Labs were divided into 3 globally‐distributed groups.
WMO Round‐Robin comparisons
6th Round-robin (2014 -2015 ): 43 Labs registered
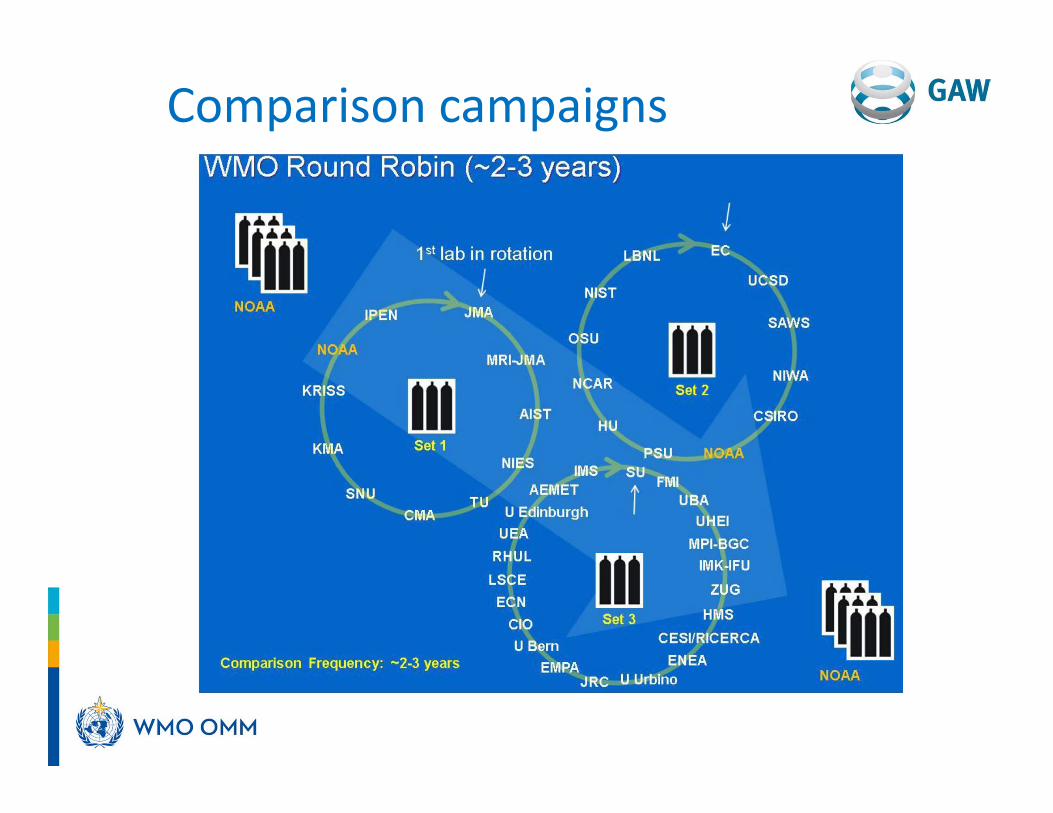
Comparison campaigns

Results of WMO Round‐Robin comparison

Laboratory IntercomparisonStudies (LIS) are taking place twice every year. 54 LISs have taken place74 laboratories reported measurements for the last study.
The results of each laboratory are presented in the form of a ring diagram http://www.qasac-americas.org/.
Precipitation chemistry measurementsThe Illinois State Water Survey that serves as the Quality Assurance/Science Activity Centre – Americas (QA/SAC-Americas), has been providing standards for precipitation chemistry samples for many years. This is done in the context of sending test solutions to National Atmospheric Deposition Program stations for use in the field, and for the interlaboratory QA samples sent by the QA/SAC.

Comparison of selected instruments: ambient air (World Calibration Centre for
Aerosol Physics)
0.1 1 101E-5
0.01
10
10000 TROPOS SM PS Ref 3 LACY TS I OPS CRET E TS I OPS IDAEA GRIMM Sky OPS ISAC GRIMM 108 O PS JRC TS I APS UHEL TS I APS NILU GRIMM 190
dN/d
logD
p (1
/cm
³)
Particle diameter ( m)
Lab 121: Overnight 01.10.2014
(Courtesy: Ali Wiedensohler)
Particle size distribution measurements

EUSAAR Audits 2008 (PFR vs. Aeronet)
Cabauw Ispra
(Courtesy: ChristophWehrli)
Difference depends on the wavelength

Annual Comparison Aeronet ‐ GAWPFR
Differen
ce dep
ends on locatio
n
(Courtesy: Christoph Wehrli)

Stations audits by Empa(1996‐2016)
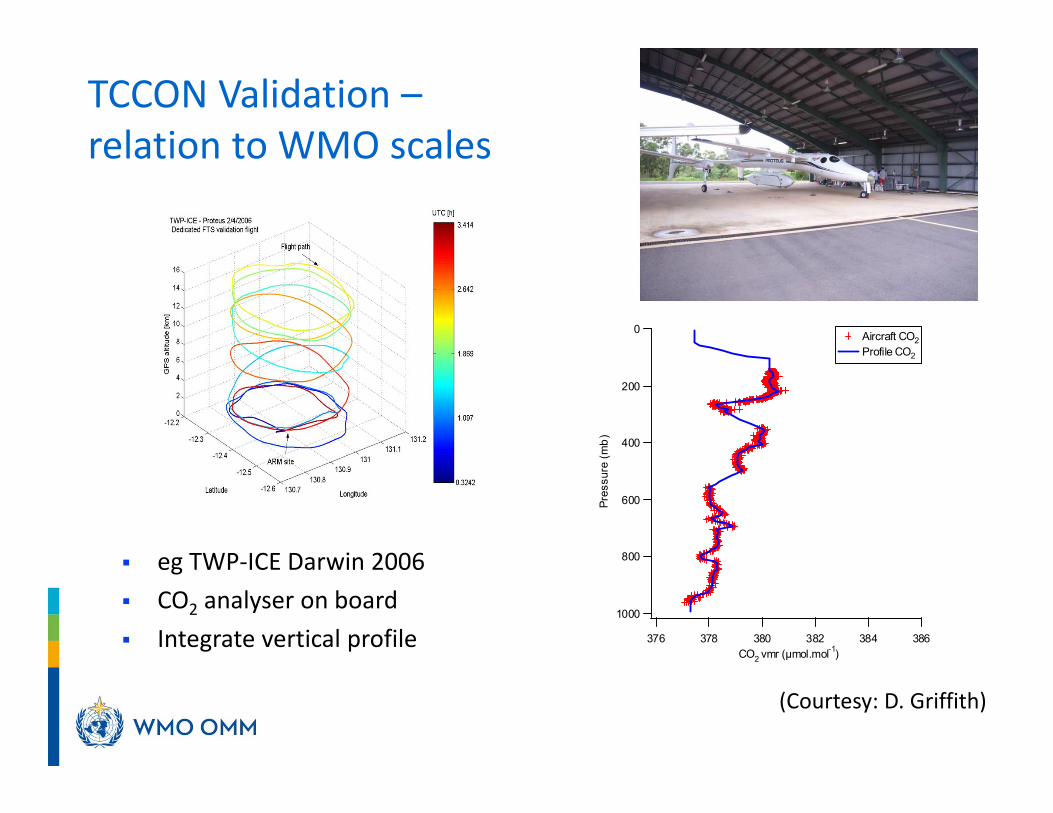
TCCON Validation –relation to WMO scales
eg TWP‐ICE Darwin 2006 CO2 analyser on board Integrate vertical profile
1000
800
600
400
200
0
Pres
sure
(mb)
386384382380378376CO2 vmr (µmol.mol-1)
Aircraft CO2 Profile CO2
(Courtesy: D. Griffith)

Outlook- a comprehensive Quality Management Framework has been
established in GW - It is extremely important that QA activities are properly funded,
that personnel are trained, that good practices are developed, and that recommendations of audits and comparison campaigns are followed.
- There are still gaps in the GAW Quality Assurance Framework (measurement guidelines and Central Facilities) to be filled
- There is a need for standardizations of DQOs and improved treatment of measurement uncertainties
Further improvement of the QA system in GAW requires improved collaboration with CIMO. In particular, the establishment of regional calibration centres and quality assurance centres utilizing CIMO regional facilities would be beneficial.

Thank youMerci