Embed Size (px)
Citation preview

National Institute of Statistics Aguascalientes, September 2009 and Geography, Mexico
Quality of Employment in Mexico
Country Report for the Task Force on the Measurement of Quality of Employment
Report prepared by Rodrigo Negrete and Guadalupe Luna

II
Contents
Introduction ................................................................................................................................................................................................1
1. Safety and ethics of employment ....................................................................................................................... 2
2. Income and benefits from employment ....................................................................................................... 16
3. Working Hours and balancing work and non-working life ................................................................... 18
4. Security of employment and social protection .......................................................................................... 23
5. Social Dialogue and workplace relationships ............................................................................................. 27
6. Skills development and life-long learning ................................................................................................... 29
7. Workplace relationships and intrinsic nature of work ............................................................................. 30
Conclusions .............................................................................................................................................................................................. 31

MEXICO COUNTRY REPORT ON THE QUALITY OF EMPLOYMENT
Introduction
The idea on focusing labor data on the quality of employment couldn’t be more attractive among labor statisticians in a country with the complexity and characteristics of Mexico. Currently it has almost 108 million inhabitants within its territory, and its labor force size amounts to almost 46 million facing right now one of the severest economic crises ever in a country used to be hit by serious economic shocks one and again during a period that by now extended for what equals a third of a century. Amongst the fifteenth biggest economies in the world it is possible the one registering this year the sharpest GDP fall is Mexico with a two digits expected drop, yet the puzzle consists in that its unemployment rate -even though in the midst of the worst moment where the AH1N1 virus emergence drag down even further the economy- remains one of the lowest amongst OECD nations. True Mexico’s UR two folds in a matter of months but we are talking here of a 6.3% UR (August) whereas the US’ one is 9.7% or is near 18% in Spain. Even amongst Latin American countries Mexico’s UR remains low. Take for example Brazil, which is one of Latin American less affected by the recession with a forecasted growth of about 4% this year however registering in July an Unemployment Rate of 8.5%.
Mexico has a robust, update and conceptually solid Labor Force Survey1 well establish within its Statistical System so the explanation has nothing to do with the method of measurement be it sample design, the concepts adopted or the way they are made operative. The standard explanation on respect Mexico exceptionality in this regard has pointed out to the fact that there has not been implemented a national unemployment insurance2 (Brazil has a six month duration one) as well the buffer effect of both a large informal sector and large migration flows. Indeed during many years before the current US recession the country transferred- by means of migration- part of its labor pressure to the US so a good deal of the unemployed or about to be unemployed labor force simply crossed the border. In this sense the interpretation suggests the UR historically registered in Mexico -rather than be what lies at the bottom of the migration phenomenon- simply reflect it so in the end the level of unemployment seen resulted more a kind of effect than a cause: what can be observed if it is taken into account a labor market where supply was national meanwhile the demand was not altogether national but supra national as well.
Despite this, it is interesting to see at present that even though migration flows have experienced a sensible decrease due the simple fact that the recession started in the US in the first place and that the size of Informal Sector is comparable between Mexico and Brazil, the unemployment rate of the former has not sky rocketed. It suggests, for the first time, that the conventional explanation of the buffer effect might be an overplayed card after all or in any case has been not enough. There is something else behind with a bearing in deciphering what’s going on.
1 Mexico’s Labor Force is known as ENOE: Encuesta Nacional de Ocupación y Empleo, conducted in a continuous basis nationwide with quarter samples of 120,260 dwellings where there lives a little bit less half million people. The questionnaire design takes into account the ILO/ICLS recommendations on identifying labor force and unemployment (XIII ICLS,1982); informal sector employment (XV ICLS, 1993); informal employment as a more encompassing concept (XVII ICLS, 2003) as well those on time related underemployment (XVI ICLS, 1998). Besides In all its features follows closely the ILO guidelines set in the so called Purple Book: Employment, Unemployment and Underemployment: An ILO manual on concepts and methods (Genève, second edition, 1992). 2 A public sponsored unemployment insurance only has been adopted in the Nation’s capital, that is Mexico City or more accurately said Mexico D.F.
2
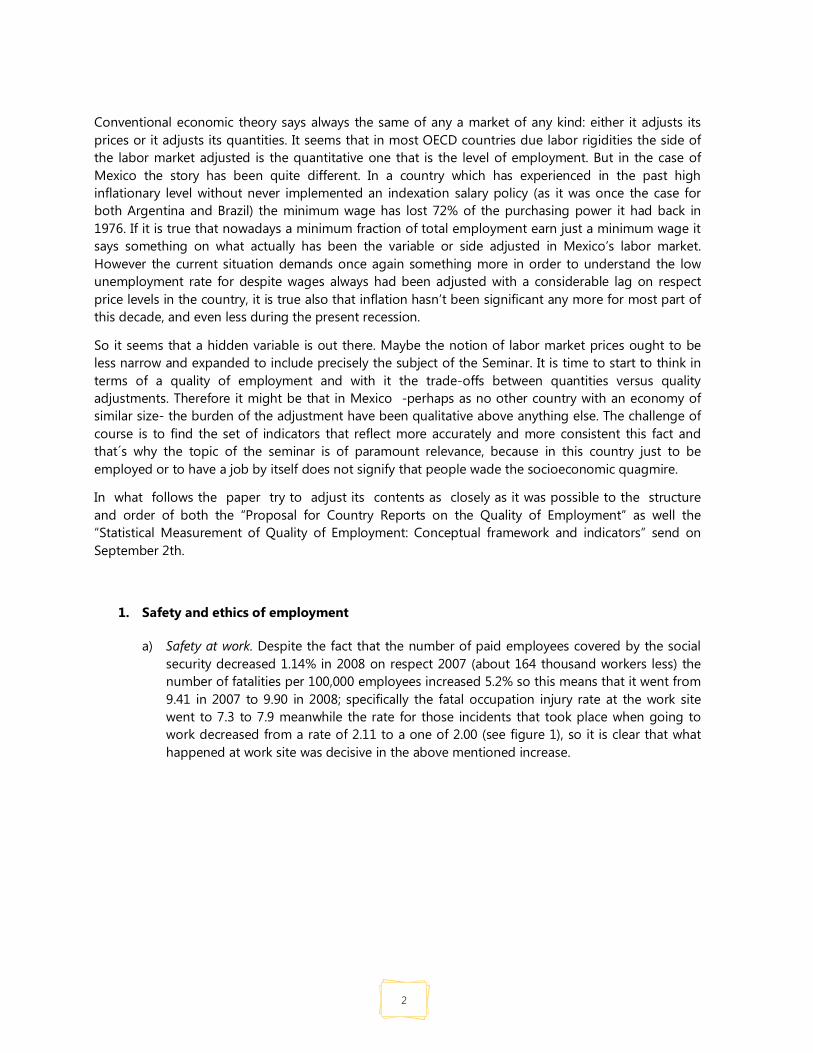
Conventional economic theory says always the same of any a market of any kind: either it adjusts its prices or it adjusts its quantities. It seems that in most OECD countries due labor rigidities the side of the labor market adjusted is the quantitative one that is the level of employment. But in the case of Mexico the story has been quite different. In a country which has experienced in the past high inflationary level without never implemented an indexation salary policy (as it was once the case for both Argentina and Brazil) the minimum wage has lost 72% of the purchasing power it had back in 1976. If it is true that nowadays a minimum fraction of total employment earn just a minimum wage it says something on what actually has been the variable or side adjusted in Mexico’s labor market. However the current situation demands once again something more in order to understand the low unemployment rate for despite wages always had been adjusted with a considerable lag on respect price levels in the country, it is true also that inflation hasn’t been significant any more for most part of this decade, and even less during the present recession.
So it seems that a hidden variable is out there. Maybe the notion of labor market prices ought to be less narrow and expanded to include precisely the subject of the Seminar. It is time to start to think in terms of a quality of employment and with it the trade-offs between quantities versus quality adjustments. Therefore it might be that in Mexico -perhaps as no other country with an economy of similar size- the burden of the adjustment have been qualitative above anything else. The challenge of course is to find the set of indicators that reflect more accurately and more consistent this fact and that´s why the topic of the seminar is of paramount relevance, because in this country just to be employed or to have a job by itself does not signify that people wade the socioeconomic quagmire.
In what follows the paper try to adjust its contents as closely as it was possible to the structure and order of both the “Proposal for Country Reports on the Quality of Employment” as well the “Statistical Measurement of Quality of Employment: Conceptual framework and indicators” send on September 2th.
1. Safety and ethics of employment
a) Safety at work. Despite the fact that the number of paid employees covered by the social security decreased 1.14% in 2008 on respect 2007 (about 164 thousand workers less) the number of fatalities per 100,000 employees increased 5.2% so this means that it went from 9.41 in 2007 to 9.90 in 2008; specifically the fatal occupation injury rate at the work site went to 7.3 to 7.9 meanwhile the rate for those incidents that took place when going to work decreased from a rate of 2.11 to a one of 2.00 (see figure 1), so it is clear that what happened at work site was decisive in the above mentioned increase.

3
The Non Fatal Occupation Injury Rate went from 3,120 per 100,000 employees in 2007 to 3,555 in 2008; specifically the rate of non fatal injured by workplace accidents in the last year was 2,883; the cases of injures going to the work site were 646 per 100,000 workers and the rate of workers affected by workplace related diseases was of almost 26 (figure 2).
All these rates shown an increase on respect the previous year, so it seems quite plausible to think that many enterprises in anticipating the effects of the economic recession in the United States that in turn deeply affects Mexico reduced costs including those related with safety at work. Unfortunately there is not data to confirm this, but the direction that all the information consistently moves makes almost unavoidable the conclusion.
On respect this data the source is the Mexican Institute of Social Security (IMSS by its Spanish Acronym) which not only collects both workers and employers contribution to
9.417.30
2.11
9.907.90
2.000
2
4
6
8
10
Fatalities per 100 000 employees
At the work site per 100 000 employees
Going to the work site per 100 000 employees
20072008
Source: Instituto Mexicano del Seguro Social (IMSS) and Ministry of Labour (STPS).
3 555
2 883
646
26
0
500
1 00
0
1 50
0
2 00
0
2 50
0
3 00
0
3 50
0
4 00
0
Workers affected by work related accidents or diseases
Workers injured by workplace accidents
Workers injured going to the work site
Workers affected by workplace related diseases
Source: Instituto Mexicano del Seguro Social (IMSS) and Ministry of Labour (STPS).
Figure 1 Fatal occupational injury rate, 2007 - 2008
Figure 2 Non fatal occupational disease and injury rate (Per 100 000 employees)

4
the social security but also provides health care of all those affiliated by means of a net of hospital and clinics widely disseminated in the territory. The data is updated twice a year and is reliable at its broad categories. The problem however has to do with coverage because this statistics refers only to employees with a formal attachment to formal economic units. In other words if the employee works in the informal sector as it is understood by the XV ICLS, 1993 or participate in the processes of formal economic units without a formal labor attachment (a concern of the XVII ICLS, 2003) there is not an equivalent statistic to figure out which is the situation on this regard of a huge segment of unprotected labor force by social security. Adding up employees operating either in the informal sector or doing so under informal labor relationships for a formal economic unit the resulting figure amounts to 13 million in the second quarter of 2009: 45% of total paid workers. This is the percentage of paid employees we have not similar data on accidents or diseases related with their economic activity.
To have an idea of the total amount of employees that might be working in hazardous conditions or at least the significance of those from whom it is conceivable they are working on a level of risk above an average, better is to take a look on the information provided by ENOE, the Mexican Labor Force Survey, which, as any other household survey of its kind has the advantage to provide the widest panoramic we can get. Using ISCO classification and adding up all those employees committed in physical tasks and/or with a close interaction with machinery and equipment, plus those in freight transportation as well in construction industry it is estimated that between a third and 40% of Mexico’s total paid employees operate with a certain level of risk every day. The share was 39.4% in 2005 and went down to 37.1% in 2009 (second quarters, see figure 3) however this decrease might not bear any interpretations of improving labor conditions. They rather point out to the structure of employment and the fact that maybe in the midst of a recession in the extent that industries more affected are those of tradable commodities the employment composite becomes more tilted to tertiary activities with a smaller demand of physical work.
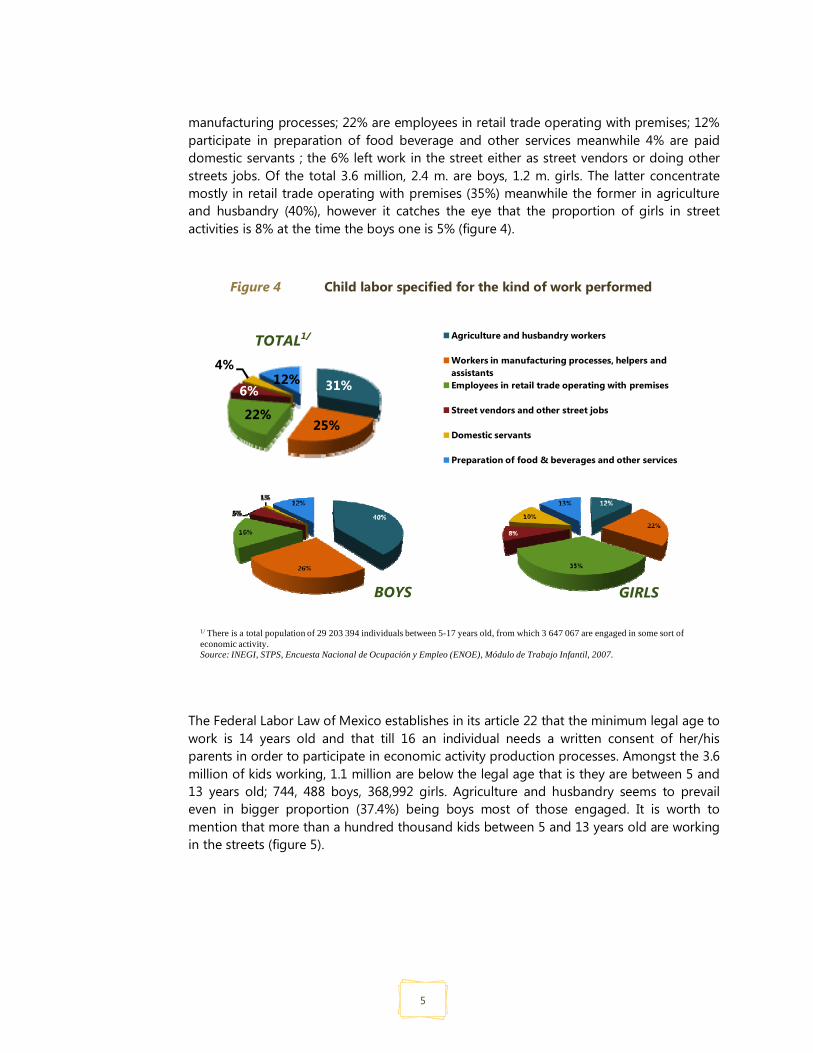
b) Child labor and worst forms of child labor. Mexico is a country of about 29.2 million individuals between 5 and 17 year old; 3.6 million are engaged in some kind of work either under the modality of paid work or as contributing family members. About 31% operate in agriculture and husbandry activities; 25% are workers, helpers or assistants in
Second quarters
Year Total Men Women
2005 39.36 51.70 18.12
2006 39.02 51.36 17.92
2007 38.60 51.38 17.07
2008 38.58 51.46 16.77
2009 37.10 50.18 14.94
Figure 3 Share of employees working in hazardous conditions
Source: INEGI, STPS, Encuesta Nacional de Ocupación y Empleo (ENOE).
5
manufacturing processes; 22% are employees in retail trade operating with premises; 12% participate in preparation of food beverage and other services meanwhile 4% are paid domestic servants ; the 6% left work in the street either as street vendors or doing other streets jobs. Of the total 3.6 million, 2.4 m. are boys, 1.2 m. girls. The latter concentrate mostly in retail trade operating with premises (35%) meanwhile the former in agriculture and husbandry (40%), however it catches the eye that the proportion of girls in street activities is 8% at the time the boys one is 5% (figure 4).
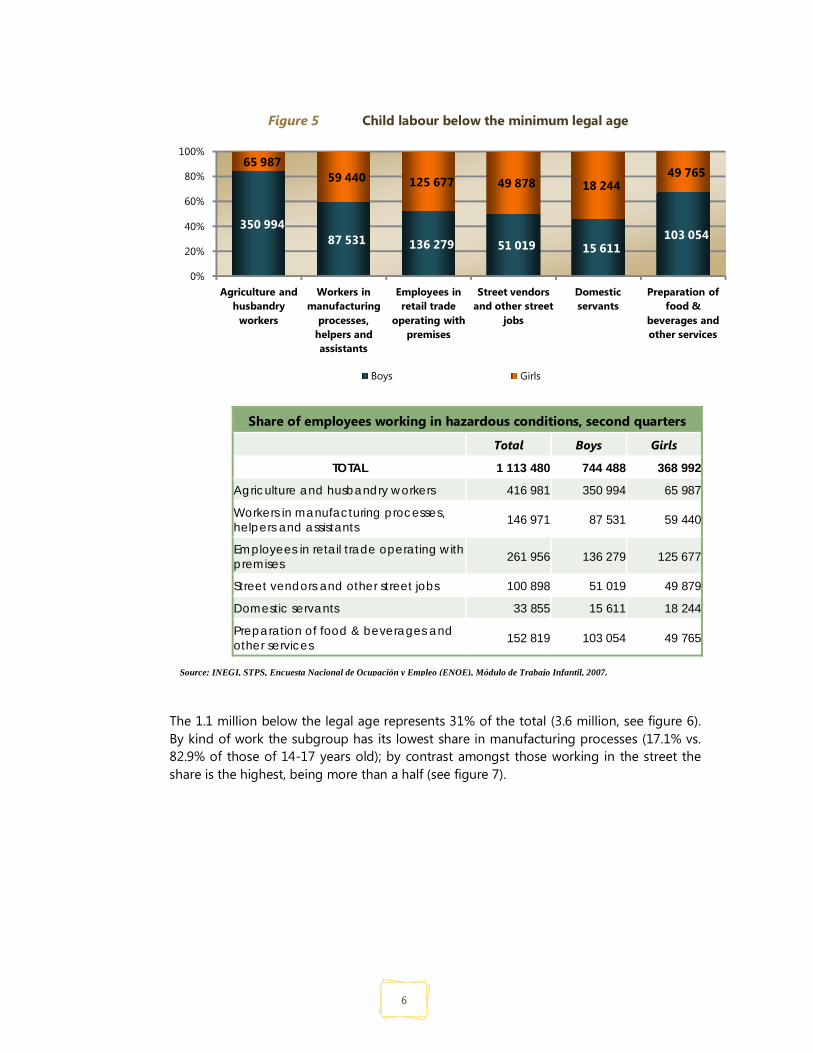
The Federal Labor Law of Mexico establishes in its article 22 that the minimum legal age to work is 14 years old and that till 16 an individual needs a written consent of her/his parents in order to participate in economic activity production processes. Amongst the 3.6 million of kids working, 1.1 million are below the legal age that is they are between 5 and 13 years old; 744, 488 boys, 368,992 girls. Agriculture and husbandry seems to prevail even in bigger proportion (37.4%) being boys most of those engaged. It is worth to mention that more than a hundred thousand kids between 5 and 13 years old are working in the streets (figure 5).
31%
25%22%
6%
4%12%
Agriculture and husbandry workers
Workers in manufacturing processes, helpers and assistantsEmployees in retail trade operating with premises
Street vendors and other street jobs
Domestic servants
Preparation of food & beverages and other services
1/ There is a total population of 29 203 394 individuals between 5-17 years old, from which 3 647 067 are engaged in some sort of economic activity.Source: INEGI, STPS, Encuesta Nacional de Ocupación y Empleo (ENOE), Módulo de Trabajo Infantil, 2007.
GIRLS
Figure 4 Child labor specified for the kind of work performed
BOYS
TOTAL1/
6
The 1.1 million below the legal age represents 31% of the total (3.6 million, see figure 6). By kind of work the subgroup has its lowest share in manufacturing processes (17.1% vs. 82.9% of those of 14-17 years old); by contrast amongst those working in the street the share is the highest, being more than a half (see figure 7).
350 99487 531 136 279 51 019 15 611
103 054
65 98759 440 125 677 49 878 18 244
49 765
0%
20%
40%
60%
80%
100%
Agriculture and husbandry
workers
Workers in manufacturing
processes, helpers and assistants
Employees in retail trade
operating with premises
Street vendors and other street
jobs
Domestic servants
Preparation of food &
beverages and other services
Boys Girls
Share of employees working in hazardous conditions, second quarters
Total Boys Girls
TOTAL 1 113 480 744 488 368 992
Agriculture and husbandry workers 416 981 350 994 65 987
Workers in manufacturing processes, helpers and assistants 146 971 87 531 59 440
Employees in retail trade operating with premises 261 956 136 279 125 677
Street vendors and other street jobs 100 898 51 019 49 879
Domestic servants 33 855 15 611 18 244
Preparation of food & beverages and other services 152 819 103 054 49 765
Figure 5 Child labour below the minimum legal age
Source: INEGI, STPS, Encuesta Nacional de Ocupación y Empleo (ENOE), Módulo de Trabajo Infantil, 2007.

7
Child labour of 5 to 13 years old
TOTAL 1 113 480
Agriculture and husbandry workers 416 981
Workers in manufacturing processes, helpers and assistants
146 971
Employees in retail trade operating with premises 261 956
Street vendors and other street jobs 100 898
Domestic servants 33 855
Preparation of food & beverages and other services
152 819
31%
69%
5 to 13 years old
14 to 17 years old
Source: INEGI, STPS, Encuesta Nacional de Ocupación y Empleo (ENOE), Módulo de Trabajo Infantil, 2007.
Figure 6 Child labour below 18 years old
Source: INEGI, STPS, Encuesta Nacional de Ocupación y Empleo (ENOE), Módulo de Trabajo Infantil, 2007.
Figure 7 Child labour below 18 years old
BOYS GIRLS
TOTAL

8
Taking the group as a whole (5-17) and after classifying those activities considered more risky it obtains that 40% are engaged in hazardous activities. A proportion little bit above of that estimated for the Mexico’s total employment. Seen by specific age subgroup the share of those engaged in such classified activities goes up with age and with it also the proportion of boys, more than girls, in being exposure so the proportion gap widen up more visible for the 14-17 group (see figure 8).
The average weekly hours worked also climb up, as expected, with age so the 5-9 years old subgroup is 9.9 hours; the one for the next that is 10-13 is 11.9 hours and finally the weekly average for those 14-17 goes to 15.4; of the total 3.6 million, 280 thousand works 25 to 34 hours a week; almost 1.3 million do so for more than 35 hours so adding up there are 1.6 cases working more than 24 hours in a week (figure 9) which means that 44% are in that situation meanwhile in the other hand a million (28%) works less than 15 hours. It is worth to mention that within this last group most cases actually are below 6 hours a week, so their number is enough to pull down the averages observed for each age group.
0.5
1.0
0.50.3
1.3
0.0
0.2
0.4
0.6
0.8
1.0
1.2
1.4
Whit no fixed schedule
Less than 15 hours
15 - 24 hours 25 - 34 hours 35 and more
Figure 8 Employment of persons below 18 years in designated Hazardous industries and occupations
Source: INEGI, STPS, Encuesta Nacional de Ocupación y Empleo (ENOE), Módulo de Trabajo Infantil, 2007.
Figure 9 Employment of persons below 18 years working More than 24 weekly hours

9
The data source is a special module (MTI by its Spanish acronym) that goes with the Mexican Labor Force Survey (ENOE) as a second phase interview once in the first one (ENOE) has been identifying those eligible households with at least one kid in the age group of study. All the information refers to the 2007 fourth quarter: the next round of MTI is going to take place during the fourth quarter 2009, so it is planned to be conducted on a biannual basis. It is important to mention that this strategy has a limitation specifically on respect those kids making a living in the streets because the survey axis that is ENOE has as a unit of selection private dwellings: this means that in the case a kid is homeless, there is no way to be observed by this mechanism.
c) Fair treatment in employment. In Mexico live 55.3 million women, 41.4 million of them with legal working age (14 years old on). Amongst them 17.1 million are in the labor force. The share in total employment has registered an increase during the last five years going from 36.6% in 2005 to 37.5% in 2009(second quarters). The change is not negligible if taking into account that this is a structural indicator tending to remain around the same figures during a number of years. On respect the share women have in wage jobs the increase has been at a slightest slower pace going from 37.4 to 38.2 during the same period (figure 10).
35
36
37
38
39
I II III IV I II III IV I II III IV I II III IV I II
2005 2006 2007 2008 2009
Share of women in total employment
Share of women in total salary jobs
Source: INEGI, STPS, Encuesta Nacional de Ocupación y Empleo (ENOE), Módulo de Trabajo Infantil, 2007.
Figure 10 Fair treatment in employment: women

10
Information for second quarters
Year Share of
women in total employment
Share of women in total
salary jobs 2005 36.62 37.42 2006 36.97 37.95 2007 37.44 38.41 2008 37.53 38.18 2009 37.48 38.18
Inequality not doubt is an issue. One way to see it is keeping in mind that in Mexico the school attainment is bigger in women (9.5 school years approved in average, that is little bit above junior high school) than men (8.9 years in average) however the hourly earnings amongst wage worker is practically the same so the educational returns seems not to be fully reflected in the labor market. By means of a salary discrimination index that interplays with both indicators(educational attainment and remuneration for both men and women) it obtains negative values making clear that the educational return is not altogether effective for women; neither it is perceptible a breaking point in this regard during the last five years (figure 11).
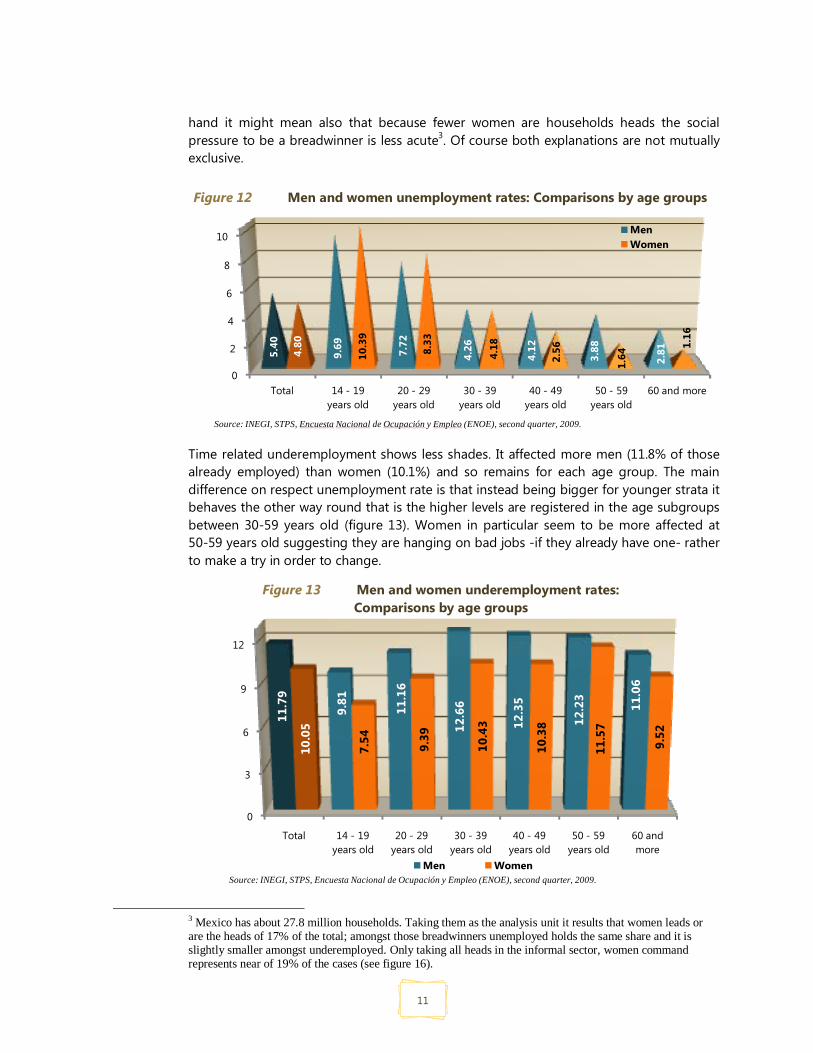
In Mexico the Unemployment rate normally has been higher in the case of women than men. The recession, in the extent it affected more deeply such activities as construction and automobile industry where more men than women are involved change the landscape so the former has been the group hit by layoffs in highest degree. If Nowadays men’s UR is bigger it not holds for all the age groups, especially those between 14 and 29 years old: women’s UR reaches 10.4% vs. 9.7% for the group 14-19 and its is of 8.3% vs. 7.7% for the 20-29 age group.
The rates are almost the same for the next age group (30-39) and decrease from then on with age for both sexes however at a higher degree on respect women (figure 12). This suggest that chances are harder for women to be reincorporated in the labor market as years go by so making less sense to be an active job seeker from 40 years on. In the other
-0.20
-0.15
-0.10
-0.05
I II III IV I II III IV I II III IV I II III IV I II
2005 2006 2007 2008 2009
Source: INEGI, STPS, Encuesta Nacional de Ocupación y Empleo (ENOE).
Salary discrimination index for second
quarters
2005 -0.11 2006 -0.12 2007 -0.13 2008 -0.11
2009 -0.13
Source: INEGI, STPS, Encuesta Nacional de Ocupación y Empleo (ENOE).
Figure 11 Salary discrimination index
11
hand it might mean also that because fewer women are households heads the social pressure to be a breadwinner is less acute3. Of course both explanations are not mutually exclusive.
Time related underemployment shows less shades. It affected more men (11.8% of those already employed) than women (10.1%) and so remains for each age group. The main difference on respect unemployment rate is that instead being bigger for younger strata it behaves the other way round that is the higher levels are registered in the age subgroups between 30-59 years old (figure 13). Women in particular seem to be more affected at 50-59 years old suggesting they are hanging on bad jobs -if they already have one- rather to make a try in order to change.
3 Mexico has about 27.8 million households. Taking them as the analysis unit it results that women leads or are the heads of 17% of the total; amongst those breadwinners unemployed holds the same share and it is slightly smaller amongst underemployed. Only taking all heads in the informal sector, women command represents near of 19% of the cases (see figure 16).
0
2
4
6
8
10
Total 14 - 19 years old
20 - 29 years old
30 - 39 years old
40 - 49 years old
50 - 59 years old
60 and more
5.40
9.69 7.72
4.26
4.12
3.88
2.814.
80
10.3
9
8.33
4.18
2.56
1.64
1.16
MenWomen
Source: INEGI, STPS, Encuesta Nacional de Ocupación y Empleo (ENOE), second quarter, 2009.
0
3
6
9
12
Total 14 - 19 years old
20 - 29 years old
30 - 39 years old
40 - 49 years old
50 - 59 years old
60 and more
11.7
9
9.81
11.1
6
12.6
6
12.3
5
12.2
3
11.0
6
10.0
5
7.54 9.39
10.4
3
10.3
8
11.5
7
9.52
Men WomenSource: INEGI, STPS, Encuesta Nacional de Ocupación y Empleo (ENOE), second quarter, 2009.
Figure 12 Men and women unemployment rates: Comparisons by age groups
Figure 13 Men and women underemployment rates: Comparisons by age groups
12
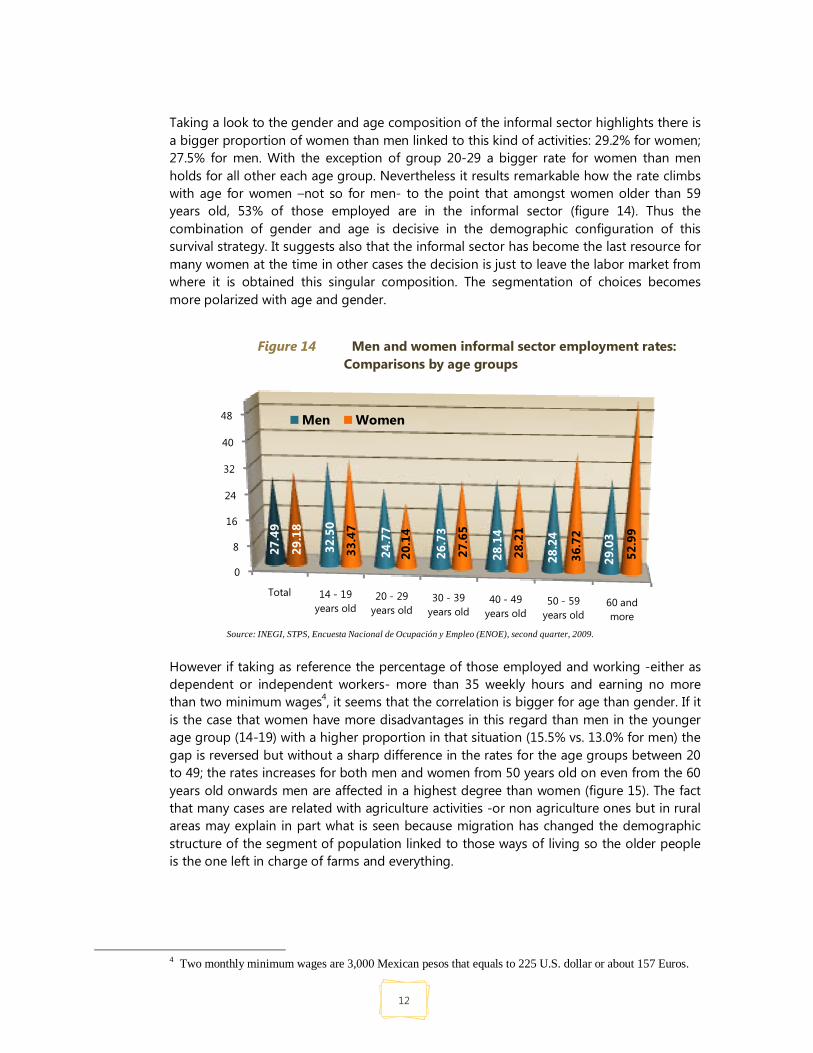
Taking a look to the gender and age composition of the informal sector highlights there is a bigger proportion of women than men linked to this kind of activities: 29.2% for women; 27.5% for men. With the exception of group 20-29 a bigger rate for women than men holds for all other each age group. Nevertheless it results remarkable how the rate climbs with age for women –not so for men- to the point that amongst women older than 59 years old, 53% of those employed are in the informal sector (figure 14). Thus the combination of gender and age is decisive in the demographic configuration of this survival strategy. It suggests also that the informal sector has become the last resource for many women at the time in other cases the decision is just to leave the labor market from where it is obtained this singular composition. The segmentation of choices becomes more polarized with age and gender.
However if taking as reference the percentage of those employed and working -either as dependent or independent workers- more than 35 weekly hours and earning no more than two minimum wages4, it seems that the correlation is bigger for age than gender. If it is the case that women have more disadvantages in this regard than men in the younger age group (14-19) with a higher proportion in that situation (15.5% vs. 13.0% for men) the gap is reversed but without a sharp difference in the rates for the age groups between 20 to 49; the rates increases for both men and women from 50 years old on even from the 60 years old onwards men are affected in a highest degree than women (figure 15). The fact that many cases are related with agriculture activities -or non agriculture ones but in rural areas may explain in part what is seen because migration has changed the demographic structure of the segment of population linked to those ways of living so the older people is the one left in charge of farms and everything.
4 Two monthly minimum wages are 3,000 Mexican pesos that equals to 225 U.S. dollar or about 157 Euros.
0
8
16
24
32
40
48
Total 14 - 19 years old
20 - 29 years old
30 - 39 years old
40 - 49 years old
50 - 59 years old
60 and more
27.4
9
32.5
0
24.7
7
26.7
3
28.1
4
28.2
4
29.0
3
29.1
8
33.4
7
20.1
4
27.6
5
28.2
1
36.7
2
52.9
9
Men Women
Source: INEGI, STPS, Encuesta Nacional de Ocupación y Empleo (ENOE), second quarter, 2009.
Figure 14 Men and women informal sector employment rates: Comparisons by age groups

13
Before abound a little bit more on aging population one indicator about women worth to consider is the percentage with kids and without a couple (widows, divorced, separate or single) on respect total women in the labor force and to observe it taken into account different situations these women have to face (figure 17). So little bit above one third of total women either in the labor force as a whole or specifically employed are in this situation, however the share goes up to a 41.5% amongst those unemployed. In the other
0
5
10
15
20
Total 14 - 19 years old
20 - 29 years old
30 - 39 years old
40 - 49 years old
50 - 59 years old
60 and more
13.0
7
13.0
1
12.1
8
12.0
5
12.3
3
13.3
5
19.4
8
12.2
6 15.5
3
11.8
5
11.2
5
10.9
1 13.2
9
17.0
7
Men Women
Source: INEGI, STPS, Encuesta Nacional de Ocupación y Empleo (ENOE), second quarter, 2009.
82.9 82.8 83.4 81.3
17.1 17.2 16.6 18.7
0%
20%
40%
60%
80%
100%
Households lead by individuals in the
labour force
Households heads unemployed
Households heads underemployed
Households heads in the informal sector
Lead by women Lead by men
Source: INEGI, STPS, Encuesta Nacional de Ocupación y Empleo (ENOE), second quarter, 2009.
Figure 15 Men and women working more 35 weekly hours and earning less than two minimum wages: comparisons by age groups
Figure 16 Comparison of men and women in the labour Force leading households

14
hand 31.2% of women with a job not attached to a health care scheme whatsoever have no couple. These are the kind of vulnerable situations to focus on under a gender perspective.
Currently in Mexico are living about 10.6 million of individuals 60 of years old or more, 3.5 million are in the labor force. During the last 5 years their share in total employment has remained around 8% without significant statistical changes. Their share on respect salary jobs has been even smaller being of 4.1% in 2009 (figure 18).
33.96
33.69
38.46
31.21
41.47
0 5 10 15 20 25 30 35 40 45
% women in the labour force
% women employed
% women with jobs that gives them health care access
% women with jobs that does not give them health care access
% women unemployed
1/ Widows, divorces, separated, single.Source: INEGI, STPS, Encuesta Nacional de Ocupación y Empleo (ENOE), second quarter, 2009.
3
5
6
8
9
I II III IV I II III IV I II III IV I II III IV I II
2005 2006 2007 2008 2009
Share of senior citizens in total employment Share of senior citizens in total salary jobs
Figure 18 Share of senior citizens in total employment, 2005 - 2009
Figure 17 Women in the labour force with kids and without couple 1/ Shares on respect total women with kids in each category

15
Information for second quarters
Year Share of senior citizens in total
employment
Share of senior citizens in total
salary jobs
2005 7.97 3.85
2006 8.00 3.86
2007 7.89 3.91
2008 8.02 3.91
2009 8.02 4.09
So most of senior citizens are out of the labor force (about 7 million) however it is important to note that from them about 1.1 million if passive on respect labor markets (that is they are not active job seekers) they wish or are willing to work were an opportunity to hold (figure 19). This is another way to confirm how this demographic group assesses its chances in a labor market they perceive hostile to their needs and aspirations. To have an age perspective is as necessary as the gender one in describing fair treatment in employment in Mexico.
The source of all this information is ENOE the Mexican Labor Force Survey which guarantee the availability of all this data for every each quarter. As on regard other disadvantaged groups such ethnic minorities and persons with disabilities the sample design of a conventional LFS do not normally guarantee they are well represented in the sample and thus to yield robust estimations grounded in enough and unbiased number of observations. In the case of ethnic groups there are more than sixty in the country each with its own dialect and specific geographic distribution dispersed in a territory of about 2 million square kilometers. In the case of people disabilities the most efficient sampling is one based on a directory rather than to sample a given area. To elaborate as well update
0
2
4
6
8
10
12
Total Labour force Employed Unemployed Not in the labour force
Willing to work but not looking for a
job
10.60 3.54 3.46 0.08 7.05 1.14
Mill
ions
Source: INEGI, STPS, Encuesta Nacional de Ocupación y Empleo (ENOE), second quarter, 2009.
Source: INEGI, STPS, Encuesta Nacional de Ocupación y Empleo (ENOE).
Figure 19 Senior citizen population by activity condition

16
these directories however have proved to be the biggest challenge in order to implement specific surveys addressed to this group.
2. Income and benefits from employment
a) Income from employment. Because of the characteristic lag of minimum wages adjustments5 in Mexico on respect inflation, of total paid employees (that is not including contributing family members and apprentices) nowadays only 9.7% earn that income or less than that; most cases earn either between one up two mw (27.9%) or between two up to three mw (26.7%). It is worth to note that the shares by sex change notoriously way up the ladder so for those earning less than one mw 51.8% are men, 48.2% women however if one take a look of the gender composition of those earning more than 5 mw, 67.1% are men (see figure 20).
Share income from employment, second quarter 2009
Men Women
Up to 1 minimum wage 51.80 48.20
More than 1 up to 2 minimum wage 57.04 42.96
More than 2 up to 3 minimum wage 66.83 33.17
More than 3 up to 5 minimum wage 68.02 31.98
More than 5 minimum wage 67.06 32.94
5 There are three minimum wages in Mexico depending on the geographical area. The average is about 112 U.S dollars in a month or 78 Euros.
Figure 20 Income from employment, second quarter 2009
Source: INEGI, STPS, Encuesta Nacional de Ocupación y Empleo (ENOE), second quarter, 2009.

17
Taking the median as a reference for total employment it can be observed that the proportion earning 2/3 of it went from 21.6% of total employment in 2005 to 18.6% in 2009 (second quarters); the specific proportions for employees went from 20.4% to 17.3% during the same period. What this may imply is that the first phase of the recession in Mexico has hit most severely those jobs corresponding to the first rungs of the ladder rather than suggest everybody has been moving upwards (that might be the case between 2005 and 2008). If the attention is placed on those below ½ it can be appreciated a difference in the proportions between total employment and employees, being higher for the former or total aggregate (figure 21), whereat can be inferred a higher correlation between self employment and poverty.
Information for second quarters
Year Total
employment below 2/3
Total employment
below 1/2
Salary workers
below 2/3
Salary workers
below 1/2
2005 21.56 13.10 20.36 9.95
2006 19.63 11.39 18.58 8.54
2007 20.25 10.52 19.24 7.67
2008 19.57 9.96 18.56 7.15
2009 18.56 10.42 17.30 7.48
b) Non wage pecuniary benefit. It seems that in the last years the variable more prone to be adjusted, rather than cash earnings, have been non-wage pecuniary benefits. An example of this can be seen on respect shares with employees with paid annual leave. Besides the fact that this benefit in no way is wide extended it has drop from covering 55.4 % of employees in 2005 to 54.6% in 2009. The drop has been an event specific of this year. On respect the
5
8
10
13
15
18
20
23
I II III IV I II III IV I II III IV I II III IV I II
2005 2006 2007 2008 2009
Total employment below 2/3 Total employment below 1/2Salary workers below 2/3 Salary workers below 1/2
Figure 21 Share of employed below median hourly earnings
Source: INEGI, STPS, Encuesta Nacional de Ocupación y Empleo (ENOE).

18
share of employees with a job that pays a sick leave the proportions are almost the same, in any case little bit lower (figure 22). In the context of the period the drop observed in 2006 looks more a statistical flop above anything else however what it is seen in 2009 means that, once again, this is the way the labor market is conducting a good deal of its adjustment.
Information for second quarters
Year
Share of employees with
paid annual leave
Share of employees with job that pays a
sick leave
2005 55.38 54.25
2006 55.07 53.58
2007 56.33 54.94
2008 55.35 54.48
2009 54.61 53.58
3. Working Hours and balancing work and non-working life
a) Working hours. The average weekly actual hours worked in Mexico during second quarter 2009 were 42.1; a drop on respect 42.9 registered a year before. The decrease has been more visible amongst men going from 46 hours to 44.9. Specifically for salary workers the decrease has been bigger (almost an hour in average) and on respect men is more than
53
54
55
56
57
I II III IV I II III IV I II III IV I II III IV I II
2005 2006 2007 2008 2009
Share of employees with paid annual leave Share of employees with job that pays a sick leave
Figure 22 Share of employees using non-wage pecuniary benefits, 2005 - 2009
Source: INEGI, STPS, Encuesta Nacional de Ocupación y Empleo (ENOE).
19
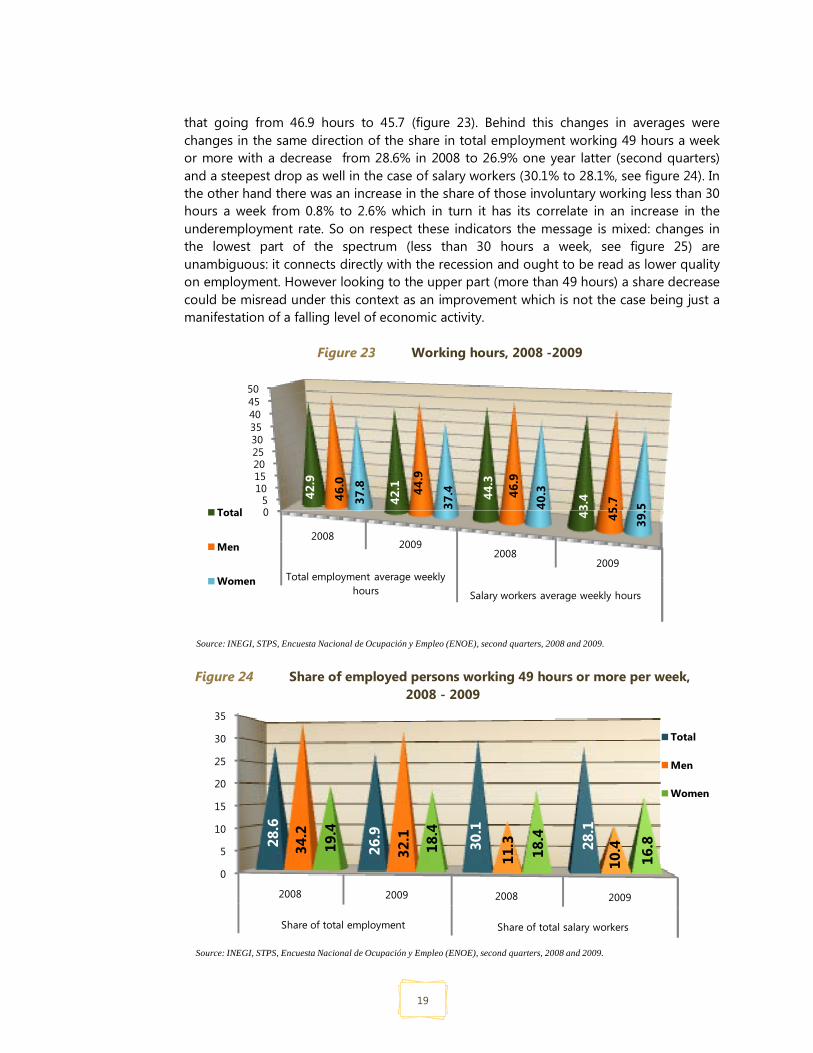
that going from 46.9 hours to 45.7 (figure 23). Behind this changes in averages were changes in the same direction of the share in total employment working 49 hours a week or more with a decrease from 28.6% in 2008 to 26.9% one year latter (second quarters) and a steepest drop as well in the case of salary workers (30.1% to 28.1%, see figure 24). In the other hand there was an increase in the share of those involuntary working less than 30 hours a week from 0.8% to 2.6% which in turn it has its correlate in an increase in the underemployment rate. So on respect these indicators the message is mixed: changes in the lowest part of the spectrum (less than 30 hours a week, see figure 25) are unambiguous: it connects directly with the recession and ought to be read as lower quality on employment. However looking to the upper part (more than 49 hours) a share decrease could be misread under this context as an improvement which is not the case being just a manifestation of a falling level of economic activity.
05
101520253035404550
20082009
20082009
Total employment average weekly hours Salary workers average weekly hours
42.9
42.1
44.3
43.446
.0 44.9
46.9
45.737
.8
37.4
40.3
39.5Total
Men
Women
Source: INEGI, STPS, Encuesta Nacional de Ocupación y Empleo (ENOE), second quarters, 2008 and 2009.
0
5
10
15
20
25
30
35
2008 2009 2008 2009
Share of total employment Share of total salary workers
28.6
26.9
30.1
28.1
34.2
32.1
11.3
10.419
.4
18.4
18.4
16.8
Total
Men
Women
Source: INEGI, STPS, Encuesta Nacional de Ocupación y Empleo (ENOE), second quarters, 2008 and 2009.
Figure 23 Working hours, 2008 -2009
Figure 24 Share of employed persons working 49 hours or more per week, 2008 - 2009
20
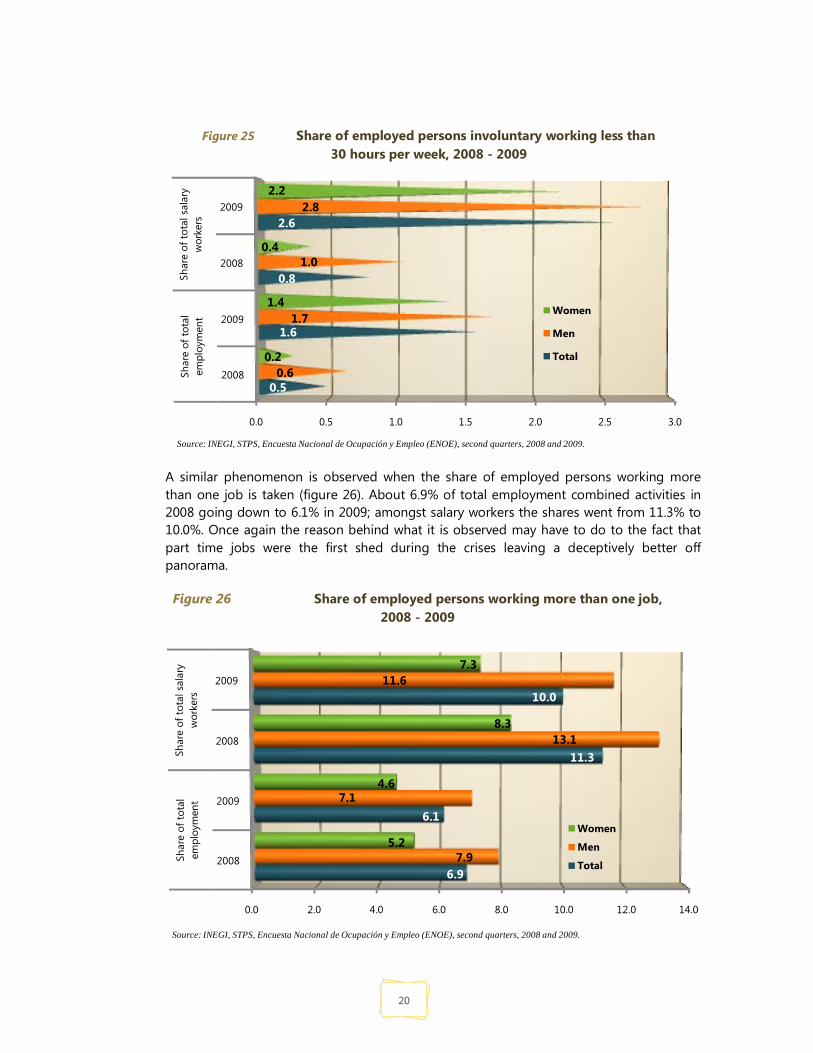
A similar phenomenon is observed when the share of employed persons working more than one job is taken (figure 26). About 6.9% of total employment combined activities in 2008 going down to 6.1% in 2009; amongst salary workers the shares went from 11.3% to 10.0%. Once again the reason behind what it is observed may have to do to the fact that part time jobs were the first shed during the crises leaving a deceptively better off panorama.
0.0 0.5 1.0 1.5 2.0 2.5 3.0
2008
2009
2008
2009
Shar
e of
tota
l em
ploy
men
tSh
are
of to
tal s
alar
y w
orke
rs
0.5
1.6
0.8
2.6
0.6
1.7
1.0
2.8
0.2
1.4
0.4
2.2
Women
Men
Total
Source: INEGI, STPS, Encuesta Nacional de Ocupación y Empleo (ENOE), second quarters, 2008 and 2009.
0.0 2.0 4.0 6.0 8.0 10.0 12.0 14.0
2008
2009
2008
2009
Shar
e of
tota
l em
ploy
men
tSh
are
of to
tal s
alar
y w
orke
rs
6.9
6.1
11.3
10.0
7.9
7.1
13.1
11.6
5.2
4.6
8.3
7.3
Women
Men
Total
Source: INEGI, STPS, Encuesta Nacional de Ocupación y Empleo (ENOE), second quarters, 2008 and 2009.
Figure 25 Share of employed persons involuntary working less than 30 hours per week, 2008 - 2009
Figure 26 Share of employed persons working more than one job, 2008 - 2009

21
b) Working time arrangements. The share of total salary workers working at night is of 2.3%; a sharp contrast with those to whom their activity extends at last one of the days of weekend (Saturday most of the cases) being more than a third (34.6% see figure 27). Both proportions have slightly dropped on respect recent years so in terms of inter temporal analysis once again there is a risk to misread this as an employment improvement under the current recession context. To interpret as an improvement all these indicators need to be the expression of a consistent trend; any isolated changes would mean other thing.
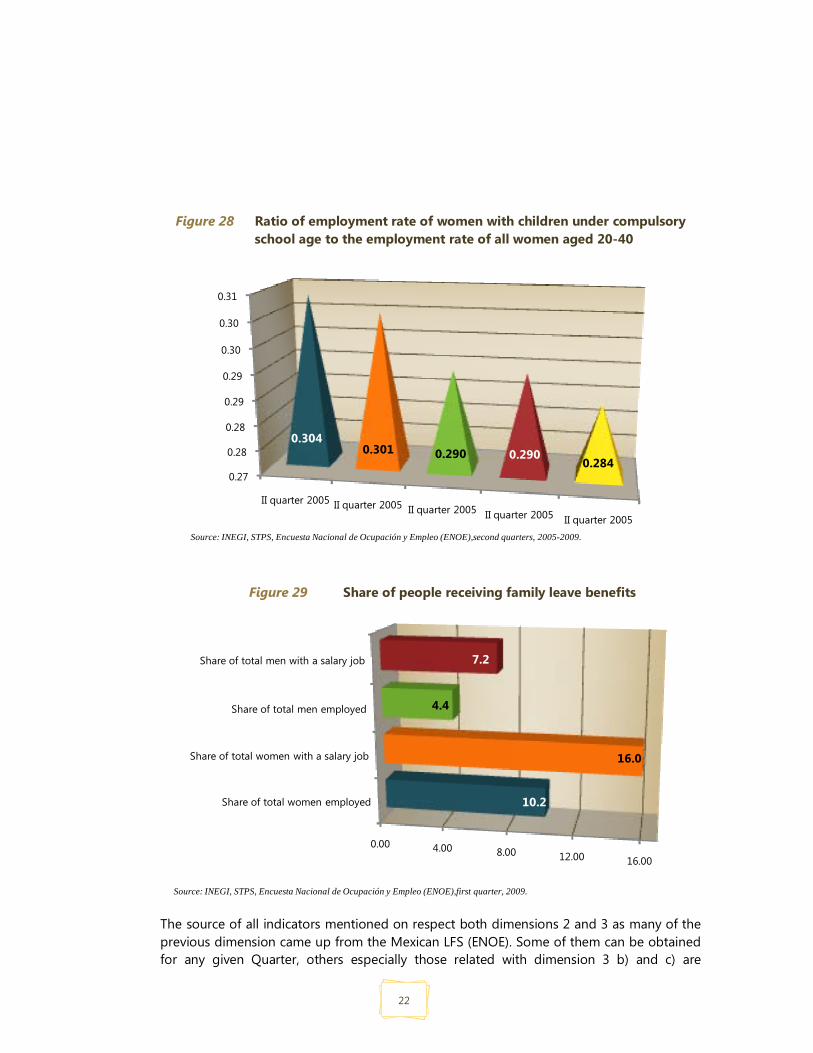
c) Balancing work and non working life. The rate of women with children on respect those aged 20-40 may show a smooth decrease during the last five years, so in 2009 less than 3 women in ten have children less than 4 year old (figure 28). On respect the share of people receiving family leave benefits the one that corresponds to women with a salary job is about 16% and the men share is quite lower being that only 4.4% have this kind of benefit (figure 29). As is the case with other benefits they diminish in 2009 after steady levels with no significant changes in recent years.
0
5
10
15
20
25
30
35
Share of total employment working
at night
Share of total salary workers working at
night
Share of total employment working
on weekends
Share of total salary workers working on
weekends
1.45 2.33
21.53
34.53
Source: INEGI, STPS, Encuesta Nacional de Ocupación y Empleo (ENOE), first quarter, 2009.
Figure 27 Working time arrangements
22
The source of all indicators mentioned on respect both dimensions 2 and 3 as many of the previous dimension came up from the Mexican LFS (ENOE). Some of them can be obtained for any given Quarter, others especially those related with dimension 3 b) and c) are
0.27
0.28
0.28
0.29
0.29
0.30
0.30
0.31
II quarter 2005 II quarter 2005 II quarter 2005 II quarter 2005 II quarter 2005
0.3040.301 0.290 0.290
0.284
Source: INEGI, STPS, Encuesta Nacional de Ocupación y Empleo (ENOE),second quarters, 2005-2009.
0.00 4.00 8.00 12.00 16.00
Share of total women employed
Share of total women with a salary job
Share of total men employed
Share of total men with a salary job
10.2
16.0
4.4
7.2
Source: INEGI, STPS, Encuesta Nacional de Ocupación y Empleo (ENOE),first quarter, 2009.
Figure 28 Ratio of employment rate of women with children under compulsory school age to the employment rate of all women aged 20-40
Figure 29 Share of people receiving family leave benefits

23
obtained just once a year because that’s the frequency ENOE uses a long questionnaire format addressing those issues.
4. Security of employment and social protection
a) Security of employment. The percentage of employees 25 years old or older with temporary jobs can be split in two categories: the main one refers to salary workers that don’t even have a written contract which representing above 40% of those workers; the other category has to do with those cases with a written contract but one that specifies its duration or that it lasts the time needed for a specific project to be concluded: this second share goes around 8% of salary workers. The lowest point seems amongst second quarters has been reached in 2009 after a couple of years suggesting a trend downwards (2006-2007, see figure 30). However the decrease shown in 2009 would obey to different factors because as it is well known during a recession the first kind of jobs slashed down are precisely the temporary ones. The increase briefly shown in 2008 might obey to an anticipation of the labor markets of troubles in the horizon.
Second quarters
Year Without a written contract
With a written temporary
contract
2005 41.51 8.04
2006 42.14 8.03
2007 40.95 8.48
2008 41.87 8.12
2009 40.47 8.09
39
40
41
42
43
I II III IV I II III IV I II III IV I II III IV I II
2005 2006 2007 2008 2009
Without a written contract
Figure 30 Percentage of employees 25 years of age and older with temporary jobs
Source: INEGI, STPS, Encuesta Nacional de Ocupación y Empleo (ENOE).

24
The structure shown by job tenure speaks about of segmented labor market –even for salary workers- with rigidities in one hand and extreme flexibility in the other. So in one hand 24.5% of total employees have accumulated 10 years or more in their current job (more often than not it is the case of employees in public sector and public institutions as well of unionized workers); in the other hand 26.3% have less than a year in their current job (figure 31) reflecting other labor markets where a high turnovers is the rule as the fact that employers avoid as much as they can that a worker reaches a seniority status with the corresponding rights associated to it. Of course this can be done in part because the simplicity of tasks that may imply the processes of a labor market with a strong presence of non agricultural micro businesses. However the phenomena seems far reaching than that.
On respect self employment In Mexico there are almost 10 million individuals that can be classified as self employed if the term is used as synonymous of own account worker.6 They represent 23% of total employment. 64.4% of those 10 million conduct nonfarm, non incorporated informal sector activities; 22.7% farm, non incorporated enterprises and the remaining 12.9% are heads of nonfarm, non incorporated formal enterprises7 (figure 32). During the last years it was perceptible a slight decreasing trend with an interruption in 2009. However as it is shown in terms of its composition the interpretation of this indicator needs some shades: it might not be good that the informal part of them grows but it might be that the formal part does. Without this distinction there is not an unambiguous interpretation on this regard.
6 As they are defined accordingly to The International Classification of Category in Employment (ICICE): Fifteenth ICLS, Geneva, and January, 1993. 7 This means they are registered businesses nevertheless there are not keep a complete set of accounts liable to be consolidated in Actives and Passives in a Balance Sheet.
0.00 4.00 8.00 12.00 16.00 20.00 24.00 28.00
Less than a 1 year
More than 1 year, less than 3
More than 3 years, less than 5
More than 5 years, less than 10
More than 10 years
26.3
14.9
15.7
18.5
24.5
Source: INEGI, STPS, Encuesta Nacional de Ocupación y Empleo (ENOE), first quarter, 2009.
Figure 31 Percentages of employees according to job tenure, 2009

25
b) Social Protection. In Mexico has not been implemented yet a national unemployment insurance as such. Right now is only in operation in the capital of the country. This may explain thought not much the low share that social security expenditure has on respect GDP. During the last fifteenth years its percentage has gone from 1.1% in 1994 to 1.9% in 2008 with its highest point in 2002 (2.3%). As a share of programmed public budgetary expenditure it went from 6.8% in 1994 to 12.3% ten years latter being the share for 2008 of 12.0% (figure 33). A problem with this indicator might be in terms of what it is understood by the concept; which items corresponds specifically to it and which not.
0%
20%
40%
60%
80%
100%
12.9
64.4
22.7
Farm, non incorporated enterprises
Non-farm, non incorporated, informal enterprisesNon-farm, non incorporated, formal enterprises
0.0
0.5
1.0
1.5
2.0
2.5
Share of GDP
0.0
3.0
6.0
9.0
12.0
15.0
Share of programmed public expenditure
Figure 32 Percentage of employed who are unincorporated self-employed
Figure 33 Public social security expenditure as share of GDP 1994-2008
Source: INEGI, STPS, Encuesta Nacional de Ocupación y Empleo (ENOE), second quarter 2009.
26
Year Share of
GDP
Share of programmed
public expenditure
Year Share of
GDP
Share of programmed
public expenditure
994 1.1 6.8 2002 2.3 14.8
1995 1.1 7.8 2003 1.9 11.8
1996 1.2 8.1 2004 2.0 12.3
1997 1.5 10.0 2005 1.9 11.6
1998 1.5 10.5 2006 2.0 11.9
1999 1.9 13.4 2007 2.2 12.5
2000 2.1 14.4 2008 1.9 12.0
2001 2.0 13.8
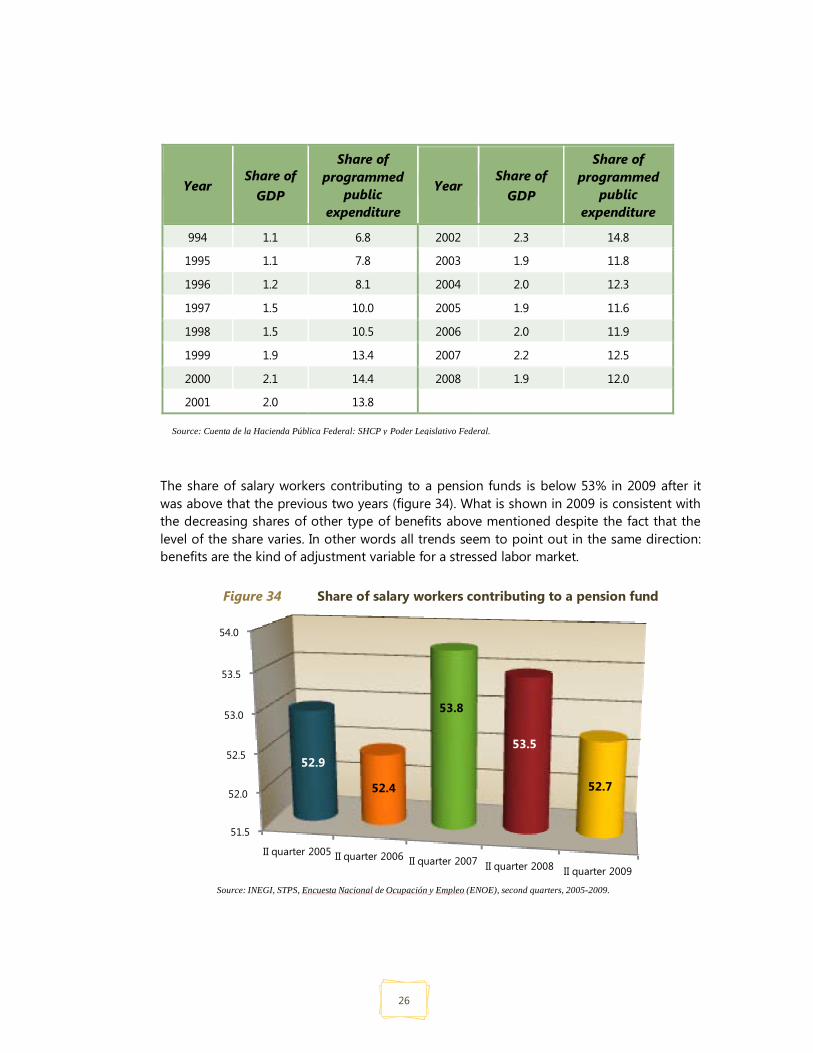
The share of salary workers contributing to a pension funds is below 53% in 2009 after it was above that the previous two years (figure 34). What is shown in 2009 is consistent with the decreasing shares of other type of benefits above mentioned despite the fact that the level of the share varies. In other words all trends seem to point out in the same direction: benefits are the kind of adjustment variable for a stressed labor market.
51.5
52.0
52.5
53.0
53.5
54.0
II quarter 2005 II quarter 2006 II quarter 2007 II quarter 2008 II quarter 2009
52.9
52.4
53.8
53.5
52.7
Source: INEGI, STPS, Encuesta Nacional de Ocupación y Empleo (ENOE), second quarters, 2005-2009.
Source: Cuenta de la Hacienda Pública Federal: SHCP y Poder Legislativo Federal.
Figure 34 Share of salary workers contributing to a pension fund
27
All the data on regard this dimension comes from ENOE, Mexico’s national LFS except the information on social security expenditure which is provided not as a share of GDP but in raw numbers by the Congress Commission on the Public Account.
5. Social Dialogue and workplace relationships
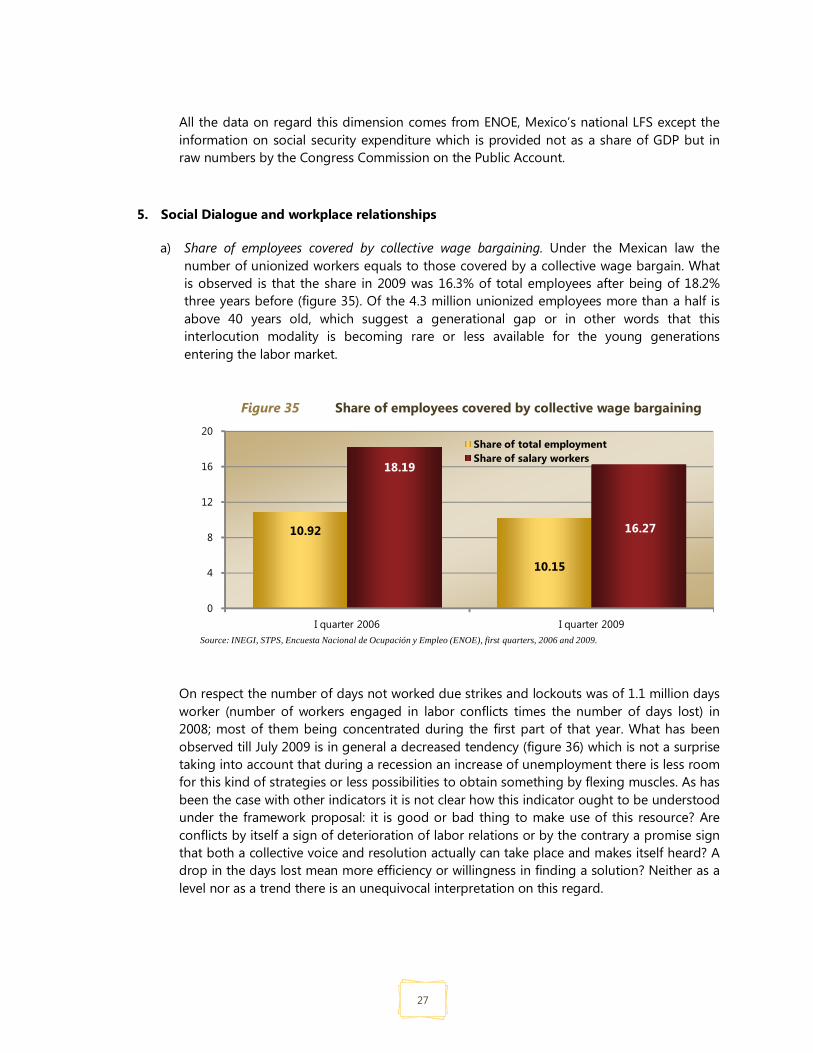
a) Share of employees covered by collective wage bargaining. Under the Mexican law the number of unionized workers equals to those covered by a collective wage bargain. What is observed is that the share in 2009 was 16.3% of total employees after being of 18.2% three years before (figure 35). Of the 4.3 million unionized employees more than a half is above 40 years old, which suggest a generational gap or in other words that this interlocution modality is becoming rare or less available for the young generations entering the labor market.
On respect the number of days not worked due strikes and lockouts was of 1.1 million days worker (number of workers engaged in labor conflicts times the number of days lost) in 2008; most of them being concentrated during the first part of that year. What has been observed till July 2009 is in general a decreased tendency (figure 36) which is not a surprise taking into account that during a recession an increase of unemployment there is less room for this kind of strategies or less possibilities to obtain something by flexing muscles. As has been the case with other indicators it is not clear how this indicator ought to be understood under the framework proposal: it is good or bad thing to make use of this resource? Are conflicts by itself a sign of deterioration of labor relations or by the contrary a promise sign that both a collective voice and resolution actually can take place and makes itself heard? A drop in the days lost mean more efficiency or willingness in finding a solution? Neither as a level nor as a trend there is an unequivocal interpretation on this regard.
10.92
10.15
18.19
16.27
0
4
8
12
16
20
I quarter 2006 I quarter 2009
Share of total employmentShare of salary workers
Source: INEGI, STPS, Encuesta Nacional de Ocupación y Empleo (ENOE), first quarters, 2006 and 2009.
Figure 35 Share of employees covered by collective wage bargaining

28
2008
Annual 1 123 583
2009
Annual 298 976
Jan 22 155 Jan 0
Feb 481 921 Feb 205 415
Mar 40 256 Mar 59 027
Apr 72 Apr 26 866
May 40 272 May 1 812
Jun 158 Jun 5 856
Jul 85 525 Jul 0
Aug 190 500
Sep 164 833
Oct 0
Nov 8 077
Dec 89 814
The source of unionized workers is updated once a year by conducting the long format of the national LFS (ENOE); in the other hand information on days worker lost (total number of workers times the days not worked) is updated on a monthly basis by the Ministry of Labor (Secretaría del Trabajo) based on information of the so called Federal Board on Labor Conflicts and Conciliation.
0
50 000
100 000
150 000
200 000
250 000
300 000
350 000
400 000
450 000
500 000
Jan Feb Mar Apr May Jun Jul Aug Sep Oct Nov Dec Jan Feb Mar Apr May Jun Jul
2008 2009
22 1
55
481
921
40 2
56
72
40 2
72
158
85 5
25
190
500
164
833
0 8 07
7
89 8
14
0
205
415
59 0
27
26 8
66
1 81
2
5 85
6
0
Figure 36 Days worker1/ lost due to strikes and lockouts
1/ Workers involved times the days not worked. Source: Ministry of Labour (STPS), Dirección General de Investigación y Estadísticas del Trabajo, based on data provided by the Federal Board on Labour Conflicts and Conciliation.
29
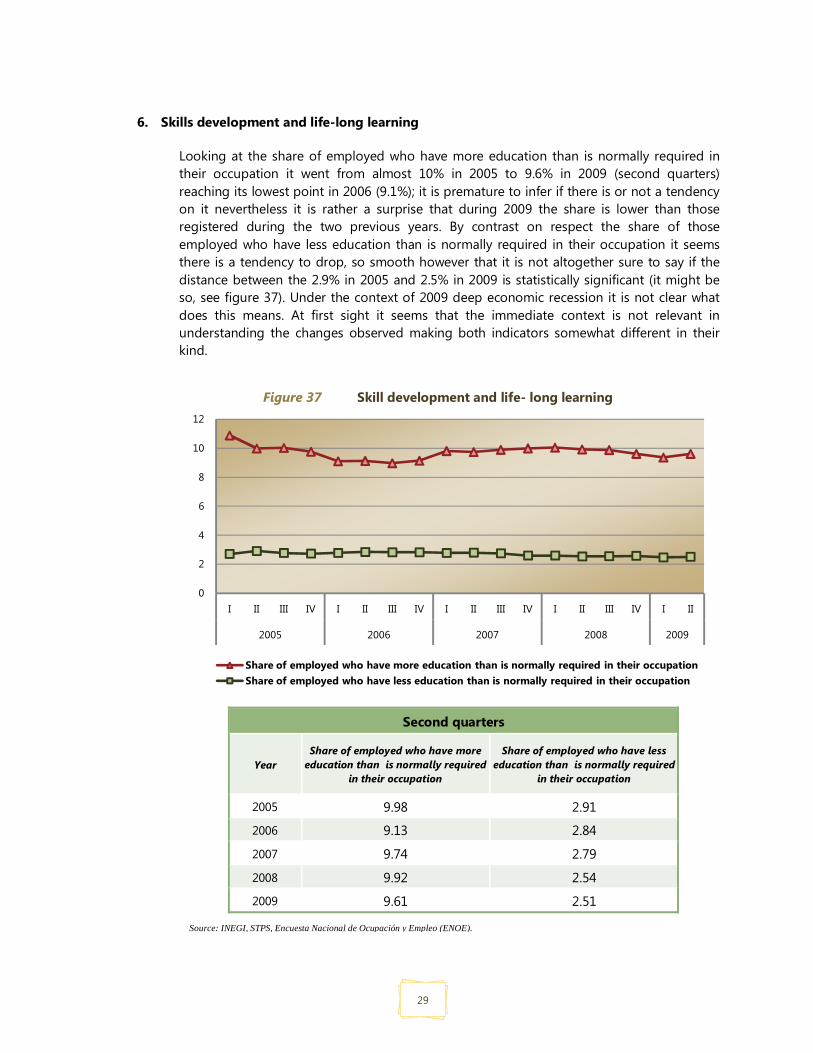
6. Skills development and life-long learning
Looking at the share of employed who have more education than is normally required in their occupation it went from almost 10% in 2005 to 9.6% in 2009 (second quarters) reaching its lowest point in 2006 (9.1%); it is premature to infer if there is or not a tendency on it nevertheless it is rather a surprise that during 2009 the share is lower than those registered during the two previous years. By contrast on respect the share of those employed who have less education than is normally required in their occupation it seems there is a tendency to drop, so smooth however that it is not altogether sure to say if the distance between the 2.9% in 2005 and 2.5% in 2009 is statistically significant (it might be so, see figure 37). Under the context of 2009 deep economic recession it is not clear what does this means. At first sight it seems that the immediate context is not relevant in understanding the changes observed making both indicators somewhat different in their kind.
Second quarters
Year Share of employed who have more
education than is normally required in their occupation
Share of employed who have less education than is normally required
in their occupation
2005 9.98 2.91 2006 9.13 2.84 2007 9.74 2.79 2008 9.92 2.54 2009 9.61 2.51
0
2
4
6
8
10
12
I II III IV I II III IV I II III IV I II III IV I II
2005 2006 2007 2008 2009
Share of employed who have more education than is normally required in their occupationShare of employed who have less education than is normally required in their occupation
Figure 37 Skill development and life- long learning
Source: INEGI, STPS, Encuesta Nacional de Ocupación y Empleo (ENOE).

30
Both indicators are obtained from ENOE and can be updated each quarter. It is also possible to get the share of persons on high skilled occupations however the task prove to be more challenging that it looks at first for it may need an analysis of the occupations classification in deep, maybe at four digit level in order to determine which is a high skilled occupation and which is not. A definition in this regard definitively is needed. On respect information of employees receiving job training within the last 12 months ENOE included a second phase module addressing the issue during the third quarter this year which at the moment of elaborating this report it is still processed and thus not already available. It is worth to mention also that this module is going to be conducted every two years.
7. Workplace relationships and intrinsic nature of work
a) Workplace relationships. Mexico’s LFS (ENOE) by means of its long format questionnaire once a year address issues as harass at work, personal conflict and discrimination as long they have been the main cause pushing a given person to quit a job. So it is not counted how many employees are object of harassment, conflict of discrimination as such but how much people leave a job because that reasons.
As a proportion of the labor force figures are too low so it almost only makes sense focusing in absolute numbers. In 2009 about 38.8 thousand persons quit a job because have been harassed at work, 22.1 of them women, most of them between 14-19 years old that may mean they quit because they still can do it at that age; on respect those who quit because a direct clash with bosses or superiors it yields a quite larger figure of about 447.3 thousand cases corresponding 303.7 thousand to men; more evenly distributed by sex are those where the cause was discrimination at work (gender, ethnicity, age, sexual preference) which amounts to 73.5 thousand cases; 38.6 men, 34.9 women. What the proportion shows is that there have been no changes from the first time this information was collected, so the shares are about the same in 2006 on respect 2009 (figure 38).
0.09 0.04 0.16
0.820.93
0.64
0.16 0.15 0.190.09 0.06
0.13
0.99 1.070.85
0.16 0.14 0.21
0.00
0.20
0.40
0.60
0.80
1.00
1.20
Total Men Women Total Men Women Total Men Women
Share of labour force who have quit a job because have been
harassed at work
Share of labour force who have quit a job because conflicts with
a boss or superior
Share of the labour force who have quit a job because discrimination at work
I quarter 2006
I quarter 2009
Figure 38 Workplace relationships and intrinsic nature of work

31
Intrinsic nature of work. Mexico statistical system doesn’t have yet data on this regard. However if it is kept in mind that ENOE has been designed as a mainstream LFS with thematic modules attached to it, cannot be discarded the topic could be addressed as a second phase interview: one that demands the informant be the person concerned and nobody else.
Conclusions
Because Mexico’s labor market has been so particular and so different adjusted as well on respect OECD countries in many senses it has become a sort of laboratory on what does it mean that quality on employment bears the burden of those adjustments. The current economic recession adds to it so under the light of that context many indicators are analyzed. Methodologically speaking this allows in making distinctions on what set of indicators are consistent and what other could be even misleading under specific circumstances. So under this perspective there is no doubt that indicators such as all those considered in dimension one (safety and ethics of employment) and particularly all those related with non-pecuniary benefits as well as social protection behave as it is expected in a an environment of both labor and economic stress yielding unambiguous interpretations of what’s going on. This is not the case however with indicators that at first seems to be very basic such as those related with incomes and hours worked that happened to be context dependent: for instance a decreased trend before an economic crisis may mean something different during that crises and they are the trickiest ones (e.g. people working more than 49 hours a week; percentage of employees with temporary jobs etc.); in the other hand there are other indicators seeming to have their own inertia beyond any specific context (e.g. share of employed that have less education than is normally required in their occupation).
There are other indicators that once obtained surely has an unequivocal or unambiguous meaning, the trouble is that to obtain them needs definitions still lacked; is there a basic understanding amongst countries of what is and what is not social security expenditure or which are those skilled occupations?
Labour force who have quit a job because have been harassed at work
Labour force who have quit a job because conflicts with a
boss or superior
Labour force who have quit a job because
discrimination at work
Total Men Women Total Men Women Total Men Women
I quarter 2006
37 551 11 602 25 949 356 339 253 300 103 039 70 355 39 866 30 489
I quarter 2009
38 791 16 645 22 146 447 252 303 740 143 512 73 547 38 623 34 924
Source: INEGI, STPS, Encuesta Nacional de Ocupación y Empleo (ENOE), first quarters, 2006 and 2009.

32
Of course economic analysis is not everything: it is clear that there is not the idea and that there are dimensions and indicators over and above that. Fair treatment in employment, skills development, life-long learning or workplace relationships and intrinsic nature of work demands to be seen in a wider perspective. Especially on respect fair treatment of employment as relevant as they are all indicators concerning gender it came up that no less relevant are those concerning age and seniority.
Finally it seems a family of indicators that even thought they are available the trouble with them is they are charged with ambiguity: the news they convey are good or bad? They are not few of them such is the case of those related with social dialogue.
So at the end this landscape of indicators is interesting but quite heterogeneous because with them the matter is not only what they do describe but how they ought to be understood: the normative side of the framework might be the next layer to go to.