Embed Size (px)
Citation preview

www.qog.pol.gu.se
Quality of Government and Human Well Being: Some Surprises from
“Big Data”
Bo Rothstein – Head of Program Stefan Dahlberg – Dataset Manager
The Quality of Government Institute
Department of Political Science University of Gothenburg
Sweden

www.qog.pol.gu.se
The Quality of Government (QoG)
Institute at University of Gothenburg
• Started in 2004 (minor grant to build database) • Indepentent academic research institute • Mainly political scientists (but lots of interdisciplinary
interaction) • Major funding for research from 2007 and 2009 (about 8
mil. Euro). About 30 researchers and assistants • European Research Council - Advanced Resarch Grant
+ Swedish Science Council, 4 mil. Euro 2013-2018

www.qog.pol.gu.se
QoG: Aim and Purpose
• To carry out and promote research about the importance of trustworthy, reliable, competent, non-corrupt, non-discriminatory government institutions = QoG
• Central focus is not to explain politics or public policy, but what politics and public policy imply for human well-being

www.qog.pol.gu.se
ANTICORRP
• Anticorruption policies revisited: Global trends and European Responses to the Challanges of Corruption
• Large-scale integrative project funded by the European Union Seventh Framework program
• Started in 2012 and will last for 60 months • Involves 21 research groups in 16 EU countries • In all about 70 researchers • Total budget about 10 mil. Euro • Largest EU-funded research project in the social sciences • www.anticorrp.eu
www.qog.pol.gu.se
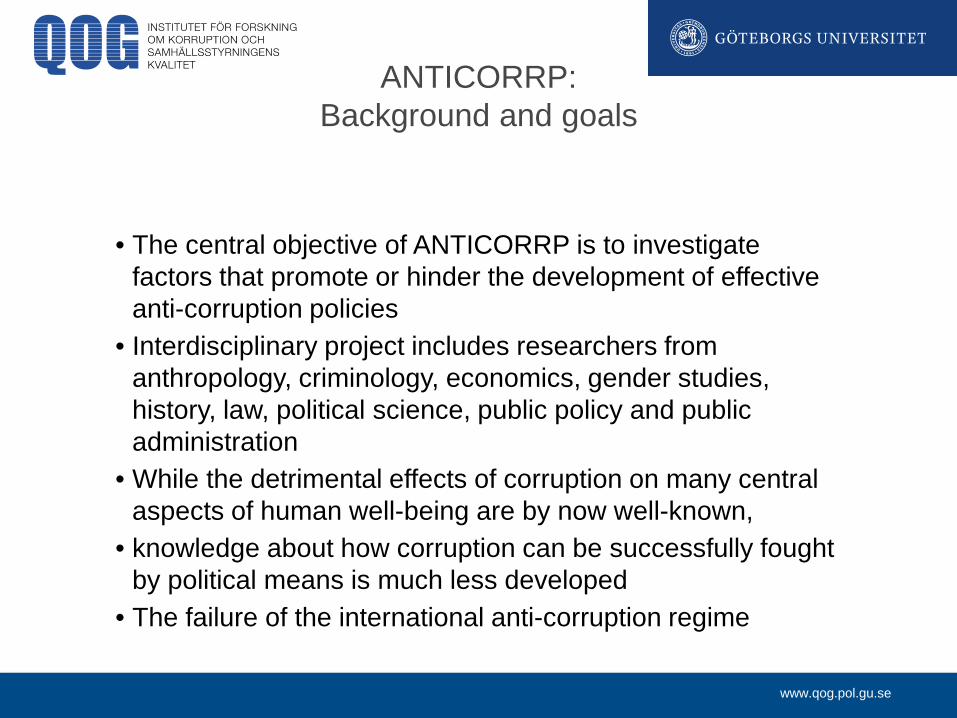
ANTICORRP: Background and goals
• The central objective of ANTICORRP is to investigate
factors that promote or hinder the development of effective anti-corruption policies
• Interdisciplinary project includes researchers from anthropology, criminology, economics, gender studies, history, law, political science, public policy and public administration
• While the detrimental effects of corruption on many central aspects of human well-being are by now well-known,
• knowledge about how corruption can be successfully fought by political means is much less developed
• The failure of the international anti-corruption regime

www.qog.pol.gu.se
The QoG-datasets
• QoG Standard • QoG Basic
– A smaller version of the QoG Standard dataset, only including the most used indicators
• QoG Social Policy (OECD) – Fewer countries, more variables
• QoG Expert Survey – With a focus on bureacratic structures, quality,
proffessionalism and functionality • QoG EU Regional Survey

www.qog.pol.gu.se
January, 1 2013 – December, 31 2013
22415
5787 3822
0
5000
10000
15000
20000
25000
Data Publications Research
Pageviews on the QoG website 2013

www.qog.pol.gu.se
Pageviews on the QoG website 2013
January, 1 2013 – December, 31 2013
16637
11398
5326
3899 3304
0
2000
4000
6000
8000
10000
12000
14000
16000
18000
20000
QoG Standard QoG Basic QoG Social Policy QoG EU Regional Survey QoG Expert Survey

www.qog.pol.gu.se
QoG Standard Dataset
Classification of the variables in the QoG Standard Dataset: • WII (What It Is) variables, that is, variables pertaining to the
core features of QoG (such as corruption, bureaucratic quality and democracy)
• HTG (How To Get it) variables, that is, variables posited to promote the development of QoG (such as electoral rules, forms of government, federalism, legal & colonial origin, religion and social fractionalization)
• WYG (What You Get) variables, that is, variables pertaining to some of the posited consequences of QoG (such as economic and human development, international and domestic peace, environmental sustainability, gender equality, and satisfied, trusting & confident citizens).

www.qog.pol.gu.se
QoG Standard Dataset
QoG Standard Dataset Time-Series (1946-2012) 211 countries - 14 137 country-year observations 746 variables QoG Standard Dataset CS (2009 +/- 3 år) 193 countries 760 variables

www.qog.pol.gu.se
QoG Social Policy Dataset (1946-2011) Time-series
40 countries 1008 variables
Cross Section 194 countries 1071 variabler

www.qog.pol.gu.se
QoG Social Policy Dataset (1946-2011) Classification of the variables in the QoG Social Policy Dataset:
– Social policy variables, such as welfare spending and replacement rates in the social
security system.
– Tax system variables , such as tax rates and government income from different types of taxes.
– Indicators on the structural conditions for social policy, a broad category encompassing things like economic inequality, GDP, unemployment, educational levels, health conditions, trade openness and foreign direct investment.
– Public opinion data, including attitudes to social policy, taxes and the government in
general, but also more general orientations such as left-right placement and interpersonal trust. In this category we have aggregated individual-level public opinion data from five cross-national comparative survey projects.
– Political indicators, including election results and policy positions of governments and parliaments, as well as political institutions such as forms of government and electoral systems.
– Quality of Government variables, pertaining to the core areas of QoG (such as corruption, bureaucratic quality, and democracy).
www.qog.pol.gu.se
QoG Expert Survey Dataset (2008-)
135 countries (107 countries with at least three experts)

www.qog.pol.gu.se
QoG Expert Survey Dataset (2008-) 135 countries (107 countries with at least three experts)
The aim of of the QoG Expert Survey is to measure the structure and functionality of the public administration in different countries.
The survey covers a range of topics where we lack
quantitative indicators in many countries but which are deemed relevant to the public administration in terms of structure and functionality (such as meritocratic recruitment, internal promotion, career stability, wages, impartiality and efficiency).
www.qog.pol.gu.se
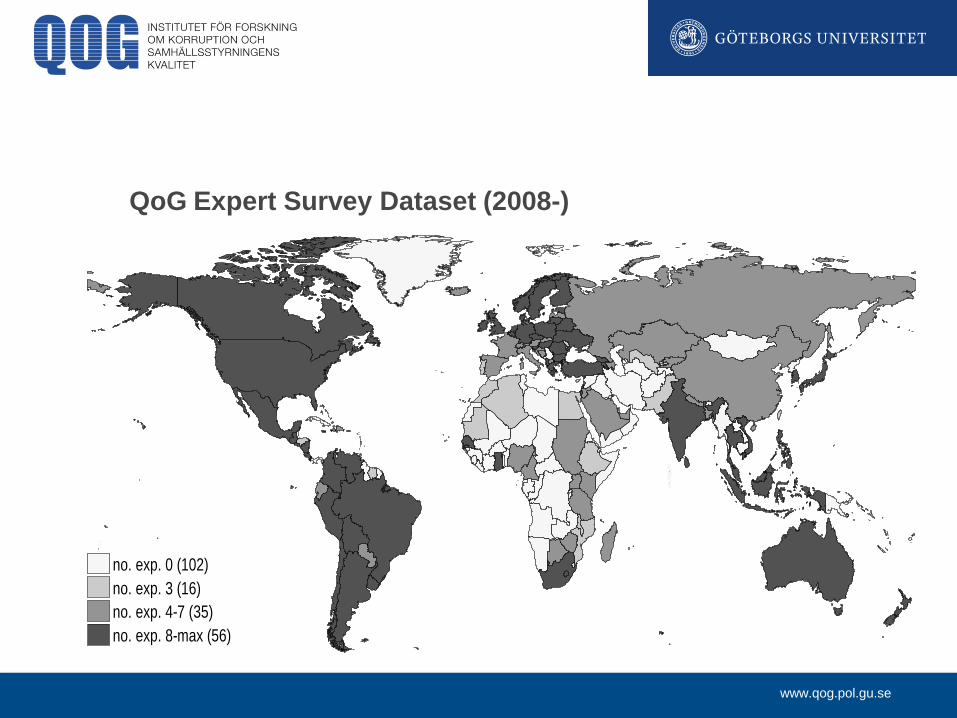
QoG Expert Survey Dataset (2008-)
no. exp. 0 (102)no. exp. 3 (16)no. exp. 4-7 (35)no. exp. 8-max (56)

www.qog.pol.gu.se
QoG EU Regional Survey
www.qog.pol.gu.se
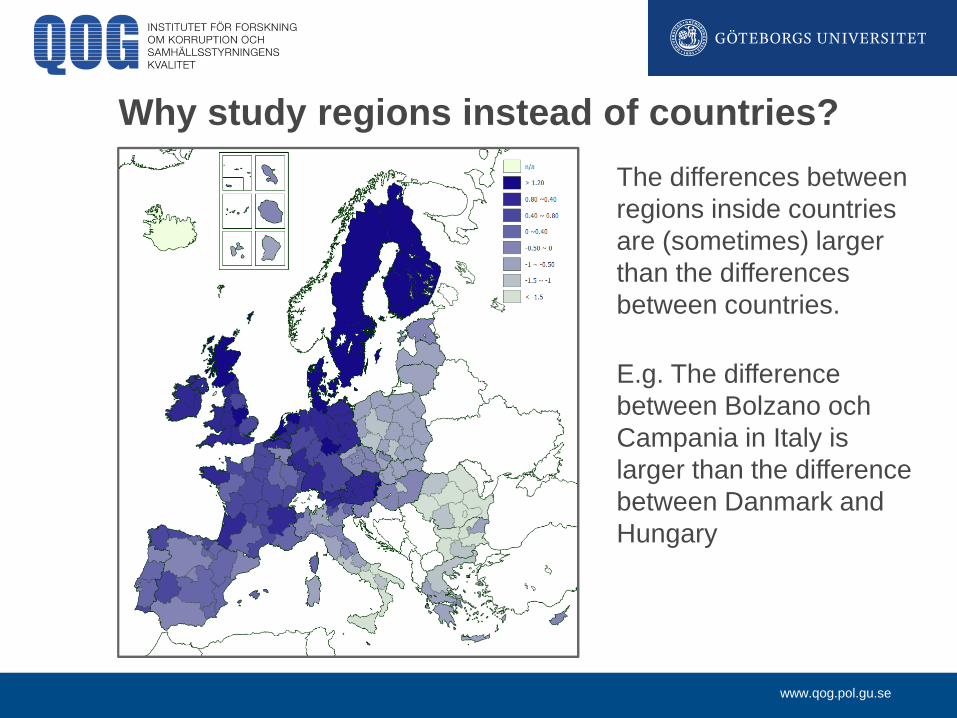
Why study regions instead of countries? The differences between regions inside countries are (sometimes) larger than the differences between countries. E.g. The difference between Bolzano och Campania in Italy is larger than the difference between Danmark and Hungary
www.qog.pol.gu.se
QoG Data Visualization Tool
• The QoG Data Visualization is an opportunity for non-tech users to play around with data. Makes it possible to visualize variables on a world map or in a scatterplot that can be used for presentations
• Basically, everyone that can use a computer can become their own Hans Rosling type but with QoG data
• With new special funding the QoG Institute have just employed an information officer on a two year contract with the task to bring this to Swedish high schools and directly into the class rooms

www.qog.pol.gu.se
QoG ”Big data” and the five percieved wisdoms
• Democratization increases human well-being
• Democracy aid should be the main purpose in development
• Democracy will serve as a cure against corruption
• Democratic right is the source of political legitimacy
• Democracy promotes peace

www.qog.pol.gu.se
SyriaBosnia and Herzegovina
Papua New Guinea
ArgentinaS. Arabia
Nor
Croatia
JapanSwe
South Korea
Egypt
BahrainArmenia
Macedonia
ZimbabweSwaziland
Malaysia
AzerbaijanTurkmenistan
Mongolia
Israel
Georgia
Singapore
South Africa
Belarus
USA
Russia
Nigeria
Burundi
Equatorial Guinea
Kuwait
EthiopiaKenyaDjibouti
RwandaCameroon
Afghanistan
Senegal
Lesotho
Mozambique
Laos
BotswanaLiberia
Iraq Gambia
Honduras
Angola
Maldives
Tanzania
Cambodia
TuvalBangladesh
Brunei
Sierra Leone
Mali
Tajikistan
Cuba
HaitiChad
Pakistan
IranLebanon
China
3040
5060
7080
Hea
lthy
Life
Yea
rs
0 1 2 3 4 5 6 7 8 9 10
Level of Democracy
R²=0.01Sources: WHO (-), Freedom House/Polity (2002-2006)
Healthy Life Yearsvs. Level of Democracy
Low High
Data runs by: Richard Svensson
Low
High

www.qog.pol.gu.se

www.qog.pol.gu.se
Albania
ArgentinaBahrain
Bangladesh
BoliviaSolomon IslandsMyanmar
Burundi
CambodiaCameroon
Cape Verde
Dem. Rep. Congo
Eritrea
Estonia
Gabon
Gambia
Ghana
Iran
IsraelJapan
Kazakhstan
Lebanon
Lesotho
MalaysiaMaldives
Mali
Morocco
Mozambique
Vanuatu
Nigeria
Norway
QatarRussia
Rwanda
Sao Tome
Saudi Arabia
Seychelles
Sierra Leone
Singapore
Vietnam
Swaziland
Swe
Egypt
USA
Burkina Faso
.2.4
.6.8
1
Hum
an D
evel
opm
ent I
ndex
0 1 2 3 4 5 6 7 8 9 10
Level of Democracy
R²=0.22Sources: UNDP (2002), Freedom House/Polity (2002-2006)
Human Development Indexvs. Level of Democracy
Low High
Data runs by: Richard Svensson
Low
High

www.qog.pol.gu.se
Albania
ArgentinaBahrain
Bangladesh
BoliviaSolomon IslandsMyanmar
Burundi
CambodiaCameroon
Cape Verde
Dem. Rep. Congo
Eritrea
Estonia
Gabon
Gambia
Ghana
Iran
IsraelJapan
Kazakhstan
Lebanon
Lesotho
MalaysiaMaldives
Mali
Morocco
Mozambique
Vanuatu
Nigeria
Norway
QatarRussia
Rwanda
Sao Tome
Saudi Arabia
Seychelles
Sierra Leone
Singapore
Vietnam
Swaziland
Swe
Egypt
USA
Burkina Faso
.2.4
.6.8
1
Hum
an D
evel
opm
ent I
ndex
0 1 2 3 4 5 6 7 8 9 10
Level of Democracy
R²=0.22Sources: UNDP (2002), Freedom House/Polity (2002-2006)
Human Development Indexvs. Level of Democracy
Low High
Data runs by: Richard Svensson
Low
High
Azerbaijan
ArgentinaBahamas
Belgium
BhutanBotswana
Solomon Islands
Chile
Dem. Rep. Congo
Eq. Guinea
Eritrea
FinlandFrance
Djibouti
Ghana
Grenada
Haiti
India
IsraelItaly
JapanSouth Korea
Lesotho
Mali
MexicoOman
Namibia
Niger
Nigeria
Norway
Russia
Sierra Leone
SingaporeSweden
USA
Burkina Faso
Venezuela
.2.4
.6.8
1
Hum
an D
evel
opm
ent I
ndex
-2 -1 0 1 2 3
Control of Corruption
R²=0.47Sources: UNDP (2002), World Bank (2002-2008)
Human Development Indexvs. Control of Corruption
High Corruption Low Corruption
Data runs by: Richard Svensson
Low
High

www.qog.pol.gu.se
Bangladesh
Brazil
Bulgaria
China
Colombia Denmark
Ethiopia GeorgiaIndia
Iran
Iraq
Mexico
Nigeria
Romania
Russia
Saudi Arabia
Zimbabwe
Sweden
Egypt
Tanzania
USA
45
67
8
Life
Sat
isfa
ctio
n
0 2 4 6 8 10
Level of Democracy
R²=0.28Sources: World Values Survey (1996-2008), Freedom House/Polity (2002-2006)
Life Satisfactionvs. Level of Democracy

www.qog.pol.gu.se
Azerbaijan
Argentina
Austria
Bangladesh
Brazil
Chile
China
Colombia Denmark
Estonia
Finland
GeorgiaIndia
Indonesia
Iran
Iraq
Ireland
JapanKorea, South
Kyrgyzstan
Lithuania
MaltaMexico
Nigeria
Romania
Russia
S. Arabia Singapore
Zimbabwe
Sweden
Egypt
United Kingdom
Tanzania
USAUruguayVenezuela
45
67
8
Life
Sat
isfa
ctio
n
-2 -1 0 1 2 3
Control of Corruption
R²=0.46Sources: World Values Survey (1996-2008), World Bank (2002-2008)
Life Satisfactionvs. Control of Corruption
High Corruption Low Corruption
High
Low
Data runs by: Richard Svensson

www.qog.pol.gu.se
AfghanistanAngola
Antigua and Barbuda
Azerbaijan
Bahrain
Bangladesh
Bosnia and Herzegovina
Botswana
Brazil
Myanmar
Burundi
Cambodia
Cameroon
China
Comoros
Cuba
Benin
Ethiopia
Eritrea
Estonia
Djibouti
Gabon
Ger
KiribatiHaitiIndia
Iran
IsraelJapan
Kenya
Kuwait
Lebanon
Madagascar
Malawi
Mali
Mongolia
MozambiqueNigeria
PakistanRussia
Rwanda
San Marino
Saudi A.
Senegal
Sierra Leone
Singapore
South Africa
Zimbabwe
Swaziland
Swe
TajikistanThailand
United Arab Emirates
Ukraine
USA
Uzbekistan
Zambia
4050
6070
80
Life
Exp
ecta
ncy
at B
irth
(Yea
rs)
0 1 2 3 4 5 6 7 8 9 10
Level of Democracy
R²=0.19Sources: World Bank (2000-2006), Freedom House/Polity (2002-2006)
Life Expectancy at Birthvs. Level of Democracy
Low High
Data runs by: Richard Svensson
Low
High

www.qog.pol.gu.se
Afghanistan
AlbaniaArgentina
Australia
BahamasBarbados
Bhutan
Botswana
Solomon Islands
Cape Verde
China
CubaDenmark
Equatorial GuineaEthiopia
Eritrea
Estonia
Finland
Ghana
Greece
HaitiIndia
Iraq
ItalyJapan
Liberia
Liechtenstein
Malawi
MongoliaRussia
Sierra Leone
Singapore
South Africa
Zimbabwe
Swaziland
Sweden
Ukraine
USA
Burkina Faso
Venezuela
Zambia
4050
6070
80
Life
Exp
ecta
ncy
at B
irth
(Yea
rs)
-2 -1 0 1 2 3
Control of Corruption
R²=0.41Source: World Bank (2000-2008)
Life Expectancy at Birthvs. Control of Corruption
High Corruption Low Corruption
Data runs by: Richard Svensson
Low
High

www.qog.pol.gu.se
Albania Argentina
Brazil
Belarus Cambodia
Cameroon Cape Verde
China
Colombia
Fiji Georgia
Greece
India
Israel
Jamaica
Japan
Kenya
Kuwait
MalaysiaOman
Nor
Qatar
Russia
Saudi Arabia
Singapore
Vietnam
Swe
ThailandTunisia
Turkey
Uganda
Ukraine
Egypt
USA
Uruguay
VenezuelaZambia
24
68
10
Fore
ign
Cre
dit R
atin
g
0 1 2 3 4 5 6 7 8 9 10
Level of Democracy
R²=0.13Sources: Standard & Poor's (2011), Freedom House/Polity (2009)
Foreign Credit Ratingvs. Level of Democracy
Low High
Data runs by: Richard Svensson
Low
High

www.qog.pol.gu.se
Albania
Chile
China Taiwan
France
Greece
Grenada
IcelandIreland
IsraelItaly
Japan
Kazakhstan
Jordan
Lithuania
Malaysia
New ZealandNorway
Papua New Guinea
Peru
Poland
Russia
Saudi Arabia
SwedenSwitzerland
Uganda
Macedonia
Egypt
USA
Uruguay
24
68
10
Fore
ign
Cre
dit R
atin
g
-2 -1 0 1 2
Control of Corruption
R²=0.62Sources: Standard & Poor's (2011), World Bank (2002-2008)
Foreign Credit Ratingvs. Control of Corruption
High Corruption Low Corruption
Data runs by: Richard Svensson
Low
High

www.qog.pol.gu.se
Antigua and BarbudaBahrain
Bangladesh
ArmeniaBosnia
Brunei
Belarus
Cambodia
Cameroon
TaiwanFin
Gabon
Gambia
IsraelJapan
Kazakhstan
North Korea
Luxembourg
Malaysia
Monaco
Mongolia
NorwayQatar
Russia
Saudi ArabiaSeychelles
Singapore
Vietnam
Swe
United Arab Emirates
Turkmenistan
Tuvalu
USA
Uruguay
Venezuela
025
000
5000
0
GD
P / C
apita
0 1 2 3 4 5 6 7 8 9 10
Level of Democracy
R²=0.16Sources: Gleditsch (2002), Freedom House/Polity (2002-2006)
GDP / Capitavs. Level of Democracy
Low High
Data runs by: Richard Svensson
Low
High

www.qog.pol.gu.se
Afghanistan
Barbados
Belgium
Bhutan
Brunei
Belarus
Cape Verde
Chad
Chile
Equatorial GuineaEstonia
FinlandGermany
Ireland
IsraelItaly
Japan
Luxembourg
Mauritania
New Zealand
Niger
NorwayQatar
Russia
Sao Tome
S. Arabia
SingaporeSweden
Trinidad
United Arab Emirates
Turkmenistan Ukraine
USA
Uruguay
025
000
5000
0
GD
P /
Cap
ita
-2 -1 0 1 2 3
Control of Corruption
R²=0.71Sources: Gleditsch (2002), World Bank (2002-2008)
GDP / Capitavs. Control of Corruption
High Corruption Low Corruption
Data runs by: Richard Svensson
Low
High

www.qog.pol.gu.se
MyanmarSyriaVenezuela
Belgium
Japan France
Cyprus
FinlandSweden
Italy
Bahrain
Canada
Macedonia
Zimbabwe
Mauritius
Chile
Latvia
Estonia
SingaporeKazakhstan
USA
Kuwait
Barbados
Jordan
Paraguay
Brunei
Lebanon
050
010
0015
0020
00
Num
ber o
f Pol
ice
offic
ers
(per
100
,000
pop
ulat
ion)
-2 -1 0 1 2 3
Control of Corruption
R²=0.01Sources: UN Data (2010), World Bank (2002-2008)
Number of police officersvs. Control of Corruption
High Corruption Low Corruption
Data runs by: Richard Svensson
Low
High

www.qog.pol.gu.se
AfghanistanAngola
Antigua and BarbudaBahrain
Armenia
Belgium
Bhutan
Bolivia
Botswana
Myanmar
Sri Lanka
Chile
Colombia
Congo, Democratic Republic
Cuba
Cyp
EcuadorEthiopia
Fiji
Finland
Djibouti
Georgia
Kiribati
Haiti
Iran
Iraq
Israel
Jordan
Korea, South
Kuwait
Libya
MalaysiaMauritania
MexicoMorocco
Oman
NamibiaNepal
Vanuatu
Nigeria Marshall Isl
Panama
Paraguay
Qatar
Russia
Saudi Arabia Seychelles
Singapore
Vietnam
Zimbabwe
Swe
Syria
United Arab Emirates
Tunisia
Turkmenistan
Tuvalu
Egypt
USA
Burkina Faso
-2-1
01
23
Con
trol o
f Cor
rupt
ion
0 1 2 3 4 5 6 7 8 9 10
Level of Democracy
R²=0.27Sources: World Bank (2002-2008), Freedom House/Polity (2002-2006)
Control of Corruptionvs. Level of Democracy
Low High
Data runs by: Richard Svensson
High Corruption
Low Corruption
www.qog.pol.gu.se
Political legitimacy?
• Quality of Government ”has a very strong and independent effect on all levels of regime support”
• ”It is Quality of Government and the impartial treatment on the output side of the political system, and not electoral democracy, that creates regime legitimacy”
(Torbjörn Gjefsen 2012)
www.qog.pol.gu.se
And the final verdict……
”Overall, the results indicate that factors such as government effectiveness are of greater importance for citizens´satisfaction with the way democracy functions, compared to factors like ideological congruence on the input side. Impartial and effective bureaucracies matter more than representational devices” Democracy and Bureaucracy: How their Quality Matters for Popular Satisfaction, STEFAN DAHLBERG and SÖREN HOLMBERG, West European Politics 2013
www.qog.pol.gu.se
What has our ”big data” shown: A short summary
• An all standard measures of human well-being, QoG measures clearly outperforms measures of democracy
• This is not a problem that is related only to developing countries or former communist countries
• An overwhelming part of human misery in today’s world is caused by low QoG
• This should have implications for research policy

www.qog.pol.gu.se
Thank you!
• Comments
• Critique
• Questions