Embed Size (px)
Citation preview
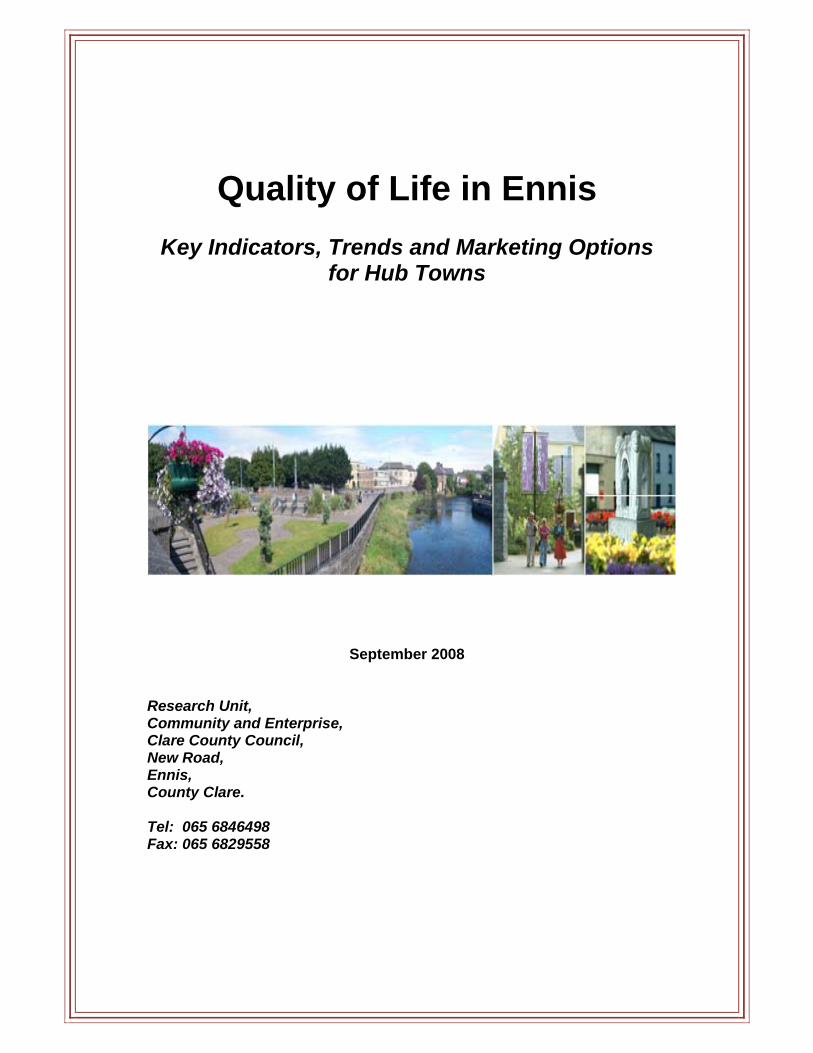
Quality of Life in Ennis
Key Indicators, Trends and Marketing Options
for Hub Towns
September 2008 Research Unit, Community and Enterprise, Clare County Council, New Road, Ennis, County Clare. Tel: 065 6846498 Fax: 065 6829558
2
Table of Contents Introduction 3 Designation as a Hub Town 3
Quality of Life – Key Trends 5 Quality of Life Indicators 15 1.0 Population 15
2.0 Housing 20 3.0 Education 24
4.0 Economy 28 5.0 Health 36
6.0 Lifestyle 39 7.0 Transport and Travel 42 8.0 Environment 45
Lessons from Ireland’s Hub Towns 48
3
Introduction Ennis, the capital town of County Clare is one of the fastest growing hub towns in the
country and is closely related in economic terms to the Mid-West region, Limerick
and Shannon, in particular. Its strategic focus is grounded in a large and growing
population base, proximity to Shannon International Airport, connectivity to national
road and rail networks, and its designation in 1997 as Ireland’s Information Age
Town, which saw Ennis host the world’s largest community technology project. The
town is within easy reach of a number of internationally renowned golf courses, and
is home to GLÓR, the National Irish Music Centre.
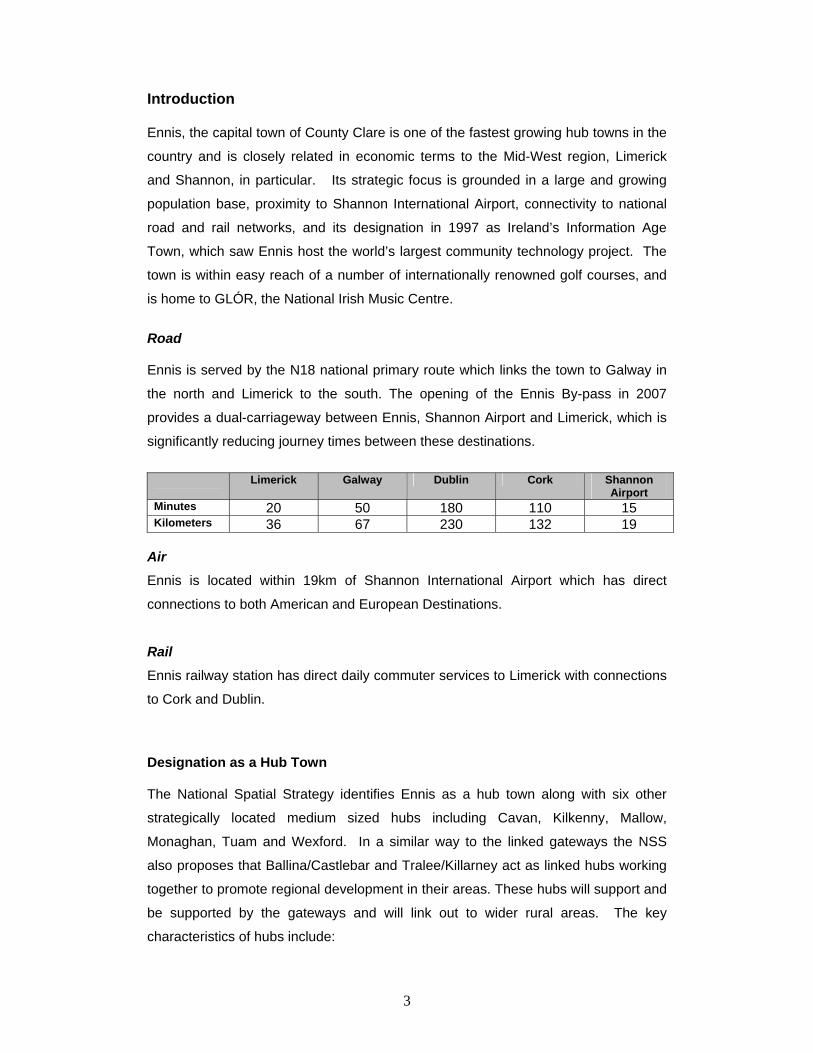
Road Ennis is served by the N18 national primary route which links the town to Galway in
the north and Limerick to the south. The opening of the Ennis By-pass in 2007
provides a dual-carriageway between Ennis, Shannon Airport and Limerick, which is
significantly reducing journey times between these destinations.
Limerick Galway Dublin Cork Shannon
Airport Minutes 20 50 180 110 15 Kilometers 36 67 230 132 19
Air Ennis is located within 19km of Shannon International Airport which has direct
connections to both American and European Destinations.
Rail
Ennis railway station has direct daily commuter services to Limerick with connections
to Cork and Dublin.
Designation as a Hub Town The National Spatial Strategy identifies Ennis as a hub town along with six other
strategically located medium sized hubs including Cavan, Kilkenny, Mallow,
Monaghan, Tuam and Wexford. In a similar way to the linked gateways the NSS
also proposes that Ballina/Castlebar and Tralee/Killarney act as linked hubs working
together to promote regional development in their areas. These hubs will support and
be supported by the gateways and will link out to wider rural areas. The key
characteristics of hubs include:
4
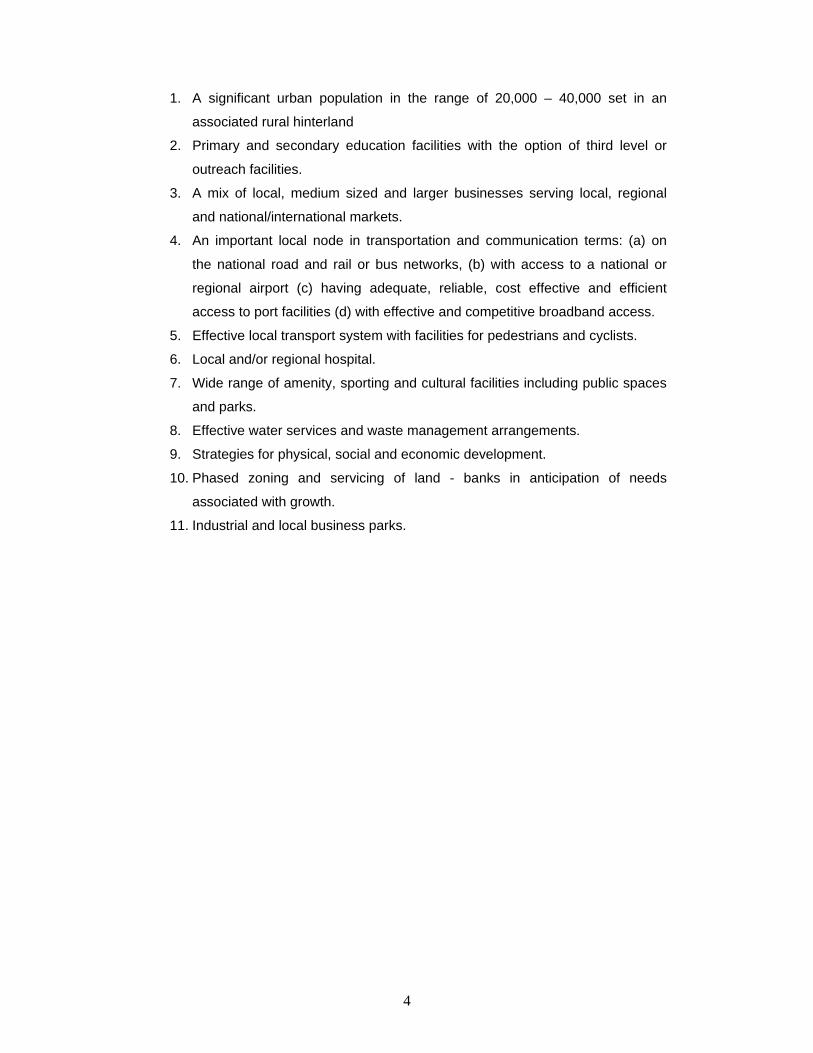
1. A significant urban population in the range of 20,000 – 40,000 set in an
associated rural hinterland
2. Primary and secondary education facilities with the option of third level or
outreach facilities.
3. A mix of local, medium sized and larger businesses serving local, regional
and national/international markets.
4. An important local node in transportation and communication terms: (a) on
the national road and rail or bus networks, (b) with access to a national or
regional airport (c) having adequate, reliable, cost effective and efficient
access to port facilities (d) with effective and competitive broadband access.
5. Effective local transport system with facilities for pedestrians and cyclists.
6. Local and/or regional hospital.
7. Wide range of amenity, sporting and cultural facilities including public spaces
and parks.
8. Effective water services and waste management arrangements.
9. Strategies for physical, social and economic development.
10. Phased zoning and servicing of land - banks in anticipation of needs
associated with growth.
11. Industrial and local business parks.
5
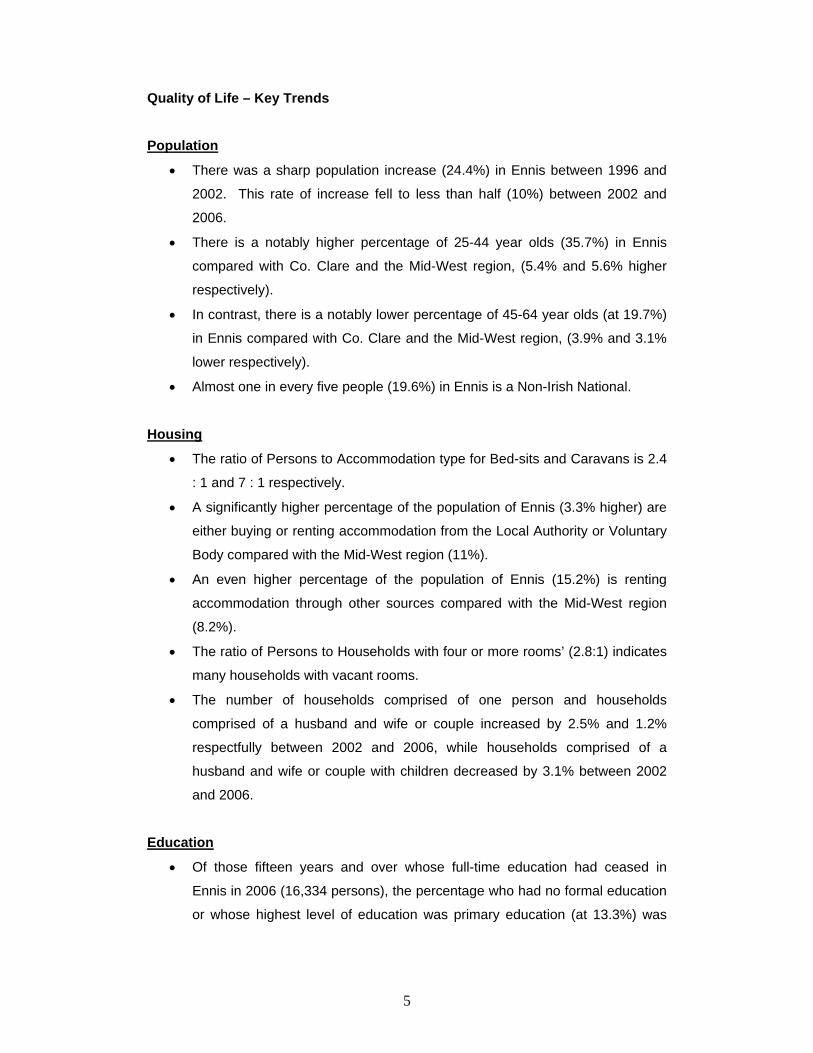
Quality of Life – Key Trends Population
• There was a sharp population increase (24.4%) in Ennis between 1996 and
2002. This rate of increase fell to less than half (10%) between 2002 and
2006.
• There is a notably higher percentage of 25-44 year olds (35.7%) in Ennis
compared with Co. Clare and the Mid-West region, (5.4% and 5.6% higher
respectively).
• In contrast, there is a notably lower percentage of 45-64 year olds (at 19.7%)
in Ennis compared with Co. Clare and the Mid-West region, (3.9% and 3.1%
lower respectively).
• Almost one in every five people (19.6%) in Ennis is a Non-Irish National.
Housing
• The ratio of Persons to Accommodation type for Bed-sits and Caravans is 2.4
: 1 and 7 : 1 respectively.
• A significantly higher percentage of the population of Ennis (3.3% higher) are
either buying or renting accommodation from the Local Authority or Voluntary
Body compared with the Mid-West region (11%).
• An even higher percentage of the population of Ennis (15.2%) is renting
accommodation through other sources compared with the Mid-West region
(8.2%).
• The ratio of Persons to Households with four or more rooms’ (2.8:1) indicates
many households with vacant rooms.
• The number of households comprised of one person and households
comprised of a husband and wife or couple increased by 2.5% and 1.2%
respectfully between 2002 and 2006, while households comprised of a
husband and wife or couple with children decreased by 3.1% between 2002
and 2006.
Education
• Of those fifteen years and over whose full-time education had ceased in
Ennis in 2006 (16,334 persons), the percentage who had no formal education
or whose highest level of education was primary education (at 13.3%) was
6
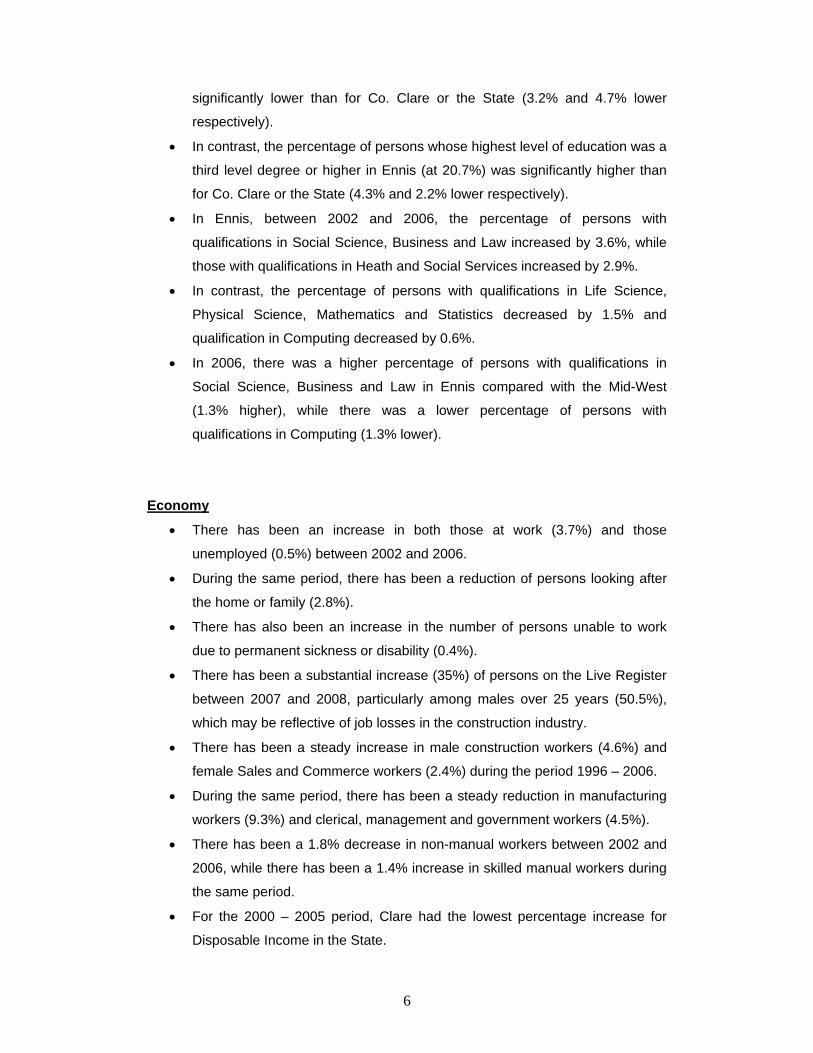
significantly lower than for Co. Clare or the State (3.2% and 4.7% lower
respectively).
• In contrast, the percentage of persons whose highest level of education was a
third level degree or higher in Ennis (at 20.7%) was significantly higher than
for Co. Clare or the State (4.3% and 2.2% lower respectively).
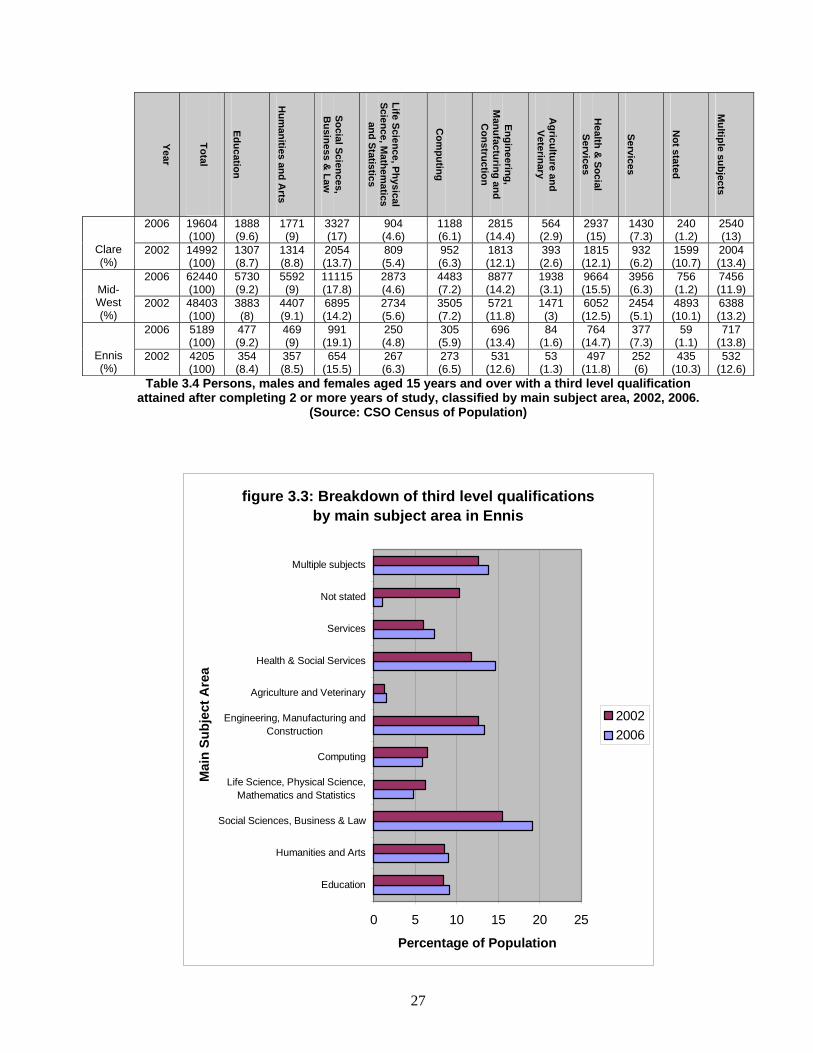
• In Ennis, between 2002 and 2006, the percentage of persons with
qualifications in Social Science, Business and Law increased by 3.6%, while
those with qualifications in Heath and Social Services increased by 2.9%.
• In contrast, the percentage of persons with qualifications in Life Science,
Physical Science, Mathematics and Statistics decreased by 1.5% and
qualification in Computing decreased by 0.6%.
• In 2006, there was a higher percentage of persons with qualifications in
Social Science, Business and Law in Ennis compared with the Mid-West
(1.3% higher), while there was a lower percentage of persons with
qualifications in Computing (1.3% lower).
Economy
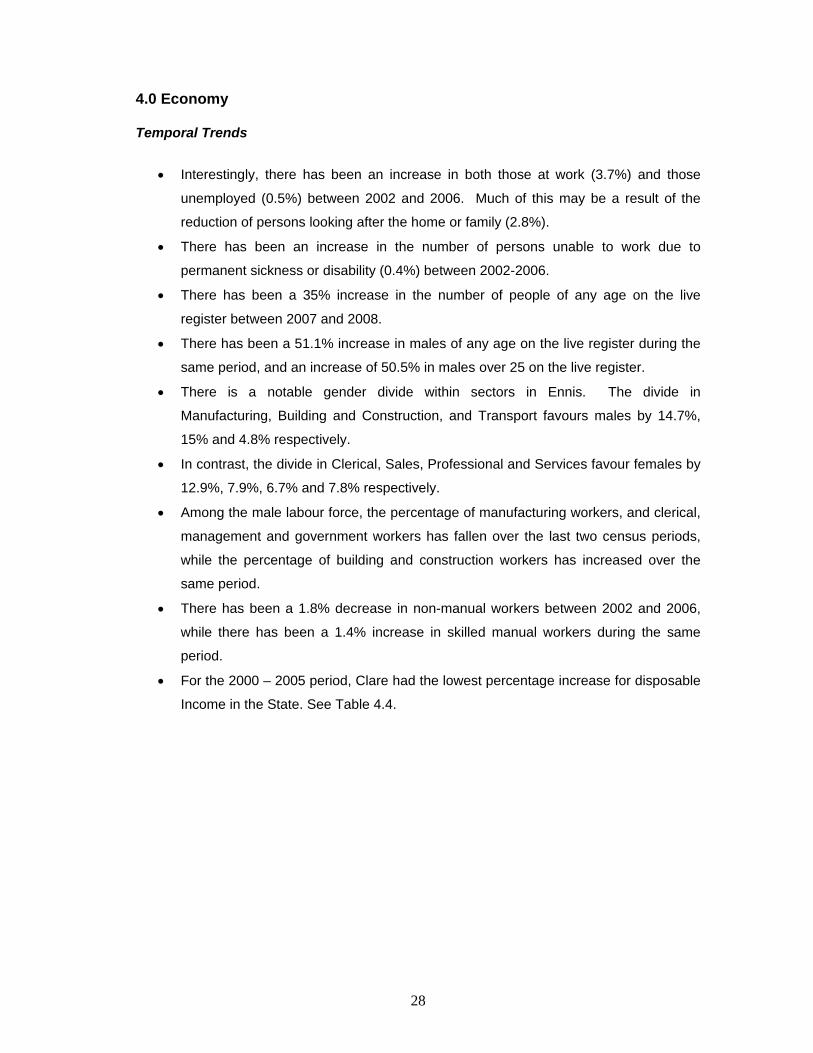
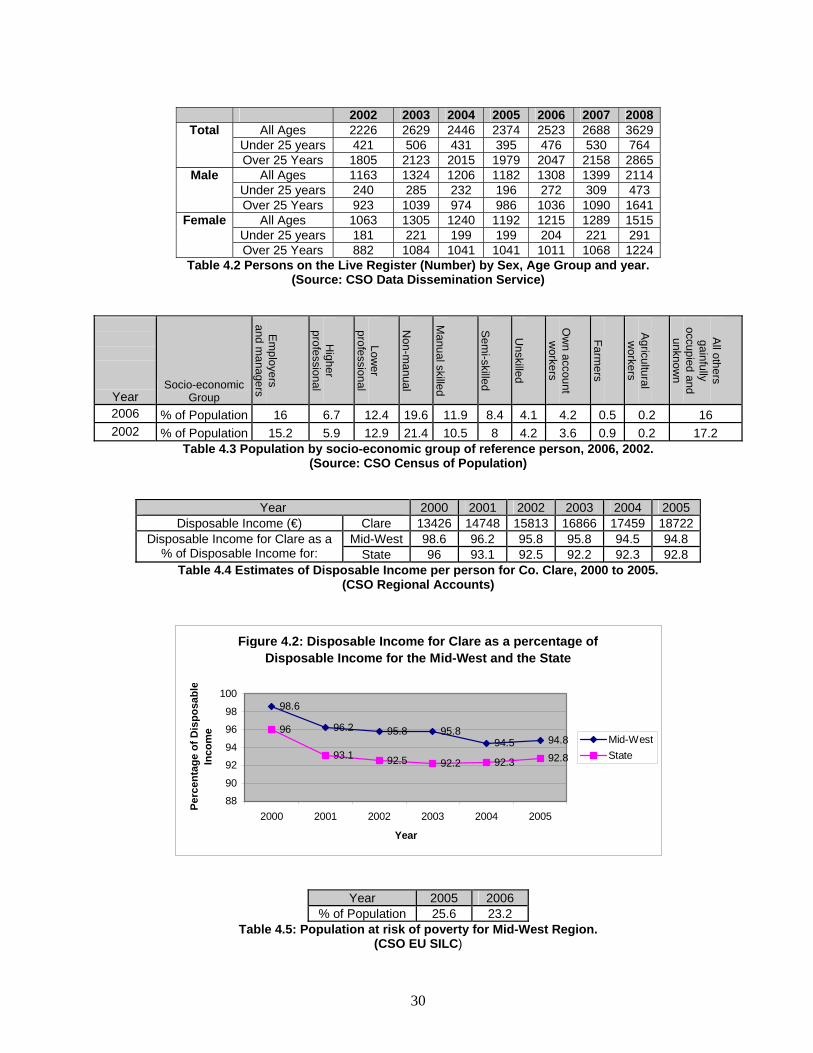
• There has been an increase in both those at work (3.7%) and those
unemployed (0.5%) between 2002 and 2006.
• During the same period, there has been a reduction of persons looking after
the home or family (2.8%).
• There has also been an increase in the number of persons unable to work
due to permanent sickness or disability (0.4%).
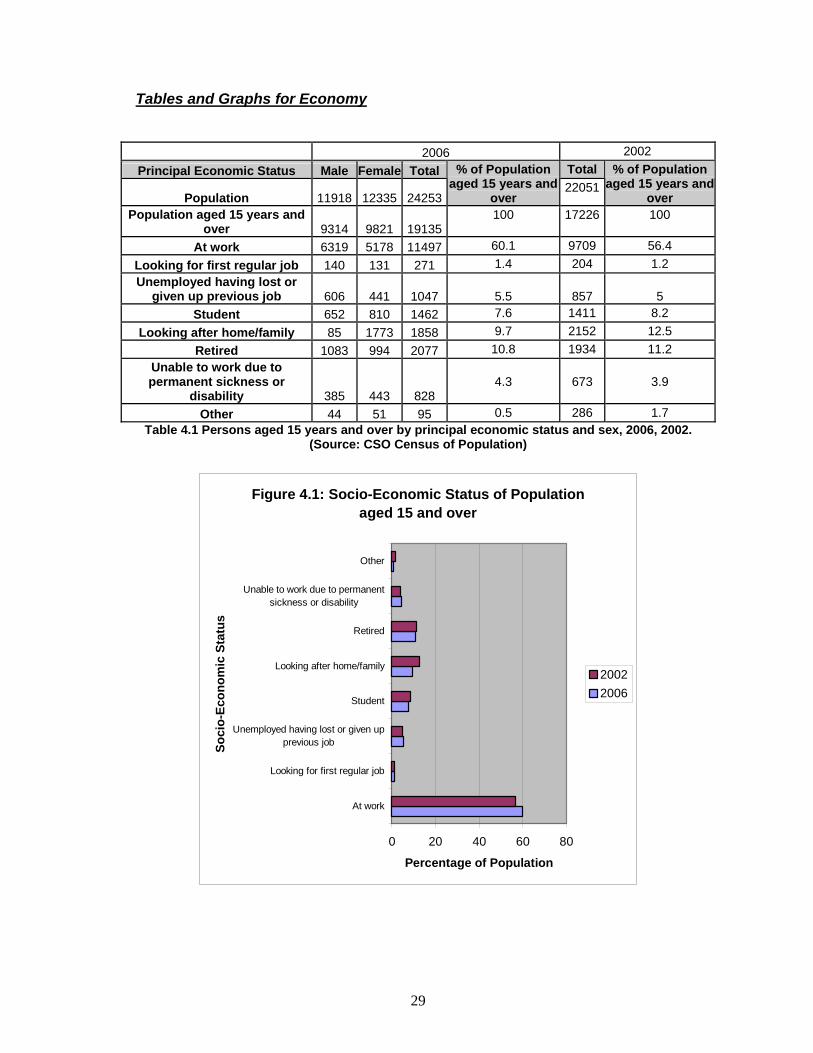
• There has been a substantial increase (35%) of persons on the Live Register
between 2007 and 2008, particularly among males over 25 years (50.5%),
which may be reflective of job losses in the construction industry.
• There has been a steady increase in male construction workers (4.6%) and
female Sales and Commerce workers (2.4%) during the period 1996 – 2006.
• During the same period, there has been a steady reduction in manufacturing
workers (9.3%) and clerical, management and government workers (4.5%).
• There has been a 1.8% decrease in non-manual workers between 2002 and
2006, while there has been a 1.4% increase in skilled manual workers during
the same period.
• For the 2000 – 2005 period, Clare had the lowest percentage increase for
Disposable Income in the State.
7
Health
• In Ennis, in 2005, the percentage of 25-29 year old (23.6%) and 30-34 year
old (36.7%) women giving birth was 1.4% and 0.9% higher respectively than
average for Munster.
• In contrast, the percentage of 20-24 year old (10.8%) and 35-39 year old
(20.6%) women giving birth in Ennis were 1.1% and 1.4% lower respectively
than the Munster average.
• In 2006, of the total population of Ennis, 9.5% had a disability, or multiple
disabilities.
• In 2006, of the total population of Ennis aged 15 years and over, 4.4% were
classed as unpaid carers.
• Of the total number of hospital discharges resident in Co. Clare in 2006,
48.3% held a medical card.
Lifestyle
• The percentage of households with a PC in Ennis (59.5%) is significantly
higher than for the Mid-West and the State (5.6% and 2.9% respectively).
• The rate of overall crime in Ennis increased substantially between 2005 and
2006, and again between 2006 and 2007 (by 16.4% and 12.5% respectively).
Travel & Transport
• Of the total population aged five years and over, 53.1% are travelling nine
kilometres or less to work or school, i.e. within the immediate proximity of
Ennis.
• Of the total population aged five years and over, 18.5% travel on foot to work
or school, while a further 21.5% travel as a car passenger.
• Of the total population aged five years and over, 71% take less than half an
hour to travel to work or school.
• Of the total households in Ennis in 2006, 18.5% did not own a car.
Environment
• The principal water source supplying public water to approximately 23,000
people is vulnerable to pollution and concern over the quality of water from
this source has been recurrent.
• Areas at risk of flooding have been identified and there are current
development exclusion zones in these areas.
8
• The index rating for overall air quality in Ennis is ‘very good’.
• Ennis Town has two wastewater treatment plants providing secondary
treatment only with a combined capacity equivalent to 21,000 head of
population.
Note The target population for Ennis hub under the National Spatial Strategy is
35,000 persons
9
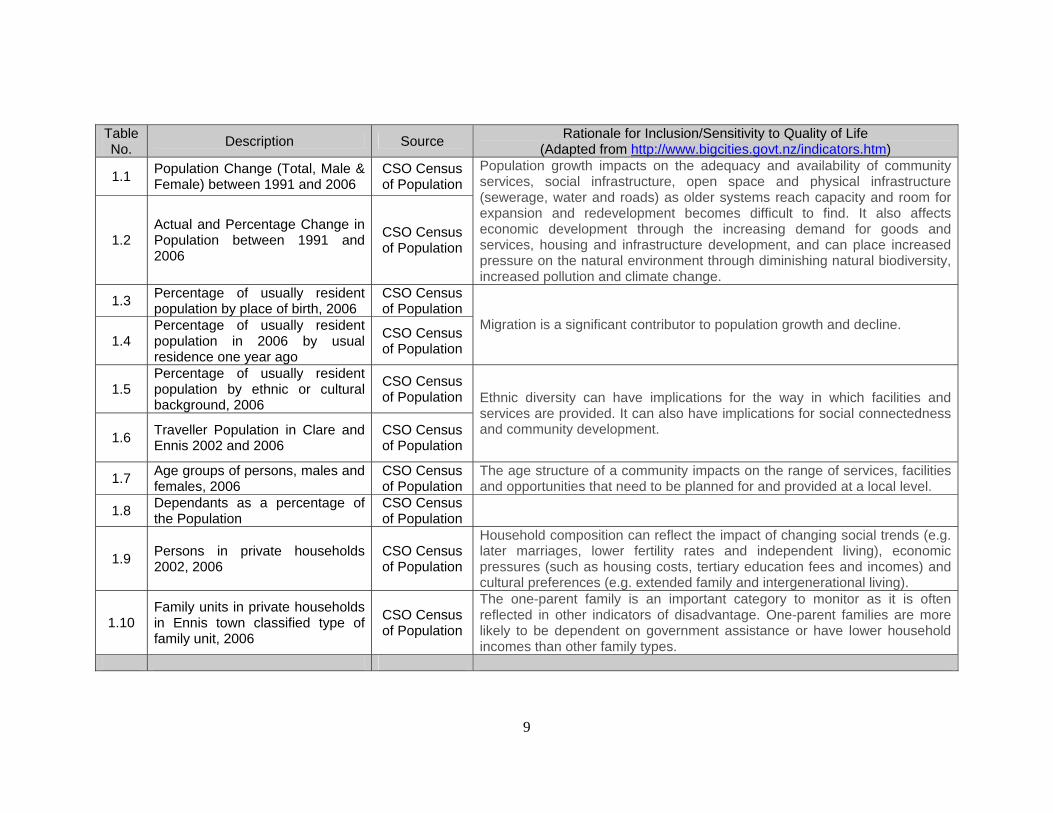
Table No. Description Source Rationale for Inclusion/Sensitivity to Quality of Life
(Adapted from http://www.bigcities.govt.nz/indicators.htm)
1.1 Population Change (Total, Male & Female) between 1991 and 2006
CSO Census of Population
1.2 Actual and Percentage Change in Population between 1991 and 2006
CSO Census of Population
Population growth impacts on the adequacy and availability of community services, social infrastructure, open space and physical infrastructure (sewerage, water and roads) as older systems reach capacity and room for expansion and redevelopment becomes difficult to find. It also affects economic development through the increasing demand for goods and services, housing and infrastructure development, and can place increased pressure on the natural environment through diminishing natural biodiversity, increased pollution and climate change.
1.3 Percentage of usually resident population by place of birth, 2006
CSO Census of Population
1.4 Percentage of usually resident population in 2006 by usual residence one year ago
CSO Census of Population
Migration is a significant contributor to population growth and decline.
1.5 Percentage of usually resident population by ethnic or cultural background, 2006
CSO Census of Population
1.6 Traveller Population in Clare and Ennis 2002 and 2006
CSO Census of Population
Ethnic diversity can have implications for the way in which facilities and services are provided. It can also have implications for social connectedness and community development.
1.7 Age groups of persons, males and females, 2006
CSO Census of Population
The age structure of a community impacts on the range of services, facilities and opportunities that need to be planned for and provided at a local level.
1.8 Dependants as a percentage of the Population
CSO Census of Population
1.9 Persons in private households 2002, 2006
CSO Census of Population
Household composition can reflect the impact of changing social trends (e.g. later marriages, lower fertility rates and independent living), economic pressures (such as housing costs, tertiary education fees and incomes) and cultural preferences (e.g. extended family and intergenerational living).
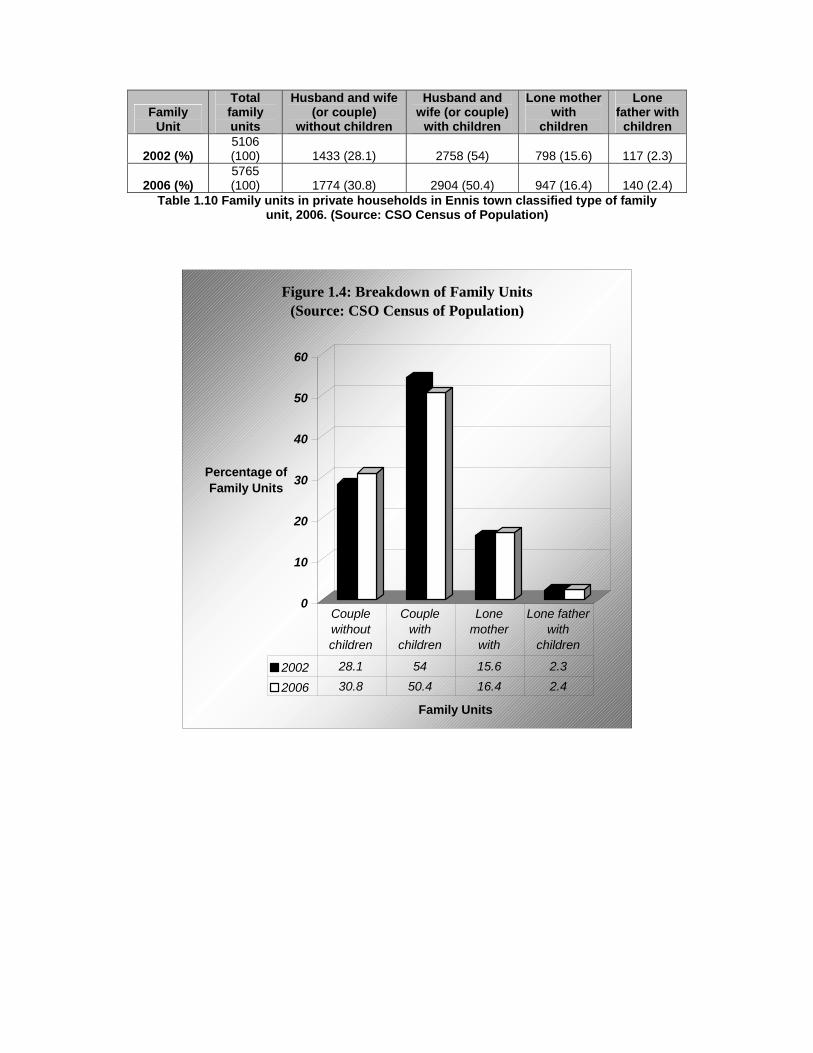
1.10 Family units in private households in Ennis town classified type of family unit, 2006
CSO Census of Population
The one-parent family is an important category to monitor as it is often reflected in other indicators of disadvantage. One-parent families are more likely to be dependent on government assistance or have lower household incomes than other family types.
10
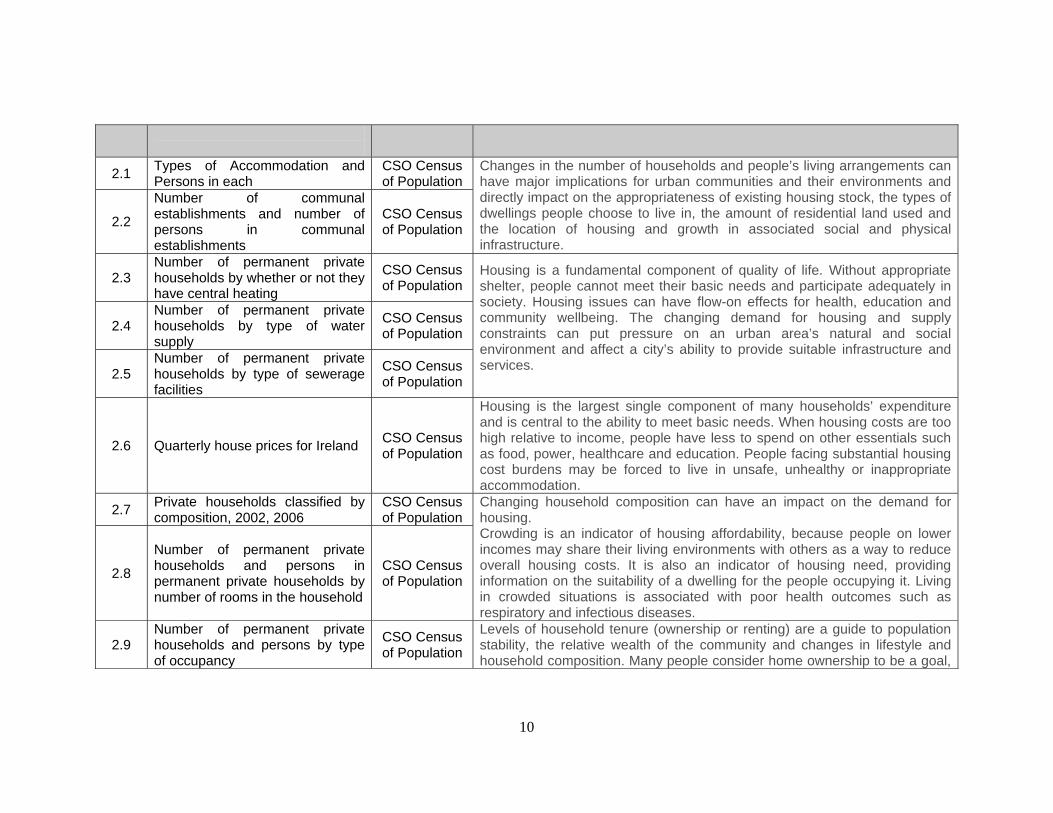
2.1 Types of Accommodation and Persons in each
CSO Census of Population
2.2
Number of communal establishments and number of persons in communal establishments
CSO Census of Population
Changes in the number of households and people’s living arrangements can have major implications for urban communities and their environments and directly impact on the appropriateness of existing housing stock, the types of dwellings people choose to live in, the amount of residential land used and the location of housing and growth in associated social and physical infrastructure.
2.3 Number of permanent private households by whether or not they have central heating
CSO Census of Population
2.4 Number of permanent private households by type of water supply
CSO Census of Population
2.5 Number of permanent private households by type of sewerage facilities
CSO Census of Population
Housing is a fundamental component of quality of life. Without appropriate shelter, people cannot meet their basic needs and participate adequately in society. Housing issues can have flow-on effects for health, education and community wellbeing. The changing demand for housing and supply constraints can put pressure on an urban area’s natural and social environment and affect a city’s ability to provide suitable infrastructure and services.
2.6 Quarterly house prices for Ireland CSO Census of Population
Housing is the largest single component of many households’ expenditure and is central to the ability to meet basic needs. When housing costs are too high relative to income, people have less to spend on other essentials such as food, power, healthcare and education. People facing substantial housing cost burdens may be forced to live in unsafe, unhealthy or inappropriate accommodation.
2.7 Private households classified by composition, 2002, 2006
CSO Census of Population
2.8
Number of permanent private households and persons in permanent private households by number of rooms in the household
CSO Census of Population
Changing household composition can have an impact on the demand for housing. Crowding is an indicator of housing affordability, because people on lower incomes may share their living environments with others as a way to reduce overall housing costs. It is also an indicator of housing need, providing information on the suitability of a dwelling for the people occupying it. Living in crowded situations is associated with poor health outcomes such as respiratory and infectious diseases.
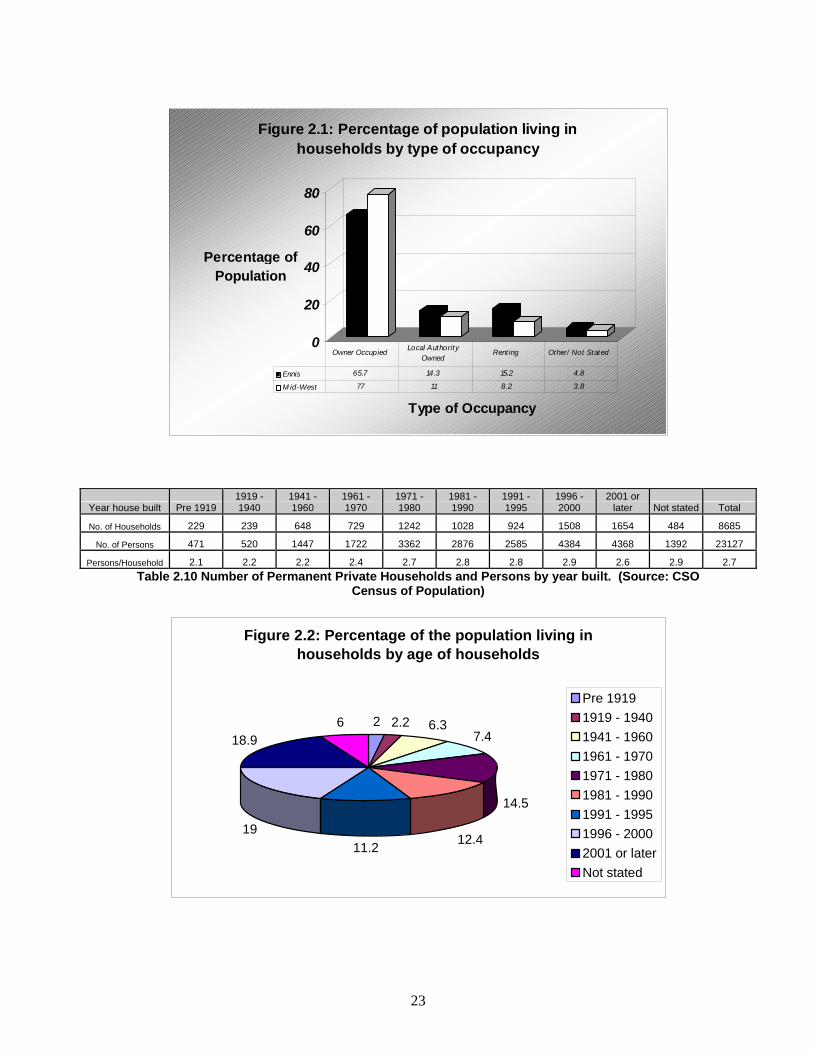
2.9 Number of permanent private households and persons by type of occupancy
CSO Census of Population
Levels of household tenure (ownership or renting) are a guide to population stability, the relative wealth of the community and changes in lifestyle and household composition. Many people consider home ownership to be a goal,
11
providing personal independence as well as stability and security for their families and a form of savings for retirement. While renting is often seen as less attractive, it may also be associated with a more mobile lifestyle and less traditional approaches to saving and investment.
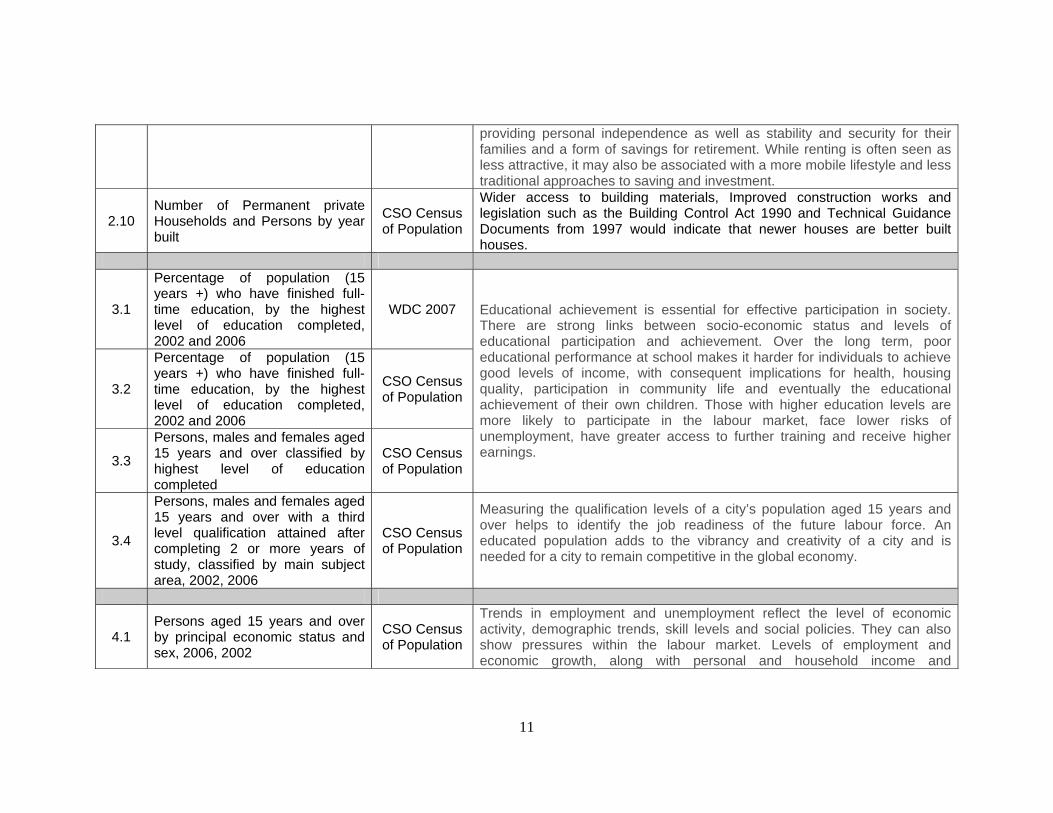
2.10 Number of Permanent private Households and Persons by year built
CSO Census of Population
Wider access to building materials, Improved construction works and legislation such as the Building Control Act 1990 and Technical Guidance Documents from 1997 would indicate that newer houses are better built houses.
3.1
Percentage of population (15 years +) who have finished full-time education, by the highest level of education completed, 2002 and 2006
WDC 2007
3.2
Percentage of population (15 years +) who have finished full-time education, by the highest level of education completed, 2002 and 2006
CSO Census of Population
3.3
Persons, males and females aged 15 years and over classified by highest level of education completed
CSO Census of Population
Educational achievement is essential for effective participation in society. There are strong links between socio-economic status and levels of educational participation and achievement. Over the long term, poor educational performance at school makes it harder for individuals to achieve good levels of income, with consequent implications for health, housing quality, participation in community life and eventually the educational achievement of their own children. Those with higher education levels are more likely to participate in the labour market, face lower risks of unemployment, have greater access to further training and receive higher earnings.
3.4
Persons, males and females aged 15 years and over with a third level qualification attained after completing 2 or more years of study, classified by main subject area, 2002, 2006
CSO Census of Population
Measuring the qualification levels of a city’s population aged 15 years and over helps to identify the job readiness of the future labour force. An educated population adds to the vibrancy and creativity of a city and is needed for a city to remain competitive in the global economy.
4.1 Persons aged 15 years and over by principal economic status and sex, 2006, 2002
CSO Census of Population
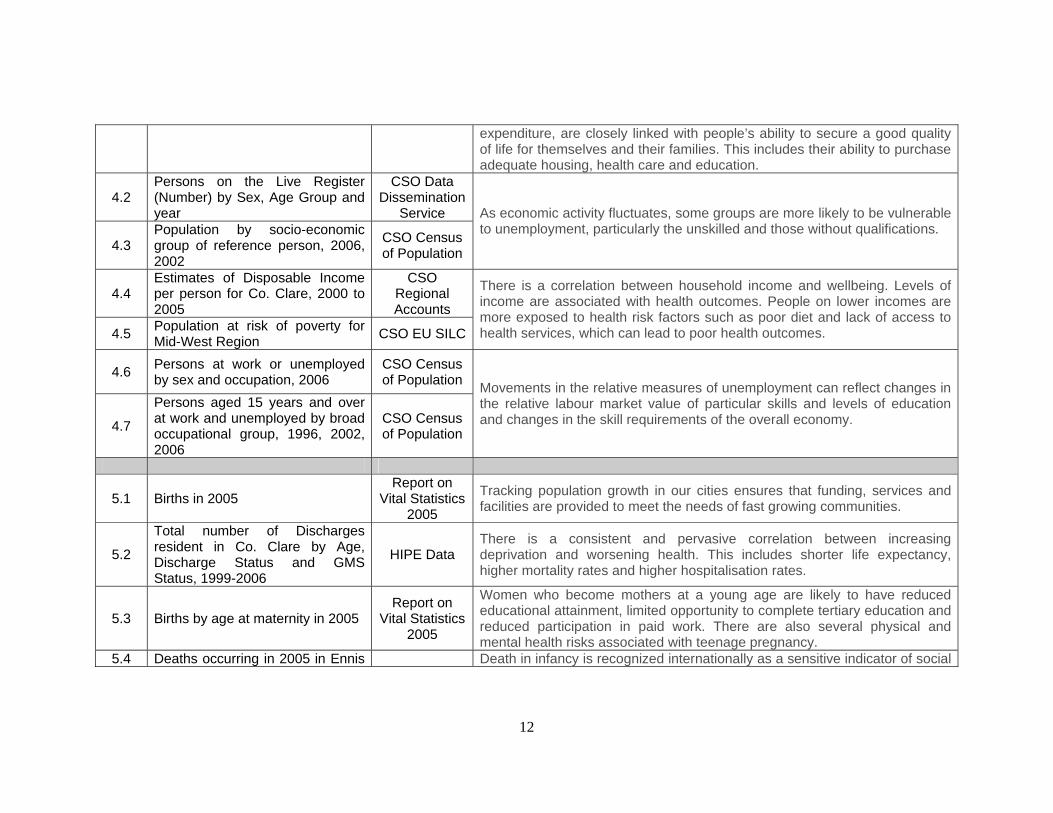
Trends in employment and unemployment reflect the level of economic activity, demographic trends, skill levels and social policies. They can also show pressures within the labour market. Levels of employment and economic growth, along with personal and household income and
12
expenditure, are closely linked with people’s ability to secure a good quality of life for themselves and their families. This includes their ability to purchase adequate housing, health care and education.
4.2 Persons on the Live Register (Number) by Sex, Age Group and year
CSO Data Dissemination
Service
4.3 Population by socio-economic group of reference person, 2006, 2002
CSO Census of Population
As economic activity fluctuates, some groups are more likely to be vulnerable to unemployment, particularly the unskilled and those without qualifications.
4.4 Estimates of Disposable Income per person for Co. Clare, 2000 to 2005
CSO Regional Accounts
4.5 Population at risk of poverty for Mid-West Region CSO EU SILC
There is a correlation between household income and wellbeing. Levels of income are associated with health outcomes. People on lower incomes are more exposed to health risk factors such as poor diet and lack of access to health services, which can lead to poor health outcomes.
4.6 Persons at work or unemployed by sex and occupation, 2006
CSO Census of Population
4.7
Persons aged 15 years and over at work and unemployed by broad occupational group, 1996, 2002, 2006
CSO Census of Population
Movements in the relative measures of unemployment can reflect changes in the relative labour market value of particular skills and levels of education and changes in the skill requirements of the overall economy.
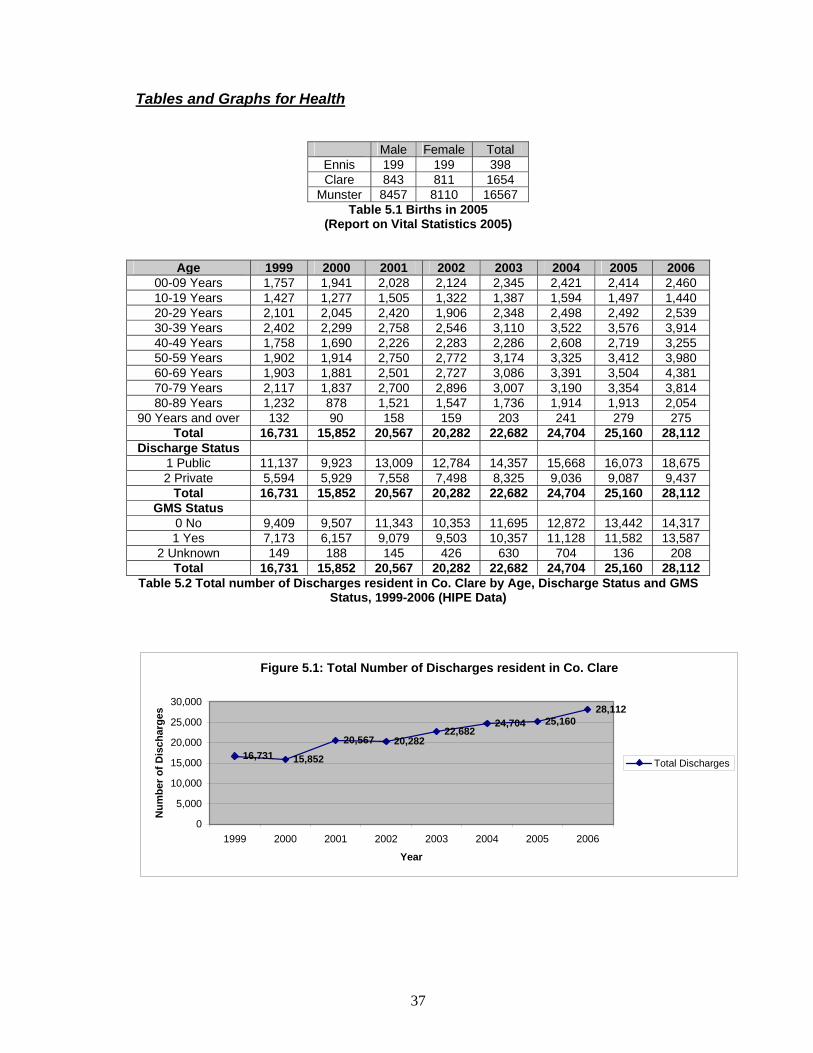
5.1 Births in 2005 Report on
Vital Statistics 2005
Tracking population growth in our cities ensures that funding, services and facilities are provided to meet the needs of fast growing communities.
5.2
Total number of Discharges resident in Co. Clare by Age, Discharge Status and GMS Status, 1999-2006
HIPE Data There is a consistent and pervasive correlation between increasing deprivation and worsening health. This includes shorter life expectancy, higher mortality rates and higher hospitalisation rates.
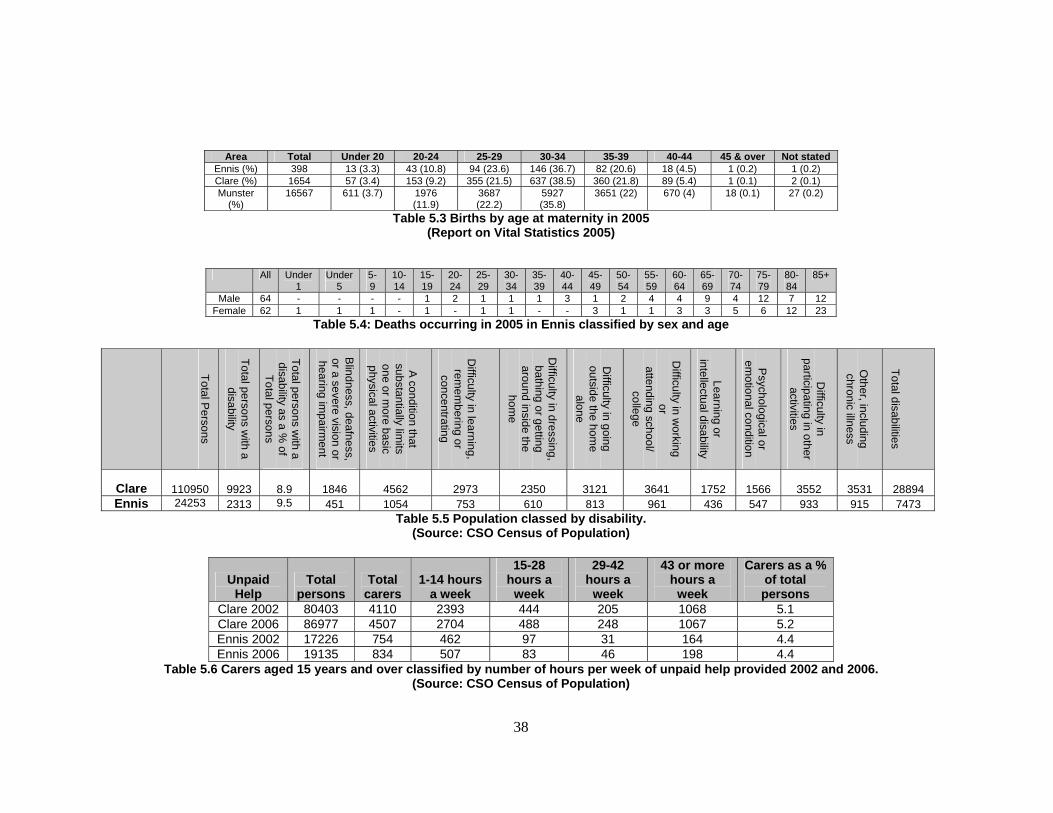
5.3 Births by age at maternity in 2005 Report on
Vital Statistics 2005
Women who become mothers at a young age are likely to have reduced educational attainment, limited opportunity to complete tertiary education and reduced participation in paid work. There are also several physical and mental health risks associated with teenage pregnancy.
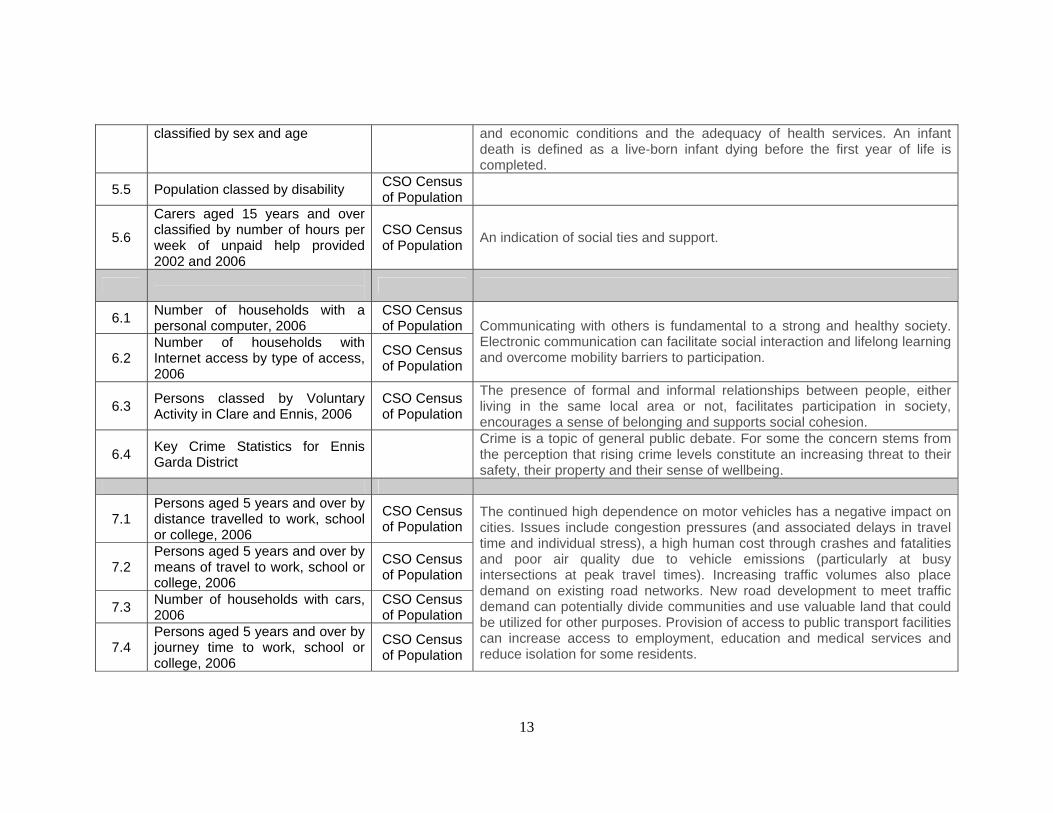
5.4 Deaths occurring in 2005 in Ennis Death in infancy is recognized internationally as a sensitive indicator of social
13
classified by sex and age and economic conditions and the adequacy of health services. An infant death is defined as a live-born infant dying before the first year of life is completed.
5.5 Population classed by disability CSO Census of Population
5.6
Carers aged 15 years and over classified by number of hours per week of unpaid help provided 2002 and 2006
CSO Census of Population An indication of social ties and support.
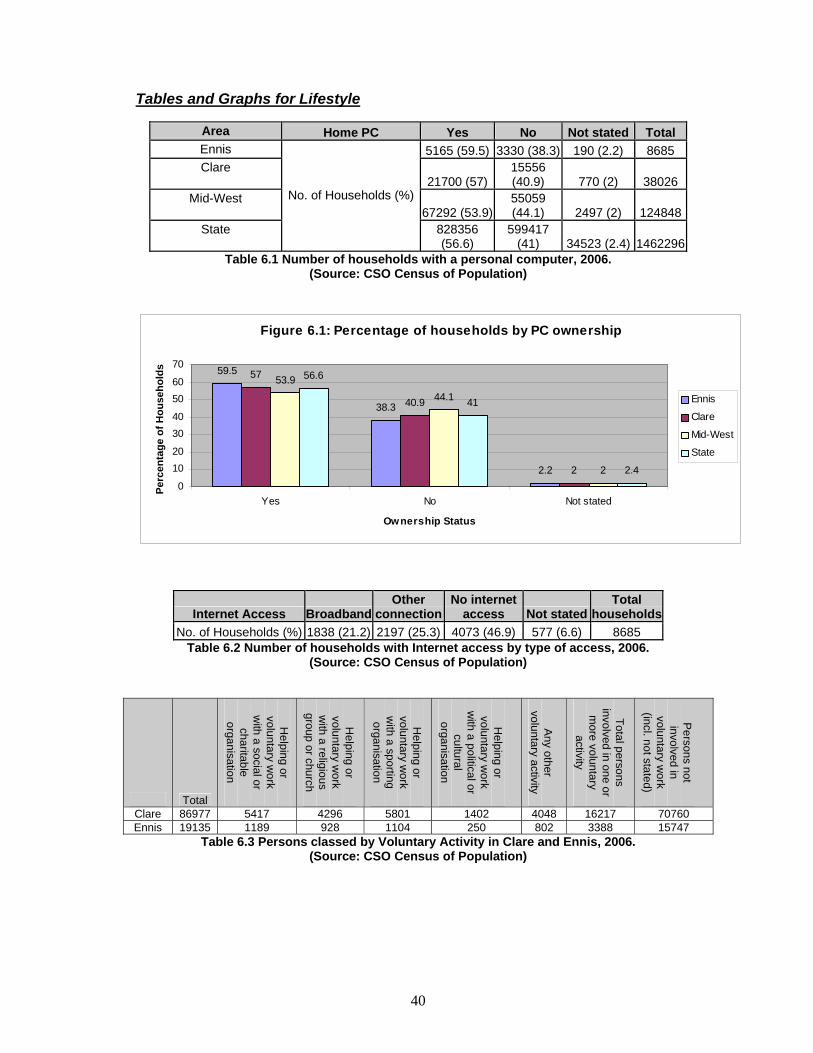
6.1 Number of households with a personal computer, 2006
CSO Census of Population
6.2 Number of households with Internet access by type of access, 2006
CSO Census of Population
Communicating with others is fundamental to a strong and healthy society. Electronic communication can facilitate social interaction and lifelong learning and overcome mobility barriers to participation.
6.3 Persons classed by Voluntary Activity in Clare and Ennis, 2006
CSO Census of Population
The presence of formal and informal relationships between people, either living in the same local area or not, facilitates participation in society, encourages a sense of belonging and supports social cohesion.
6.4 Key Crime Statistics for Ennis Garda District
Crime is a topic of general public debate. For some the concern stems from the perception that rising crime levels constitute an increasing threat to their safety, their property and their sense of wellbeing.
7.1 Persons aged 5 years and over by distance travelled to work, school or college, 2006
CSO Census of Population
7.2 Persons aged 5 years and over by means of travel to work, school or college, 2006
CSO Census of Population
7.3 Number of households with cars, 2006
CSO Census of Population
7.4 Persons aged 5 years and over by journey time to work, school or college, 2006
CSO Census of Population
The continued high dependence on motor vehicles has a negative impact on cities. Issues include congestion pressures (and associated delays in travel time and individual stress), a high human cost through crashes and fatalities and poor air quality due to vehicle emissions (particularly at busy intersections at peak travel times). Increasing traffic volumes also place demand on existing road networks. New road development to meet traffic demand can potentially divide communities and use valuable land that could be utilized for other purposes. Provision of access to public transport facilities can increase access to employment, education and medical services and reduce isolation for some residents.
14
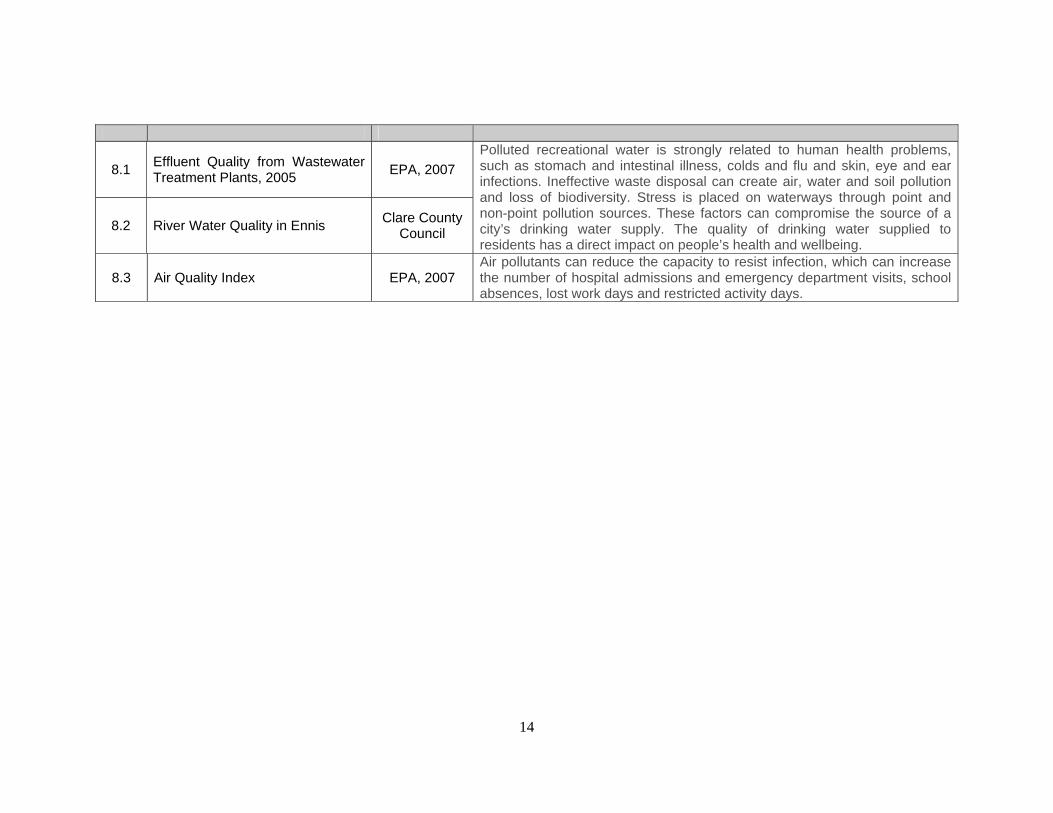
8.1 Effluent Quality from Wastewater Treatment Plants, 2005 EPA, 2007
8.2 River Water Quality in Ennis Clare County Council
Polluted recreational water is strongly related to human health problems, such as stomach and intestinal illness, colds and flu and skin, eye and ear infections. Ineffective waste disposal can create air, water and soil pollution and loss of biodiversity. Stress is placed on waterways through point and non-point pollution sources. These factors can compromise the source of a city’s drinking water supply. The quality of drinking water supplied to residents has a direct impact on people’s health and wellbeing.
8.3 Air Quality Index EPA, 2007 Air pollutants can reduce the capacity to resist infection, which can increase the number of hospital admissions and emergency department visits, school absences, lost work days and restricted activity days.
15
Quality of Life Indicators 1.0 Population
Temporal Trends
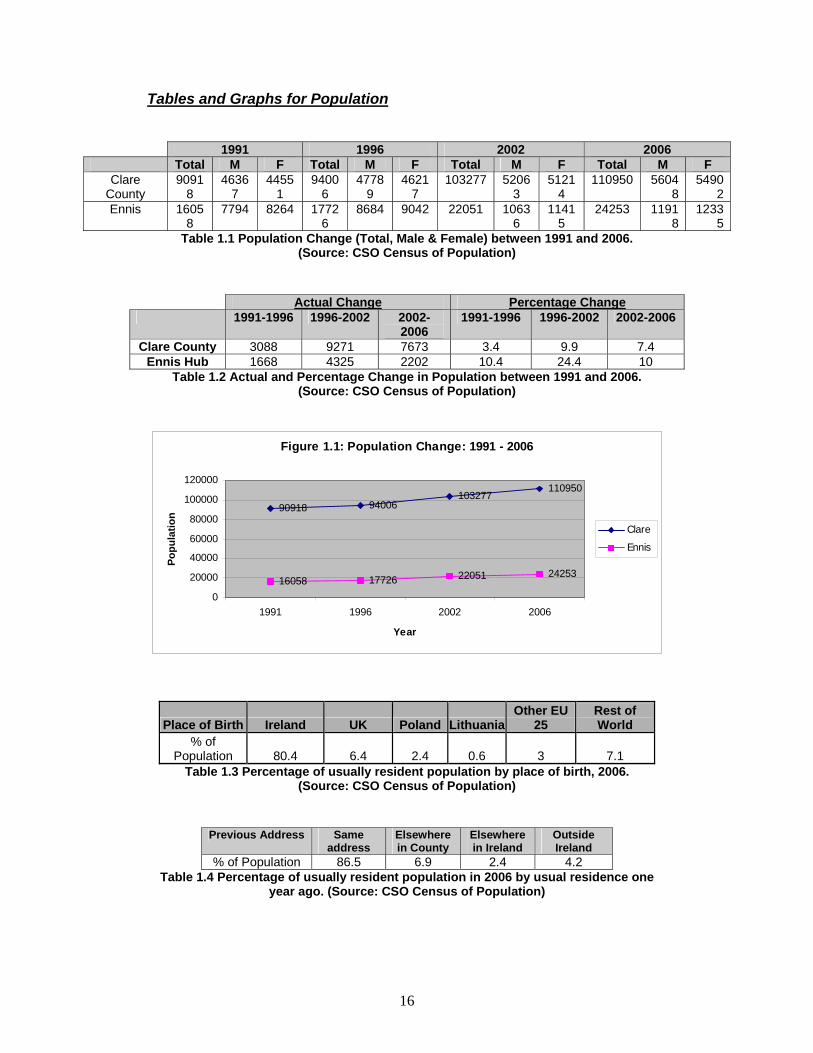
• The percentage change in population in Co. Clare almost tripled between
1996 and 2002 compared with the previous census period. It then fell by
about a quarter in the following census period. In contrast, the percentage
change in population in Ennis more than doubled between 1996 and 2002
compared with the previous period, but fell by as much in the following
census period. However, it needs to be taken into context that the percentage
change for Co. Clare between 1996 and 2002 was 9.9% compared to 24.4%
for Ennis.
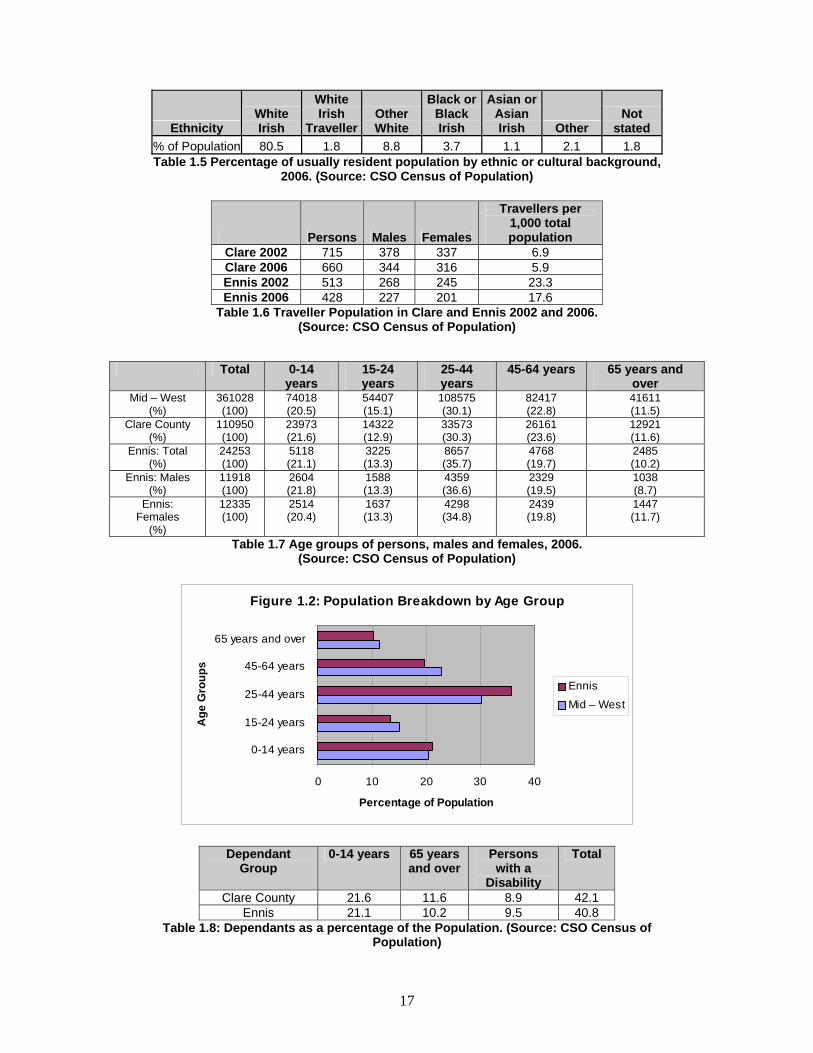
• There is a significantly higher percentage of 25-44 year olds in Ennis
compared with Co. Clare and the Mid-West region, (5.4% and 5.6% higher
respectively). This may be attributed to the designation of Ennis as an
Information Age Town in 1997 and a subsequent influx of workers. In
contrast, there is a significantly lower percentage of 45-64 year olds in Ennis
compared with Co. Clare and the Mid-West region, (3.9% and 3.1% lower
• respectively).
• Almost one in every five people in Ennis is a Non-Irish National, with 6.4%
being born the UK and 2.4% being born in Poland. A significant percentage
(4.2%) of the population resided abroad one year before the 2006 census, i.e.
2005.
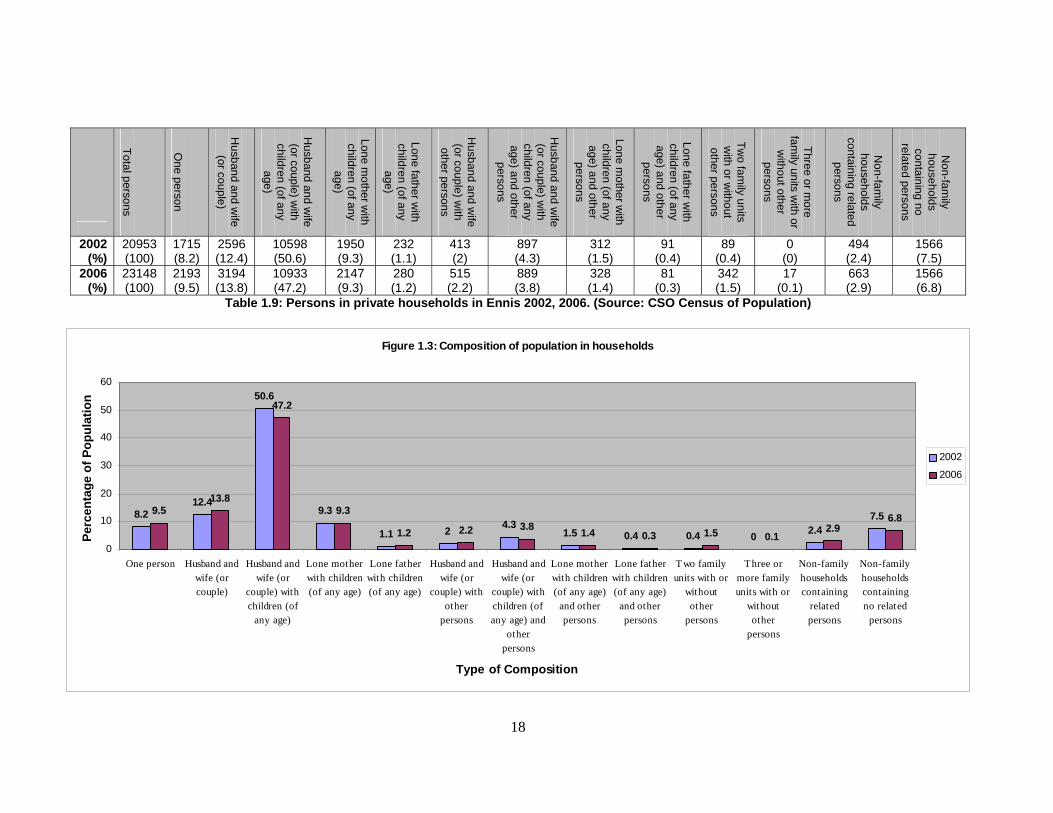
• There has been a significant drop (3.4%) in the percentage of households
comprised of a husband and wife (or couple) with children in Ennis between
2002 and 2006. During the same period, there has been an increase in the
percentage of one-person households (1.3%) and of households comprised
of a husband and wife (or couple) without children (1.4%).
16
Tables and Graphs for Population
1991 1996 2002 2006 Total M F Total M F Total M F Total M F
Clare County
90918
46367
44551
94006
47789
46217
103277 52063
51214
110950 56048
54902
Ennis 16058
7794 8264 17726
8684 9042 22051 10636
11415
24253 11918
12335
Table 1.1 Population Change (Total, Male & Female) between 1991 and 2006. (Source: CSO Census of Population)
Actual Change Percentage Change 1991-1996 1996-2002 2002-
2006 1991-1996 1996-2002 2002-2006
Clare County 3088 9271 7673 3.4 9.9 7.4 Ennis Hub 1668 4325 2202 10.4 24.4 10
Table 1.2 Actual and Percentage Change in Population between 1991 and 2006. (Source: CSO Census of Population)
Figure 1.1: Population Change: 1991 - 2006
90918 94006103277
110950
16058 17726 22051 24253
0
20000
40000
60000
80000
100000
120000
1991 1996 2002 2006
Year
Popu
latio
n
Clare
Ennis
Place of Birth Ireland UK Poland LithuaniaOther EU
25 Rest of World
% of Population 80.4 6.4 2.4 0.6 3 7.1
Table 1.3 Percentage of usually resident population by place of birth, 2006. (Source: CSO Census of Population)
Previous Address Same address
Elsewhere in County
Elsewhere in Ireland
Outside Ireland
% of Population 86.5 6.9 2.4 4.2 Table 1.4 Percentage of usually resident population in 2006 by usual residence one
year ago. (Source: CSO Census of Population)
17
Ethnicity White Irish
White Irish
TravellerOther White
Black or Black Irish
Asian or Asian Irish Other
Not stated
% of Population 80.5 1.8 8.8 3.7 1.1 2.1 1.8 Table 1.5 Percentage of usually resident population by ethnic or cultural background,
2006. (Source: CSO Census of Population)
Persons Males Females
Travellers per 1,000 total population
Clare 2002 715 378 337 6.9 Clare 2006 660 344 316 5.9 Ennis 2002 513 268 245 23.3 Ennis 2006 428 227 201 17.6
Table 1.6 Traveller Population in Clare and Ennis 2002 and 2006. (Source: CSO Census of Population)
Total 0-14 years
15-24 years
25-44 years
45-64 years 65 years and over
Mid – West (%)
361028 (100)
74018 (20.5)
54407 (15.1)
108575 (30.1)
82417 (22.8)
41611 (11.5)
Clare County (%)
110950 (100)
23973 (21.6)
14322 (12.9)
33573 (30.3)
26161 (23.6)
12921 (11.6)
Ennis: Total (%)
24253 (100)
5118 (21.1)
3225 (13.3)
8657 (35.7)
4768 (19.7)
2485 (10.2)
Ennis: Males (%)
11918 (100)
2604 (21.8)
1588 (13.3)
4359 (36.6)
2329 (19.5)
1038 (8.7)
Ennis: Females
(%)
12335 (100)
2514 (20.4)
1637 (13.3)
4298 (34.8)
2439 (19.8)
1447 (11.7)
Table 1.7 Age groups of persons, males and females, 2006. (Source: CSO Census of Population)
Figure 1.2: Population Breakdown by Age Group
0 10 20 30 40
0-14 years
15-24 years
25-44 years
45-64 years
65 years and over
Age
Gro
ups
Percentage of Population
Ennis
Mid – West
Dependant Group
0-14 years 65 years and over
Persons with a
Disability
Total
Clare County 21.6 11.6 8.9 42.1 Ennis 21.1 10.2 9.5 40.8
Table 1.8: Dependants as a percentage of the Population. (Source: CSO Census of Population)
18
Total persons
One person
Husband and w
ife (or couple)
Husband and w
ife (or couple) w
ith children (of any
age)
Lone mother w
ith children (of any
age)
Lone father with
children (of any age)
Husband and w
ife (or couple) w
ith other persons
Husband and w
ife (or couple) w
ith children (of any age) and other
persons
Lone mother w
ith children (of any age) and other
persons
Lone father with
children (of any age) and other
persons
Two fam
ily units w
ith or without
other persons
Three or more
family units w
ith or w
ithout other persons
Non-fam
ily households
containing related persons
Non-fam
ily households
containing no related persons
2002 (%)
20953 (100)
1715 (8.2)
2596 (12.4)
10598 (50.6)
1950 (9.3)
232 (1.1)
413 (2)
897 (4.3)
312 (1.5)
91 (0.4)
89 (0.4)
0 (0)
494 (2.4)
1566 (7.5)
2006 (%)
23148 (100)
2193 (9.5)
3194 (13.8)
10933 (47.2)
2147 (9.3)
280 (1.2)
515 (2.2)
889 (3.8)
328 (1.4)
81 (0.3)
342 (1.5)
17 (0.1)
663 (2.9)
1566 (6.8)
Table 1.9: Persons in private households in Ennis 2002, 2006. (Source: CSO Census of Population)
Figure 1.3: Composition of population in households
8.212.4
50.6
9.3
1.1 2 4.31.5 0.4 0.4 0 2.4
7.59.513.8
47.2
9.3
1.2 2.2 3.8 1.4 0.3 1.5 0.12.9
6.8
0
10
20
30
40
50
60
One person Husband andwife (orcouple)
Husband andwife (or
couple) withchildren (of
any age)
Lone motherwith children(of any age)
Lone fatherwith children(of any age)
Husband andwife (or
couple) withother
persons
Husband andwife (or
couple) withchildren (ofany age) and
otherpersons
Lone motherwith children(of any age)
and otherpersons
Lone fatherwith children(of any age)
and otherpersons
Two familyunits with or
withoutother
persons
Three ormore familyunits with or
withoutother
persons
Non-familyhouseholdscontaining
relatedpersons
Non-familyhouseholdscontainingno related
persons
Type of Composition
Perc
enta
ge o
f Pop
ulat
ion
2002
2006
Family Unit
Total family units
Husband and wife (or couple)
without children
Husband and wife (or couple)
with children
Lone mother with
children
Lone father with
children
2002 (%) 5106 (100) 1433 (28.1) 2758 (54) 798 (15.6) 117 (2.3)
2006 (%) 5765 (100) 1774 (30.8) 2904 (50.4) 947 (16.4) 140 (2.4)
Table 1.10 Family units in private households in Ennis town classified type of family unit, 2006. (Source: CSO Census of Population)
0
10
20
30
40
50
60
Percentage of Family Units
Family Units
Figure 1.4: Breakdown of Family Units (Source: CSO Census of Population)
2002 28.1 54 15.6 2.3
2006 30.8 50.4 16.4 2.4
Couple without children
Couple with
children
Lone mother
with
Lone father with
children
20
2.0 Housing
Temporal Trends
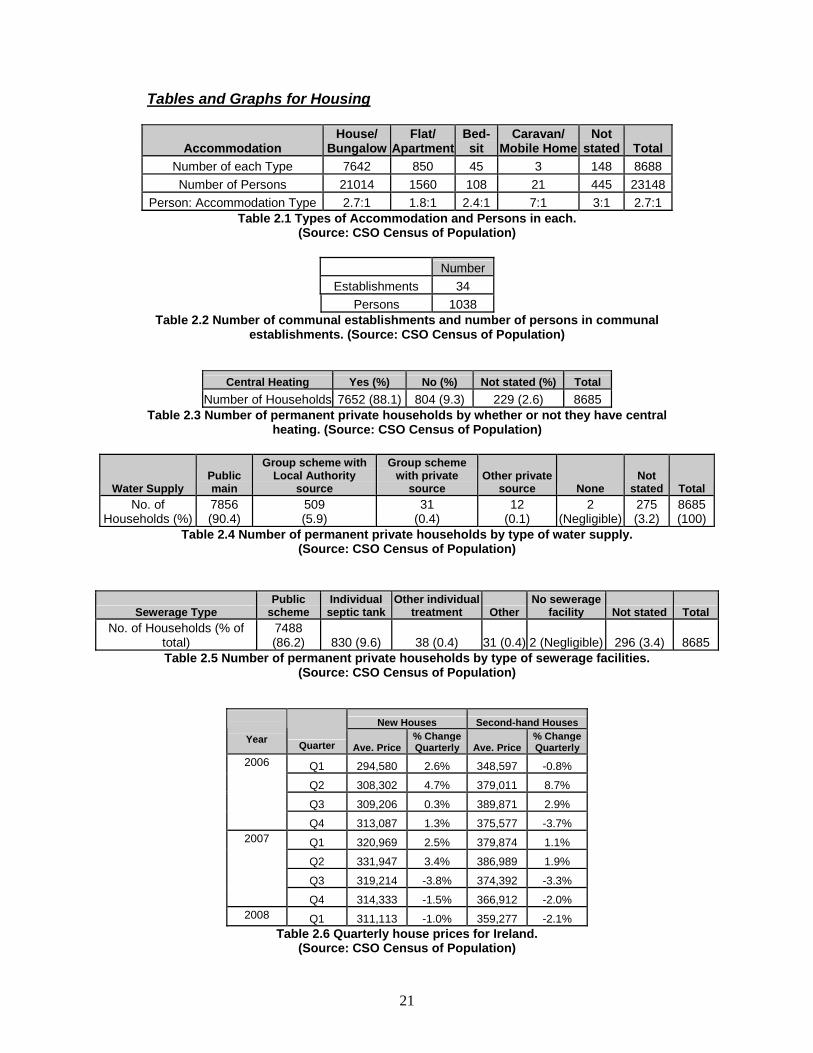
• A high proportion of the population (14.3%) are either buying or renting from
the Local Authority or Voluntary Body. A further 15.2% of the population are
renting accommodation. This is much higher than figures for the Mid-West
Region, which are 11% and 8.2% respectively, however the latter set of
figures also take rural areas into account.
• The number of persons to accommodation type ratio for Bed-sits (2.4:1) and
caravans (7:1) is very high.
• The Public mains that supplies water to 90.4% of the population is recognised
as being vulnerable to pollution and there has been recurrent concerns over
the quality of the water with partial boil notices being put in place on several
occasions.
• The combined capacity of the two public wastewater treatment plants is
equivalent to a population of 21,000. With an average household size of 2.8
persons, and with 86.2% of households using the public scheme, this
corresponds to over 20,000 persons.
• Of the total number of houses, 12.8% were built in 1960 or before, with 10.5%
of the population inhabiting these.
• A further 8.4% were built in 1970 or before, meaning 21.2% of houses are 38
years and over.
• 19% of houses were built since 2001, with 18.9% of the population inhabiting
them
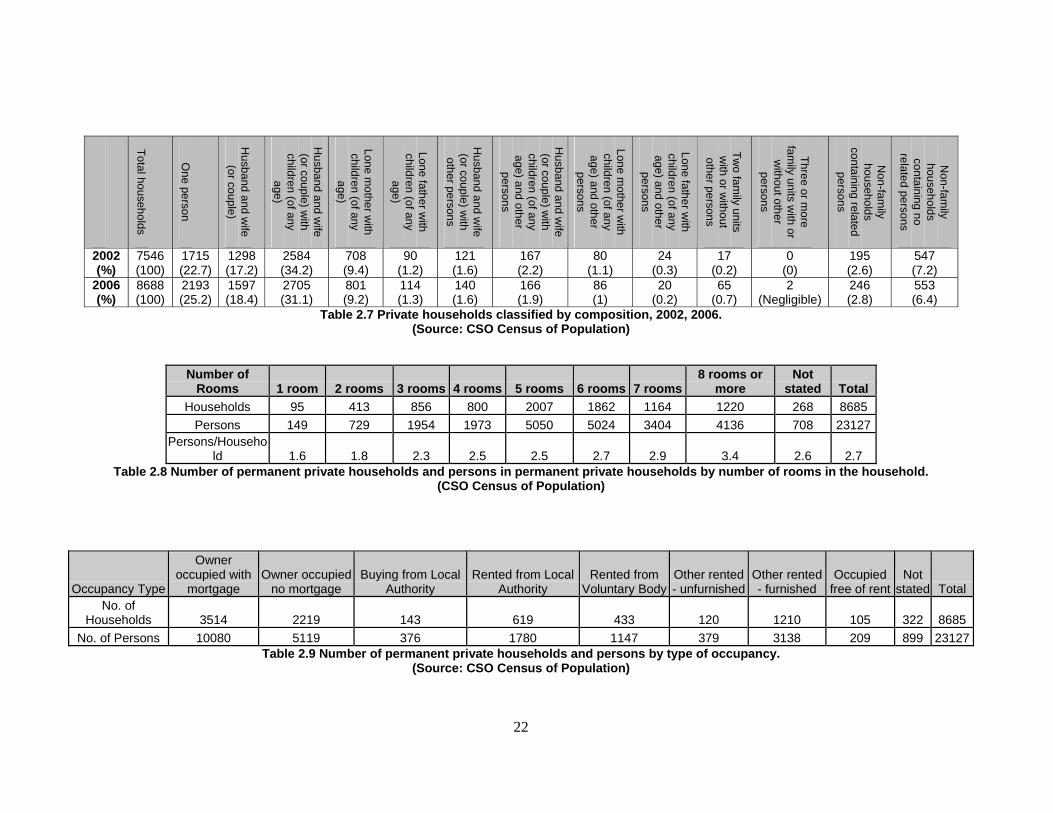
• The composition of households reflects the composition of the population
(section 3.1), i.e. Households comprised of a husband and wife (or couple)
with children has dropped significantly (3.1%) between 2002 and 2006, while
one-person households and households comprised of a husband and wife (or
couple) have increased, 2.5% and 1.2% respectively.
• Although the ratio of persons to households increases as the number of
rooms in each household increases, it is not a significant increase which
indicates a large number of households where rooms are vacant.
21
Tables and Graphs for Housing
Accommodation House/
BungalowFlat/
ApartmentBed-sit
Caravan/ Mobile Home
Not stated Total
Number of each Type 7642 850 45 3 148 8688 Number of Persons 21014 1560 108 21 445 23148
Person: Accommodation Type 2.7:1 1.8:1 2.4:1 7:1 3:1 2.7:1 Table 2.1 Types of Accommodation and Persons in each.
(Source: CSO Census of Population)
Number Establishments 34
Persons 1038 Table 2.2 Number of communal establishments and number of persons in communal
establishments. (Source: CSO Census of Population)
Central Heating Yes (%) No (%) Not stated (%) Total Number of Households 7652 (88.1) 804 (9.3) 229 (2.6) 8685
Table 2.3 Number of permanent private households by whether or not they have central heating. (Source: CSO Census of Population)
Water Supply Public main
Group scheme with Local Authority
source
Group scheme with private
source Other private
source None Not
stated Total No. of
Households (%) 7856 (90.4)
509 (5.9)
31 (0.4)
12 (0.1)
2 (Negligible)
275 (3.2)
8685 (100)
Table 2.4 Number of permanent private households by type of water supply. (Source: CSO Census of Population)
Sewerage Type Public
scheme Individual septic tank
Other individual treatment Other
No sewerage facility Not stated Total
No. of Households (% of total)
7488 (86.2) 830 (9.6) 38 (0.4) 31 (0.4) 2 (Negligible) 296 (3.4) 8685
Table 2.5 Number of permanent private households by type of sewerage facilities. (Source: CSO Census of Population)
New Houses Second-hand Houses
Year Quarter Ave. Price% ChangeQuarterly Ave. Price
% Change Quarterly
Q1 294,580 2.6% 348,597 -0.8%
Q2 308,302 4.7% 379,011 8.7%
Q3 309,206 0.3% 389,871 2.9%
2006
Q4 313,087 1.3% 375,577 -3.7%
Q1 320,969 2.5% 379,874 1.1%
Q2 331,947 3.4% 386,989 1.9%
Q3 319,214 -3.8% 374,392 -3.3%
2007
Q4 314,333 -1.5% 366,912 -2.0% 2008 Q1 311,113 -1.0% 359,277 -2.1%
Table 2.6 Quarterly house prices for Ireland. (Source: CSO Census of Population)
22
Total households
One person
Husband and w
ife (or couple)
Husband and w
ife (or couple) w
ith children (of any
age)
Lone mother w
ith children (of any
age)
Lone father with
children (of any age)
Husband and w
ife (or couple) w
ith other persons
Husband and w
ife (or couple) w
ith children (of any age) and other
persons
Lone mother w
ith children (of any age) and other
persons
Lone father with
children (of any age) and other
persons
Two fam
ily units w
ith or without
other persons
Three or more
family units w
ith or w
ithout other persons
Non-fam
ily households
containing related persons
Non-fam
ily households
containing no related persons
2002 (%)
7546 (100)
1715 (22.7)
1298 (17.2)
2584 (34.2)
708 (9.4)
90 (1.2)
121 (1.6)
167 (2.2)
80 (1.1)
24 (0.3)
17 (0.2)
0 (0)
195 (2.6)
547 (7.2)
2006 (%)
8688 (100)
2193 (25.2)
1597 (18.4)
2705 (31.1)
801 (9.2)
114 (1.3)
140 (1.6)
166 (1.9)
86 (1)
20 (0.2)
65 (0.7)
2 (Negligible)
246 (2.8)
553 (6.4)
Table 2.7 Private households classified by composition, 2002, 2006. (Source: CSO Census of Population)
Number of Rooms 1 room 2 rooms 3 rooms 4 rooms 5 rooms 6 rooms 7 rooms
8 rooms or more
Not stated Total
Households 95 413 856 800 2007 1862 1164 1220 268 8685 Persons 149 729 1954 1973 5050 5024 3404 4136 708 23127
Persons/Household 1.6 1.8 2.3 2.5 2.5 2.7 2.9 3.4 2.6 2.7
Table 2.8 Number of permanent private households and persons in permanent private households by number of rooms in the household. (CSO Census of Population)
Occupancy Type
Owner occupied with
mortgage Owner occupied
no mortgage Buying from Local
Authority Rented from Local
Authority Rented from
Voluntary BodyOther rented - unfurnished
Other rented - furnished
Occupied free of rent
Not stated Total
No. of Households 3514 2219 143 619 433 120 1210 105 322 8685
No. of Persons 10080 5119 376 1780 1147 379 3138 209 899 23127Table 2.9 Number of permanent private households and persons by type of occupancy.
(Source: CSO Census of Population)
23
0
20
40
60
80
Percentage of Population
Type of Occupancy
Figure 2.1: Percentage of population living in households by type of occupancy
Ennis 65.7 14.3 15.2 4.8
M id-West 77 11 8.2 3.8
Owner Occupied Local Authority Owned
Rent ing Other/ Not Stated
Year house built Pre 1919 1919 - 1940
1941 - 1960
1961 - 1970
1971 - 1980
1981 - 1990
1991 - 1995
1996 - 2000
2001 or later Not stated Total
No. of Households 229 239 648 729 1242 1028 924 1508 1654 484 8685
No. of Persons 471 520 1447 1722 3362 2876 2585 4384 4368 1392 23127
Persons/Household 2.1 2.2 2.2 2.4 2.7 2.8 2.8 2.9 2.6 2.9 2.7 Table 2.10 Number of Permanent Private Households and Persons by year built. (Source: CSO
Census of Population)
Figure 2.2: Percentage of the population living in households by age of households
2 2.2 6.37.4
14.5
12.411.219
18.96
Pre 19191919 - 19401941 - 19601961 - 19701971 - 19801981 - 19901991 - 19951996 - 20002001 or laterNot stated
24
3.0 Education
Temporal Trends
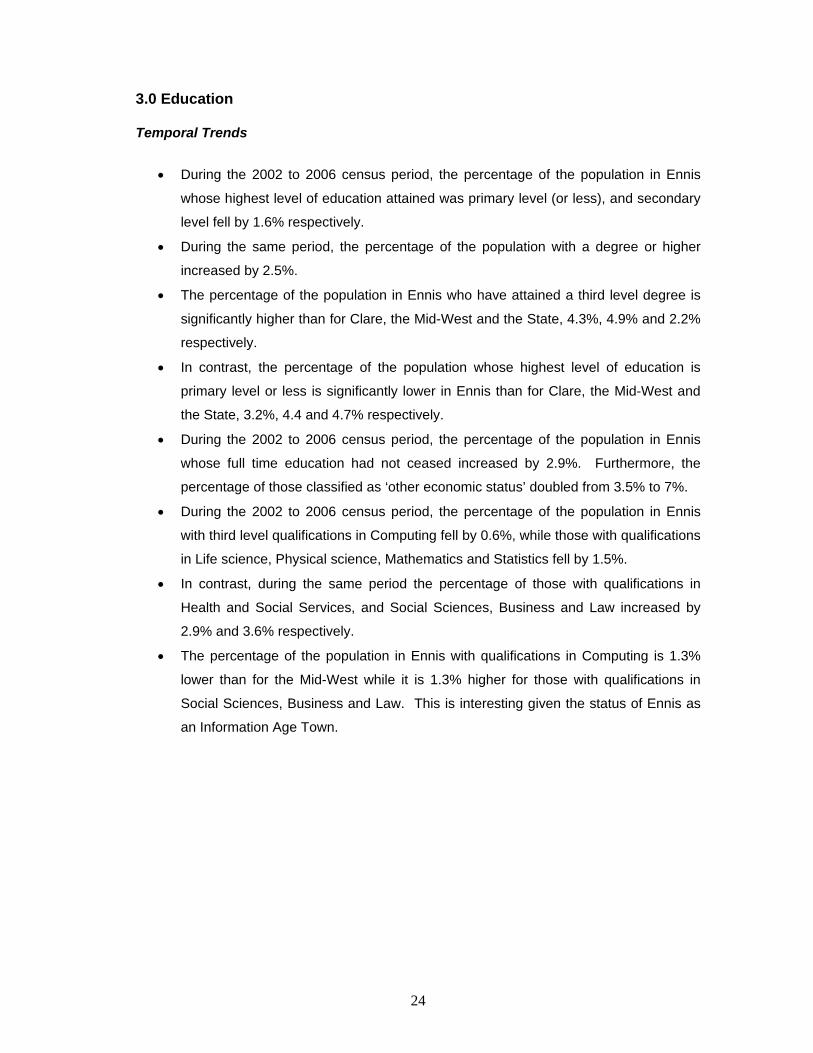
• During the 2002 to 2006 census period, the percentage of the population in Ennis
whose highest level of education attained was primary level (or less), and secondary
level fell by 1.6% respectively.
• During the same period, the percentage of the population with a degree or higher
increased by 2.5%.
• The percentage of the population in Ennis who have attained a third level degree is
significantly higher than for Clare, the Mid-West and the State, 4.3%, 4.9% and 2.2%
respectively.
• In contrast, the percentage of the population whose highest level of education is
primary level or less is significantly lower in Ennis than for Clare, the Mid-West and
the State, 3.2%, 4.4 and 4.7% respectively.
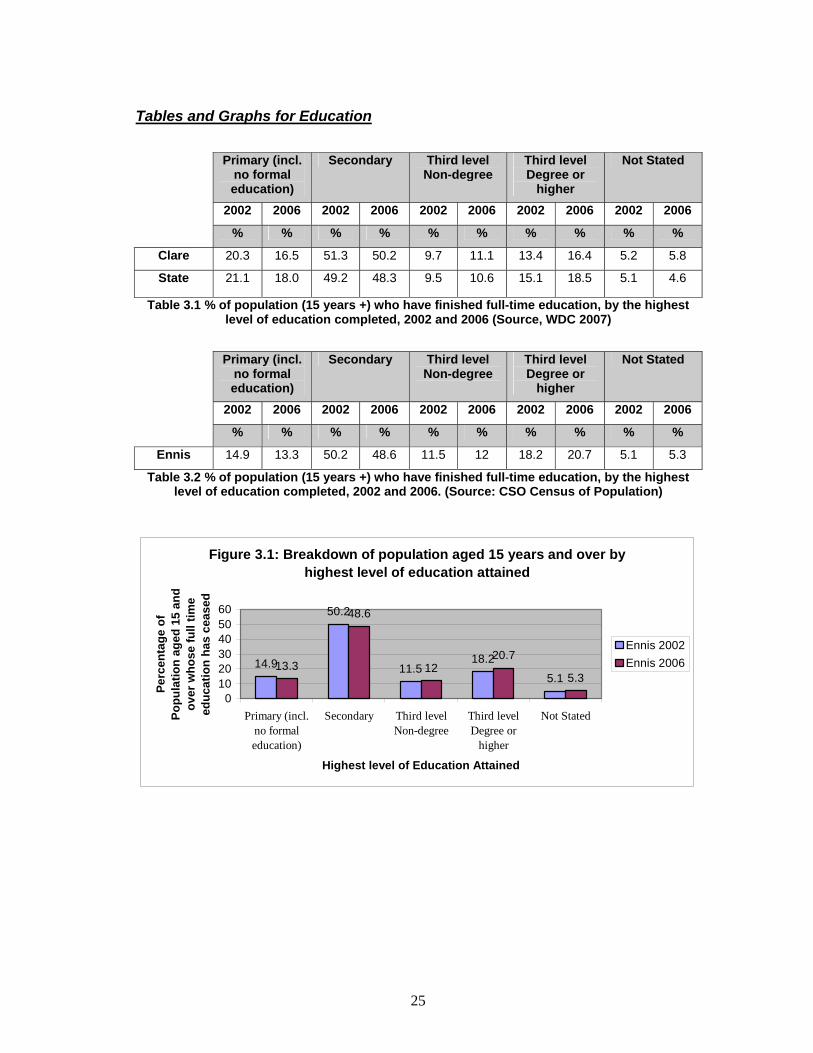
• During the 2002 to 2006 census period, the percentage of the population in Ennis
whose full time education had not ceased increased by 2.9%. Furthermore, the
percentage of those classified as ‘other economic status’ doubled from 3.5% to 7%.
• During the 2002 to 2006 census period, the percentage of the population in Ennis
with third level qualifications in Computing fell by 0.6%, while those with qualifications
in Life science, Physical science, Mathematics and Statistics fell by 1.5%.
• In contrast, during the same period the percentage of those with qualifications in
Health and Social Services, and Social Sciences, Business and Law increased by
2.9% and 3.6% respectively.
• The percentage of the population in Ennis with qualifications in Computing is 1.3%
lower than for the Mid-West while it is 1.3% higher for those with qualifications in
Social Sciences, Business and Law. This is interesting given the status of Ennis as
an Information Age Town.
25
Tables and Graphs for Education
Table 3.1 % of population (15 years +) who have finished full-time education, by the highest level of education completed, 2002 and 2006 (Source, WDC 2007)
Table 3.2 % of population (15 years +) who have finished full-time education, by the highest level of education completed, 2002 and 2006. (Source: CSO Census of Population)
Primary (incl. no formal education)
Secondary Third level Non-degree
Third level Degree or
higher
Not Stated
2002 2006 2002 2006 2002 2006 2002 2006 2002 2006
% % % % % % % % % %
Clare 20.3 16.5 51.3 50.2 9.7 11.1 13.4 16.4 5.2 5.8
State 21.1 18.0 49.2 48.3 9.5 10.6 15.1 18.5 5.1 4.6
Primary (incl. no formal education)
Secondary Third level Non-degree
Third level Degree or
higher
Not Stated
2002 2006 2002 2006 2002 2006 2002 2006 2002 2006
% % % % % % % % % %
Ennis 14.9 13.3 50.2 48.6 11.5 12 18.2 20.7 5.1 5.3
Figure 3.1: Breakdown of population aged 15 years and over by highest level of education attained
14.9
50.2
11.518.2
5.113.3
48.6
1220.7
5.3
0102030405060
Primary (incl.no formaleducation)
Secondary Third levelNon-degree
Third levelDegree or
higher
Not Stated
Highest level of Education Attained
Perc
enta
ge o
f Po
pula
tion
aged
15
and
over
who
se fu
ll tim
e ed
ucat
ion
has
ceas
ed
Ennis 2002Ennis 2006
26
Figure 3.2: Breakdown of population aged 15 and over by highest level of education attained
0
10
20
30
40
50
60
Primary (incl. noformal education)
Secondary Third level Non-degree
Third level Degreeor higher
Not Stated
Highest level of education attained
Perc
enta
ge o
f pop
ulat
ion
aged
15
and
over
w
hose
full
time
educ
atio
n ha
s ce
ased
EnnisClareMid-WestState
Table 3.3 Persons, males and females aged 15 years and over classified by highest level of education completed. (Source: CSO Census of Population)
Year Total
Total whose full-
time education
has ceased
Primary
(incl. no formal
education)
Lower secondary
Upper secondary
Third level, non-degree
Third level, degree or higher
Not stated
Total whose full-
time education
has not ceased
Total at school, university, etc
Other econom
ic status
2006 86977
74967 (86.2)
12402 (14.3)
14598 (16.8)
23001 (26.4)
8330 (9.6)
12272 (14.1)
4364 (5)
12010 (13.8)
7887 (9.1)
4123 (4.7)
Clare (%)
2002 80403
69991 (87)
14224 (17.7)
14889 (18.5)
21035 (26.2)
6795 (8.4)
9391 (11.7)
3657 (4.5)
10412 (13)
7952 (9.9)
2460 (3.1)
2006 287010
242335 (84.4)
42826 (14.9)
51657 (18)
72904 (25.4)
25854 (9)
38311 (13.3)
10783 (3.8)
44675 (15.6)
31277 (10.9)
13398 (4.7) Mid-
West (%)
2002 267623
226589 (84.7)
48285 (18)
51649 (19.3)
66378 (24.8)
21425 (8)
29225 (10.9)
9627 (3.6)
41034 (15.3)
32115 (12)
8919 (3.3)
2006 19135
16334 (85.4)
2177 (11.4)
2763 (14.4)
5179 (27.1)
1954 (10.2)
3390 (17.7)
871 (4.5)
2801 (14.6)
1462 (7.6)
1339 (7)
Ennis (%)
2002 17226
15207 (88.3)
2273 (13.2)
2729 (15.8)
4912 (28.5)
1746 (10.1)
2770 (16.1)
777 (4.5)
2019 (11.7)
1411 (8.2)
608 (3.5)
27
Table 3.4 Persons, males and females aged 15 years and over with a third level qualification attained after completing 2 or more years of study, classified by main subject area, 2002, 2006.
(Source: CSO Census of Population)
figure 3.3: Breakdown of third level qualifications by main subject area in Ennis
0 5 10 15 20 25
Education
Humanities and Arts
Social Sciences, Business & Law
Life Science, Physical Science,Mathematics and Statistics
Computing
Engineering, Manufacturing andConstruction
Agriculture and Veterinary
Health & Social Services
Services
Not stated
Multiple subjects
Mai
n Su
bjec
t Are
a
Percentage of Population
20022006
Year
Total
Education
Hum
anities and Arts
Social Sciences, B
usiness & Law
Life Science, Physical Science, M
athematics
and Statistics
Com
puting
Engineering, M
anufacturing and C
onstruction
Agriculture and Veterinary
Health &
Social Services
Services
Not stated
Multiple subjects
2006 19604 (100)
1888 (9.6)
1771 (9)
3327 (17)
904 (4.6)
1188 (6.1)
2815 (14.4)
564 (2.9)
2937 (15)
1430 (7.3)
240 (1.2)
2540 (13)
Clare (%)
2002 14992 (100)
1307 (8.7)
1314 (8.8)
2054 (13.7)
809 (5.4)
952 (6.3)
1813 (12.1)
393 (2.6)
1815 (12.1)
932 (6.2)
1599 (10.7)
2004 (13.4)
2006 62440 (100)
5730 (9.2)
5592 (9)
11115 (17.8)
2873 (4.6)
4483 (7.2)
8877 (14.2)
1938 (3.1)
9664 (15.5)
3956 (6.3)
756 (1.2)
7456 (11.9) Mid-
West (%)
2002 48403 (100)
3883 (8)
4407 (9.1)
6895 (14.2)
2734 (5.6)
3505 (7.2)
5721 (11.8)
1471 (3)
6052 (12.5)
2454 (5.1)
4893 (10.1)
6388 (13.2)
2006 5189 (100)
477 (9.2)
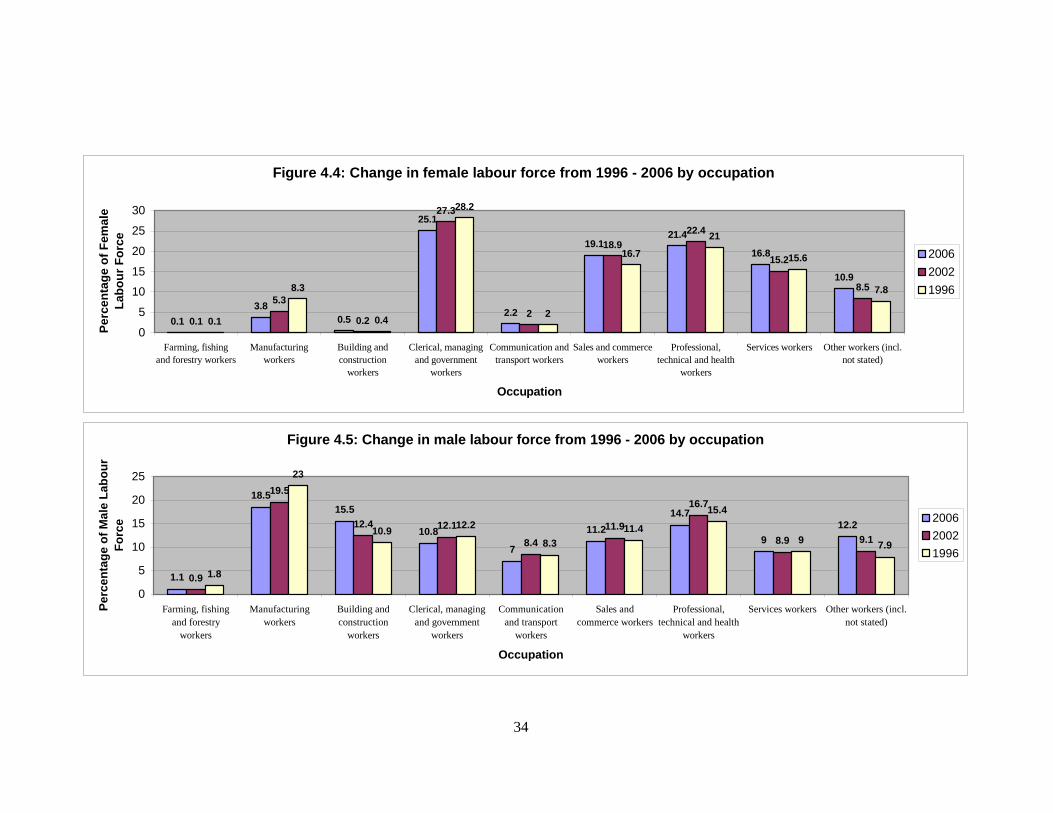
469 (9)
991 (19.1)
250 (4.8)
305 (5.9)
696 (13.4)
84 (1.6)
764 (14.7)
377 (7.3)
59 (1.1)
717 (13.8)
Ennis (%)
2002 4205 (100)
354 (8.4)
357 (8.5)
654 (15.5)
267 (6.3)
273 (6.5)
531 (12.6)
53 (1.3)
497 (11.8)
252 (6)
435 (10.3)
532 (12.6)
28
4.0 Economy
Temporal Trends
• Interestingly, there has been an increase in both those at work (3.7%) and those
unemployed (0.5%) between 2002 and 2006. Much of this may be a result of the
reduction of persons looking after the home or family (2.8%).
• There has been an increase in the number of persons unable to work due to
permanent sickness or disability (0.4%) between 2002-2006.
• There has been a 35% increase in the number of people of any age on the live
register between 2007 and 2008.
• There has been a 51.1% increase in males of any age on the live register during the
same period, and an increase of 50.5% in males over 25 on the live register.
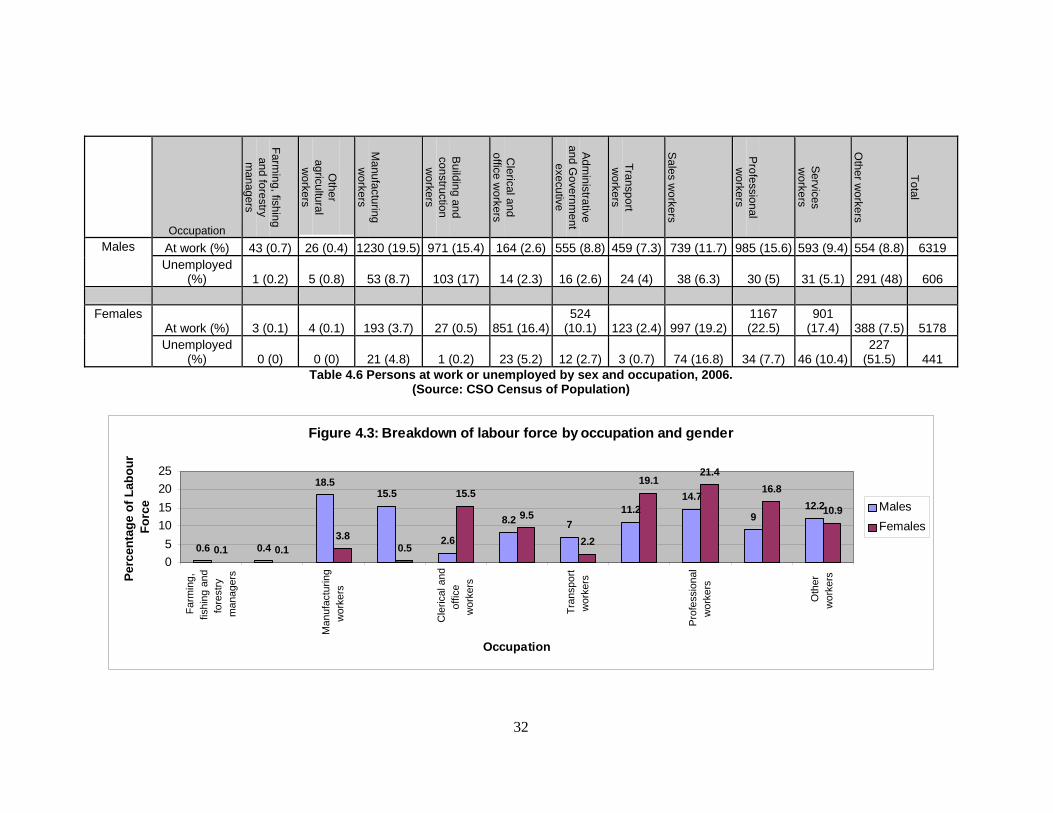
• There is a notable gender divide within sectors in Ennis. The divide in
Manufacturing, Building and Construction, and Transport favours males by 14.7%,
15% and 4.8% respectively.
• In contrast, the divide in Clerical, Sales, Professional and Services favour females by
12.9%, 7.9%, 6.7% and 7.8% respectively.
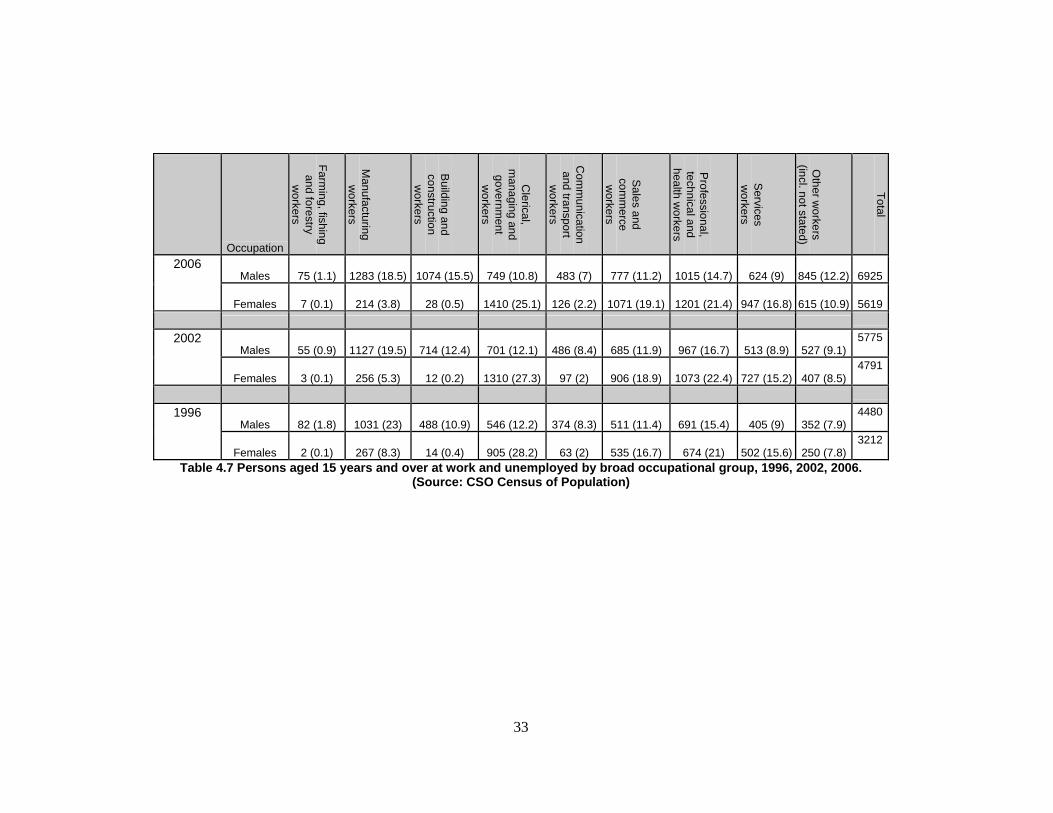
• Among the male labour force, the percentage of manufacturing workers, and clerical,
management and government workers has fallen over the last two census periods,
while the percentage of building and construction workers has increased over the
same period.
• There has been a 1.8% decrease in non-manual workers between 2002 and 2006,
while there has been a 1.4% increase in skilled manual workers during the same
period.
• For the 2000 – 2005 period, Clare had the lowest percentage increase for disposable
Income in the State. See Table 4.4.
29
Tables and Graphs for Economy
2006 2002 Principal Economic Status Male Female Total Total
Population 11918 12335 24253
% of Population aged 15 years and
over 22051
% of Population aged 15 years and
over Population aged 15 years and
over 9314 9821 19135100 17226 100
At work 6319 5178 11497 60.1 9709 56.4 Looking for first regular job 140 131 271 1.4 204 1.2 Unemployed having lost or
given up previous job 606 441 1047
5.5
857 5
Student 652 810 1462 7.6 1411 8.2 Looking after home/family 85 1773 1858 9.7 2152 12.5
Retired 1083 994 2077 10.8 1934 11.2 Unable to work due to permanent sickness or
disability 385 443 828
4.3
673
3.9
Other 44 51 95 0.5 286 1.7 Table 4.1 Persons aged 15 years and over by principal economic status and sex, 2006, 2002.
(Source: CSO Census of Population)
Figure 4.1: Socio-Economic Status of Population aged 15 and over
0 20 40 60 80
At work
Looking for first regular job
Unemployed having lost or given upprevious job
Student
Looking after home/family
Retired
Unable to work due to permanentsickness or disability
Other
Soci
o-Ec
onom
ic S
tatu
s
Percentage of Population
20022006
30
2002 2003 2004 2005 2006 2007 2008
All Ages 2226 2629 2446 2374 2523 2688 3629 Under 25 years 421 506 431 395 476 530 764
Total
Over 25 Years 1805 2123 2015 1979 2047 2158 2865 All Ages 1163 1324 1206 1182 1308 1399 2114
Under 25 years 240 285 232 196 272 309 473 Male
Over 25 Years 923 1039 974 986 1036 1090 1641 All Ages 1063 1305 1240 1192 1215 1289 1515
Under 25 years 181 221 199 199 204 221 291 Female
Over 25 Years 882 1084 1041 1041 1011 1068 1224 Table 4.2 Persons on the Live Register (Number) by Sex, Age Group and year.
(Source: CSO Data Dissemination Service)
Year Socio-economic
Group
Em
ployers and m
anagers
Higher
professional
Lower
professional
Non-m
anual
Manual skilled
Sem
i-skilled
Unskilled
Ow
n account w
orkers
Farmers
Agricultural w
orkers
All others
gainfully occupied and
unknown
2006 % of Population 16 6.7 12.4 19.6 11.9 8.4 4.1 4.2 0.5 0.2 16 2002 % of Population 15.2 5.9 12.9 21.4 10.5 8 4.2 3.6 0.9 0.2 17.2
Table 4.3 Population by socio-economic group of reference person, 2006, 2002. (Source: CSO Census of Population)
Year 2000 2001 2002 2003 2004 2005 Disposable Income (€) Clare 13426 14748 15813 16866 17459 18722
Mid-West 98.6 96.2 95.8 95.8 94.5 94.8 Disposable Income for Clare as a % of Disposable Income for: State 96 93.1 92.5 92.2 92.3 92.8
Table 4.4 Estimates of Disposable Income per person for Co. Clare, 2000 to 2005. (CSO Regional Accounts)
Figure 4.2: Disposable Income for Clare as a percentage of Disposable Income for the Mid-West and the State
98.6
96.2 95.8 95.894.5 94.8
96
93.1 92.5 92.2 92.3 92.8
88
90
92
94
96
98
100
2000 2001 2002 2003 2004 2005
Year
Perc
enta
ge o
f Dis
posa
ble
Inco
me
Mid-WestState
Year 2005 2006 % of Population 25.6 23.2
Table 4.5: Population at risk of poverty for Mid-West Region. (CSO EU SILC)

32
Occupation
Farming, fishing
and forestry m
anagers
O
ther agricultural
workers
Manufacturing
workers
Building and
construction w
orkers
Clerical and
office workers
Adm
inistrative and G
overnment
executive
Transport w
orkers
Sales w
orkers
Professional w
orkers
Services
workers
Other w
orkers
Total
At work (%) 43 (0.7) 26 (0.4) 1230 (19.5) 971 (15.4) 164 (2.6) 555 (8.8) 459 (7.3) 739 (11.7) 985 (15.6) 593 (9.4) 554 (8.8) 6319 Males Unemployed
(%) 1 (0.2) 5 (0.8) 53 (8.7) 103 (17) 14 (2.3) 16 (2.6) 24 (4) 38 (6.3) 30 (5) 31 (5.1) 291 (48) 606
At work (%) 3 (0.1) 4 (0.1) 193 (3.7) 27 (0.5) 851 (16.4)524
(10.1) 123 (2.4) 997 (19.2)1167 (22.5)
901 (17.4) 388 (7.5) 5178
Females
Unemployed (%) 0 (0) 0 (0) 21 (4.8) 1 (0.2) 23 (5.2) 12 (2.7) 3 (0.7) 74 (16.8) 34 (7.7) 46 (10.4)
227 (51.5) 441
Table 4.6 Persons at work or unemployed by sex and occupation, 2006. (Source: CSO Census of Population)
Figure 4.3: Breakdown of labour force by occupation and gender
0.6 0.4
18.515.5
2.6
8.2 711.2
14.7
912.2
0.1 0.13.8
0.5
15.5
9.5
2.2
19.121.4
16.8
10.9
05
10152025
Farm
ing,
fishi
ng a
ndfo
rest
rym
anag
ers
Man
ufac
turin
gw
orke
rs
Cle
rical
and
offic
ew
orke
rs
Tran
spor
tw
orke
rs
Pro
fess
iona
lw
orke
rs
Oth
erw
orke
rs
Occupation
Perc
enta
ge o
f Lab
our
Forc
e MalesFemales
33
Occupation
Farming, fishing
and forestry w
orkers
Manufacturing
workers
Building and
construction w
orkers
Clerical,
managing and
government
workers
Com
munication
and transport w
orkers
Sales and
comm
erce w
orkers
Professional,
technical and health w
orkers
Services
workers
Other w
orkers (incl. not stated)
Total
Males 75 (1.1) 1283 (18.5) 1074 (15.5) 749 (10.8) 483 (7) 777 (11.2) 1015 (14.7) 624 (9) 845 (12.2) 6925
2006
Females 7 (0.1) 214 (3.8) 28 (0.5) 1410 (25.1) 126 (2.2) 1071 (19.1) 1201 (21.4) 947 (16.8) 615 (10.9) 5619
Males 55 (0.9) 1127 (19.5) 714 (12.4) 701 (12.1) 486 (8.4) 685 (11.9) 967 (16.7) 513 (8.9) 527 (9.1)57752002
Females 3 (0.1) 256 (5.3) 12 (0.2) 1310 (27.3) 97 (2) 906 (18.9) 1073 (22.4) 727 (15.2) 407 (8.5)
4791
Males 82 (1.8) 1031 (23) 488 (10.9) 546 (12.2) 374 (8.3) 511 (11.4) 691 (15.4) 405 (9) 352 (7.9)44801996
Females 2 (0.1) 267 (8.3) 14 (0.4) 905 (28.2) 63 (2) 535 (16.7) 674 (21) 502 (15.6) 250 (7.8)
3212
Table 4.7 Persons aged 15 years and over at work and unemployed by broad occupational group, 1996, 2002, 2006. (Source: CSO Census of Population)
34
Figure 4.4: Change in female labour force from 1996 - 2006 by occupation
0.13.8
0.5
25.1
2.2
19.121.4
16.8
10.9
0.1
5.3
0.2
27.3
2
18.922.4
15.2
8.5
0.1
8.3
0.4
28.2
2
16.7
21
15.6
7.8
0
5
10
15
20
25
30
Farming, fishingand forestry workers
Manufacturingworkers
Building andconstruction
workers
Clerical, managingand government
workers
Communication andtransport workers
Sales and commerceworkers
Professional,technical and health
workers
Services workers Other workers (incl.not stated)
Occupation
Perc
enta
ge o
f Fem
ale
Labo
ur F
orce
200620021996
Figure 4.5: Change in male labour force from 1996 - 2006 by occupation
1.1
18.515.5
10.8
7
11.214.7
912.2
0.9
19.5
12.4 12.18.4
11.9
16.7
8.9 9.1
1.8
23
10.9 12.2
8.311.4
15.4
9 7.9
0
5
10
15
20
25
Farming, fishingand forestry
workers
Manufacturingworkers
Building andconstruction
workers
Clerical, managingand government
workers
Communicationand transport
workers
Sales andcommerce workers
Professional,technical and health
workers
Services workers Other workers (incl.not stated)
Occupation
Perc
enta
ge o
f Mal
e La
bour
Fo
rce 2006
20021996

36
5.0 Health
Temporal Trends
• The number of hospital discharges in Clare increased by 68% between 1999 and
2006.
• In 2005, the percentage of women giving birth aged 20-24 and 35-39 were 1.1% and
1.4% higher respectively in Munster than in Ennis, whereas the percentage aged 25-
29 and 30-34 were 1.4% and 0.9% higher in Ennis than in Munster.
• In 2006, the percentage of the population with a disability was 0.6% higher in Ennis
than for Clare, however, the percentage of unpaid carers was 0.8% lower in Ennis
than for Clare.
• It should be noted that not all persons with a disability require a carer, and many
carers are paid and so do not feature above.
NOTES
• Medical card status - contains data on the medical card status of discharges. 'No'
relates to those discharges that did not have a medical card. 'Yes' relates to those
discharges that did hold a medical card. 'Unknown' refers to discharges for which
medical card status was unknown.
• Public Private Status - refers to the public/private status of the patient on
discharge. This relates to whether the discharge saw the consultant publicly or
privately, and not to the type of bed occupied by the patient. Please note that this
parameter is determined on discharge, and therefore, the HIPE system does not
capture any changes in the public/private status of the patient during the period of
hospitalisation. Furthermore, the HIPE system does not distinguish how private
discharges funded their consultant care, which may be through either private health
insurance or directly out of their own pocket. For these reasons, caution should be
exercised in interpreting this variable.
• A principal diagnosis is defined as that condition established after study to be
chiefly responsible for occasioning admission to hospital for care.
37
Tables and Graphs for Health
Male Female Total Ennis 199 199 398 Clare 843 811 1654
Munster 8457 8110 16567 Table 5.1 Births in 2005
(Report on Vital Statistics 2005)
Age 1999 2000 2001 2002 2003 2004 2005 2006 00-09 Years 1,757 1,941 2,028 2,124 2,345 2,421 2,414 2,460 10-19 Years 1,427 1,277 1,505 1,322 1,387 1,594 1,497 1,440 20-29 Years 2,101 2,045 2,420 1,906 2,348 2,498 2,492 2,539 30-39 Years 2,402 2,299 2,758 2,546 3,110 3,522 3,576 3,914 40-49 Years 1,758 1,690 2,226 2,283 2,286 2,608 2,719 3,255 50-59 Years 1,902 1,914 2,750 2,772 3,174 3,325 3,412 3,980 60-69 Years 1,903 1,881 2,501 2,727 3,086 3,391 3,504 4,381 70-79 Years 2,117 1,837 2,700 2,896 3,007 3,190 3,354 3,814 80-89 Years 1,232 878 1,521 1,547 1,736 1,914 1,913 2,054
90 Years and over 132 90 158 159 203 241 279 275 Total 16,731 15,852 20,567 20,282 22,682 24,704 25,160 28,112
Discharge Status 1 Public 11,137 9,923 13,009 12,784 14,357 15,668 16,073 18,675 2 Private 5,594 5,929 7,558 7,498 8,325 9,036 9,087 9,437
Total 16,731 15,852 20,567 20,282 22,682 24,704 25,160 28,112 GMS Status
0 No 9,409 9,507 11,343 10,353 11,695 12,872 13,442 14,317 1 Yes 7,173 6,157 9,079 9,503 10,357 11,128 11,582 13,587
2 Unknown 149 188 145 426 630 704 136 208 Total 16,731 15,852 20,567 20,282 22,682 24,704 25,160 28,112
Table 5.2 Total number of Discharges resident in Co. Clare by Age, Discharge Status and GMS Status, 1999-2006 (HIPE Data)
Figure 5.1: Total Number of Discharges resident in Co. Clare
16,731 15,852
20,567 20,28222,682
24,704 25,16028,112
0
5,000
10,000
15,000
20,000
25,000
30,000
1999 2000 2001 2002 2003 2004 2005 2006
Year
Num
ber o
f Dis
char
ges
Total Discharges
38
Area Total Under 20 20-24 25-29 30-34 35-39 40-44 45 & over Not stated
Ennis (%) 398 13 (3.3) 43 (10.8) 94 (23.6) 146 (36.7) 82 (20.6) 18 (4.5) 1 (0.2) 1 (0.2) Clare (%) 1654 57 (3.4) 153 (9.2) 355 (21.5) 637 (38.5) 360 (21.8) 89 (5.4) 1 (0.1) 2 (0.1) Munster
(%) 16567 611 (3.7) 1976
(11.9) 3687 (22.2)
5927 (35.8)
3651 (22) 670 (4) 18 (0.1) 27 (0.2)
Table 5.3 Births by age at maternity in 2005 (Report on Vital Statistics 2005)
All Under 1
Under 5
5-9
10-14
15-19
20-24
25-29
30-34
35-39
40-44
45-49
50-54
55-59
60-64
65-69
70-74
75-79
80-84
85+
Male 64 - - - - 1 2 1 1 1 3 1 2 4 4 9 4 12 7 12 Female 62 1 1 1 - 1 - 1 1 - - 3 1 1 3 3 5 6 12 23
Table 5.4: Deaths occurring in 2005 in Ennis classified by sex and age
Total Persons
Total persons with a
disability
Total persons with a
disability as a % of
Total persons
Blindness, deafness,
or a severe vision or hearing im
pairment
A condition that
substantially limits
one or more basic
physical activities
Difficulty in learning, rem
embering or
concentrating
Difficulty in dressing, bathing or getting around inside the
home
Difficulty in going
outside the home
alone
Difficulty in w
orking or
attending school/ college
Learning or intellectual disability
Psychological or
emotional condition
Difficulty in
participating in other activities
Other, including
chronic illness
Total disabilities
Clare
110950 9923
8.9 1846 4562 2973 2350 3121 3641 1752 1566 3552 3531 28894 Ennis 24253 2313 9.5 451 1054 753 610 813 961 436 547 933 915 7473
Table 5.5 Population classed by disability. (Source: CSO Census of Population)
Unpaid Help
Total persons
Total carers
1-14 hours a week
15-28 hours a
week
29-42 hours a
week
43 or more hours a
week
Carers as a % of total persons
Clare 2002 80403 4110 2393 444 205 1068 5.1 Clare 2006 86977 4507 2704 488 248 1067 5.2 Ennis 2002 17226 754 462 97 31 164 4.4 Ennis 2006 19135 834 507 83 46 198 4.4
Table 5.6 Carers aged 15 years and over classified by number of hours per week of unpaid help provided 2002 and 2006. (Source: CSO Census of Population)
39
6.0 Lifestyle
Temporal Trends
• Ennis was designated as an Information Age town in 1997. At that time a special
offer on Personal Computers was given to all households in the area. By 1999, PCs
had been installed for a nominal fee in 75% of the town's 5,500 homes (The
Examiner, Tuesday, June 8th, 1999).
• PC ownership increased by 25.2% between 1999-2006. However, the number of
households increased by 57.9% during this time.
• PC ownership in Ennis is 5.6% above the figure for the Mid-West.
• Of all households in Ennis (those with and without PC’s), only 21.2% have
broadband. However, of those households with PC’s, 35.6% are connected to
broadband.
• The percentage of the population involved in a voluntary activity is 0.9% lower in
Ennis than for the county average.
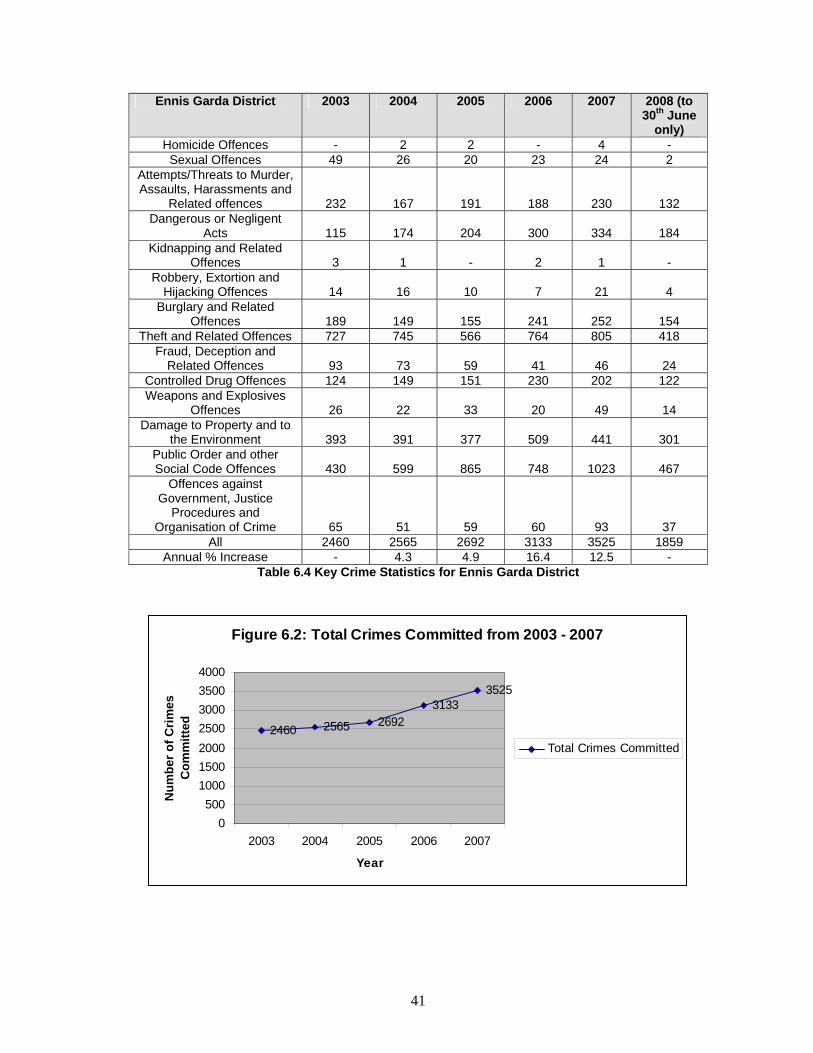
• The percentage of overall crime in Ennis increased substantially between 2005 and
2006, and again between 2006 and 2007 (16.4% and 12.5% respectively).
Notes
• Crime Statistics are based on the Irish Crime Classification System (ICCS), details of
which can be found in the Crime section on www.cso.ie but excluding elements of
Group 4 (Dangerous or Negligent Acts), and all of Groups 14 (Road and Traffic
Offences (Not Elsewhere Classified)) and 16 (Offences Not Elsewhere Classified).
40
Tables and Graphs for Lifestyle
Area Home PC Yes No Not stated Total Ennis 5165 (59.5) 3330 (38.3) 190 (2.2) 8685 Clare
21700 (57)15556 (40.9) 770 (2) 38026
Mid-West 67292 (53.9)
55059 (44.1) 2497 (2) 124848
State
No. of Households (%)
828356 (56.6)
599417 (41) 34523 (2.4) 1462296
Table 6.1 Number of households with a personal computer, 2006. (Source: CSO Census of Population)
Figure 6.1: Percentage of households by PC ownership
59.5
38.3
2.2
57
40.9
2
53.944.1
2
56.6
41
2.40
1020
3040
5060
70
Yes No Not stated
Ownership Status
Perc
enta
ge o
f Hou
seho
lds
Ennis
Clare
Mid-West
State
Internet Access BroadbandOther
connectionNo internet
access Not stated Total
householdsNo. of Households (%) 1838 (21.2) 2197 (25.3) 4073 (46.9) 577 (6.6) 8685
Table 6.2 Number of households with Internet access by type of access, 2006. (Source: CSO Census of Population)
Total
Helping or
voluntary work
with a social or charitable
organisation
Helping or
voluntary work
with a religious
group or church
Helping or
voluntary work
with a sporting organisation
Helping or
voluntary work
with a political or
cultural organisation
Any other
voluntary activity
Total persons involved in one or
more voluntary
activity
Persons not
involved in voluntary w
ork (incl. not stated)
Clare 86977 5417 4296 5801 1402 4048 16217 70760 Ennis 19135 1189 928 1104 250 802 3388 15747
Table 6.3 Persons classed by Voluntary Activity in Clare and Ennis, 2006. (Source: CSO Census of Population)
41
Table 6.4 Key Crime Statistics for Ennis Garda District
Figure 6.2: Total Crimes Committed from 2003 - 2007
2460 2565 26923133
3525
0500
1000150020002500300035004000
2003 2004 2005 2006 2007
Year
Num
ber o
f Crim
es
Com
mitt
ed
Total Crimes Committed
Ennis Garda District 2003 2004 2005 2006 2007 2008 (to 30th June
only) Homicide Offences - 2 2 - 4 - Sexual Offences 49 26 20 23 24 2
Attempts/Threats to Murder, Assaults, Harassments and
Related offences 232 167 191 188 230 132 Dangerous or Negligent
Acts 115 174 204 300 334 184 Kidnapping and Related
Offences 3 1 - 2 1 - Robbery, Extortion and
Hijacking Offences 14 16 10 7 21 4 Burglary and Related
Offences 189 149 155 241 252 154 Theft and Related Offences 727 745 566 764 805 418
Fraud, Deception and Related Offences 93 73 59 41 46 24
Controlled Drug Offences 124 149 151 230 202 122 Weapons and Explosives
Offences 26 22 33 20 49 14 Damage to Property and to
the Environment 393 391 377 509 441 301 Public Order and other Social Code Offences 430 599 865 748 1023 467
Offences against Government, Justice
Procedures and Organisation of Crime 65 51 59 60 93 37
All 2460 2565 2692 3133 3525 1859 Annual % Increase - 4.3 4.9 16.4 12.5 -
42
7.0 Transport and Travel
Temporal Trends
• Table 7.3 indicates that there is a minimum of 11008 cars in Ennis, however only
7245 (65.8%) are used for work/ school/ college purposes.
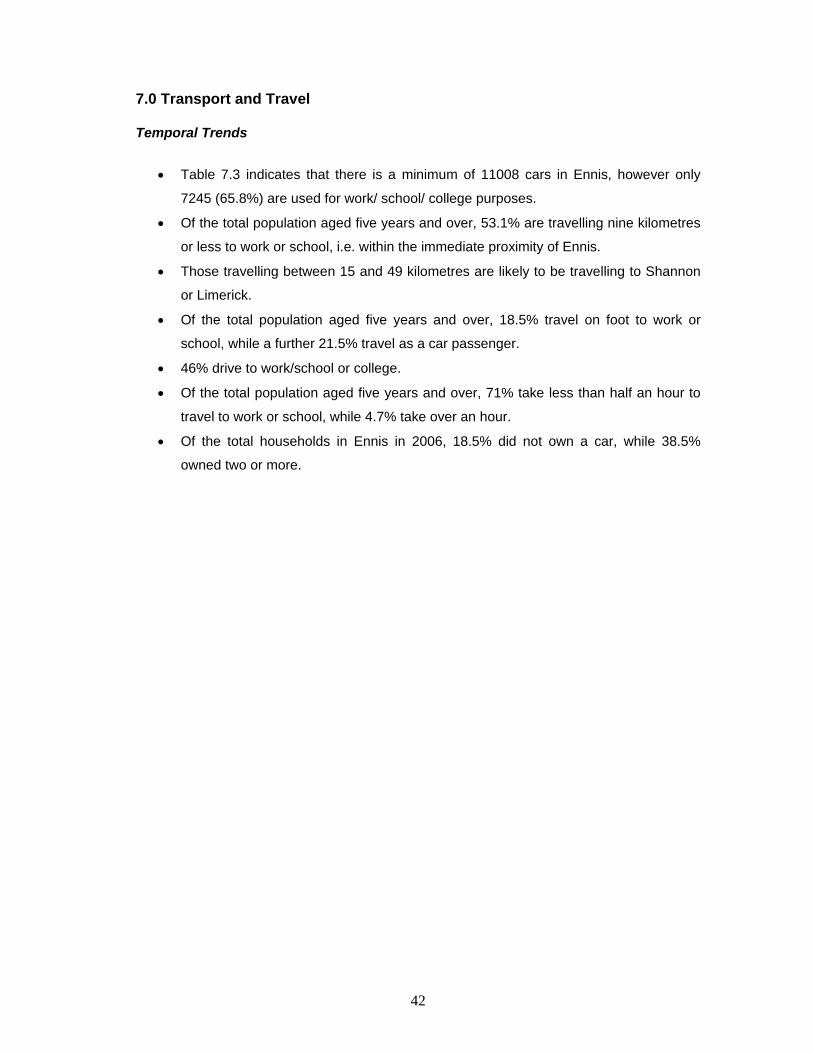
• Of the total population aged five years and over, 53.1% are travelling nine kilometres
or less to work or school, i.e. within the immediate proximity of Ennis.
• Those travelling between 15 and 49 kilometres are likely to be travelling to Shannon
or Limerick.
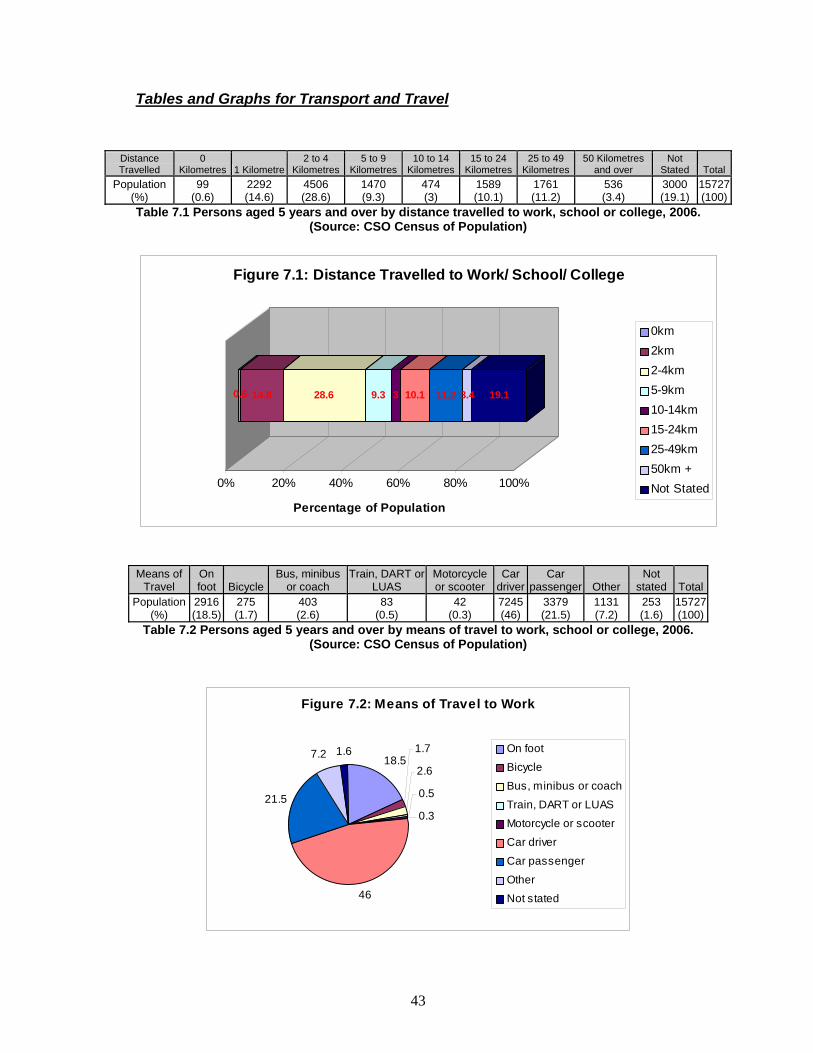
• Of the total population aged five years and over, 18.5% travel on foot to work or
school, while a further 21.5% travel as a car passenger.
• 46% drive to work/school or college.
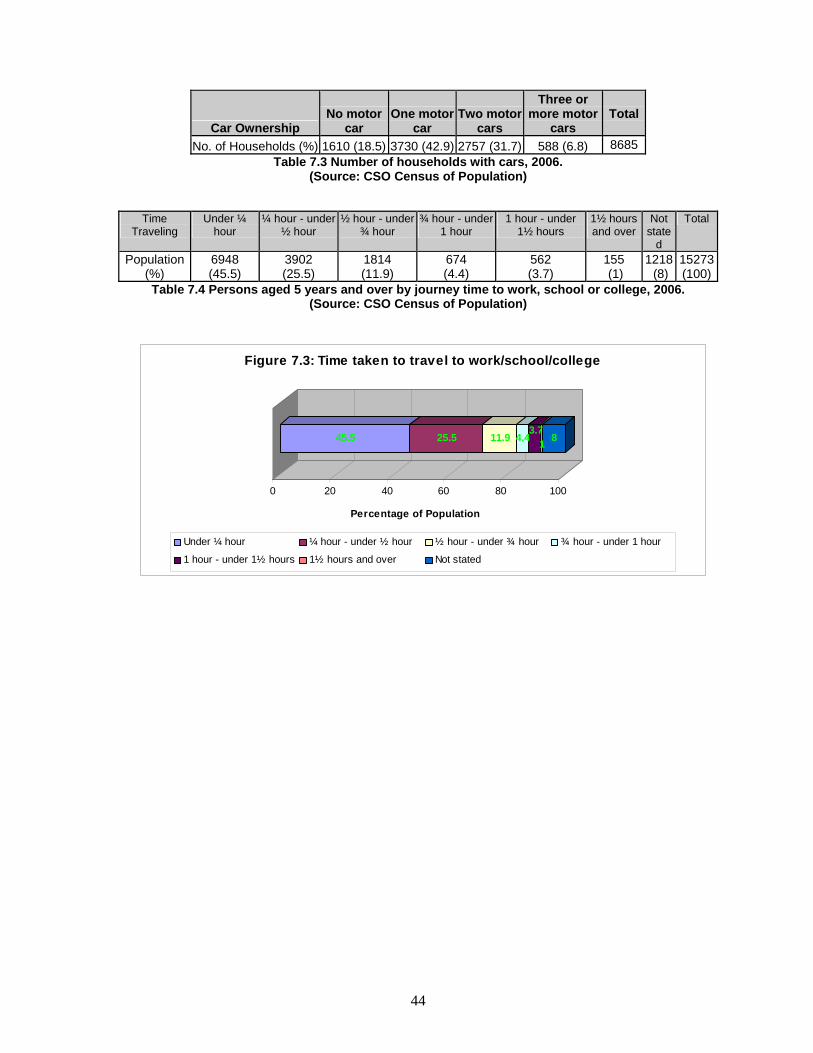
• Of the total population aged five years and over, 71% take less than half an hour to
travel to work or school, while 4.7% take over an hour.
• Of the total households in Ennis in 2006, 18.5% did not own a car, while 38.5%
owned two or more.
43
Tables and Graphs for Transport and Travel
Distance Travelled
0 Kilometres 1 Kilometre
2 to 4 Kilometres
5 to 9 Kilometres
10 to 14 Kilometres
15 to 24 Kilometres
25 to 49 Kilometres
50 Kilometres and over
Not Stated Total
Population (%)
99 (0.6)
2292 (14.6)
4506 (28.6)
1470 (9.3)
474 (3)
1589 (10.1)
1761 (11.2)
536 (3.4)
3000 (19.1)
15727(100)
Table 7.1 Persons aged 5 years and over by distance travelled to work, school or college, 2006. (Source: CSO Census of Population)
0.6 14.6 28.6 9.3 3 10.1 11.2 3.4 19.1
0% 20% 40% 60% 80% 100%
Percentage of Population
Figure 7.1: Distance Travelled to Work/ School/ College
0km2km2-4km5-9km10-14km15-24km25-49km50km +Not Stated
Means of Travel
On foot Bicycle
Bus, minibus or coach
Train, DART or LUAS
Motorcycle or scooter
Car driver
Car passenger Other
Not stated Total
Population (%)
2916 (18.5)
275 (1.7)
403 (2.6)
83 (0.5)
42 (0.3)
7245 (46)
3379 (21.5)
1131 (7.2)
253 (1.6)
15727(100)
Table 7.2 Persons aged 5 years and over by means of travel to work, school or college, 2006. (Source: CSO Census of Population)
Figure 7.2: Means of Travel to Work
18.51.7
2.6
0.5
0.3
46
21.5
7.2 1.6 On foot
Bicycle
Bus, minibus or coach
Train, DART or LUAS
Motorcycle or scooter
Car driver
Car passenger
Other
Not stated
44
Car Ownership No motor
car One motor
car Two motor
cars
Three or more motor
cars
Total
No. of Households (%) 1610 (18.5) 3730 (42.9) 2757 (31.7) 588 (6.8) 8685 Table 7.3 Number of households with cars, 2006.
(Source: CSO Census of Population)
Time
Traveling Under ¼
hour ¼ hour - under
½ hour ½ hour - under
¾ hour ¾ hour - under
1 hour 1 hour - under
1½ hours 1½ hours and over
Not state
d
Total
Population (%)
6948 (45.5)
3902 (25.5)
1814 (11.9)
674 (4.4)
562 (3.7)
155 (1)
1218 (8)
15273(100)
Table 7.4 Persons aged 5 years and over by journey time to work, school or college, 2006. (Source: CSO Census of Population)
45.5 25.5 11.9 4.43.7
1 8
0 20 40 60 80 100
Percentage of Population
Figure 7.3: Time taken to travel to work/school/college
Under ¼ hour ¼ hour - under ½ hour ½ hour - under ¾ hour ¾ hour - under 1 hour
1 hour - under 1½ hours 1½ hours and over Not stated
45
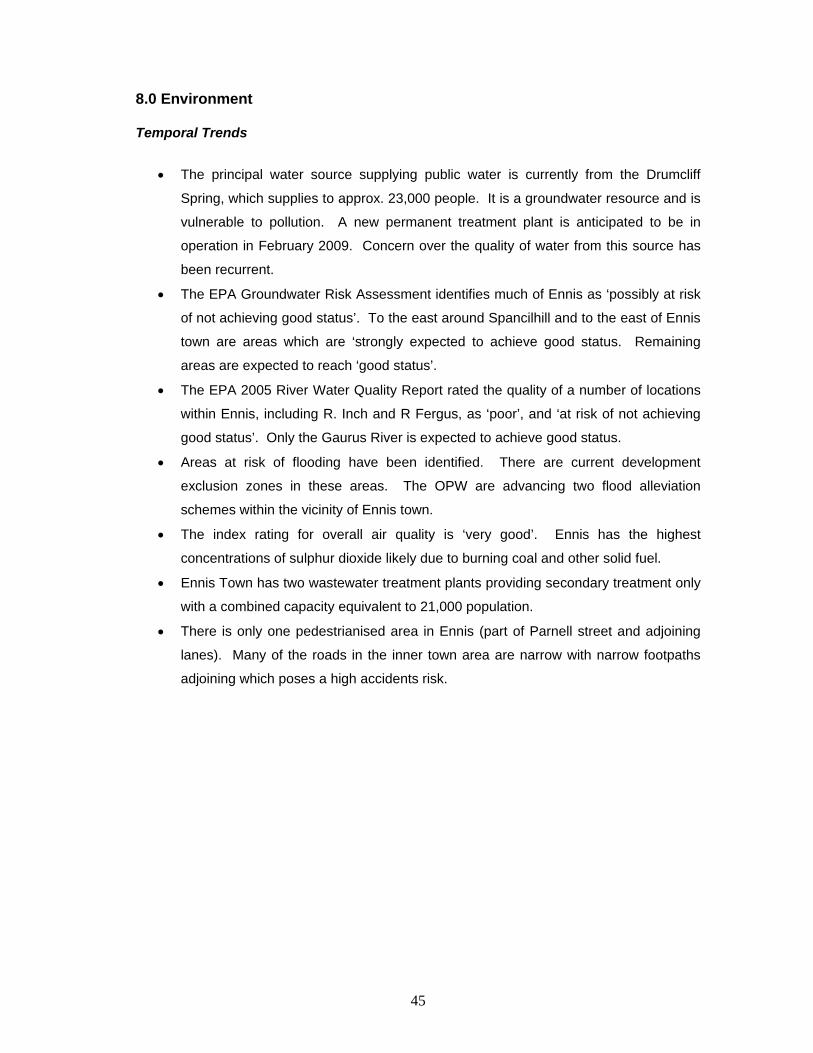
8.0 Environment
Temporal Trends
• The principal water source supplying public water is currently from the Drumcliff
Spring, which supplies to approx. 23,000 people. It is a groundwater resource and is
vulnerable to pollution. A new permanent treatment plant is anticipated to be in
operation in February 2009. Concern over the quality of water from this source has
been recurrent.
• The EPA Groundwater Risk Assessment identifies much of Ennis as ‘possibly at risk
of not achieving good status’. To the east around Spancilhill and to the east of Ennis
town are areas which are ‘strongly expected to achieve good status. Remaining
areas are expected to reach ‘good status’.
• The EPA 2005 River Water Quality Report rated the quality of a number of locations
within Ennis, including R. Inch and R Fergus, as ‘poor’, and ‘at risk of not achieving
good status’. Only the Gaurus River is expected to achieve good status.
• Areas at risk of flooding have been identified. There are current development
exclusion zones in these areas. The OPW are advancing two flood alleviation
schemes within the vicinity of Ennis town.
• The index rating for overall air quality is ‘very good’. Ennis has the highest
concentrations of sulphur dioxide likely due to burning coal and other solid fuel.
• Ennis Town has two wastewater treatment plants providing secondary treatment only
with a combined capacity equivalent to 21,000 population.
• There is only one pedestrianised area in Ennis (part of Parnell street and adjoining
lanes). Many of the roads in the inner town area are narrow with narrow footpaths
adjoining which poses a high accidents risk.
46
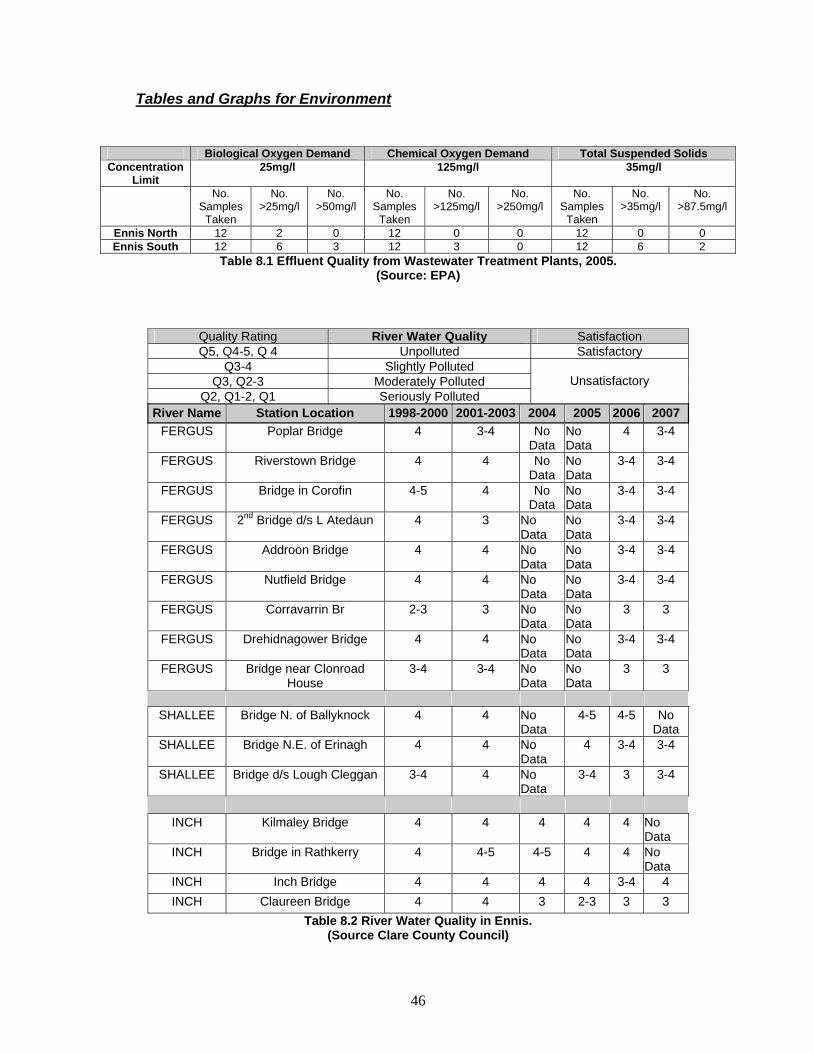
Tables and Graphs for Environment
Table 8.1 Effluent Quality from Wastewater Treatment Plants, 2005. (Source: EPA)
Quality Rating River Water Quality Satisfaction Q5, Q4-5, Q 4 Unpolluted Satisfactory
Q3-4 Slightly Polluted Q3, Q2-3 Moderately Polluted
Q2, Q1-2, Q1 Seriously Polluted
Unsatisfactory
River Name Station Location 1998-2000 2001-2003 2004 2005 2006 2007 FERGUS Poplar Bridge 4 3-4 No
Data No Data
4 3-4
FERGUS Riverstown Bridge 4 4 No Data
No Data
3-4 3-4
FERGUS Bridge in Corofin 4-5 4 No Data
No Data
3-4 3-4
FERGUS 2nd Bridge d/s L Atedaun 4 3 No Data
No Data
3-4 3-4
FERGUS Addroon Bridge 4 4 No Data
No Data
3-4 3-4
FERGUS Nutfield Bridge 4 4 No Data
No Data
3-4 3-4
FERGUS Corravarrin Br 2-3 3 No Data
No Data
3 3
FERGUS Drehidnagower Bridge 4 4 No Data
No Data
3-4 3-4
FERGUS Bridge near Clonroad House
3-4 3-4 No Data
No Data
3 3
SHALLEE Bridge N. of Ballyknock 4 4 No
Data 4-5 4-5 No
Data SHALLEE Bridge N.E. of Erinagh 4 4 No
Data 4 3-4 3-4
SHALLEE Bridge d/s Lough Cleggan 3-4 4 No Data
3-4 3 3-4
INCH Kilmaley Bridge 4 4 4 4 4 No
Data INCH Bridge in Rathkerry 4 4-5 4-5 4 4 No
Data INCH Inch Bridge 4 4 4 4 3-4 4 INCH Claureen Bridge 4 4 3 2-3 3 3
Table 8.2 River Water Quality in Ennis. (Source Clare County Council)
Biological Oxygen Demand Chemical Oxygen Demand Total Suspended Solids Concentration
Limit 25mg/l 125mg/l 35mg/l
No. Samples Taken
No. >25mg/l
No. >50mg/l
No. Samples
Taken
No. >125mg/l
No. >250mg/l
No. Samples Taken
No. >35mg/l
No. >87.5mg/l
Ennis North 12 2 0 12 0 0 12 0 0 Ennis South 12 6 3 12 3 0 12 6 2
47
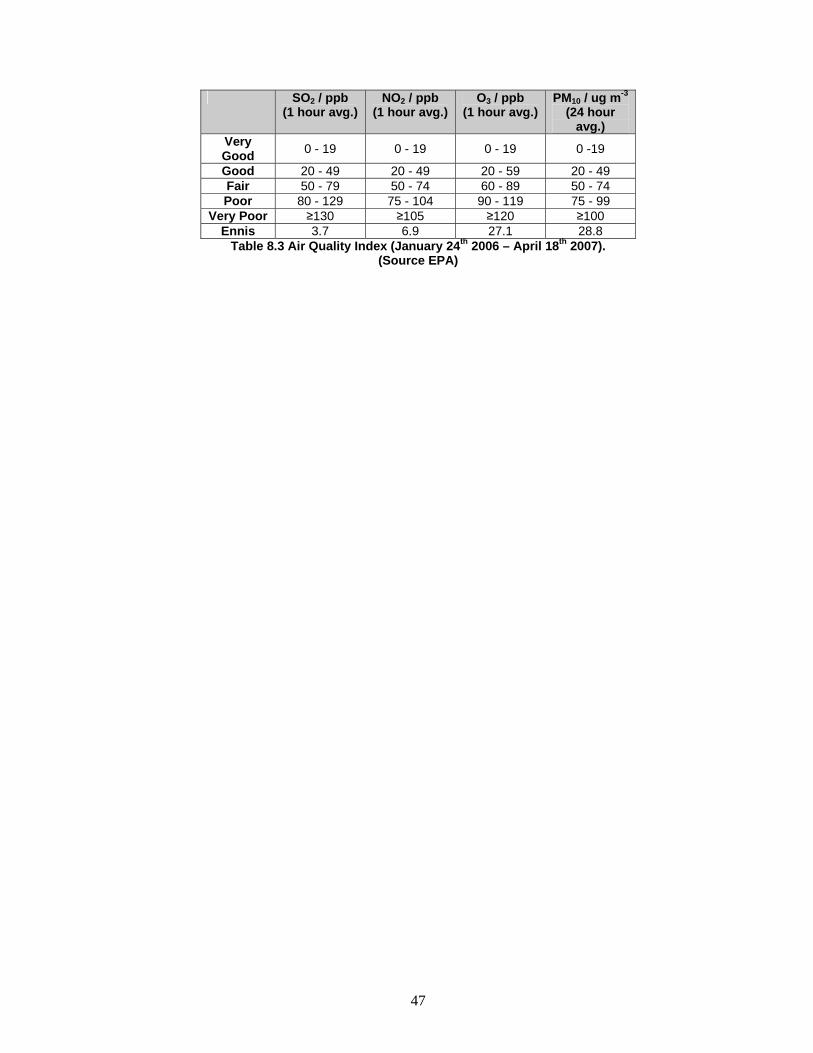
SO2 / ppb (1 hour avg.)
NO2 / ppb (1 hour avg.)
O3 / ppb (1 hour avg.)
PM10 / ug m-3 (24 hour
avg.) Very Good 0 - 19 0 - 19 0 - 19 0 -19
Good 20 - 49 20 - 49 20 - 59 20 - 49 Fair 50 - 79 50 - 74 60 - 89 50 - 74 Poor 80 - 129 75 - 104 90 - 119 75 - 99
Very Poor ≥130 ≥105 ≥120 ≥100 Ennis 3.7 6.9 27.1 28.8
Table 8.3 Air Quality Index (January 24th 2006 – April 18th 2007). (Source EPA)
48
Lessons from Ireland’s Hub Towns A. Tralee/ Killarney (Kerry Hub Development Strategy 2007)
The NSS 2002-2020 designated Tralee and Killarney as a linked hub, providing a spatial
framework for balanced regional development. Tralee exerts influence over the surrounding
environs and its hub status asserts its importance at regional level. To this end, Kerry Local
Authorities adopted the Kerry Hub Development Strategy in 2007. The key themes of the
Hub Strategy are:
1. The concept of an urban network
2. Creativity and economic generation
3. Community involvement
4. Culture
5. Tourism attractions
6. Lifestyle choice and unique quality of life3
The principles of the Hub Strategy and sustainable development will therefore inform all
objectives, policies, decisions and actions of the Council for the period of the Plan. Achieving
a more sustainable and appealing environment involves making the best use of scarce
resources, including land, while designing a more attractive, energy efficient, healthier and
less polluting built environment which is in harmony with the natural environment and which
provides user friendly patterns of activity.
The Tralee/Killarney Local Area Plan recognises the importance of branding and marketing
as a tool to develop Tralee/Killarney as a vibrant hub to live, work and invest in. It states that
“house buyers, businesses, tourists, residents and visitors all have a choice on where to go
and how to spend their money. People are looking for places that offer something different,
something rewarding – usually a mix of tangible attributes (such as location, environment,
architecture and people) and intangible, emotional attributes (culture, diversity, reputation
and heritage). Every place has its own mix – it’s the role of the brand to define its
individuality.’
A number of steps are being undertaken to develop a brand including:
1. Consultation (engage)
2. Public Relations (mobilize)
3. Regional and National Advertising (get noticed)
4. PR and precision marketing (influence)
5. Sustained activity (continued delivery)
49
The marketing concept will need to focus on the following elements:
1. The product: The Linked Hub – promoting growth, development and synergy
between the two towns; promoting the Kerry Hub as a vibrant and exciting place to
live, work and play.
2. The customer: The inhabitants of both towns; businesses for inward investment; the
younger mobile population within Ireland and Europe; international tourists.
3. How is the product going to appeal to the customer? Quality of life issues;
technologically advanced and skilled; outstanding scenic landscapes; amenities at its
doorstep; strong sense of history and identity; culturally distinctive and creative.
4. How is the marketing campaign going to be delivered? Regional, National and
International Advertising, through partners, billboards and hoardings on key
development sites around the towns and at Kerry Airport, etc.
5. How is the product going to be delivered? Through key investments in
infrastructure (EU, state and local funding; through inward investment; developed
high quality tourism products; high value business and employment; public realm
improvements; developed amenities; etc.
B. How Mallow Hub Town is Positioning Itself (Presentation delivered at the National Planning Conference 2008 (see Appendices) Steps being followed in developing a sustainable marketing strategy for Mallow include:
1. Identifying the key employment growth areas both, indigenous and FDI
2. Identifying the key conditions/requirements to attract investment in growth areas
3. Identifying potential targets/sectors
4. Establishing data on skills profile
5. Encouraging landowners and developers
6. Developing the material and strategy
Future options include:
1. Website development with input from agencies such as IDA
2. Hub conference
50
C. Wexford at the Hub: reaching its full potential Conference held at the The Talbot Hotel, Wexford, February 17th.
In order to explore and capitalise on the hub designation of Wexford town under the NSS, a
conference was held in 2006 entitled Wexford at the Hub: reaching its full potential (championed by Wexford Borough Council and Wexford Chamber of Commerce). Speakers
included a Senior Planning Adviser with the Spatial Planning Section and Heritage and
Planning Division of the Department of the Environment Heritage and Local Government, a
Senior Architect with the Office of Public Works and local business representatives,
entrepreneurs and other key stakeholders. Delegates at the conference opened by Minister
Dick Roche T.D. heard details of over €300m worth of development either underway or
planned for Wexford town.
The Wexford County Development Board website contains a section entitled “Marketing
Wexford” which examines Wexford town from the perspective of:
1. Employment Structure and Economic Climate
2. Telecommunications
3. Road, Rail and Ports
4. Industrial Sites, Buildings and Premises
D. Kilkenny Integrated Area Plan Information about the Kilkenny hub is provided through:
1. Local Newspaper
2. Kilkenny County Council Website
3. RAPID Kilkenny Website
4. RAPID Community Newsletter
E. Cavan Cavan Town Council produced a marketing brochure titled Cavan Town: an established
location which colorfully and succinctly captures all of the town’s key assets and attractions
including details of accessibility, housing, education, health, sport facilities, nightlife, and
places to shop. The brochure can be downloaded at http://www.cavantc.ie/cavan-
estlocation.pdf and is also contained in the Appendices of this document.
F. Castlebar/ Ballina: Continued development of festivals such as the Blues festival and Walking festival to
promote area as a tourist destination.
51
E. Other Areas: Drumshanbo Although Drumshanbo in Leitrim is not a hub town under the NSS, much work has been
done to market and promote the town as an attractive place to visit, live and work and some
of the tools employed could be used by other towns wishing to raise their profile and
enhance their livability factor.
Work to date includes:
1. Website launched.
2. Local Notes in Newspaper.
3. Town Cleanup/ Makeover.
4. Business Directory.
5. Market Survey (What’s currently unavailable in the town?).
6. Concurrent enterprise programme run with Leitrim County Council.
7. Enterprise Park.
8. Signage in main car park to request fair use of spaces.
9. Harvest Feast.
It is anticipated that the marketing programme aimed at ‘Marketing Drumshanbo: bringing
Leitrim to life’ will focus on a range of key initiatives and actions such as:
1. Devise a ‘‘Reach Out to Your Neighbor’’ campaign.
2. Public Meeting to be held for inhabitants in the area.
- Identify 3-5 people living abroad that are interested in moving back to the area
- Build up a database of expatriates by skill set and area of expertise
(Chefs/Marketers/Accountants whatever it may be).
- Draft suitable press coverage to highlight campaign in International newspapers
emphasizing those services and amenities that are particularly needed (restaurateur,
- IT skills, retail owners of drapery, shoes, beauty treatment etc).
- Set up email account to illicit pool of ideas based on skill sets of interested parties.
- Identify top 10 individuals with appropriate skill sets who are ready to move back
and/or fund setting up a business in the town.
- Create a brochure.
Plan of Action 1. Devise a ‘‘Why Relocate to Drumshanbo’’ campaign.
2. Set up meetings between relevant watchdog organisations and members of
Drumshanbo Business Forum to include.
- Western Development Commission – Move West Campaign.
52
- Arigna Leader, Leitrim County Enterprise Board, Leitrim County Council, Enterprise
Ireland etc – identify potential new business prospects.
- Identify 3 ways to leverage campaign with these organizations based on their existing
efforts to attract people to the West.
- Draft suitable press coverage highlighting Drumshanbo as an ideal business hub for
start up and migration of existing businesses.
Plan of Action 1. Devise a ‘‘Why start up a business in Drumshanbo’’ Campaign.
2. Organize an ‘‘Entrepreneurs Wanted Forum’’ to attract interest within the community
and from surrounding areas.
- Meeting to specifically target potential entrepreneurs.
- Participation from Arigna LEADER, LCEB and Momentum Consulting on funding
available and sources of support for small business start ups.
- Draft suitable local press coverage to highlight Entrepreneurial initiative for
Drumshanbo.
- Encourage representation from Drumshanbo Enterprise Centre, Food Hub and
Lough Allen Hotel.
- Identify 5 high potential start up entrepreneurs to maximize available commercial
space in the town.
- Identify a set off rolling activity-based themes in conjunction with the Lough Allen
Hotel, Lough Allen Activity Centre etc.
- Identify themes for festivals with a view to implementing 1-2 key festivals a year.