Embed Size (px)
Citation preview
Journal of Adolescence 2002, 25, 261–274doi:10.1006/yjado.469, available online at http://www.idealibrary.com on
Quality of life in young people: ratings and factorstructure of the Quality of Life Profile—Adolescent Version
ROGER BRADFORD, DONNA L. RUTHERFORD AND ALEXANDRA JOHN
The purpose of the study was to provide British data relating to the 54-item Quality ofLife Profile Adolescent Version (QOLPAV; Raphael et al., 1996, Journal of AdolescentHealth, 19, 366–375) and to explore the underlying factor structure of thequestionnaire. The relationship between demographic variables (such as socialeconomic status, gender and ethnicity) and quality of life (QOL) were investigated.Eight hundred and ninety-nine young people aged 12–16 were recruited fromsecondary schools in the south of England to participate in the study. Factor analysishighlighted eight dimensions embedded within the scale, which were largely consistentwith the QOL model proposed by Raphael et al. (1996, Journal of Adolescent Health,19, 366–375). A notable exception concerned items from the subdomain of ‘‘spiritualbeing’’, which did not cluster together but dispersed across multiple factors. Exclusionof complex items and those with low loadings on subdomains resulted in a briefer scaleconsisting of 32 items. Of the demographic variables examined, only age wassignificantly associated with quality of life scores.
r 2002 The Association for Professionals in Services for Adolescents.
Published by Elsevier Science Ltd. All rights reserved
Introduction
The term quality of life (QOL) has become widespread in recent years (Spieth and Harris,1996), notwithstanding the fact there is no universally agreed definition as to what actuallyQOL constitutes.
Within the child and adolescent sphere, several measures of QOL have been developedwith the aim of assessing the impact of chronic physical illness on the child patient. Broadly,two approaches have been taken, either to assess the impact of a specific condition such asdiabetes (Ingersoll and Marrero, 1990), epilepsy (Chaplin, 1997), depression ( Endicott et al.,1993; Walker et al., 1995), cancer (Bradlyn et al., 1993; Goodwin et al., 1994) and asthma(Christie et al., 1993; Bender, 1996); or to take a more generic, so-called ‘‘non-categorical’’(Stein and Jesop, 1982) approach by studying the effects of chronic conditions as a whole(Eisen et al., 1979; Starfield et al., 1993; Collier and MacKinlay, 1997; Graham et al., 1997).
These measures have much to recommend them in allowing the child or young person witha chronic illness to give their views concerning their own QOL. However, such measures aredesigned to assess the impact of illness on the individual and, therefore, their use with aphysically well population is limited. An alternative, although far less developed approach tostudying QOL issues in childhood, is to adopt what has been termed a ‘‘person-centred’’approach (Murrell et al., 1999). Under this paradigm, the starting point is the experience ofthe individual, their subjective interpretation of events and the meaning they attribute tothese. In other words, QOL is defined as ‘‘How good is your life for you’’ (Raphael et al., 1996).Such a definition is consistent with the approach adopted by the World Health OrganisationQuality of Life (WHOQOL) Group (1998) who have defined QOL as an ‘‘individual’s
Reprint requests and correspondence should be addressed to Dr Roger Bradford, Leigh House Hospital, AlresfordRoad, Winchester, Hampshire SO21 1HA, U.K. (E-mail: [email protected]).
0140-1971/02/$35�00+0�00 # 2002 The Association for Professionals in Services for Adolescents.Published by Elsevier Science Ltd. All rights reserved
262 R. Bradford et al.
perceptions of their position in life in the context of the culture and value systems in whichthey live and in relation to their goals, expectations, standards and concerns’’.
The advantage of this approach is that it allows QOL of both ill and healthy groups to bestudied and raises the possibility of highlighting developmental as well as environmentalinfluences on QOL, by for example exploring what aspects of QOL are considered importantat different ages and what impact socioeconomic status has on QOL scores. Whilst thepotential advantages of this method appear manifold, surprisingly there are few studies thathave adopted this approach. Eiser et al. (1994), for example, assessed children’s views of whatconstitutes QOL using a qualitative approach and established that the important featuresidentified by a sample of 68 adolescents with a mean age of 13?2 years were the quality ofrelationships with family and friends, physical health, material possessions, physicalappearance and task performance. A literature review identified only two measures whichtake as the prime focus a non-pathological, person-centred approach to assessing QOL;namely the Raphael et al. (1996) Quality of Life Profile Adolescent Version (QOLPAV) andthe Generic Child Quality of Life Measure (GCQ; Collier and MacKinlay, 1997).
The GCQ was developed through interviewing children aged 6, 11 and 13 resulting in afinal pool of 25 items. The scale involves participants indicating on a five-point scale, firstlythe extent to which each statement applies to them and secondly what their ideal scorewould be. QOL is derived from the discrepancy between these ‘‘perceived self’’ and‘‘preferred self’’ scores. The psychometric properties of the scale have yet to be determined,and no factor analysis has been reported.
The QOLPAV was developed through a combination of interviews with groups ofadolescents and guidance counsellors, with participants being asked what the term quality oflife meant to them and what areas of concerns were relevant to this age group. In addition,items were added by the authors from specific theoretical models, including identitydevelopment (Erikson, 1968), developmental tasks (Havighurst, 1953) and socialization(Elder, 1980). Combining these various sources of information resulted in a 54-itemquestionnaire. Raphael et al. (1996) have published some preliminary data concerning thequestionnaire’s reliability and validity, as well as normative data relating to 160 Canadianyoung people, aged between 14 and 20 years. The psychometric properties suggest that themeasure has good internal reliability (Cronbach alpha 40?80) and that it is valid in so far as itcorrelated with other measures of self-esteem, life satisfaction, social support and life chances.
In reviewing these two measures, it was apparent that the QOLPAV was further developedthan the GCQ and had a clearer theoretical basis. Notwithstanding this, it was equallyevident that the applicability of the QOLPAV to a non-Canadian population had yet to beestablished and the underlying factor structure of the measure investigated. The aim of thisstudy was, therefore, to provide more extensive data on young people’s views of their QOLand to carry out a factor analysis on responses. Data relating QOL scores to demographicvariables were also gathered to clarify the extent to which QOL was affected by age, social–economic status, gender and ethnicity.
Design
ParticipantsEight hundred and ninety-nine children aged 12–16 were recruited to take part in the study.Five schools in the Basingstoke, Southampton and Eastleigh areas were approached and
Quality of life in young people 263
asked to take part in an investigation concerning children’s perceptions of their quality of life.All schools agreed, resulting in the participation of four comprehensives and one school fromthe independent sector.
ProcedureTeachers were provided with copies of the QOLPAV (Raphael et al., 1996). This was thendisseminated to the students by staff during a class on personal and social education. Pupilswere informed that participation in the study was voluntary and asked to complete thequestionnaire anonymously. Brief written instructions on the method of completion wereprovided.
QuestionnairesParticipants were asked to complete a Demographic Information Sheet in addition to theQOLPAV (Raphael et al., 1996). The information sheet, specifically designed for the study,asked for data relating to age, gender, ethnicity, family structure and size as well as parentaloccupation.
The QOLPAV is a 54-item self-report questionnaire which has been used to assess QOL inyoung people aged 14–20. Participants are asked to rate statements on a five-point anchoredLikert scale (ranging from ‘‘not at all’’ to ‘‘extremely’’) for both individual importance (‘‘howimportant is this to me in my life?’’) and satisfaction (‘‘how satisfied am I with this part of mylife?’’). Raphael et al. (1996) organized the 54 items equally into three primary domains ofbeing, belonging and becoming. These are further divided into nine subdomains, eachcontaining six items.
Being refers to ‘‘who one is’’ and covers three areas: physical, psychological and spiritual.Physical being concerns physical health, sexuality, nutrition, exercise, grooming, clothing andgeneral physical appearance; psychological being relates to adjustment, cognitions, feelingsand evaluations concerning the self including self-esteem and self-concept; spiritual beingrefers to the individual’s personal values and personal standards of conduct as well as spiritualbeliefs.
Belonging concerns the individual’s connections with their environment, with three areasassessed; physical, social and community. Physical belonging describes connections with thephysical environments of home, neighbourhood, school and community. Social belongingincludes links with the social environments and acceptance by intimate others, family,friends, co-workers, neighbourhood or community. Community belonging concerns access toand involvement in health and social services, education, employment, recreationalprogrammes and community events and activities.
Becoming refers to achieving personal goals, hopes and aspirations. Three areas areassessed; practical, leisure and growth. Practical becoming concerns domestic activities, paidwork, school or volunteer activities and attending to health needs. Leisure becomingincludes activities carried out for enjoyment that promote relaxation and stress reduction.Growth becoming relates to the maintenance or improvement of knowledge and skills andadapting to change.
The measure also contains a further 18 items relating to perceived control over andopportunities for improvement in these areas. These are also scored on a five-point anchoredLikert scale. Whilst these measures do not play a part in the computation of QOL scores,they provide information by which QOL can be interpreted.
264 R. Bradford et al.
For the purposes of this investigation, the first item of the QOLPAV (‘‘Being safe aboutsex’’) was excluded as, following discussion with staff at the participating schools, it wasconsidered inappropriate to include this item for the younger adolescents.
Coding and scoring of the measuresThe socioeconomic status (SES) of participants was determined on the basis of parentaloccupation, which was coded in accordance with the classification system described by theOffice for National Statistics (1996).
The QOLPAV was scored according to the criteria specified by Raphael et al. (1996).Quality of life scores are derived on the basis of (Importance/3)� (Satisfaction 3). Thismethod of scoring allows for weighting of items, with a possible range of 3?33 (‘‘ExtremelyImportant’’, ‘‘No Satisfaction At All’’) to +3?33 (‘‘Extremely Important’’, ‘‘ExtremelySatisfied’’). The perceived control and opportunities scales are scored by summing responsesto the Likert scale and deriving a mean score on the basis of the number of items to whichthe participants responded.
AnalysisThe demographic data gathered was compared to British population norms using chi-square,and then related to QOL scores using independent samples t-tests and analysis of variance(ANOVA). The obtained means for each domain and subdomain were compared to thosereported by Raphael et al. (1996) using one-sample t-tests. Internal reliability of the measurewas assessed using Cronbach’s alpha. QOL scores were analysed using exploratory factoranalysis with oblique (direct oblimin) rotation.
Results
Participant characteristicsThe sample consisted of 481 boys and 414 girls (four respondents failed to indicate theirgender), aged from 12 to 16, with a mean age of 14?04 years (S.D.=1?30). The distribution ofgender by age is summarized in Table 1.
Along with age, gender, ethnicity distribution, family structure and occupational status ofparents were also examined. Only two participants failed to indicate their ethnic origin, while125 (14%) did not indicate paternal occupation and 75 (8%) did not indicate maternaloccupation. To obtain a clearer picture of family background, respondents were also asked toindicate how many siblings they had (6% of the participants had no siblings), whether theywere part of a single-parent family, and whether they had a stepparent. Single-parent familieswere those where the child lived with one parent, who was either single, widowed ordivorced. This data was compared with British population norms, the results of which aresummarized in Table 2.
The data gathered from the present sample was compared with the published norms of theBritish General Household Survey (Office for National Statistics, 1996) using chi-square.These analyses revealed that the participants in this study were representative in terms oftheir gender distribution, number of single-parent families and ethnic background, butdiffered in parental occupation (there was a preponderance of parents with a professionaloccupation) and aspects of family structure. There were significantly more children with astepparent than expected (po0?05) and the mean number of children per family was 2?8
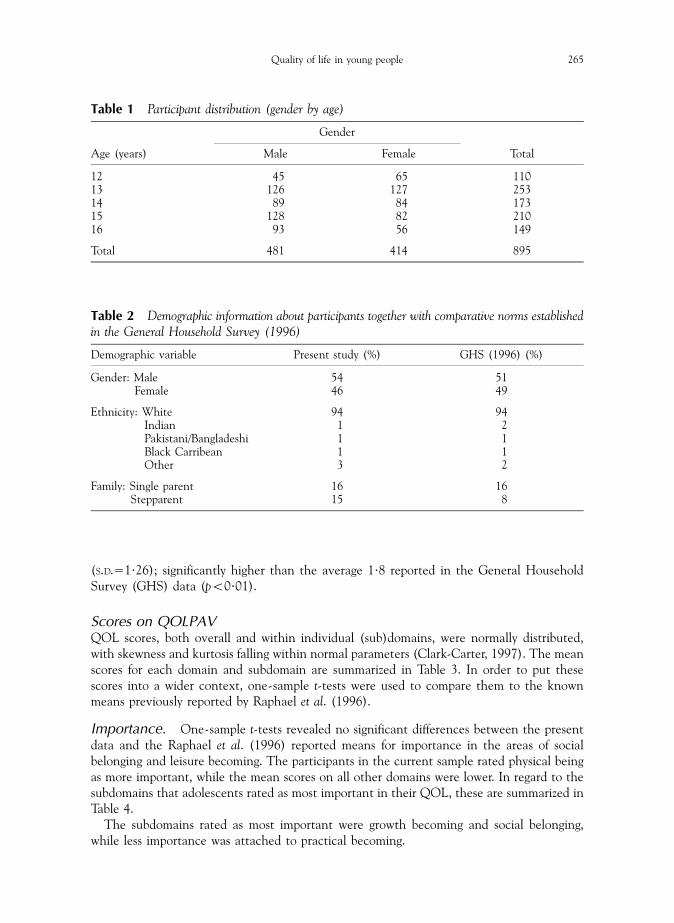
Table 1 Participant distribution (gender by age)
Gender
Age (years) Male Female Total
12 45 65 11013 126 127 25314 89 84 17315 128 82 21016 93 56 149
Total 481 414 895
Table 2 Demographic information about participants together with comparative norms establishedin the General Household Survey (1996)
Demographic variable Present study (%) GHS (1996) (%)
Gender: Male 54 51Female 46 49
Ethnicity: White 94 94Indian 1 2Pakistani/Bangladeshi 1 1Black Carribean 1 1Other 3 2
Family: Single parent 16 16Stepparent 15 8
Quality of life in young people 265
(S.D.=1?26); significantly higher than the average 1?8 reported in the General HouseholdSurvey (GHS) data (po0?01).
Scores on QOLPAVQOL scores, both overall and within individual (sub)domains, were normally distributed,with skewness and kurtosis falling within normal parameters (Clark-Carter, 1997). The meanscores for each domain and subdomain are summarized in Table 3. In order to put thesescores into a wider context, one-sample t-tests were used to compare them to the knownmeans previously reported by Raphael et al. (1996).
Importance. One-sample t-tests revealed no significant differences between the presentdata and the Raphael et al. (1996) reported means for importance in the areas of socialbelonging and leisure becoming. The participants in the current sample rated physical beingas more important, while the mean scores on all other domains were lower. In regard to thesubdomains that adolescents rated as most important in their QOL, these are summarized inTable 4.
The subdomains rated as most important were growth becoming and social belonging,while less importance was attached to practical becoming.
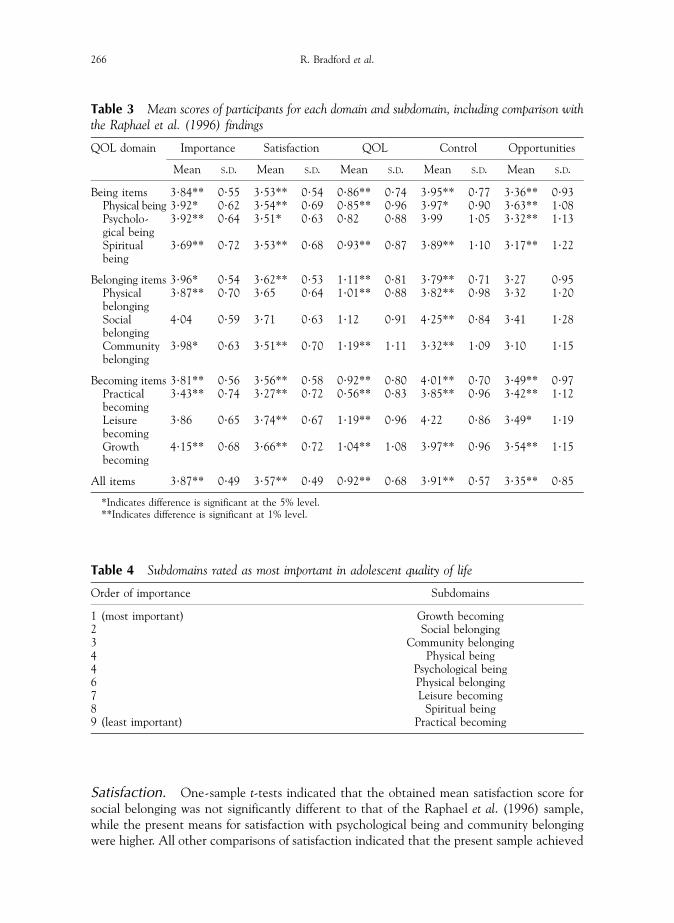
Table 3 Mean scores of participants for each domain and subdomain, including comparison withthe Raphael et al. (1996) findings
QOL domain Importance Satisfaction QOL Control Opportunities
Mean S.D. Mean S.D. Mean S.D. Mean S.D. Mean S.D.
Being items 3?84** 0?55 3?53** 0?54 0?86** 0?74 3?95** 0?77 3?36** 0?93Physical being 3?92* 0?62 3?54** 0?69 0?85** 0?96 3?97* 0?90 3?63** 1?08Psycholo-gical being
3?92** 0?64 3?51* 0?63 0?82 0?88 3?99 1?05 3?32** 1?13
Spiritualbeing
3?69** 0?72 3?53** 0?68 0?93** 0?87 3?89** 1?10 3?17** 1?22
Belonging items 3?96* 0?54 3?62** 0?53 1?11** 0?81 3?79** 0?71 3?27 0?95Physicalbelonging
3?87** 0?70 3?65 0?64 1?01** 0?88 3?82** 0?98 3?32 1?20
Socialbelonging
4?04 0?59 3?71 0?63 1?12 0?91 4?25** 0?84 3?41 1?28
Communitybelonging
3?98* 0?63 3?51** 0?70 1?19** 1?11 3?32** 1?09 3?10 1?15
Becoming items 3?81** 0?56 3?56** 0?58 0?92** 0?80 4?01** 0?70 3?49** 0?97Practicalbecoming
3?43** 0?74 3?27** 0?72 0?56** 0?83 3?85** 0?96 3?42** 1?12
Leisurebecoming
3?86 0?65 3?74** 0?67 1?19** 0?96 4?22 0?86 3?49* 1?19
Growthbecoming
4?15** 0?68 3?66** 0?72 1?04** 1?08 3?97** 0?96 3?54** 1?15
All items 3?87** 0?49 3?57** 0?49 0?92** 0?68 3?91** 0?57 3?35** 0?85
*Indicates difference is significant at the 5% level.**Indicates difference is significant at 1% level.
Table 4 Subdomains rated as most important in adolescent quality of life
Order of importance Subdomains
1 (most important) Growth becoming2 Social belonging3 Community belonging4 Physical being4 Psychological being6 Physical belonging7 Leisure becoming8 Spiritual being9 (least important) Practical becoming
266 R. Bradford et al.
Satisfaction. One-sample t-tests indicated that the obtained mean satisfaction score forsocial belonging was not significantly different to that of the Raphael et al. (1996) sample,while the present means for satisfaction with psychological being and community belongingwere higher. All other comparisons of satisfaction indicated that the present sample achieved
Quality of life in young people 267
lower mean ratings. Participants reported being most satisfied with the areas of leisurebecoming and social belonging, and least satisfied with practical becoming.
QOL. One-sample t-tests indicated that the mean QOL scores of this study did not differsignificantly from those of Raphael et al. (1996) in the areas of psychological being and socialbelonging. Differences were found for all the belonging items, particularly the subdomains ofphysical and community belonging, where the current participants scored significantly higherin comparison to the Raphael et al. (1996) sample. In contrast, scores for physical being,spiritual being, practical, leisure and growth becoming were significantly lower for the Britishparticipants. Overall, the areas in which quality of life was rated as highest were leisurebecoming, community belonging and social belonging.
Control. There were no significant differences between the two studies for adolescents’perceived control over psychological being and leisure becoming. The young people in thepresent investigation perceived themselves to have greater control over communitybelonging than those who participated in the Raphael et al. (1996) study. In all othercomparisons, the means were significantly lower for the British population. Participantsperceived themselves to have most control over social belonging and leisure becoming, andleast control over community belonging.
Opportunities. Examination of the mean scores in this area indicated that British youngpeople perceive the same opportunities in regard to physical, social and community belongingas their Canadian counterparts. The comparisons in all other domains revealed thatsignificantly lower means were achieved by the British sample. They considered that theyhad most opportunities for improvement in the areas of physical being and growth becoming,and least opportunities in community belonging.
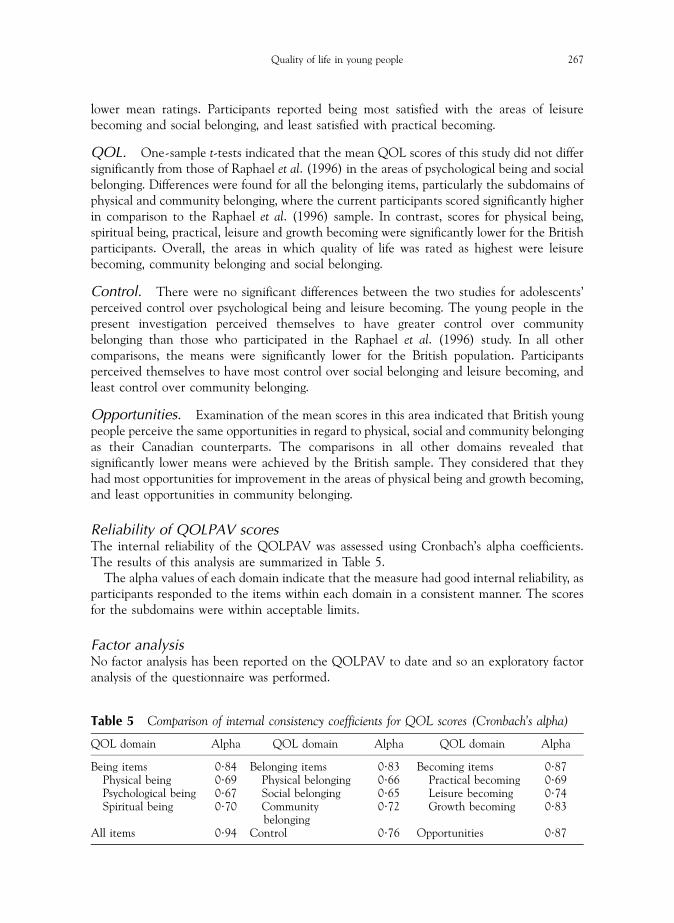
Reliability of QOLPAV scoresThe internal reliability of the QOLPAV was assessed using Cronbach’s alpha coefficients.The results of this analysis are summarized in Table 5.
The alpha values of each domain indicate that the measure had good internal reliability, asparticipants responded to the items within each domain in a consistent manner. The scoresfor the subdomains were within acceptable limits.
Factor analysisNo factor analysis has been reported on the QOLPAV to date and so an exploratory factoranalysis of the questionnaire was performed.
Table 5 Comparison of internal consistency coefficients for QOL scores (Cronbach’s alpha)
QOL domain Alpha QOL domain Alpha QOL domain Alpha
Being items 0?84 Belonging items 0?83 Becoming items 0?87Physical being 0?69 Physical belonging 0?66 Practical becoming 0?69Psychological being 0?67 Social belonging 0?65 Leisure becoming 0?74Spiritual being 0?70 Community
belonging0?72 Growth becoming 0?83
All items 0?94 Control 0?76 Opportunities 0?87
268 R. Bradford et al.
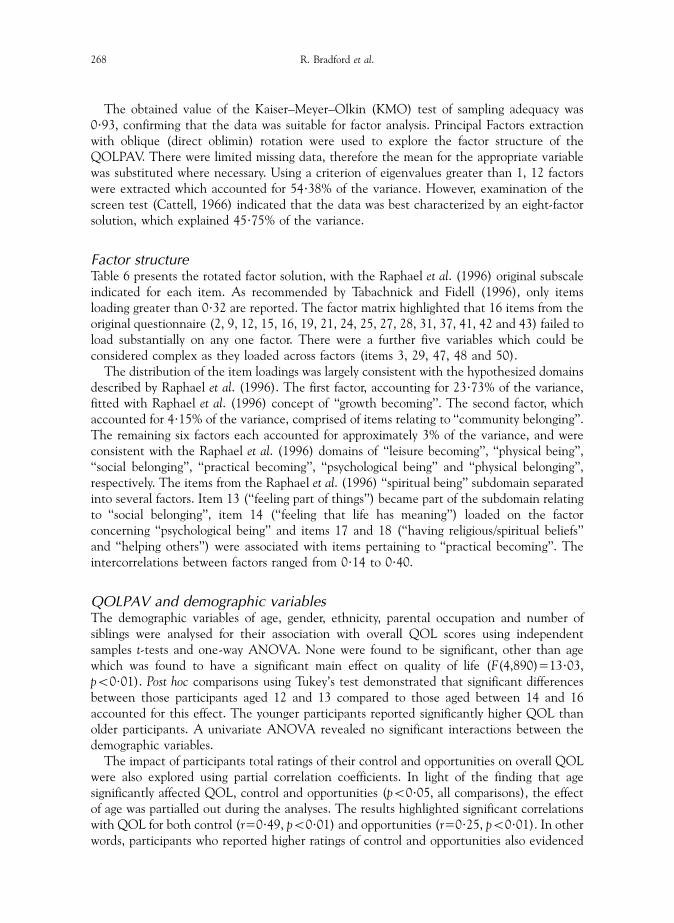
The obtained value of the Kaiser–Meyer–Olkin (KMO) test of sampling adequacy was0?93, confirming that the data was suitable for factor analysis. Principal Factors extractionwith oblique (direct oblimin) rotation were used to explore the factor structure of theQOLPAV. There were limited missing data, therefore the mean for the appropriate variablewas substituted where necessary. Using a criterion of eigenvalues greater than 1, 12 factorswere extracted which accounted for 54?38% of the variance. However, examination of thescreen test (Cattell, 1966) indicated that the data was best characterized by an eight-factorsolution, which explained 45?75% of the variance.
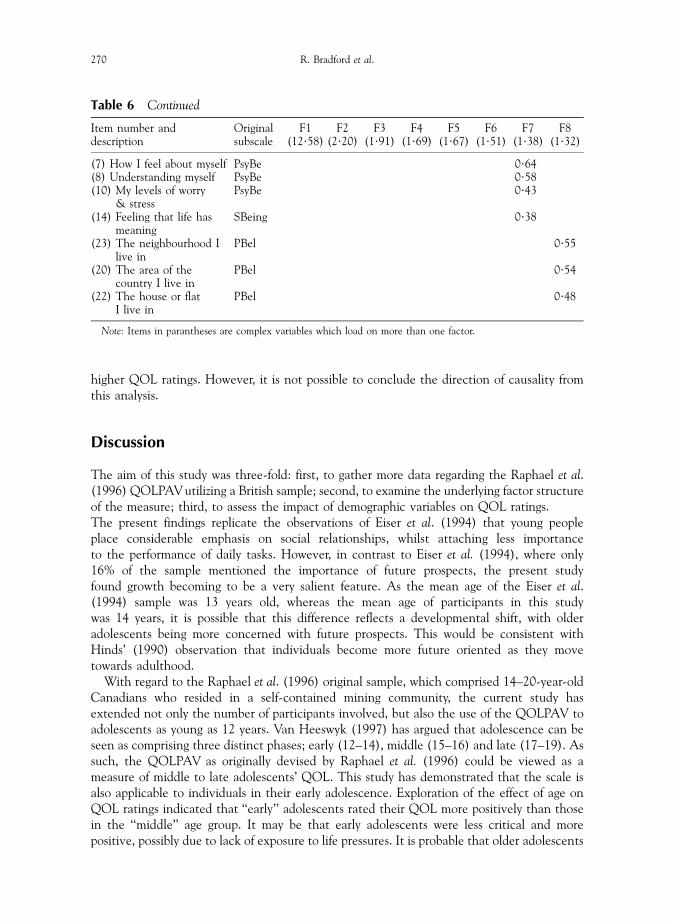
Factor structureTable 6 presents the rotated factor solution, with the Raphael et al. (1996) original subscaleindicated for each item. As recommended by Tabachnick and Fidell (1996), only itemsloading greater than 0?32 are reported. The factor matrix highlighted that 16 items from theoriginal questionnaire (2, 9, 12, 15, 16, 19, 21, 24, 25, 27, 28, 31, 37, 41, 42 and 43) failed toload substantially on any one factor. There were a further five variables which could beconsidered complex as they loaded across factors (items 3, 29, 47, 48 and 50).
The distribution of the item loadings was largely consistent with the hypothesized domainsdescribed by Raphael et al. (1996). The first factor, accounting for 23?73% of the variance,fitted with Raphael et al. (1996) concept of ‘‘growth becoming’’. The second factor, whichaccounted for 4?15% of the variance, comprised of items relating to ‘‘community belonging’’.The remaining six factors each accounted for approximately 3% of the variance, and wereconsistent with the Raphael et al. (1996) domains of ‘‘leisure becoming’’, ‘‘physical being’’,‘‘social belonging’’, ‘‘practical becoming’’, ‘‘psychological being’’ and ‘‘physical belonging’’,respectively. The items from the Raphael et al. (1996) ‘‘spiritual being’’ subdomain separatedinto several factors. Item 13 (‘‘feeling part of things’’) became part of the subdomain relatingto ‘‘social belonging’’, item 14 (‘‘feeling that life has meaning’’) loaded on the factorconcerning ‘‘psychological being’’ and items 17 and 18 (‘‘having religious/spiritual beliefs’’and ‘‘helping others’’) were associated with items pertaining to ‘‘practical becoming’’. Theintercorrelations between factors ranged from 0?14 to 0?40.
QOLPAV and demographic variablesThe demographic variables of age, gender, ethnicity, parental occupation and number ofsiblings were analysed for their association with overall QOL scores using independentsamples t-tests and one-way ANOVA. None were found to be significant, other than agewhich was found to have a significant main effect on quality of life (F(4,890)=13?03,po0?01). Post hoc comparisons using Tukey’s test demonstrated that significant differencesbetween those participants aged 12 and 13 compared to those aged between 14 and 16accounted for this effect. The younger participants reported significantly higher QOL thanolder participants. A univariate ANOVA revealed no significant interactions between thedemographic variables.
The impact of participants total ratings of their control and opportunities on overall QOLwere also explored using partial correlation coefficients. In light of the finding that agesignificantly affected QOL, control and opportunities (po0?05, all comparisons), the effectof age was partialled out during the analyses. The results highlighted significant correlationswith QOL for both control (r=0?49, po0?01) and opportunities (r=0?25, po0?01). In otherwords, participants who reported higher ratings of control and opportunities also evidenced
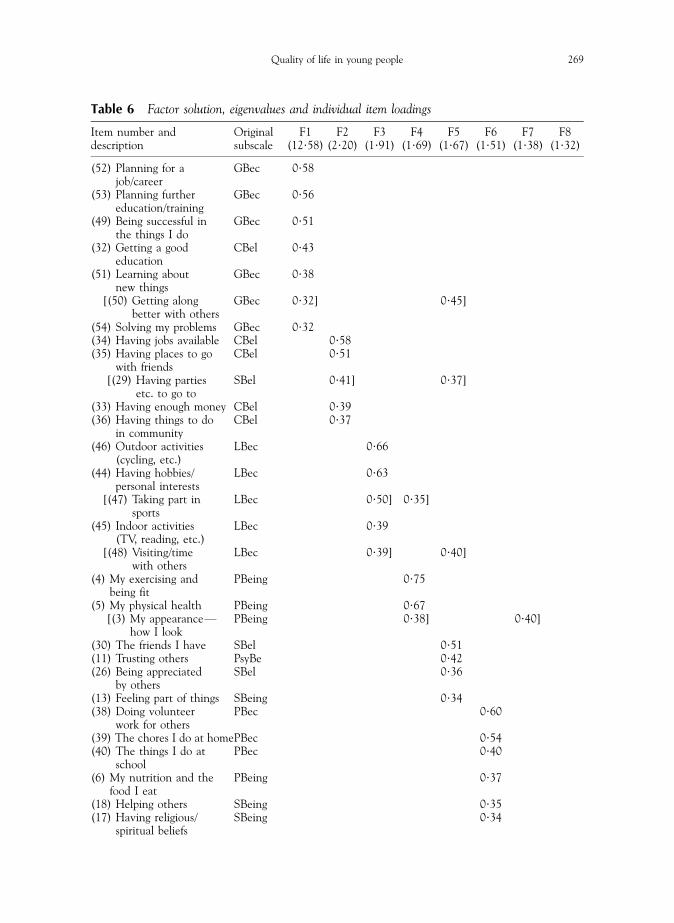
Table 6 Factor solution, eigenvalues and individual item loadings
Item number anddescription
Originalsubscale
F1(12?58)
F2(2?20)
F3(1?91)
F4(1?69)
F5(1?67)
F6(1?51)
F7(1?38)
F8(1?32)
(52) Planning for ajob/career
GBec 0?58
(53) Planning furthereducation/training
GBec 0?56
(49) Being successful inthe things I do
GBec 0?51
(32) Getting a goodeducation
CBel 0?43
(51) Learning aboutnew things
GBec 0?38
[(50) Getting alongbetter with others
GBec 0?32] 0?45]
(54) Solving my problems GBec 0?32(34) Having jobs available CBel 0?58(35) Having places to go
with friendsCBel 0?51
[(29) Having partiesetc. to go to
SBel 0?41] 0?37]
(33) Having enough money CBel 0?39(36) Having things to do
in communityCBel 0?37
(46) Outdoor activities(cycling, etc.)
LBec 0?66
(44) Having hobbies/personal interests
LBec 0?63
[(47) Taking part insports
LBec 0?50] 0?35]
(45) Indoor activities(TV, reading, etc.)
LBec 0?39
[(48) Visiting/timewith others
LBec 0?39] 0?40]
(4) My exercising andbeing fit
PBeing 0?75
(5) My physical health PBeing 0?67[(3) My appearanceF
how I lookPBeing 0?38] 0?40]
(30) The friends I have SBel 0?51(11) Trusting others PsyBe 0?42(26) Being appreciated
by othersSBel 0?36
(13) Feeling part of things SBeing 0?34(38) Doing volunteer
work for othersPBec 0?60
(39) The chores I do at homePBec 0?54(40) The things I do at
schoolPBec 0?40
(6) My nutrition and thefood I eat
PBeing 0?37
(18) Helping others SBeing 0?35(17) Having religious/
spiritual beliefsSBeing 0?34
Quality of life in young people 269
(7) How I feel about myself PsyBe 0?64(8) Understanding myself PsyBe 0?58(10) My levels of worry
& stressPsyBe 0?43
(14) Feeling that life hasmeaning
SBeing 0?38
(23) The neighbourhood Ilive in
PBel 0?55
(20) The area of thecountry I live in
PBel 0?54
(22) The house or flatI live in
PBel 0?48
Note: Items in parantheses are complex variables which load on more than one factor.
Table 6 Continued
Item number anddescription
Originalsubscale
F1(12?58)
F2(2?20)
F3(1?91)
F4(1?69)
F5(1?67)
F6(1?51)
F7(1?38)
F8(1?32)
270 R. Bradford et al.
higher QOL ratings. However, it is not possible to conclude the direction of causality fromthis analysis.
Discussion
The aim of this study was three-fold: first, to gather more data regarding the Raphael et al.(1996) QOLPAV utilizing a British sample; second, to examine the underlying factor structureof the measure; third, to assess the impact of demographic variables on QOL ratings.The present findings replicate the observations of Eiser et al. (1994) that young peopleplace considerable emphasis on social relationships, whilst attaching less importanceto the performance of daily tasks. However, in contrast to Eiser et al. (1994), where only16% of the sample mentioned the importance of future prospects, the present studyfound growth becoming to be a very salient feature. As the mean age of the Eiser et al.(1994) sample was 13 years old, whereas the mean age of participants in this studywas 14 years, it is possible that this difference reflects a developmental shift, with olderadolescents being more concerned with future prospects. This would be consistent withHinds’ (1990) observation that individuals become more future oriented as they movetowards adulthood.
With regard to the Raphael et al. (1996) original sample, which comprised 14–20-year-oldCanadians who resided in a self-contained mining community, the current study hasextended not only the number of participants involved, but also the use of the QOLPAV toadolescents as young as 12 years. Van Heeswyk (1997) has argued that adolescence can beseen as comprising three distinct phases; early (12–14), middle (15–16) and late (17–19). Assuch, the QOLPAV as originally devised by Raphael et al. (1996) could be viewed as ameasure of middle to late adolescents’ QOL. This study has demonstrated that the scale isalso applicable to individuals in their early adolescence. Exploration of the effect of age onQOL ratings indicated that ‘‘early’’ adolescents rated their QOL more positively than thosein the ‘‘middle’’ age group. It may be that early adolescents were less critical and morepositive, possibly due to lack of exposure to life pressures. It is probable that older adolescents
Quality of life in young people 271
are exposed to greater demands and stresses, such as increased academic, emotional andsocial pressures. Notwithstanding the developmental trends that emerged from thequestionnaire, the results demonstrated that the QOLPAV is user friendly and that eventhe youngest participants did not appear to have problems completing the measure, orunderstanding the items used therein. It was noteworthy that acceptable Cronbach’s alphascores were obtained regardless of the inclusion of the 12- and 13-year olds and that theresults were very similar to those reported by Raphael et al. (1996) using an older adolescentpopulation.
Whilst the investigation of cultural differences in QOL was not the main purpose of thestudy, the present sample’s mean scores on the QOLPAV were compared to those reportedby Raphael et al. (1996) in order to put the data into context. It was apparent that the Britishparticipants rated many aspects of QOL, control and opportunities differently; for example,physical and community belonging were rated higher. However, these discrepancies may bedue to the characteristics of the respective samples, rather than a reflection of genuinecultural differences. In order to clarify this point, it would be necessary to use groups ofparticipants matched in terms of age, gender, geographical situation and socioeconomicstatus in order to compare across cultures.
The factor analysis conducted during this study provided some support for the Raphaelet al. (1996) conceptualization of QOL. The factor analysis resulted in an eight-factorsolution which closely resembled the subdomains originally described. The only exceptionwas in the instance of spiritual being, the items of which appeared from the factor analysis tomeasure different underlying constructs and, therefore, did not form a single factor. Usingthis eight-factor solution, good discrimination was achieved, although a relatively lowproportion of the total variance (45?75%) was explained.
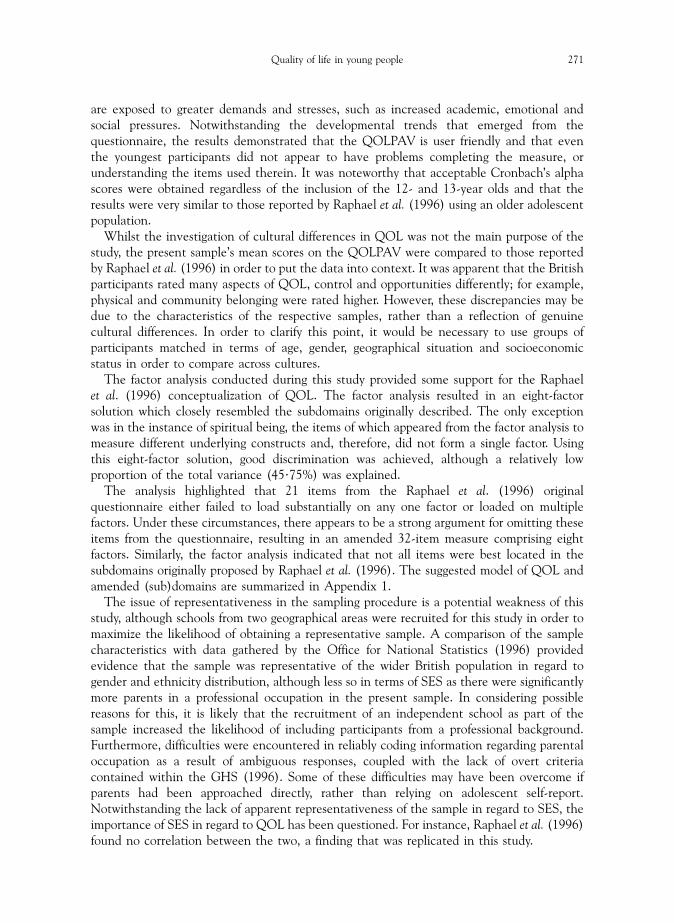
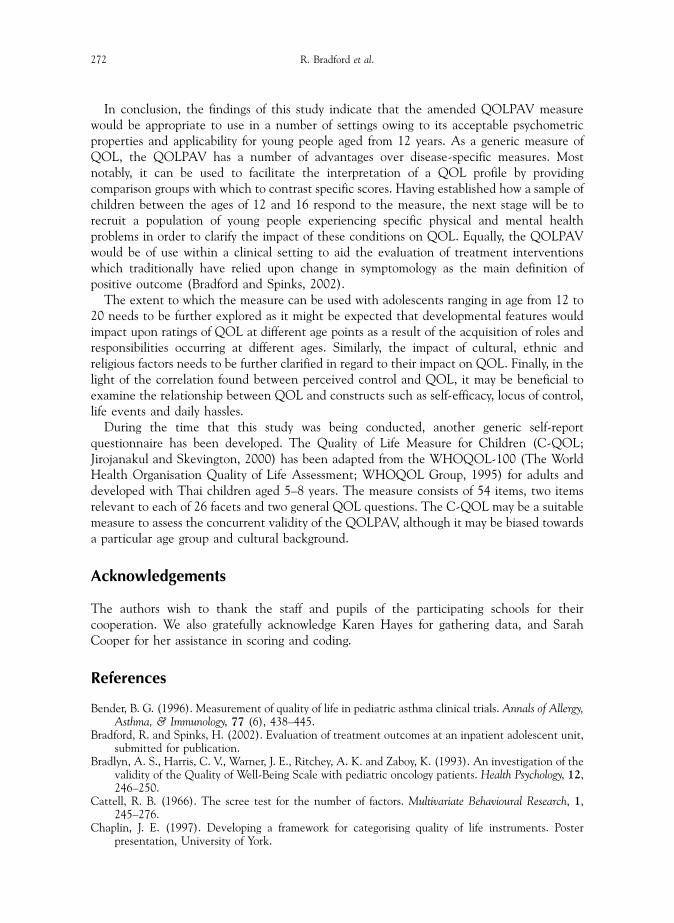
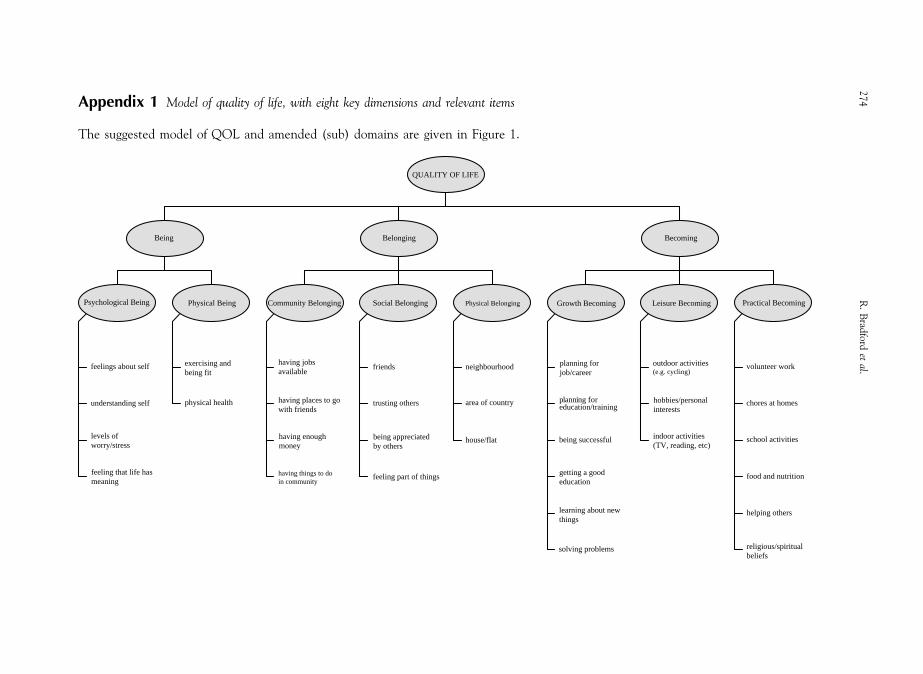
The analysis highlighted that 21 items from the Raphael et al. (1996) originalquestionnaire either failed to load substantially on any one factor or loaded on multiplefactors. Under these circumstances, there appears to be a strong argument for omitting theseitems from the questionnaire, resulting in an amended 32-item measure comprising eightfactors. Similarly, the factor analysis indicated that not all items were best located in thesubdomains originally proposed by Raphael et al. (1996). The suggested model of QOL andamended (sub)domains are summarized in Appendix 1.
The issue of representativeness in the sampling procedure is a potential weakness of thisstudy, although schools from two geographical areas were recruited for this study in order tomaximize the likelihood of obtaining a representative sample. A comparison of the samplecharacteristics with data gathered by the Office for National Statistics (1996) providedevidence that the sample was representative of the wider British population in regard togender and ethnicity distribution, although less so in terms of SES as there were significantlymore parents in a professional occupation in the present sample. In considering possiblereasons for this, it is likely that the recruitment of an independent school as part of thesample increased the likelihood of including participants from a professional background.Furthermore, difficulties were encountered in reliably coding information regarding parentaloccupation as a result of ambiguous responses, coupled with the lack of overt criteriacontained within the GHS (1996). Some of these difficulties may have been overcome ifparents had been approached directly, rather than relying on adolescent self-report.Notwithstanding the lack of apparent representativeness of the sample in regard to SES, theimportance of SES in regard to QOL has been questioned. For instance, Raphael et al. (1996)found no correlation between the two, a finding that was replicated in this study.
272 R. Bradford et al.
In conclusion, the findings of this study indicate that the amended QOLPAV measurewould be appropriate to use in a number of settings owing to its acceptable psychometricproperties and applicability for young people aged from 12 years. As a generic measure ofQOL, the QOLPAV has a number of advantages over disease-specific measures. Mostnotably, it can be used to facilitate the interpretation of a QOL profile by providingcomparison groups with which to contrast specific scores. Having established how a sample ofchildren between the ages of 12 and 16 respond to the measure, the next stage will be torecruit a population of young people experiencing specific physical and mental healthproblems in order to clarify the impact of these conditions on QOL. Equally, the QOLPAVwould be of use within a clinical setting to aid the evaluation of treatment interventionswhich traditionally have relied upon change in symptomology as the main definition ofpositive outcome (Bradford and Spinks, 2002).
The extent to which the measure can be used with adolescents ranging in age from 12 to20 needs to be further explored as it might be expected that developmental features wouldimpact upon ratings of QOL at different age points as a result of the acquisition of roles andresponsibilities occurring at different ages. Similarly, the impact of cultural, ethnic andreligious factors needs to be further clarified in regard to their impact on QOL. Finally, in thelight of the correlation found between perceived control and QOL, it may be beneficial toexamine the relationship between QOL and constructs such as self-efficacy, locus of control,life events and daily hassles.
During the time that this study was being conducted, another generic self-reportquestionnaire has been developed. The Quality of Life Measure for Children (C-QOL;Jirojanakul and Skevington, 2000) has been adapted from the WHOQOL-100 (The WorldHealth Organisation Quality of Life Assessment; WHOQOL Group, 1995) for adults anddeveloped with Thai children aged 5–8 years. The measure consists of 54 items, two itemsrelevant to each of 26 facets and two general QOL questions. The C-QOL may be a suitablemeasure to assess the concurrent validity of the QOLPAV, although it may be biased towardsa particular age group and cultural background.
Acknowledgements
The authors wish to thank the staff and pupils of the participating schools for theircooperation. We also gratefully acknowledge Karen Hayes for gathering data, and SarahCooper for her assistance in scoring and coding.
References
Bender, B. G. (1996). Measurement of quality of life in pediatric asthma clinical trials. Annals of Allergy,Asthma, & Immunology, 77 (6), 438–445.
Bradford, R. and Spinks, H. (2002). Evaluation of treatment outcomes at an inpatient adolescent unit,submitted for publication.
Bradlyn, A. S., Harris, C. V., Warner, J. E., Ritchey, A. K. and Zaboy, K. (1993). An investigation of thevalidity of the Quality of Well-Being Scale with pediatric oncology patients. Health Psychology, 12,246–250.
Cattell, R. B. (1966). The scree test for the number of factors. Multivariate Behavioural Research, 1,245–276.
Chaplin, J. E. (1997). Developing a framework for categorising quality of life instruments. Posterpresentation, University of York.
Quality of life in young people 273
Christie, M. J., French, D., Sowden, A. and West, A. (1993). Development of child-centred disease-specific questionnaires for living with asthma. Psychosomatic Medicine, 55, 541–548.
Clark-Carter, D. (1997). Doing Quantitative Psychological Research: From Design to Report. Hove, U.K.:Psychology Press Ltd.
Collier, J. and MacKinlay, D. (1997). Developing a generic child quality of life measure. HealthPsychology Update, 28, 12–16.
Eisen, M., Ware, J. E., Donald, C. A. and Brook, R. H. (1979). Measuring components of children’shealth status. Medical Care, 17, 902–921.
Eiser, C., Havermans, T. and Eiser, J. R. (1994). What do children mean by ‘‘quality of life’’? HealthPsychology Update, 16, 10–13.
Elder, G. H. Jr. (1980). Family Structure and Socialisation. New York: Arno Press.Endicott, J., Nee, J., Harrison, W. and Blumenthal, R. (1993). Quality of Life Enjoyment and
Satisfaction Questionnaire: A new measure. Psychopharmacology Bulletin, 29(2), 321–326.Erikson, E. (1968). Identity, Youth and Crisis. New York: Norton.Goodwin, D. A., Boggs, S. R. and Graham-Pole, J. (1994). Development and validation of the Pediatric
Oncology Quality of Life Scale. Psychological Assessment, 6, 321–328.Graham, P., Stevenson, J. and Flynn, D. (1997). A new measure of health related quality of life for
children: preliminary findings. Psychology and Health, 12, 655–665.Havighurst, R. J. (1953). Human Development and Education. New York: Longmans.Hinds, P. S. (1990). Quality of life in children and adolescents with cancer. Seminars in Oncology
Nursing, 6, 285–291.Ingersoll, G. M. and Marrero, D. G. (1990). A modified quality-of-life measure for youths: psychometric
properties. Diabetes Educator, 17 (2), 114–120.Jirojanakul, P. and Skevington, S. (2000). Developing a quality of life measure. British Journal of Health
Psychology, 5(3), 299–321.Murrell, R. C., Kenealy, P. M., Beaumont, J. G. and Lintern, T. C. (1999). Assessing quality of life in
persons with severe neurological disability associated with multiple sclerosis: the psychometricevaluation of two quality of life measures. British Journal of Health Psychology, 4(4), 349–362.
Office for National Statistics. (1996). Living in Britain: Results from the 1996 General Household Survey.London: The Stationary Office.
Raphael, D., Rukholm, E., Brown, I., HillBailey, P. and Donato, E. (1996). The Quality of LifeProfileFAdolescent Version: background, description and initial validation. Journal of AdolescentHealth, 19, 366–375.
Spieth, L. E. and Harris, C. V. (1996). Assessment of health-related quality of life in children andadolescents: an integrative review. Journal of Pediatric Psychology, 21(2), 175–193.
Starfield, B., Bergner, M., Ensminger, M., Riley, A., Ryan, S., Green, B., McGaughy, P., Skinner, A. andKim, S. (1993). Adolescent health status measurement: Development of child health and illnessprofile. Pediatrics, 91, 430–435.
Stein, R. and Jesop, D. (1982). A non-categorical approach to chronic childhood illness. Public HealthReports, 97, 354–362.
Tabachnick, B. G. and Fidell, L. S. (1996). Using Multivariate Statistics, 3rd Edn. New York: HarperCollins.
van Heeswyk, P. (1997). Analysing Adolescence. London: Sheldon Press.Walker, V., Streiner, D. L., Novosel, S., Rocchi, A., Levine, M. A. and Dean, D. M. (1995). Health-
related quality of life in patients with major depression who are treated with moclobemide. Journalof Clinical Psychopharmacology, 15, (4 Suppl 2), 60S–67S.
WHOQOL Group. (1995). The World Health Organisation Quality of Life assessment (WHOQOL):position paper from the World Health Organisation. Social Science Medicine, 41, 1403–1409.
WHOQOL Group. (1998). Development of the World Health Organization WHOQOL-BREF Qualityof life assessment. Psychological Medicine, 28, 551–558.
P
Becoming
h Becoming
ing forreer
ing fortion/training
successful
g a goodtion
ng about new
g problems
Leisure Becoming
outdoor activities(e.g. cycling)
hobbies/personalinterests
indoor activities(TV, reading, etc)
Practical Becoming
volunteer work
chores at homes
school activities
food and nutrition
helping others
religious/spiritualbeliefs
A
T
27
4R
.B
radford
etal.
QUALITY OF LIFE
Being
sychological Being
feelings about self
understanding self
levels ofworry/stress
feeling that life hasmeaning
Physical Being
exercising andbeing fit
physical health
Belonging
Community Belonging
having jobsavailable
having places to gowith friends
having enoughmoney
having things to doin community
Social Belonging
friends
trusting others
being appreciatedby others
feeling part of things
Physical Belonging
neighbourhood
area of country
house/flat
Growt
plannjob/ca
planneduca
being
gettineduca
learnithings
solvin
ppendix 1 Model of quality of life, with eight key dimensions and relevant items
he suggested model of QOL and amended (sub) domains are given in Figure 1.