Embed Size (px)
Citation preview
Rao, A., Brück, K., Methven, S., Evans, R., Stel, V. S., Jager, K. J., ...Caskey, F. (2016). Quality of Reporting and Study Design of CKD CohortStudies Assessing Mortality in the Elderly Before and After STROBE: ASystematic Review. PLoS ONE, 11(5), [e0155078]. DOI:10.1371/journal.pone.0155078
Publisher's PDF, also known as Version of record
License (if available):CC BY
Link to published version (if available):10.1371/journal.pone.0155078
Link to publication record in Explore Bristol ResearchPDF-document
This is the final published version of the article (version of record). It first appeared online via PLOS at10.1371/journal.pone.0155078. Please refer to any applicable terms of use of the publisher.
University of Bristol - Explore Bristol ResearchGeneral rights
This document is made available in accordance with publisher policies. Please cite only the publishedversion using the reference above. Full terms of use are available:http://www.bristol.ac.uk/pure/about/ebr-terms
RESEARCH ARTICLE
Quality of Reporting and Study Design ofCKD Cohort Studies Assessing Mortality inthe Elderly Before and After STROBE:A Systematic ReviewAnirudh Rao1,2,3*, Katharina Brück4, Shona Methven1,2,5, Rebecca Evans1, ViandaS. Stel4, Kitty J. Jager4, Lotty Hooft6, Yoav Ben-Shlomo1,3, Fergus Caskey1,2,3
1 UKRenal Registry, Bristol, United Kingdom, 2 Southmead Hospital, Bristol, United Kingdom, 3 School ofSocial and Community Medicine, University of Bristol, Bristol, United Kingdom, 4 ERA-EDTA Registry,Department of Medical Informatics, Academic Medical Center - University of Amsterdam, Amsterdam, TheNetherlands, 5 School of Clinical Sciences, University of Bristol, Bristol, United Kingdom, 6 Dutch CochraneCentre, Julius Center for Health Sciences and Primary Care, University Medical Center Utrecht, Utrecht, TheNetherlands
Abstract
Background
The STrengthening the Reporting of OBservational studies in Epidemiology (STROBE)
statement was published in October 2007 to improve quality of reporting of observational
studies. The aim of this review was to assess the impact of the STROBE statement on
observational study reporting and study design quality in the nephrology literature.
Study Design
Systematic literature review.
Setting & Population
European and North American, Pre-dialysis Chronic Kidney Disease (CKD) cohort studies.
Selection Criteria for Studies
Studies assessing the association between CKD and mortality in the elderly (>65 years)
published from 1st January 2002 to 31st December 2013 were included, following system-
atic searching of MEDLINE & EMBASE.
Predictor
Time period before and after the publication of the STROBE statement.
PLOS ONE | DOI:10.1371/journal.pone.0155078 May 11, 2016 1 / 16
a11111
OPEN ACCESS
Citation: Rao A, Brück K, Methven S, Evans R, StelVS, Jager KJ, et al. (2016) Quality of Reporting andStudy Design of CKD Cohort Studies AssessingMortality in the Elderly Before and After STROBE:A Systematic Review. PLoS ONE 11(5): e0155078.doi:10.1371/journal.pone.0155078
Editor: Xu-jie Zhou, Renal Division, PekingUniversity First Hospital, CHINA
Received: January 20, 2016
Accepted: April 24, 2016
Published: May 11, 2016
Copyright: © 2016 Rao et al. This is an open accessarticle distributed under the terms of the CreativeCommons Attribution License, which permitsunrestricted use, distribution, and reproduction in anymedium, provided the original author and source arecredited.
Data Availability Statement: All relevant data arewithin the paper and its Supporting Information files.
Funding: This work was part-funded by the UKRenal Registry (https://www.renalreg.org/) and formspart of AR’s Doctorate of Philosophy (PhD) thesis. Itwas also part-funded by the European Community'sSeventh Framework Programme under grantagreement number HEALTH-F2-2009-241544(SysKID) (K.B., V.S.S., K.J.J.), and the EuropeanRenal Association-European Dialysis and TransplantAssociation (ERA-EDTA-www.era-edta.org/) underthe Quality European Studies initiative (K.B.).
Outcome
Quality of study reporting using the STROBE statement and quality of study design using
the Newcastle Ottawa Scale (NOS), Scottish Intercollegiate Guidelines Network (SIGN)
and Critical Appraisal Skills Programme (CASP) tools.
Results
37 papers (11 Pre & 26 Post STROBE) were identified from 3621 potential articles. Only
four of the 22 STROBE items and their sub-criteria (objectives reporting, choice of quantita-
tive groups and description of and carrying out sensitivity analysis) showed improvements,
with the majority of items showing little change between the period before and after publica-
tion of the STROBE statement. Pre- and post-period analysis revealed a Manuscript
STROBE score increase (median score 77.8% (Inter-quartile range [IQR], 64.7–82.0) vs
83% (IQR, 78.4–84.9, p = 0.05). There was no change in quality of study design with identi-
cal median scores in the two periods for NOS (Manuscript NOS score 88.9), SIGN (Manu-
script SIGN score 83.3) and CASP (Manuscript CASP score 91.7) tools.
Limitations
Only 37 Studies from Europe and North America were included from one medical specialty.
Assessment of study design largely reliant on good reporting.
Conclusions
This study highlights continuing deficiencies in the reporting of STROBE items and their
sub-criteria in cohort studies in nephrology. There was weak evidence of improvement in
the overall reporting quality, with no improvement in methodological quality of CKD cohort
studies between the period before and after publication of the STROBE statement.
IntroductionChronic kidney disease (CKD) is a complex chronic condition, and in recent years has emergedas a major public health problem[1, 2]. CKD has been termed a “Geriatric Giant”, as this dis-proportionately affects the elderly and is assuming epidemic proportions. Also with increasinglife expectancy, patients are surviving longer with chronic conditions including CKD [3]. Withthe increasing burden of CKD, research of treatments developed to improve morbidity andmortality is vital [4]. Randomised controlled trials (RCTs) indisputably hold many advantagesover observational studies, but owing to ethical or other considerations, may be difficult orimpossible to undertake[5–7]. In nephrology there has not only been a lack of RCTs, but alarge proportion of these RCTs have had negative or null findings[6]. Observational studiescan provide extremely valuable additional evidence, and when rigorously undertaken mayyield similar results as RCTs at far lower expense[8–11].
Standardized reporting of cohort studies is crucial for the evaluation of the merits and flawsof observational research. Inadequate reporting is associated with potentially biased estimatesof treatment effects and limits the assessment of a study’s strengths, weaknesses and generaliz-ability[12]. In order to address this, the STrengthening the Reporting of OBservational Studiesin Epidemiology (STROBE) initiative developed recommendations on what should be
Reporting of Cohort Studies Before and After STROBE
PLOSONE | DOI:10.1371/journal.pone.0155078 May 11, 2016 2 / 16
Additionally, this article was co-written by V.S.S andK.J.J on behalf of the ERA-EDTA Registry which isan official body of the ERA-EDTA. The funders hadno role in study design, data collection and analysis,decision to publish, or preparation of the manuscript.
Competing Interests: The authors have declaredthat no competing interests exist.
incorporated in a precise and thorough report of an observational study. The STROBE state-ment and checklist were published in October 2007[13, 14]. These reporting guidelines wereenvisioned to make issues such as confounding, bias, and generalizability more ostensible. Inthe long term, this would improve the methodology of studies by increased awareness of theseissues for researchers designing a new study[15, 16].
The scientific value and reliability of the conclusions drawn from a study are determined toa major extent by the quality of the study design[17]. A variety of tools currently exist to assessthe risk of bias (methodological quality) of observational studies, and are employed whenundertaking a systematic review. These include quality scales, simple checklists, or checklistswith a summary judgment for assessment of the risk of bias[18].
The objectives of this review were (a) to determine whether the publication of the STROBEstatement is associated with an improvement in the reporting quality of cohort studies assess-ing mortality in elderly patients with CKD; and (b) to determine whether the publication of theSTROBE statement is associated with a decrease in risk of bias (improvement in the methodo-logical quality) of cohort studies assessing mortality in elderly patients with CKD.
Materials and Methods
Data selectionA systematic literature search was performed in Medline and Embase using the OvidSP inter-face to identify all papers describing pre-dialysis CKD cohort studies in the elderly (> 65 years)where mortality was reported as an outcome. This systematic review was conducted a part ofthe background preparation for the EQUAL study which is an international (European) multi-centre prospective observational cohort study looking at the timing of the start of dialysis inelderly patients (�65 years) with estimated glomerular filtration rate (eGFR) of� 20mls/minand therefore the review is restricted to CKD cohort studies in the elderly[19]. The searchquery is presented in Item A in S1 File (available as online supplementary material).
Papers published between 1st January 2002 and 31st December 2013 were included, as theKDOQI Clinical Practice Guidelines for Chronic Kidney Disease: Evaluation, Classification,and Stratification were published in 2002[20]. Only articles published in English were consid-ered for the purposes of the review. The initial search strategy yielded more than 10,000 hits,hence the number of studies were reduced by restricting the search to European and NorthAmerican studies. Each article was double sifted at title, abstract and full text stage using prede-fined study inclusion and exclusion criteria. Any disagreements about inclusion were resolvedby discussion.
The systematic review aimed to cover reporting and design of observational studies beforeand after the publication of the STROBE statement which was published in October 2007. Weassessed reporting and methodological quality during two time periods: before STROBEbetween 1/1/2002-31/12/2007 and after STROBE 1/10/2008-31/12/2013, allowing a one-yearrun-in period. By excluding publications in the immediate twelve months post-STROBE weallowed a period of one year for submission, revision and publication of research adhering tothe new guidelines.
Data extractionThe reporting of the selected studies was assessed using the STROBE checklist itself, and themethodological quality assessed using three tools. Thirteen of the 22 STROBE checklist itemswere assessed with 2 to 6 questions per item generating 55 questions. The STROBE checklist ispresented in Table A in S1 File (available as online supplementary material). These could be
Reporting of Cohort Studies Before and After STROBE
PLOSONE | DOI:10.1371/journal.pone.0155078 May 11, 2016 3 / 16
answered as “yes,” “partly,” “no,” “unclear,” or “not applicable”. We used similar methodologyto that reported in the publication by Langan et al[21].
To assess methodological quality, the articles were scored on the Newcastle Ottawa Scale(NOS). At the time this study was designed NOS was recommended by Cochrane for evaluat-ing the risk of bias in observational studies for inclusion in systematic reviews [22, 23]. Thearticles were also scored using the Scottish Intercollegiate Guidelines Network (SIGN) checklistfor cohort studies[24], and Critical Appraisal Skills Programme (CASP) cohort studies check-list[25] to estimate concurrent validity of NOS tool. These three checklists were chosen becausethey were simple checklists without an additional summary judgement[26].
The eligible papers that were identified by the sifting process were each scored using theSTROBE, NOS, SIGN and CASP checklists by two reviewers. Where there was disagreementbetween reviewers, consensus was reached by discussion.
Outcome measureQuality of study reporting was calculated by specific STROBE items and at a manuscript level.A STROBE question score (SQS) was calculated; the number of publications in a period thatadequately reported a question divided by the number of publications in which this questionwas applicable, expressed as a percentage (item analysis). A Manuscript STROBE score (MSS)was calculated for every manuscript; the number of questions (maximum of 55 questions) ade-quately reported in the publication divided by the number of applicable questions, expressed asa percentage (manuscript analysis).
Similarly, to assess the quality of study design the manuscript NOS score (MNOS), manu-script SIGN score (MSiS) and manuscript CASP score (MCAS) were calculated; the number ofquestions adequately addressed (in each appraisal tool) divided by the number of applicableitems, expressed as a percentage in order to facilitate comparison.
Data AnalysisComparison between pre and post-period SQS was performed by calculating the risk (propor-tion) difference between the two groups using the Wald test and respective 95% confidenceintervals, with Benjamini and Hochberg adjusted p values (False Discovery Rate) to control formultiple testing[27]. MSS, MNOS, MSiS and MCAS were reported as a median with respectiveinterquartile range (IQR). Pre- and post-period median MSS, MNOS, MSiS and MCAS werecompared using the Mann-Whitney (MW) test. Despite excluding articles published for aperiod of 1 year after introduction of STROBE, this could potentially have been insufficient foruptake and penetration of new information. Therefore a spline linear regression model wasused to determine the impact of STROBE over time[28]. Sub-group analyses of MSS were car-ried out restricting articles to those published in nephrology journals, STROBE endorsing andnon-endorsing journals and by journal impact factor in the year that the article was published.Sensitivity analyses were carried out by excluding the outlying MSS if any data points were lessthan 1.5 interquartile ranges (IQRs) below the first quartile or above the third quartile (< Q1–1.5×IQR or> Q3 + 1.5×IQR). Simple and weighted kappa statistics were used to compareagreement between reviewers for the NOS, SIGN and CASP checklists. All tests were two-tailed, and p values,< 0.05 were considered statistically significant. Data were analysed usingSTATA v13.1 (College Station, TX, USA) and SAS v9.3 (SAS Institute, Cary, NC, USA)software.
ReportingThe study has been reported in accordance with PRISMA reporting guidelines.
Reporting of Cohort Studies Before and After STROBE
PLOSONE | DOI:10.1371/journal.pone.0155078 May 11, 2016 4 / 16
Results
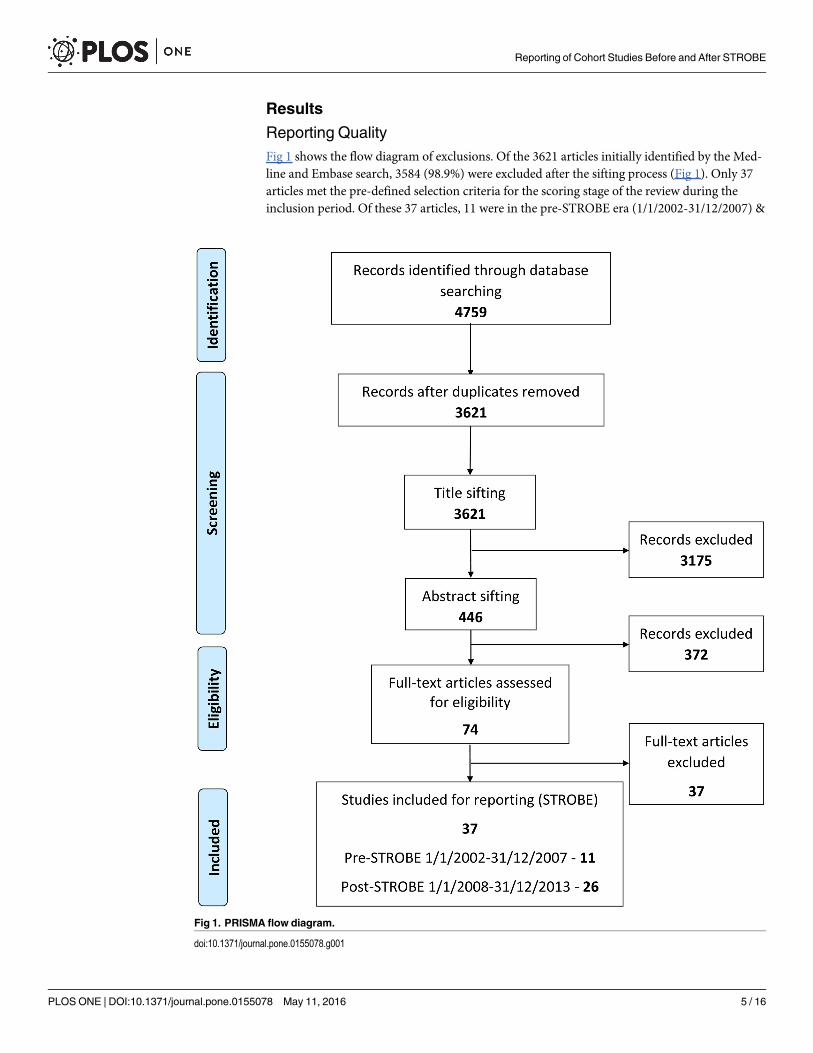
Reporting QualityFig 1 shows the flow diagram of exclusions. Of the 3621 articles initially identified by the Med-line and Embase search, 3584 (98.9%) were excluded after the sifting process (Fig 1). Only 37articles met the pre-defined selection criteria for the scoring stage of the review during theinclusion period. Of these 37 articles, 11 were in the pre-STROBE era (1/1/2002-31/12/2007) &
Fig 1. PRISMA flow diagram.
doi:10.1371/journal.pone.0155078.g001
Reporting of Cohort Studies Before and After STROBE
PLOSONE | DOI:10.1371/journal.pone.0155078 May 11, 2016 5 / 16
26 in the post-STROBE period (1/10/2008-31/12/2013). Twenty-two of these articles were pub-lished in nephrology and 15 in other medical journals. The list of articles considered at thescoring stage of the study is provided in Item B in S1 File (available as online supplementarymaterial).
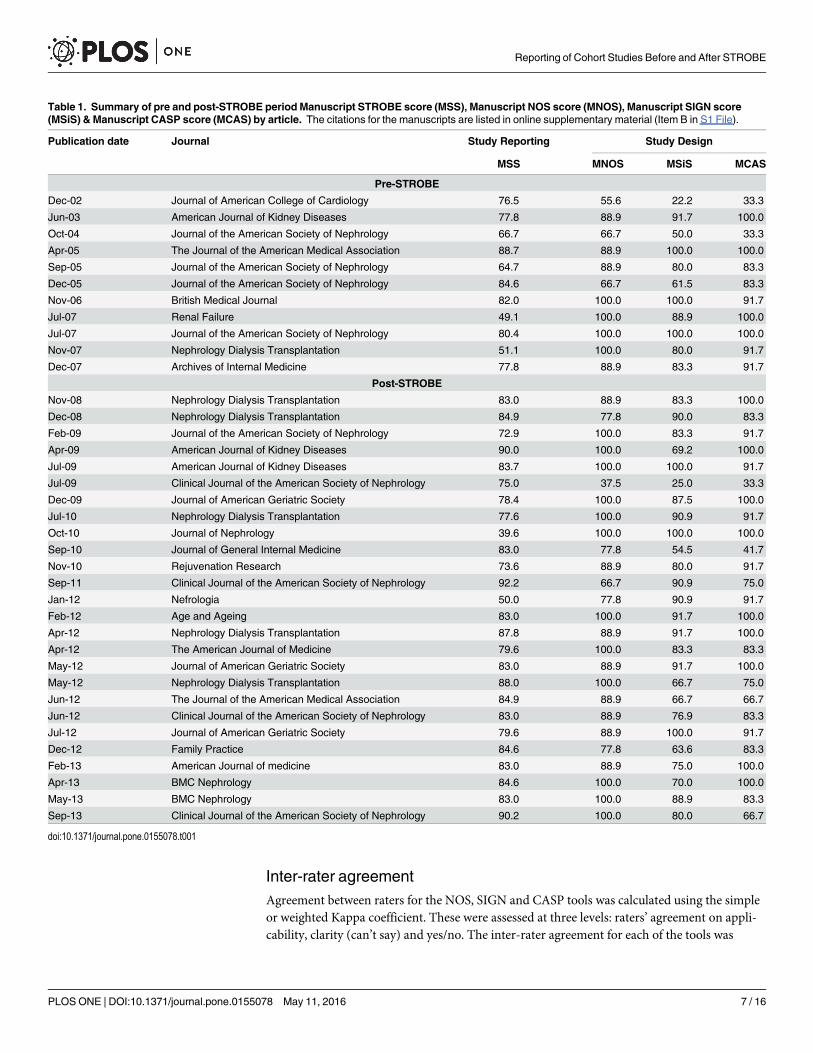
Table 1 summarises the STROBE, NOS, SIGN and CASP scores for each of the articles inthe pre and post-STROBE period. In most cases, reporting quality (STROBE) and methodolog-ical quality (NOS, SIGN and CASP) correlated well. However, in some articles methodologicalquality scored highly with a low score for reporting and vice versa.
Some of the STROBE question scores showed a ceiling effect as they were already at a maxi-mum level in the pre-STROBE period and could therefore only remain static or decline. Otherssaw improvements over the period such as “choice of quantitative groups” (30% vs 71%,p = 0.02), “addressing of losses to follow up” (0% vs 36%, p< 0.001), “description of and carry-ing out sensitivity analysis” (18% vs 58%, p = 0.01 & 18% vs 65%, p = 0.002) and “usage of flowdiagram” (0% vs 19%, p = 0.01). However, after adjusting for multiple testing, the change inonly two items’ scores remained unlikely to be due to chance; “addressing of losses to followup” (p = 0.02) and “carrying out sensitivity analysis” (p = 0.04). The majority of STROBE ques-tions showed little improvement between the two periods. Some critical questions, such ashypothesis specification and those important to interpretation of study validity such as samplesize estimation, addressing missing data, addressing loss to follow up, reason for non-participa-tion and usage of flow diagram continue to be under reported with less than 50% reportingthese items in both periods. Details regarding the reporting of the 55 STROBE items in the 37included cohort studies are shown in Table 2.
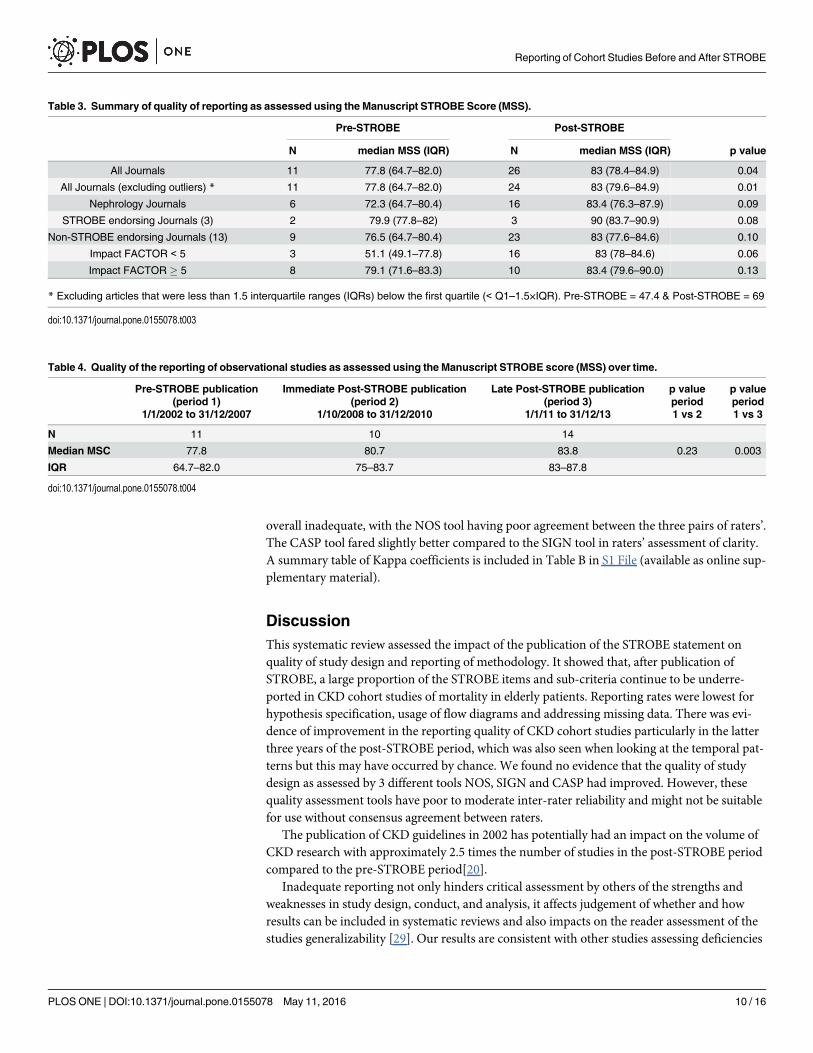
Pre- and post-period analyses revealed an increase in MSS (median score 77.8 (IQR, 64.7–82.0) vs 83 (IQR, 78.4–84.9), p = 0.04) (see Table 3). Any pre-STROBE period articles withMSS scores less than 47.4 and post-STROBE period less than 69 were considered to be outliers.Excluding outliers, the improvement in the MSS between the two periods showed a strongerstatistical relationship (p = 0.01). The results were essentially unchanged when restricted tonephrology journals or stratified by STROBE endorsing or non-endorsing journals, thoughthere was less statistical power to test for differences. Journals with impact factor< 5 sawgreater change over the two periods when compared to journals with impact factor� 5 butgiven the overlap in the confidence intervals this may have occurred by chance.
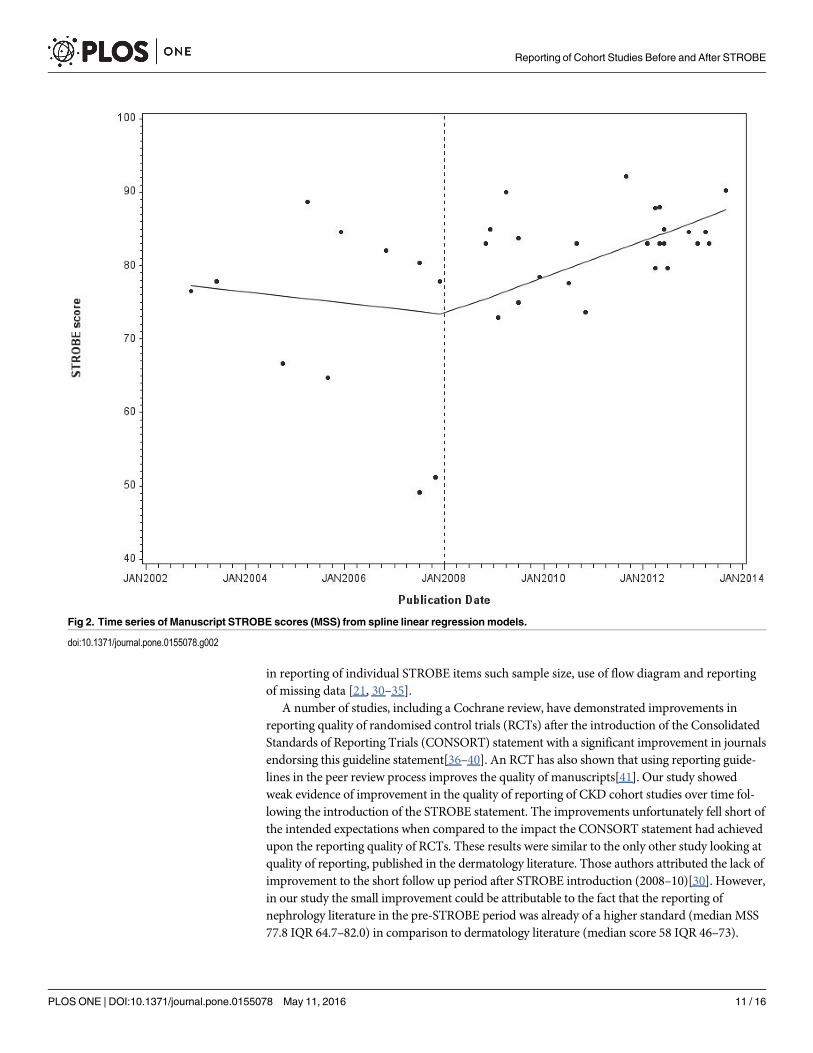
Time series analysis of MSS showed that there was a significant improvement in the qualityof reporting in the latter three years (1/1/11 to 31/12/13) when compared to the first threeyears (1/10/2008 to 31/12/2010) after the introduction of the STROBE statement (Table 4).Longitudinal analysis of the MSS using a spline linear regression model (Fig 2), havingexcluded outliers, suggested a turning point in 2008 with a slight negative trend in the pre-STROBE period (coefficient—0.06, SE 0.11) and a positive slope in the post-STROBE period(coefficient 0.21 SE 0.05) but this may have occurred by chance (Slope change coefficient 0.27,SE 0.16; p value = 0.10).
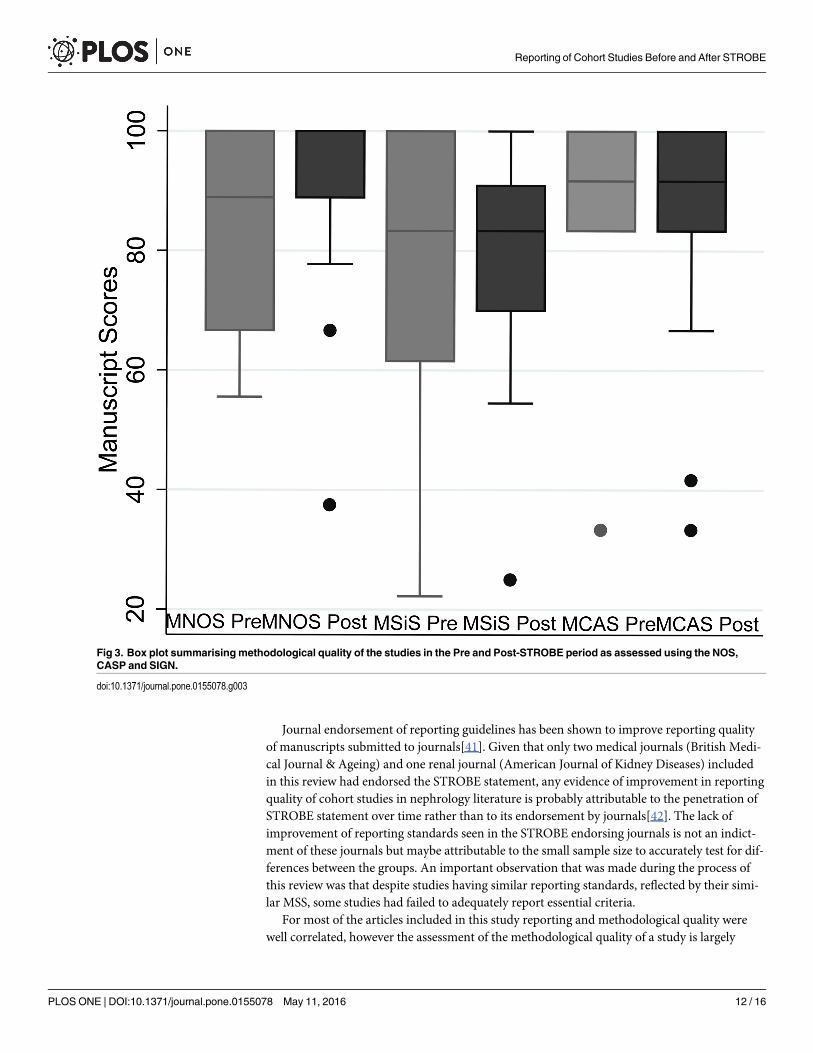
Methodological quality (study design); comparison in the pre- and post-STROBE periodWe found no evidence for any change in the methodological quality of studies in the pre andpost-STROBE period using the Newcastle Ottawa Scale (NOS) (median MNOS 88.9% [IQR,66.7–100] vs 88.9% [IQR, 88.9–100], p = 0.51), Scottish Intercollegiate Guidelines Network(SIGN) (median MSiS 83.3% [IQR, 61.5–100] vs 83.3% [IQR, 70–90.9], p = 0.93) and CriticalAppraisal Skills Programme (CASP) (median MCAS 91.7% [IQR, 83.3–100] vs 91.7% [IQR,83.3–100], p = 0.93) (Fig 3).
Reporting of Cohort Studies Before and After STROBE
PLOSONE | DOI:10.1371/journal.pone.0155078 May 11, 2016 6 / 16
Inter-rater agreementAgreement between raters for the NOS, SIGN and CASP tools was calculated using the simpleor weighted Kappa coefficient. These were assessed at three levels: raters’ agreement on appli-cability, clarity (can’t say) and yes/no. The inter-rater agreement for each of the tools was
Table 1. Summary of pre and post-STROBE period Manuscript STROBE score (MSS), Manuscript NOS score (MNOS), Manuscript SIGN score(MSiS) & Manuscript CASP score (MCAS) by article. The citations for the manuscripts are listed in online supplementary material (Item B in S1 File).
Publication date Journal Study Reporting Study Design
MSS MNOS MSiS MCAS
Pre-STROBE
Dec-02 Journal of American College of Cardiology 76.5 55.6 22.2 33.3
Jun-03 American Journal of Kidney Diseases 77.8 88.9 91.7 100.0
Oct-04 Journal of the American Society of Nephrology 66.7 66.7 50.0 33.3
Apr-05 The Journal of the American Medical Association 88.7 88.9 100.0 100.0
Sep-05 Journal of the American Society of Nephrology 64.7 88.9 80.0 83.3
Dec-05 Journal of the American Society of Nephrology 84.6 66.7 61.5 83.3
Nov-06 British Medical Journal 82.0 100.0 100.0 91.7
Jul-07 Renal Failure 49.1 100.0 88.9 100.0
Jul-07 Journal of the American Society of Nephrology 80.4 100.0 100.0 100.0
Nov-07 Nephrology Dialysis Transplantation 51.1 100.0 80.0 91.7
Dec-07 Archives of Internal Medicine 77.8 88.9 83.3 91.7
Post-STROBE
Nov-08 Nephrology Dialysis Transplantation 83.0 88.9 83.3 100.0
Dec-08 Nephrology Dialysis Transplantation 84.9 77.8 90.0 83.3
Feb-09 Journal of the American Society of Nephrology 72.9 100.0 83.3 91.7
Apr-09 American Journal of Kidney Diseases 90.0 100.0 69.2 100.0
Jul-09 American Journal of Kidney Diseases 83.7 100.0 100.0 91.7
Jul-09 Clinical Journal of the American Society of Nephrology 75.0 37.5 25.0 33.3
Dec-09 Journal of American Geriatric Society 78.4 100.0 87.5 100.0
Jul-10 Nephrology Dialysis Transplantation 77.6 100.0 90.9 91.7
Oct-10 Journal of Nephrology 39.6 100.0 100.0 100.0
Sep-10 Journal of General Internal Medicine 83.0 77.8 54.5 41.7
Nov-10 Rejuvenation Research 73.6 88.9 80.0 91.7
Sep-11 Clinical Journal of the American Society of Nephrology 92.2 66.7 90.9 75.0
Jan-12 Nefrologia 50.0 77.8 90.9 91.7
Feb-12 Age and Ageing 83.0 100.0 91.7 100.0
Apr-12 Nephrology Dialysis Transplantation 87.8 88.9 91.7 100.0
Apr-12 The American Journal of Medicine 79.6 100.0 83.3 83.3
May-12 Journal of American Geriatric Society 83.0 88.9 91.7 100.0
May-12 Nephrology Dialysis Transplantation 88.0 100.0 66.7 75.0
Jun-12 The Journal of the American Medical Association 84.9 88.9 66.7 66.7
Jun-12 Clinical Journal of the American Society of Nephrology 83.0 88.9 76.9 83.3
Jul-12 Journal of American Geriatric Society 79.6 88.9 100.0 91.7
Dec-12 Family Practice 84.6 77.8 63.6 83.3
Feb-13 American Journal of medicine 83.0 88.9 75.0 100.0
Apr-13 BMC Nephrology 84.6 100.0 70.0 100.0
May-13 BMC Nephrology 83.0 100.0 88.9 83.3
Sep-13 Clinical Journal of the American Society of Nephrology 90.2 100.0 80.0 66.7
doi:10.1371/journal.pone.0155078.t001
Reporting of Cohort Studies Before and After STROBE
PLOSONE | DOI:10.1371/journal.pone.0155078 May 11, 2016 7 / 16
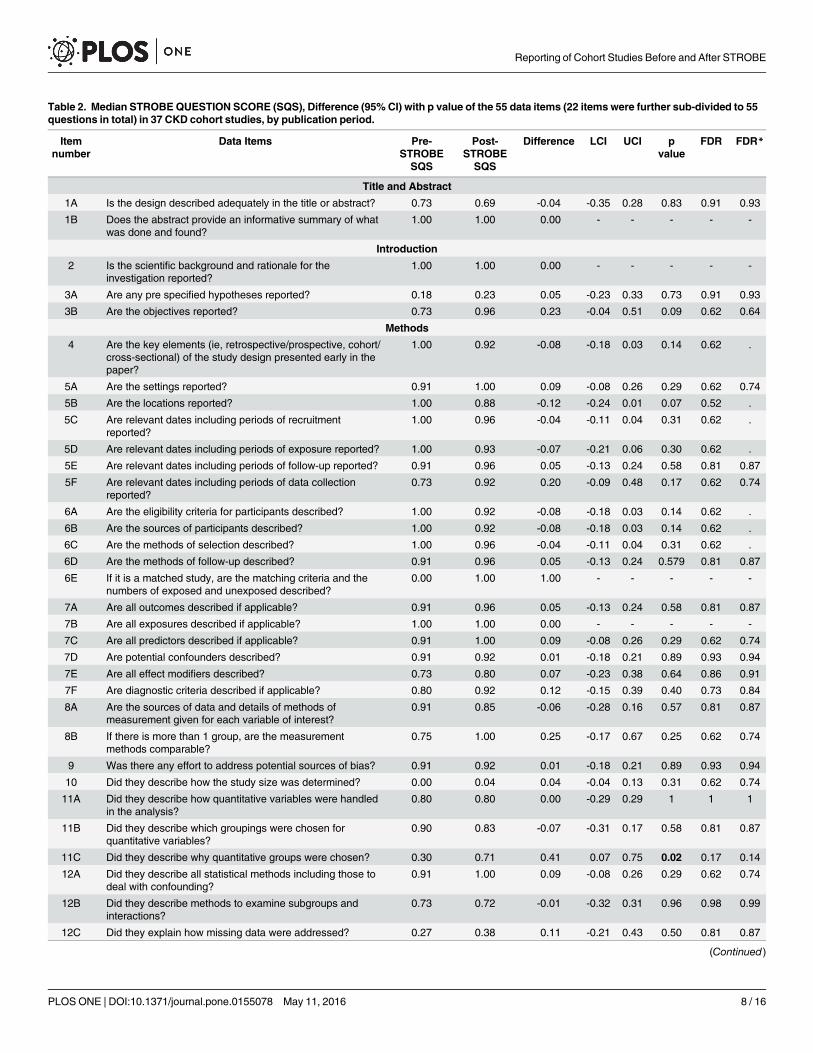
Table 2. Median STROBEQUESTION SCORE (SQS), Difference (95%CI) with p value of the 55 data items (22 items were further sub-divided to 55questions in total) in 37 CKD cohort studies, by publication period.
Itemnumber
Data Items Pre-STROBE
Post-STROBE
Difference LCI UCI pvalue
FDR FDR*
SQS SQS
Title and Abstract
1A Is the design described adequately in the title or abstract? 0.73 0.69 -0.04 -0.35 0.28 0.83 0.91 0.93
1B Does the abstract provide an informative summary of whatwas done and found?
1.00 1.00 0.00 - - - - -
Introduction
2 Is the scientific background and rationale for theinvestigation reported?
1.00 1.00 0.00 - - - - -
3A Are any pre specified hypotheses reported? 0.18 0.23 0.05 -0.23 0.33 0.73 0.91 0.93
3B Are the objectives reported? 0.73 0.96 0.23 -0.04 0.51 0.09 0.62 0.64
Methods
4 Are the key elements (ie, retrospective/prospective, cohort/cross-sectional) of the study design presented early in thepaper?
1.00 0.92 -0.08 -0.18 0.03 0.14 0.62 .
5A Are the settings reported? 0.91 1.00 0.09 -0.08 0.26 0.29 0.62 0.74
5B Are the locations reported? 1.00 0.88 -0.12 -0.24 0.01 0.07 0.52 .
5C Are relevant dates including periods of recruitmentreported?
1.00 0.96 -0.04 -0.11 0.04 0.31 0.62 .
5D Are relevant dates including periods of exposure reported? 1.00 0.93 -0.07 -0.21 0.06 0.30 0.62 .
5E Are relevant dates including periods of follow-up reported? 0.91 0.96 0.05 -0.13 0.24 0.58 0.81 0.87
5F Are relevant dates including periods of data collectionreported?
0.73 0.92 0.20 -0.09 0.48 0.17 0.62 0.74
6A Are the eligibility criteria for participants described? 1.00 0.92 -0.08 -0.18 0.03 0.14 0.62 .
6B Are the sources of participants described? 1.00 0.92 -0.08 -0.18 0.03 0.14 0.62 .
6C Are the methods of selection described? 1.00 0.96 -0.04 -0.11 0.04 0.31 0.62 .
6D Are the methods of follow-up described? 0.91 0.96 0.05 -0.13 0.24 0.579 0.81 0.87
6E If it is a matched study, are the matching criteria and thenumbers of exposed and unexposed described?
0.00 1.00 1.00 - - - - -
7A Are all outcomes described if applicable? 0.91 0.96 0.05 -0.13 0.24 0.58 0.81 0.87
7B Are all exposures described if applicable? 1.00 1.00 0.00 - - - - -
7C Are all predictors described if applicable? 0.91 1.00 0.09 -0.08 0.26 0.29 0.62 0.74
7D Are potential confounders described? 0.91 0.92 0.01 -0.18 0.21 0.89 0.93 0.94
7E Are all effect modifiers described? 0.73 0.80 0.07 -0.23 0.38 0.64 0.86 0.91
7F Are diagnostic criteria described if applicable? 0.80 0.92 0.12 -0.15 0.39 0.40 0.73 0.84
8A Are the sources of data and details of methods ofmeasurement given for each variable of interest?
0.91 0.85 -0.06 -0.28 0.16 0.57 0.81 0.87
8B If there is more than 1 group, are the measurementmethods comparable?
0.75 1.00 0.25 -0.17 0.67 0.25 0.62 0.74
9 Was there any effort to address potential sources of bias? 0.91 0.92 0.01 -0.18 0.21 0.89 0.93 0.94
10 Did they describe how the study size was determined? 0.00 0.04 0.04 -0.04 0.13 0.31 0.62 0.74
11A Did they describe how quantitative variables were handledin the analysis?
0.80 0.80 0.00 -0.29 0.29 1 1 1
11B Did they describe which groupings were chosen forquantitative variables?
0.90 0.83 -0.07 -0.31 0.17 0.58 0.81 0.87
11C Did they describe why quantitative groups were chosen? 0.30 0.71 0.41 0.07 0.75 0.02 0.17 0.14
12A Did they describe all statistical methods including those todeal with confounding?
0.91 1.00 0.09 -0.08 0.26 0.29 0.62 0.74
12B Did they describe methods to examine subgroups andinteractions?
0.73 0.72 -0.01 -0.32 0.31 0.96 0.98 0.99
12C Did they explain how missing data were addressed? 0.27 0.38 0.11 -0.21 0.43 0.50 0.81 0.87
(Continued)
Reporting of Cohort Studies Before and After STROBE
PLOSONE | DOI:10.1371/journal.pone.0155078 May 11, 2016 8 / 16
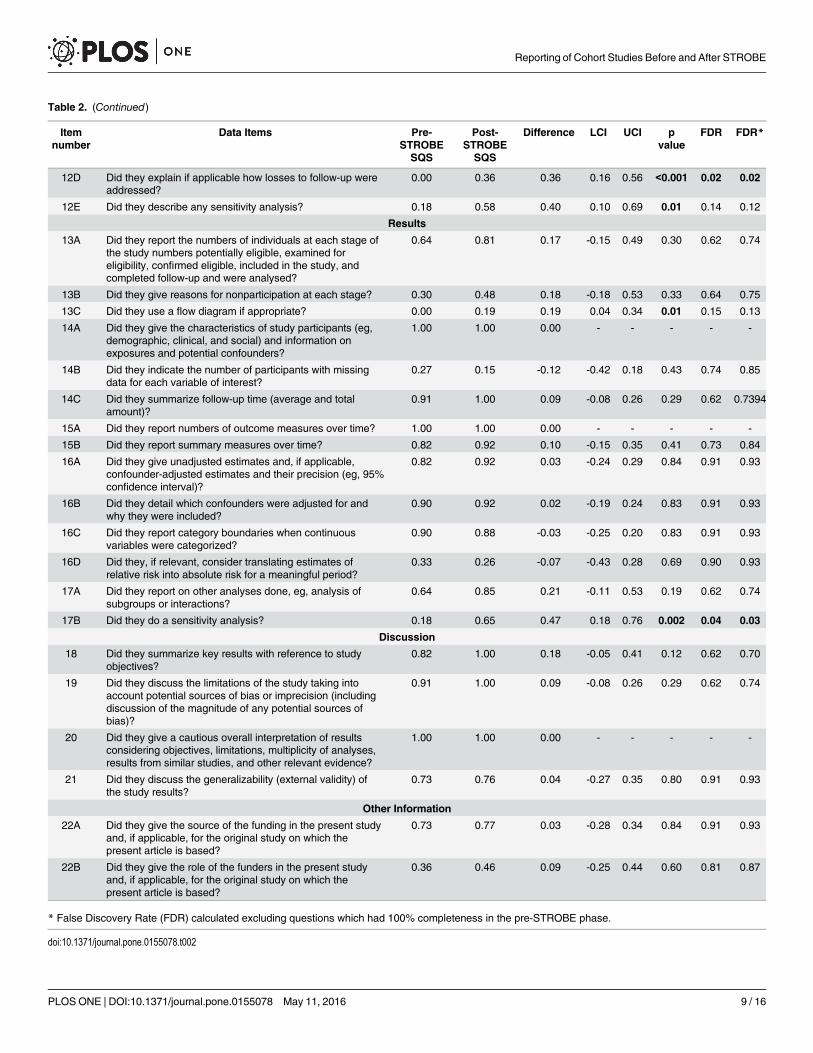
Table 2. (Continued)
Itemnumber
Data Items Pre-STROBE
Post-STROBE
Difference LCI UCI pvalue
FDR FDR*
SQS SQS
12D Did they explain if applicable how losses to follow-up wereaddressed?
0.00 0.36 0.36 0.16 0.56 <0.001 0.02 0.02
12E Did they describe any sensitivity analysis? 0.18 0.58 0.40 0.10 0.69 0.01 0.14 0.12
Results
13A Did they report the numbers of individuals at each stage ofthe study numbers potentially eligible, examined foreligibility, confirmed eligible, included in the study, andcompleted follow-up and were analysed?
0.64 0.81 0.17 -0.15 0.49 0.30 0.62 0.74
13B Did they give reasons for nonparticipation at each stage? 0.30 0.48 0.18 -0.18 0.53 0.33 0.64 0.75
13C Did they use a flow diagram if appropriate? 0.00 0.19 0.19 0.04 0.34 0.01 0.15 0.13
14A Did they give the characteristics of study participants (eg,demographic, clinical, and social) and information onexposures and potential confounders?
1.00 1.00 0.00 - - - - -
14B Did they indicate the number of participants with missingdata for each variable of interest?
0.27 0.15 -0.12 -0.42 0.18 0.43 0.74 0.85
14C Did they summarize follow-up time (average and totalamount)?
0.91 1.00 0.09 -0.08 0.26 0.29 0.62 0.7394
15A Did they report numbers of outcome measures over time? 1.00 1.00 0.00 - - - - -
15B Did they report summary measures over time? 0.82 0.92 0.10 -0.15 0.35 0.41 0.73 0.84
16A Did they give unadjusted estimates and, if applicable,confounder-adjusted estimates and their precision (eg, 95%confidence interval)?
0.82 0.92 0.03 -0.24 0.29 0.84 0.91 0.93
16B Did they detail which confounders were adjusted for andwhy they were included?
0.90 0.92 0.02 -0.19 0.24 0.83 0.91 0.93
16C Did they report category boundaries when continuousvariables were categorized?
0.90 0.88 -0.03 -0.25 0.20 0.83 0.91 0.93
16D Did they, if relevant, consider translating estimates ofrelative risk into absolute risk for a meaningful period?
0.33 0.26 -0.07 -0.43 0.28 0.69 0.90 0.93
17A Did they report on other analyses done, eg, analysis ofsubgroups or interactions?
0.64 0.85 0.21 -0.11 0.53 0.19 0.62 0.74
17B Did they do a sensitivity analysis? 0.18 0.65 0.47 0.18 0.76 0.002 0.04 0.03
Discussion
18 Did they summarize key results with reference to studyobjectives?
0.82 1.00 0.18 -0.05 0.41 0.12 0.62 0.70
19 Did they discuss the limitations of the study taking intoaccount potential sources of bias or imprecision (includingdiscussion of the magnitude of any potential sources ofbias)?
0.91 1.00 0.09 -0.08 0.26 0.29 0.62 0.74
20 Did they give a cautious overall interpretation of resultsconsidering objectives, limitations, multiplicity of analyses,results from similar studies, and other relevant evidence?
1.00 1.00 0.00 - - - - -
21 Did they discuss the generalizability (external validity) ofthe study results?
0.73 0.76 0.04 -0.27 0.35 0.80 0.91 0.93
Other Information
22A Did they give the source of the funding in the present studyand, if applicable, for the original study on which thepresent article is based?
0.73 0.77 0.03 -0.28 0.34 0.84 0.91 0.93
22B Did they give the role of the funders in the present studyand, if applicable, for the original study on which thepresent article is based?
0.36 0.46 0.09 -0.25 0.44 0.60 0.81 0.87
* False Discovery Rate (FDR) calculated excluding questions which had 100% completeness in the pre-STROBE phase.
doi:10.1371/journal.pone.0155078.t002
Reporting of Cohort Studies Before and After STROBE
PLOSONE | DOI:10.1371/journal.pone.0155078 May 11, 2016 9 / 16
overall inadequate, with the NOS tool having poor agreement between the three pairs of raters’.The CASP tool fared slightly better compared to the SIGN tool in raters’ assessment of clarity.A summary table of Kappa coefficients is included in Table B in S1 File (available as online sup-plementary material).
DiscussionThis systematic review assessed the impact of the publication of the STROBE statement onquality of study design and reporting of methodology. It showed that, after publication ofSTROBE, a large proportion of the STROBE items and sub-criteria continue to be underre-ported in CKD cohort studies of mortality in elderly patients. Reporting rates were lowest forhypothesis specification, usage of flow diagrams and addressing missing data. There was evi-dence of improvement in the reporting quality of CKD cohort studies particularly in the latterthree years of the post-STROBE period, which was also seen when looking at the temporal pat-terns but this may have occurred by chance. We found no evidence that the quality of studydesign as assessed by 3 different tools NOS, SIGN and CASP had improved. However, thesequality assessment tools have poor to moderate inter-rater reliability and might not be suitablefor use without consensus agreement between raters.
The publication of CKD guidelines in 2002 has potentially had an impact on the volume ofCKD research with approximately 2.5 times the number of studies in the post-STROBE periodcompared to the pre-STROBE period[20].
Inadequate reporting not only hinders critical assessment by others of the strengths andweaknesses in study design, conduct, and analysis, it affects judgement of whether and howresults can be included in systematic reviews and also impacts on the reader assessment of thestudies generalizability [29]. Our results are consistent with other studies assessing deficiencies
Table 3. Summary of quality of reporting as assessed using the Manuscript STROBE Score (MSS).
Pre-STROBE Post-STROBE
N median MSS (IQR) N median MSS (IQR) p value
All Journals 11 77.8 (64.7–82.0) 26 83 (78.4–84.9) 0.04
All Journals (excluding outliers) * 11 77.8 (64.7–82.0) 24 83 (79.6–84.9) 0.01
Nephrology Journals 6 72.3 (64.7–80.4) 16 83.4 (76.3–87.9) 0.09
STROBE endorsing Journals (3) 2 79.9 (77.8–82) 3 90 (83.7–90.9) 0.08
Non-STROBE endorsing Journals (13) 9 76.5 (64.7–80.4) 23 83 (77.6–84.6) 0.10
Impact FACTOR < 5 3 51.1 (49.1–77.8) 16 83 (78–84.6) 0.06
Impact FACTOR � 5 8 79.1 (71.6–83.3) 10 83.4 (79.6–90.0) 0.13
* Excluding articles that were less than 1.5 interquartile ranges (IQRs) below the first quartile (< Q1–1.5×IQR). Pre-STROBE = 47.4 & Post-STROBE = 69
doi:10.1371/journal.pone.0155078.t003
Table 4. Quality of the reporting of observational studies as assessed using the Manuscript STROBE score (MSS) over time.
Pre-STROBE publication Immediate Post-STROBE publication Late Post-STROBE publication p value p value(period 1) (period 2) (period 3) period period
1/1/2002 to 31/12/2007 1/10/2008 to 31/12/2010 1/1/11 to 31/12/13 1 vs 2 1 vs 3
N 11 10 14
Median MSC 77.8 80.7 83.8 0.23 0.003
IQR 64.7–82.0 75–83.7 83–87.8
doi:10.1371/journal.pone.0155078.t004
Reporting of Cohort Studies Before and After STROBE
PLOSONE | DOI:10.1371/journal.pone.0155078 May 11, 2016 10 / 16
in reporting of individual STROBE items such sample size, use of flow diagram and reportingof missing data [21, 30–35].
A number of studies, including a Cochrane review, have demonstrated improvements inreporting quality of randomised control trials (RCTs) after the introduction of the ConsolidatedStandards of Reporting Trials (CONSORT) statement with a significant improvement in journalsendorsing this guideline statement[36–40]. An RCT has also shown that using reporting guide-lines in the peer review process improves the quality of manuscripts[41]. Our study showedweak evidence of improvement in the quality of reporting of CKD cohort studies over time fol-lowing the introduction of the STROBE statement. The improvements unfortunately fell short ofthe intended expectations when compared to the impact the CONSORT statement had achievedupon the reporting quality of RCTs. These results were similar to the only other study looking atquality of reporting, published in the dermatology literature. Those authors attributed the lack ofimprovement to the short follow up period after STROBE introduction (2008–10)[30]. However,in our study the small improvement could be attributable to the fact that the reporting ofnephrology literature in the pre-STROBE period was already of a higher standard (median MSS77.8 IQR 64.7–82.0) in comparison to dermatology literature (median score 58 IQR 46–73).
Fig 2. Time series of Manuscript STROBE scores (MSS) from spline linear regression models.
doi:10.1371/journal.pone.0155078.g002
Reporting of Cohort Studies Before and After STROBE
PLOSONE | DOI:10.1371/journal.pone.0155078 May 11, 2016 11 / 16
Journal endorsement of reporting guidelines has been shown to improve reporting qualityof manuscripts submitted to journals[41]. Given that only two medical journals (British Medi-cal Journal & Ageing) and one renal journal (American Journal of Kidney Diseases) includedin this review had endorsed the STROBE statement, any evidence of improvement in reportingquality of cohort studies in nephrology literature is probably attributable to the penetration ofSTROBE statement over time rather than to its endorsement by journals[42]. The lack ofimprovement of reporting standards seen in the STROBE endorsing journals is not an indict-ment of these journals but maybe attributable to the small sample size to accurately test for dif-ferences between the groups. An important observation that was made during the process ofthis review was that despite studies having similar reporting standards, reflected by their simi-lar MSS, some studies had failed to adequately report essential criteria.
For most of the articles included in this study reporting and methodological quality werewell correlated, however the assessment of the methodological quality of a study is largely
Fig 3. Box plot summarisingmethodological quality of the studies in the Pre and Post-STROBE period as assessed using the NOS,CASP and SIGN.
doi:10.1371/journal.pone.0155078.g003
Reporting of Cohort Studies Before and After STROBE
PLOSONE | DOI:10.1371/journal.pone.0155078 May 11, 2016 12 / 16
dependent on adequate reporting of the research. Therefore, drawing any inferences about astudy’s design quality is made harder if the reporting quality is inadequate.
One of the main goals of reporting guidelines was to improve reporting clarity and notnecessarily improve the quality of research, but in due course achieve it as an indirect effect.Due to interchangeable usage of the terminology ‘reporting quality’ and ‘methodologicalquality’, the STROBE statement has often been used inappropriately for the assessment ofmethodological quality of observational research[16]. There are a number of assessmenttools that have been developed to assess quality and susceptibility to bias in observationalstudies with only half of the identified tools have described their development or validity andreliability [26]. The review by Sanderson et al highlighted the lack of a single obvious tool forassessing quality of observational epidemiological studies[26]. The bias assessment tools usedin this study (NOS, SIGN and CASP) were subjective, differed by content, format and valid-ity. The bias assessment tools identified deficiencies in the articles relating to considerationof participant’s lost to follow up (attrition bias), exposure level or prognostic factor measuredonly once (detection bias), and inadequate methods of outcome assessment (detection bias).However, given that the assessment of methodological quality is largely reliant on the report-ing of study design, one might therefore fail to detect differences in design quality if reportingis inadequate. Also given the latency period of designing a new study, undertaking it andthen publishing it, might have been simply too soon for the STROBE statement to have influ-enced the methodological quality of studies. The NOS tool was previously recommended byCochrane for evaluating the risk of bias but published literature has demonstrated poorinter-rater reliability between individual reviewers[43, 44]. The results of our study are con-sistent with these findings as all of the three tools (NOS, SIGN and CASP) showed pooragreement between individual reviewers. The usability of a tool depends on its clarity. More-over, the tools contain items whose scoring is subjective and dependent on reviewers’ percep-tions and domain knowledge. Cochrane now recommends the ACROBAT-NRSI biasassessment tool for non-randomized studies which has been developed by members of theCochrane Bias Methods Group and the Cochrane Non-Randomised Studies Methods Group[45, 46]. However, at the time of drafting this manuscript, this tool remains yet to be testedfor consistency between individual reviewers.
A strategy to improve inter-rater agreement would be tailoring and training of reviewersprior to implementation of the tools. Due to the poor reliability of the tools demonstrated here,it should be strongly considered that each study should be assessed by at least two reviewersprior to inclusion in a systematic review/meta-analysis.
One of the strengths of our study is that we studied the impact of STROBE upon both qual-ity of reporting and study design. The study has good internal validity as the selection and eval-uation processes were independently performed by two reviewers. However, as the articleswere included from one field of medicine (CKD) we must be cautious in generalising our find-ings to other areas. The other limitation of the study was that it only covered articles fromEurope and North America. There was also an imbalance in the number of studies assessed inthe two periods probably due to the KDIGO CKD guidelines which were published in 2002.This imbalance could have potentially introduced a lack of power to detect difference in qual-ity. It was also impossible to blind the reviewers to the publication date during the sifting stageof the review, and the journal name during the review of quality which could have biased thereviewers’ assessment of quality of the study. Finally, whilst we examined a five-year periodpost-STROBE, it is possible that we failed to find any benefit for methodological quality due tothe long latency period between designing a new study, obtaining funding, undertaking datacollection, analysis and publication.
Reporting of Cohort Studies Before and After STROBE
PLOSONE | DOI:10.1371/journal.pone.0155078 May 11, 2016 13 / 16
ConclusionThis study highlights continuing deficiencies in the reporting of observational studies in thenephrology literature. However, the publication of the STROBE statement may have positivelyinfluenced the quality of some aspects of observational study reporting. There was no evidence,however, that methodological quality improved over this time period. With continued effortsfrom researchers and with particular focus on the domains identified as deficient by theSTROBE statement and bias reporting tools, this presents an opportunity to improve the valid-ity of observational research in nephrology. With increased awareness by authors and editorsregarding compliance of manuscripts to the STROBE statement and journal endorsement ofthe STROBE statement, we hope that not only reporting but also the design of future studieswill be improved.
Supporting InformationS1 File. Item A: Search strategy for systematic review. Table A: STROBE scoring sheet. ItemB: List of articles included for review by date of publication. Table B: Summary of simple andweighted Kappa coefficient, measuring agreement between reviewers for the NOS, SIGN andCASP tool.(DOCX)
AcknowledgmentsWe thank Ingeborg M Nagel, medical information specialist and clinical librarian at AcademicMedical Center, University of Amsterdam, Netherlands, for valuable input into search strategyfor the systematic review
Author ContributionsConceived and designed the experiments: AR FC. Performed the experiments: AR FC KB SMKJ VS. Analyzed the data: AR RE. Contributed reagents/materials/analysis tools: AR FC KBSM VS KJ YB LH. Wrote the paper: AR FC KB SM RE VS KJ YB LH.
References1. Mangione F, Dal Canton A. Chronic kidney disease epidemic: myth and reality. Intern Emerg Med.
2011; 6(1):69–76. doi: 10.1007/s11739-011-0686-4
2. Jha V, Garcia-Garcia G, Iseki K, Li Z, Naicker S, Plattner B, et al. Chronic kidney disease: global dimen-sion and perspectives. The Lancet. 382(9888):260–72. doi: 10.1016/S0140-6736(13)60687-X
3. Ahmed Abdelhafiz SA, Flint K, El Nahas AM. Is Chronic Kidney Disease in Older People a New Geriat-ric Giant? Aging Health. 2011; 7(5):749–62.
4. El Nahas AM, Bello AK. Chronic kidney disease: the global challenge. The Lancet. 365(9456):331–40.doi: 10.1016/S0140-6736(05)17789-7
5. Kovesdy CP, Kalantar-Zadeh K. Observational Studies Versus Randomized Controlled Trials: Avenuesto Causal Inference in Nephrology. Advances in Chronic Kidney Disease. 19(1):11–8. doi: 10.1053/j.ackd.2011.09.004 PMID: 22364796
6. Novak JE, Inrig JK, Patel UD, Califf RM, Szczech LA. Negative trials in nephrology: what can we learn?Kidney Int. 2008; 74(9):1121–7. doi: 10.1038/ki.2008.286 PMID: 18563051
7. Jager KJ, Stel VS, Wanner C, Zoccali C, Dekker FW. The valuable contribution of observational studiesto nephrology. Kidney Int. 2007; 72(6):671–5. http://www.nature.com/ki/journal/v72/n6/suppinfo/5002397s1.html. PMID: 17597701
8. Concato J, Shah N, Horwitz RI. Randomized, Controlled Trials, Observational Studies, and the Hierar-chy of Research Designs. New England Journal of Medicine. 2000; 342(25):1887–92. doi: 10.1056/NEJM200006223422507 PMID: 10861325.
Reporting of Cohort Studies Before and After STROBE
PLOSONE | DOI:10.1371/journal.pone.0155078 May 11, 2016 14 / 16
9. Thadhani R, Tonelli M. Cohort Studies: Marching Forward. Clinical Journal of the American Society ofNephrology. 2006; 1(5):1117–23. doi: 10.2215/cjn.00080106 PMID: 17699334
10. Benson K, Hartz AJ. A Comparison of Observational Studies and Randomized, Controlled Trials. NewEngland Journal of Medicine. 2000; 342(25):1878–86. doi: 10.1056/NEJM200006223422506 PMID:10861324.
11. Johnston SC, Rootenberg JD, Katrak S, Smith WS, Elkins JS. Effect of a US National Institutes ofHealth programme of clinical trials on public health and costs. The Lancet. 367(9519):1319–27. doi:10.1016/S0140-6736(06)68578-4
12. Tooth L, Ware R, Bain C, Purdie DM, Dobson A. Quality of Reporting of Observational LongitudinalResearch. American Journal of Epidemiology. 2005; 161(3):280–8. doi: 10.1093/aje/kwi042 PMID:15671260
13. von Elm E, Altman DG, Egger M, Pocock SJ, Gøtzsche PC, Vandenbroucke JP. The Strengthening theReporting of Observational Studies in Epidemiology (STROBE) statement: guidelines for reportingobservational studies. The Lancet. 370(9596):1453–7. doi: 10.1016/s0140-6736(07)61602-x
14. Nijsten T, Spuls P, Stern RS. Strobe: A beacon for observational studies. Archives of Dermatology.2008; 144(9):1200–4. doi: 10.1001/archderm.144.9.1200 PMID: 18794467
15. von Elm E, Altman DG, Egger M, Pocock SJ, Gøtzsche PC, Vandenbroucke JP. The Strengthening theReporting of Observational Studies in Epidemiology (STROBE) Statement: Guidelines for reportingobservational studies. International Journal of Surgery. 12(12):1495–9. doi: 10.1016/j.ijsu.2014.07.013PMID: 25046131
16. da Costa BR, Cevallos M, Altman DG, Rutjes AWS, Egger M. Uses and misuses of the STROBE state-ment: bibliographic study. BMJ Open. 2011; 1(1). doi: 10.1136/bmjopen-2010-000048
17. Carlson MDA, Morrison RS. Study Design, Precision, and Validity in Observational Studies. Journal ofPalliative Medicine. 2009; 12(1):77–82. doi: 10.1089/jpm.2008.9690 PMC2920077. PMID: 19284267
18. Shamliyan T, Kane RL, Dickinson S. A systematic review of tools used to assess the quality of observa-tional studies that examine incidence or prevalence and risk factors for diseases. Journal of ClinicalEpidemiology. 2010; 63(10):1061–70. doi: 10.1016/j.jclinepi.2010.04.014 PMID: 20728045
19. Jager KJ, Ocak G, Drechsler C, Caskey FJ, Evans M, Postorino M, et al. The EQUAL study: a Euro-pean study in chronic kidney disease stage 4 patients. Nephrology Dialysis Transplantation. 2012. doi:10.1093/ndt/gfs277
20. National Kidney Foundation. K/DOQI Clinical practice guidelines for chronic kidney disease: evalua-tion, classification and stratification. American Journal of Kidney Diseases. 2002; 39(Suppl 2):S1–S246.
21. Langan S, Schmitt J, Coenraads P, Svensson A, von Elm E, Williams H, et al. The reporting of observa-tional research studies in dermatology journals: A literature-based study. Archives of Dermatology.2010; 146(5):534–41. doi: 10.1001/archdermatol.2010.87 PMID: 20479302
22. Wells GA, Shea B, O'Connell D, Peterson J, Welch V, Losos M, et al. The Newcastle-Ottawa Scale(NOS) for assessing the quality if nonrandomized studies in meta-analyses. Available: http://www.ohri.ca/programs/clinical_epidemiology/oxford.htm. Accessed July 28, 2015.
23. Higgins JPT, Green S (Eds): Cochrane handbook for systematic reviews of interventions version 5.1.0[Accessed March 2011]. Available: http://handbook.cochrane.org/chapter_13/13_5_2_3_tools_for_assessing_methodological_quality_or_risk_of.htm. Accessed July 28, 2015.
24. Scottish Intercollegiate Guidelines Network (SIGN) checklist for cohort studies. http://www.sign.ac.uk/methodology/checklists.html. Accessed July 28, 2015. Available: http://www.sign.ac.uk/methodology/checklists.html.
25. CASP UK. Critical Appraisal Skills Programme (CASP) checklist for cohort studies. http://www.casp-uk.net/#!casp-tools-checklists/c18f8. Accessed July 28, 2015. Available: http://www.casp-uk.net/#!casp-tools-checklists/c18f8.
26. Sanderson S, Tatt ID, Higgins JP. Tools for assessing quality and susceptibility to bias in observationalstudies in epidemiology: a systematic review and annotated bibliography. International Journal of Epi-demiology. 2007; 36(3):666–76. doi: 10.1093/ije/dym018 PMID: 17470488
27. Benjamini Y, Hochberg Y. Controlling the False Discovery Rate: A Practical and Powerful Approach toMultiple Testing. Journal of the Royal Statistical Society Series B (Methodological). 1995; 57(1):289–300.
28. Wagner AK, Soumerai SB, Zhang F, Ross-Degnan D. Segmented regression analysis of interruptedtime series studies in medication use research. Journal of Clinical Pharmacy and Therapeutics. 2002;27(4):299–309. doi: 10.1046/j.1365-2710.2002.00430.x PMID: 12174032
29. von Elm E, Altman DG, Egger M, Pocock SJ, Gøtzsche PC, Vandenbroucke JP. Strengthening thereporting of observational studies in epidemiology (STROBE) statement: guidelines for reporting
Reporting of Cohort Studies Before and After STROBE
PLOSONE | DOI:10.1371/journal.pone.0155078 May 11, 2016 15 / 16
observational studies. BMJ: British Medical Journal. 2007; 335(7624):806–8. doi: 10.1136/bmj.39335.541782.AD PMC2034723. PMID: 17947786
30. Bastuji-Garin S, Sbidian E, Gaudy-Marqueste C, Ferrat E, Roujeau J-C, Richard M-A, et al. Impact ofSTROBE Statement Publication on Quality of Observational Study Reporting: Interrupted Time Seriesversus Before-After Analysis. PLoS ONE. 2013; 8(8):e64733. doi: 10.1371/journal.pone.0064733PMID: 23990867
31. Müller M, Egger M. Strengthening the reporting of observational epidemiology (STROBE) in sexualhealth. Sexually Transmitted Infections. 2009; 85(3):162–4. doi: 10.1136/sti.2007.028985 PMID:19478105
32. Poorolajal J, Cheraghi Z, Irani AD, Rezaeian S. Quality of Cohort Studies Reporting Post the Strength-ening the Reporting of Observational Studies in Epidemiology (STROBE) Statement. Epidemiol Health.2011; 33(0):e2011005–0. doi: 10.4178/epih/e2011005
33. Fung AE, Palanki R, Bakri SJ, Depperschmidt E, Gibson A. Applying the CONSORT and STROBEStatements to Evaluate the Reporting Quality of Neovascular Age-related Macular Degeneration Stud-ies. Ophthalmology. 116(2):286–96.e4. doi: 10.1016/j.ophtha.2008.09.014 PMID: 19091408
34. Sorensen AA, Wojahn RD, Manske MC, Calfee RP. Using the Strengthening the Reporting of Observa-tional Studies in Epidemiology (STROBE) Statement to Assess Reporting of Observational Trials inHand Surgery. The Journal of Hand Surgery. 2013; 38(8):1584–9.e2. doi: 10.1016/j.jhsa.2013.05.008PMID: 23845586
35. Papathanasiou AA, Zintzaras E. Assessing the Quality of Reporting of Observational Studies in Can-cer. Annals of Epidemiology. 2010; 20(1):67–73. doi: 10.1016/j.annepidem.2009.09.007 PMID:20006277
36. Plint Amy CM D, Morrison Andra, Schulz Kenneth, Altman Douglas G, Hill Catherine and Gaboury Isa-belle. Does the CONSORT checklist improve the quality of reports of randomised controlled trials? Asystematic review. Med J Aust 2006; 185(5):263–7. PMID: 16948622
37. Moher D, Jones A, Lepage L, for the CG. Use of the consort statement and quality of reports of random-ized trials: A comparative before-and-after evaluation. JAMA. 2001; 285(15):1992–5. doi: 10.1001/jama.285.15.1992 PMID: 11308436
38. Anna Partsinevelou EZ. Quality of reporting of randomized controlled trials in polycystic ovary syn-drome. Trials. 2009; 10(106).
39. Lucy Turner LS, Altman Douglas G, Schulz Kenneth F, Moher David. Does use of the CONSORTStatement impact the completeness of reporting of randomised controlled trials published in medicaljournals? A Cochrane review. Systematic Reviews. 2012; 1(60).
40. Kane RL, Wang J, Garrard J. Reporting in randomized clinical trials improved after adoption of theCONSORT statement. Journal of Clinical Epidemiology. 2007; 60(3):241–9. doi: 10.1016/j.jclinepi.2006.06.016 PMID: 17292017
41. Cobo E, Cortés J, Ribera JM, Cardellach F, Selva-O’Callaghan A, Kostov B, et al. Effect of using report-ing guidelines during peer review on quality of final manuscripts submitted to a biomedical journal:masked randomised trial2011 2011-11-22 12:16:35.
42. STROBE Statement. STROBE Endorsement. Available: http://www.strobe-statement.org/index.php?id=strobe-endorsement. Accessed October 29, 2015. Available: http://www.strobe-statement.org/index.php?id=strobe-endorsement.
43. Hartling L, Milne A, HammMP, Vandermeer B, Ansari M, Tsertsvadze A, et al. Testing the NewcastleOttawa Scale showed low reliability between individual reviewers. Journal of Clinical Epidemiology. 66(9):982–93. doi: 10.1016/j.jclinepi.2013.03.003 PMID: 23683848
44. Stang A. Critical evaluation of the Newcastle-Ottawa scale for the assessment of the quality of nonran-domized studies in meta-analyses. Eur J Epidemiol. 2010; 25(9):603–5. doi: 10.1007/s10654-010-9491-z PMID: 20652370
45. Higgins JPT, Altman DG, Gøtzsche PC, Jüni P, Moher D, Oxman AD, et al. The Cochrane Collabora-tion’s tool for assessing risk of bias in randomised trials. BMJ. 2011; 343. doi: 10.1136/bmj.d5928
46. Sterne JAC HJ, Reeves BC on behalf of the development group for ACROBAT-NRSI. A Cochrane RiskOf Bias Assessment Tool: for Non-Randomized Studies of Interventions (ACROBAT-NRSI), Version1.0.0. http://www.riskofbias.info. Accessed Ocotber 30, 2015. 24 September 2014. Available from:http://www.riskofbias.info.
Reporting of Cohort Studies Before and After STROBE
PLOSONE | DOI:10.1371/journal.pone.0155078 May 11, 2016 16 / 16