Embed Size (px)
Citation preview
International Journal of Computer Applications (0975 – 8887)
Volume 91 – No.16, April 2014
14
Quality of Service Evaluation of a Deployed 3G Data
Network for a Campus wide e-Learning Platform
Kwame A.P Agyekum
Kwame Nkrumah Univ. Science and Technology, Ghana
Eric T. Tchao Kwame Nkrumah Univ. Science
and Technology, Ghana
Emmanuel Affum Kwame Nkrumah Univ. Science
and Technology, Ghana
ABSTRACT
In Ghana, the increase in the adoption of e-learning
methodologies is improving the way teachers and students
interact. With the combination of internet, multimedia and
network technologies, e-learning is changing typical teaching
and learning using its methodologies to improve access to
education on many university campuses. A third generation
(3G) data network has been deployed on Kwame Nkrumah
University of Science and Technology (KNUST) campus with
the aim of improving connectivity for students and lecturers to
enable them access an implemented e-learning platform
anywhere on the university campus. This paper evaluates the
Quality of Service (QoS) provided by the 3G cellular data
network. It addresses the gap between the technical
capabilities and the QoS experienced by students and teachers
who use the 3G network to access the platform. The analysis
in the paper is based on live data which were collected on the
network. An Analytic Hierarchy Process (AHP) methodology
has been used to assess the QoS based on selected Key
Performance Indicators (KPIs).
Keywords
e-Learning; Quality of service; Network Connectivity; Third
Generation; Analytic Hierarchy Process.
1. INTRODUCTION E-Learning refers to the use of Internet technologies to deliver
a broad array of solutions that enhance knowledge and
performance [1]. E-Learning can be used by institutions to
improve the efficiency and effectiveness of educational
interventions in the face of the social, scientific, and
pedagogical challenges. Whiles the use of ICTs have enabled
effective and highly reliable online education in many
European countries, the same cannot be said for many Sub-
Saharan African countries. Some institutions in the sub-region
are however making strides to incorporate ICTs in their
course delivery. Some universities in Ghana have made some
progress in building network infrastructure and acquiring
computers, but integrating technology into the teaching and
learning process has been a challenge [2]. Kwame Nkrumah
University of Science and Technology (KNUST) in Ghana,
realizing the enormous potential of e-learning as against the
university’s ever increasing student population has chosen to
adopt e-learning as platform to transform KNUST into a
modern citadel of academic knowledge in all spheres of
science, humanities, business and more [3]. As such, an e-
learning platform based on Moodle has been implemented
using a 3G network on KNUST campus to enhance the
teaching and learning process.
Research has shown that the critical factors affecting learners’
satisfaction with e-Learning system implementation includes
learner computer anxiety [4], instructor attitude toward e-
learning [5], e-learning course flexibility [6], e-learning
course quality [7], perceived usefulness [8], and perceived
ease of use [9]. Authors in [3] indicated that the sustainability
and user acceptance of the implemented e-learning model on
KNUST campus will directly depend on the means of access,
quality and the network performance since most of the users
will be computer literate and technologically inclined. As
such, measurement of network performance and Quality of
Service (QoS) assessment of the data network is crucial.
Quality of Service (QoS) in communication networks is
defined as the capability of the network to provide a
satisfactory service which includes voice quality, signal
strength, low call blocking and dropping probability, high data
rates for multimedia and data applications [10]. For data
services, QoS depends on the following factors key
performance indicators (KPIs);
Throughput - The rate at which packets go through
the network. Maximum rate is always preferred.
Delay - This is the time which a packet takes to
travel from one end to the other.
Packet Loss Rate - The rate at which a packet is
lost.
Packet Error Rate - This is the errors which are
present in a packet due to corrupted bits.
Reliability - The availability of a connection.
The authors in [11] presented a methodology for evaluating
the QoS provided by a cellular network for background
services such as e-mail and text messaging based on data
collected from drive testing. The data obtained from the drive
testing were used to evaluate different drive routes on a
UMTS network. Since their approach is bounded to a single
UMTS, their methodology cannot be used universally on
different networks. In [12], the authors presented a QoS
assessment methodology for cellular communication networks
based on data collected through drive testing. QoS assessment
for both the circuit switched and packet switched of parts the
network was studied. The end goal of the proposed
methodology was QoS comparison between cellular networks
implementing different cellular technologies. However, the
authors failed to provide QoS measurements as a function of
both voice and data services simultaneously.
This research surveys the network performance and measures
the KPI parameters of the data network. An appropriate QoS
evaluation methodology has been used to specify the KPI and
results presented.
International Journal of Computer Applications (0975 – 8887)
Volume 91 – No.16, April 2014
15
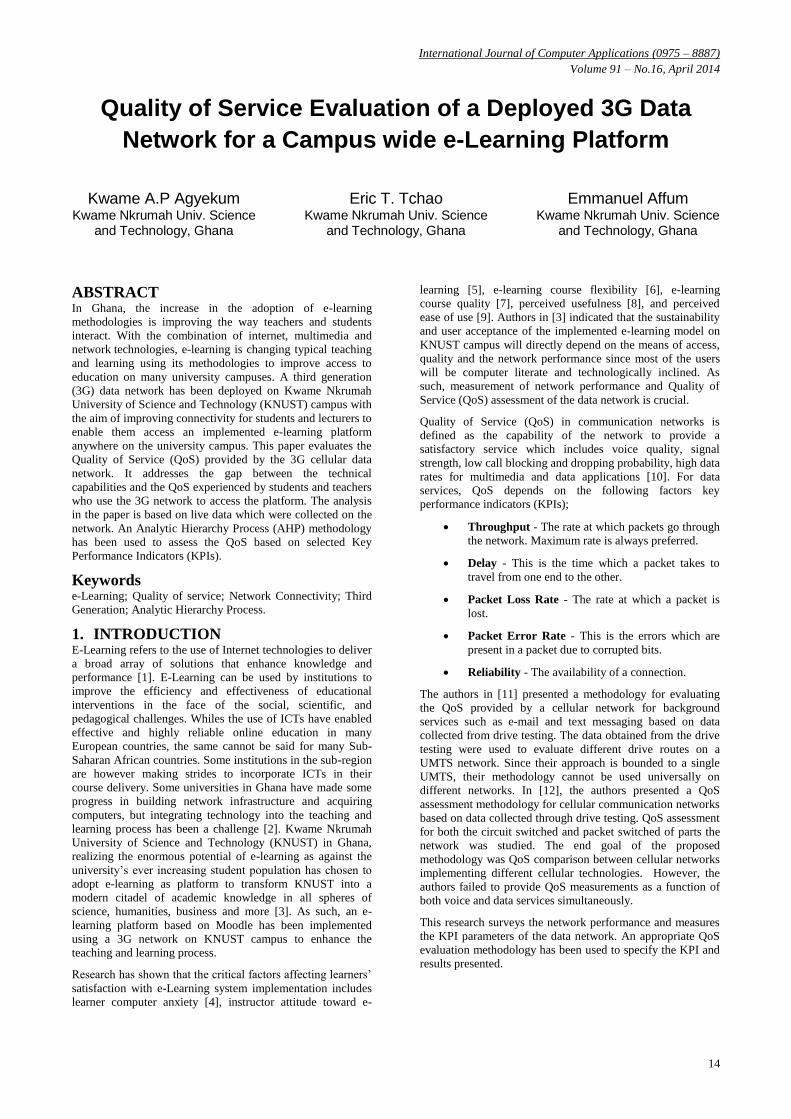
2. QoS EVALUATION METHODOLOGY We employ the use of an analytic hierarchy process [13]
which uses a multiple criteria decision making method. The
process employs a procedure of multiple comparisons to rank
alternative solutions to a multi objective decision problem. In
AHP, a problem is structured as a hierarchy with the goal to
be achieved at the top of the hierarchy, criteria at lower levels
of the hierarchy, and finally decision alternatives at the
bottom of the hierarchy. The used methodology is shown in
Figure 1
The various alternatives in the hierarchy are systematically
evaluated by comparing them to one another with respect to
the criteria. Each of the criteria is also compared with the
goal. In making these comparisons, data collected about the
alternatives is used. This process results in a comparison
matrix:
𝐴
=
𝐶1
𝐶2
𝐶3
⋮𝐶𝑛
𝐶1
1
𝐶2
𝐴12
𝐴21 1
𝐶3
𝐴13
… 𝐶𝑛
⋯ 𝐴1𝑛
𝐴23 ⋯ 𝐴2𝑛
𝐴31 𝐴32
⋮ ⋮𝐴𝑛1 𝐴𝑛2
1 ⋯ 𝐴3𝑛
⋮ ⋮ ⋮𝐴𝑛3 ⋯ 1
(1)
To do the analysis, the data collected about the alternatives is
compared to some standard or threshold values and a number
or numbers picked from a scale shown in Table 1.
This scale is then used to create the comparison matrices in
(1). The comparison matrices are normalized to obtain a
normalized comparison matrix:
𝐴𝑛𝑜𝑟𝑚
=
𝐴𝑖1
𝐴𝑛𝑖=1 𝑖1
⋮
⋯𝐴𝑖𝑛
𝐴𝑛𝑖=1 𝑖𝑛
⋮ ⋮𝐴𝑛1
𝐴𝑛𝑖=1 𝑖1
…𝐴𝑛𝑛
𝐴𝑛𝑖=1 𝑖𝑛
(2)
Where 𝐴𝑖𝑗 =𝑎𝑖
𝑎𝑗
𝑊 = 𝑤1 = 𝐴𝑛
𝑖=1 1𝑖
𝑛𝑤2 =
𝐴𝑛𝑖=1 2𝑖
𝑛. . 𝑤𝑛 =
𝐴𝑛𝑖=1 𝑛𝑖
𝑛 (3)
Where 𝑎𝑖 is the scale value of the ith criterion or alternative
and 𝑎𝑗 is the scale value of the jth criterion or alternative.
𝐶𝑖 is the ith criterion or alternative, 𝐴𝑖𝑗 is the comparison of
the ith criterion (alternative) with respect to the jth criterion
(alternative) and n is the number of criteria or alternative to be
evaluated.
Once all weight eigenvectors in the evaluation problem have
been computed, they are multiplied together to get the rank or
final scores of the alternatives. For example, if a problem has
M alternatives and N criteria, then it is required to construct N
judgment matrices (one for each criterion) of order MxM and
one judgment matrix of order NxN.
Assuming the weight eigenvector of alternative comparison
with respect to each criteria is 𝑊𝑖𝐴 (where i=1, 2, 3…. n) and
𝑊𝑖𝐶 is the weight eigenvector of criteria comparison with
respect to the goal, then the final score of the goal at the top of
the hierarchy can be obtained from:
𝑊1𝐴
𝑤1
𝑤2𝑤3
⋮𝑤𝑛
𝑊2𝐴
𝑤1
𝑤2𝑤3
⋮𝑤𝑛
. .. .
. .. .. .
. .
𝑊𝑛𝐴
𝑤1
𝑤2𝑤3
⋮𝑤𝑛
×
𝑊1𝐶
𝑤1
𝑤2𝑤3
⋮𝑤𝑛
(4)
To obtain the final score of the goal we let 𝑊𝐴 = 𝑊𝑖 , 𝑊𝐶 =
𝑊𝐴 and define 𝑆𝑖 as the overall score for alternative i, where i
represents the ith element of the vectors 𝑊𝐴 and 𝑊𝐶 . 𝑆𝑖 then is
calculated as:
Scale Description 9 Far better than the threshold
8 Much better than the threshold
7 Better than the threshold
6 Slightly better the threshold
5 About the same as the threshold
4 Slightly worse than the threshold
3 Worse than the threshold
2 Much worse than the threshold
1 Far worse than the threshold
Table 1 Proposed pair – wise comparison scale [13]
Figure 1 Analytical Hierarchy Process structure
International Journal of Computer Applications (0975 – 8887)
Volume 91 – No.16, April 2014
16
𝑆𝑖 = 𝑊𝑖 𝑊𝐴𝑖 (5)
𝑛
𝑖=1
Once overall scores are computed for all alternatives, the
highest score is identified as the alternative providing the best
goal, followed by the second highest score and so on.
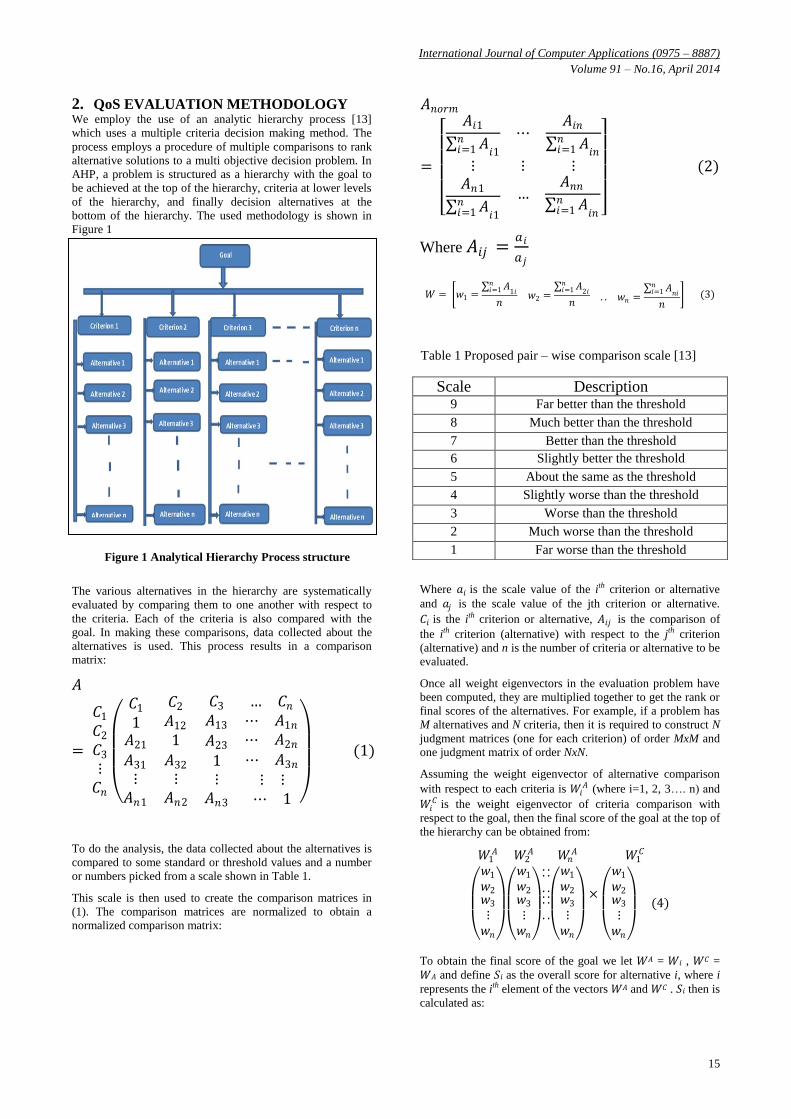
3. SURVEY AREA The evaluation process entailed collection of parameter
measurements within the university campus. The population
size of KNUST is about 25,000 and covers a 5 sq km area.
The campus environment was divided into four locations as
shown in Figure 2. The areas comprise:
Location 1 – Lecture Halls
Location 2 – Residential area (staff and students)
Location 3 – Commercial area
Location 4 – Main entrance area
Data on Key Performance Indicators such as latency, jitter,
loss and throughput was collected within the measurement
areas for 14 days.
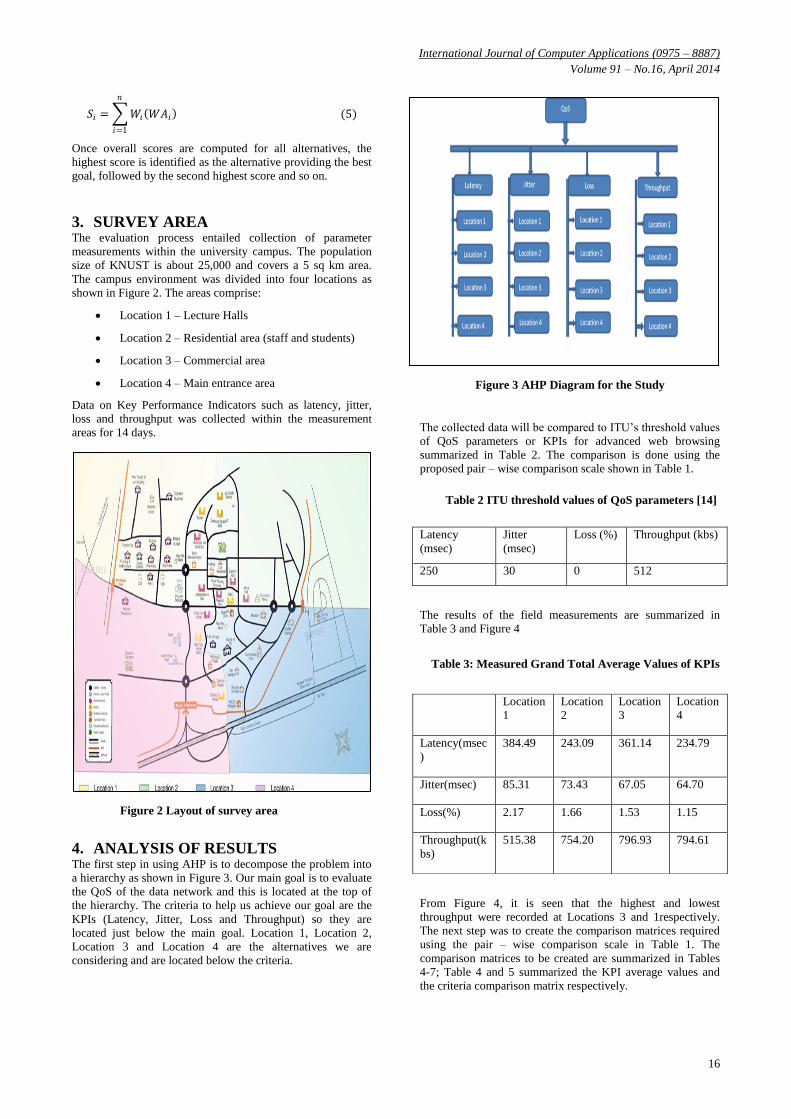
4. ANALYSIS OF RESULTS The first step in using AHP is to decompose the problem into
a hierarchy as shown in Figure 3. Our main goal is to evaluate
the QoS of the data network and this is located at the top of
the hierarchy. The criteria to help us achieve our goal are the
KPIs (Latency, Jitter, Loss and Throughput) so they are
located just below the main goal. Location 1, Location 2,
Location 3 and Location 4 are the alternatives we are
considering and are located below the criteria.
.
The collected data will be compared to ITU’s threshold values
of QoS parameters or KPIs for advanced web browsing
summarized in Table 2. The comparison is done using the
proposed pair – wise comparison scale shown in Table 1.
Latency
(msec)
Jitter
(msec)
Loss (%) Throughput (kbs)
250 30 0 512
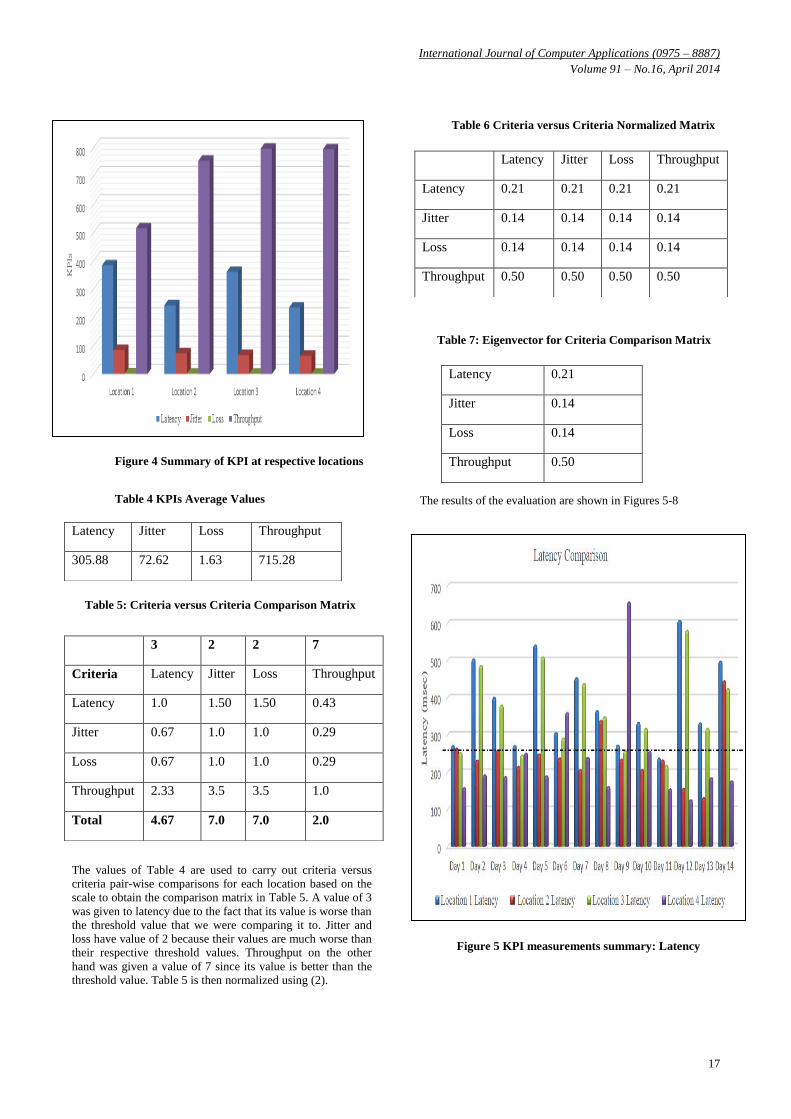
The results of the field measurements are summarized in
Table 3 and Figure 4
From Figure 4, it is seen that the highest and lowest
throughput were recorded at Locations 3 and 1respectively.
The next step was to create the comparison matrices required
using the pair – wise comparison scale in Table 1. The
comparison matrices to be created are summarized in Tables
4-7; Table 4 and 5 summarized the KPI average values and
the criteria comparison matrix respectively.
Location
1
Location
2
Location
3
Location
4
Latency(msec
)
384.49 243.09 361.14 234.79
Jitter(msec) 85.31 73.43 67.05 64.70
Loss(%) 2.17 1.66 1.53 1.15
Throughput(k
bs)
515.38 754.20 796.93 794.61
Table 2 ITU threshold values of QoS parameters [14]
Figure 2 Layout of survey area
Figure 3 AHP Diagram for the Study
Table 3: Measured Grand Total Average Values of KPIs
International Journal of Computer Applications (0975 – 8887)
Volume 91 – No.16, April 2014
17
The values of Table 4 are used to carry out criteria versus
criteria pair-wise comparisons for each location based on the
scale to obtain the comparison matrix in Table 5. A value of 3
was given to latency due to the fact that its value is worse than
the threshold value that we were comparing it to. Jitter and
loss have value of 2 because their values are much worse than
their respective threshold values. Throughput on the other
hand was given a value of 7 since its value is better than the
threshold value. Table 5 is then normalized using (2).
The results of the evaluation are shown in Figures 5-8
Latency Jitter Loss Throughput
305.88 72.62 1.63 715.28
3 2 2 7
Criteria Latency Jitter Loss Throughput
Latency 1.0 1.50 1.50 0.43
Jitter 0.67 1.0 1.0 0.29
Loss 0.67 1.0 1.0 0.29
Throughput 2.33 3.5 3.5 1.0
Total 4.67 7.0 7.0 2.0
Latency Jitter Loss Throughput
Latency 0.21 0.21 0.21 0.21
Jitter 0.14 0.14 0.14 0.14
Loss 0.14 0.14 0.14 0.14
Throughput 0.50 0.50 0.50 0.50
Latency 0.21
Jitter 0.14
Loss 0.14
Throughput 0.50
Table 4 KPIs Average Values
Table 5: Criteria versus Criteria Comparison Matrix
Table 6 Criteria versus Criteria Normalized Matrix
Table 7: Eigenvector for Criteria Comparison Matrix
Figure 4 Summary of KPI at respective locations
Figure 5 KPI measurements summary: Latency
International Journal of Computer Applications (0975 – 8887)
Volume 91 – No.16, April 2014
18
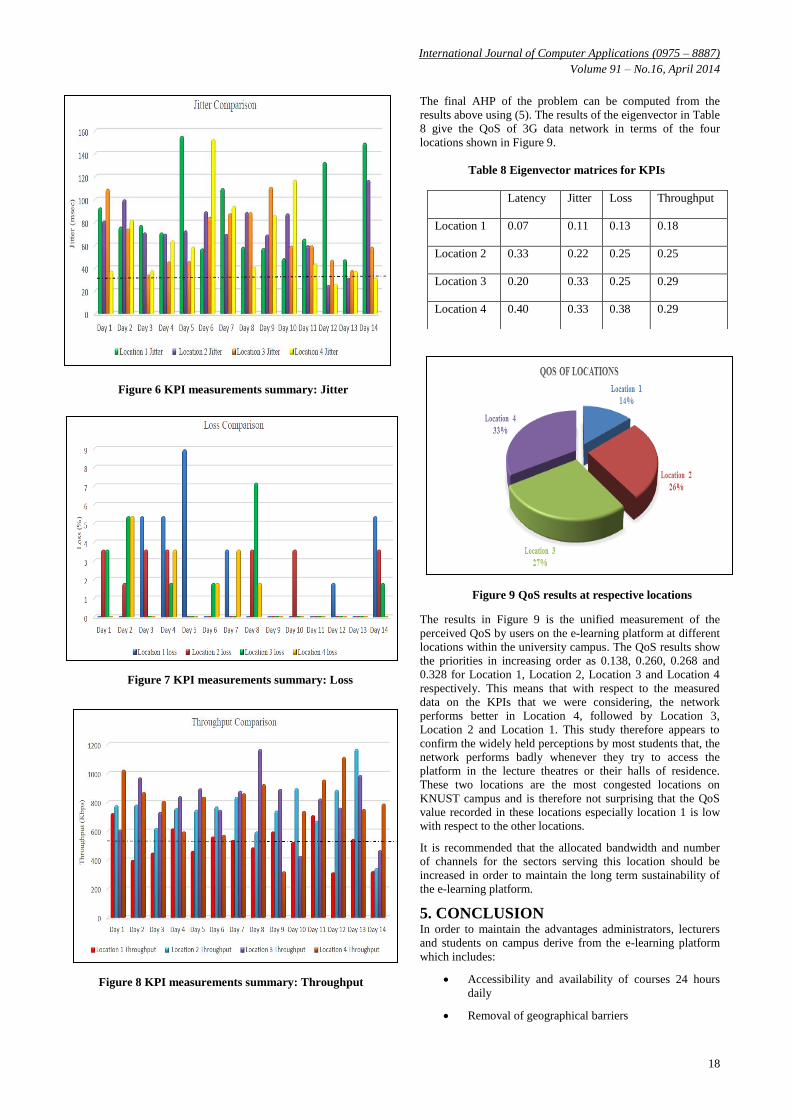
The final AHP of the problem can be computed from the
results above using (5). The results of the eigenvector in Table
8 give the QoS of 3G data network in terms of the four
locations shown in Figure 9.
The results in Figure 9 is the unified measurement of the
perceived QoS by users on the e-learning platform at different
locations within the university campus. The QoS results show
the priorities in increasing order as 0.138, 0.260, 0.268 and
0.328 for Location 1, Location 2, Location 3 and Location 4
respectively. This means that with respect to the measured
data on the KPIs that we were considering, the network
performs better in Location 4, followed by Location 3,
Location 2 and Location 1. This study therefore appears to
confirm the widely held perceptions by most students that, the
network performs badly whenever they try to access the
platform in the lecture theatres or their halls of residence.
These two locations are the most congested locations on
KNUST campus and is therefore not surprising that the QoS
value recorded in these locations especially location 1 is low
with respect to the other locations.
It is recommended that the allocated bandwidth and number
of channels for the sectors serving this location should be
increased in order to maintain the long term sustainability of
the e-learning platform.
5. CONCLUSION In order to maintain the advantages administrators, lecturers
and students on campus derive from the e-learning platform
which includes:
Accessibility and availability of courses 24 hours
daily
Removal of geographical barriers
Latency Jitter Loss Throughput
Location 1 0.07 0.11 0.13 0.18
Location 2 0.33 0.22 0.25 0.25
Location 3 0.20 0.33 0.25 0.29
Location 4 0.40 0.33 0.38 0.29
Table 8 Eigenvector matrices for KPIs
Figure 6 KPI measurements summary: Jitter
Figure 7 KPI measurements summary: Loss
Figure 8 KPI measurements summary: Throughput
Figure 9 QoS results at respective locations

International Journal of Computer Applications (0975 – 8887)
Volume 91 – No.16, April 2014
19
Reduction in the cost of delivering teaching and
learning
Increased interaction of students and lecturers
Material availability both online and offline
Improved computer and internet skills of learners
and lecturers
Accessibility to a wide array of learning resources
via the web.
This paper has used an analytical hierarchical process to
compare user experience with the 3G data network which was
used to implement the e-learning platform at multiple
locations to determine the location that provides the best QoS
based on users’ perception of quality. An increase in
bandwidth and the use of efficient resource allocation
schemes have been recommended in order to improve the
network connectivity of the data network.
6. REFERENCES [1] Muhsin, H., “The Using of E-Learning Techniques to
Improve the Medical Education”, 3rd International
Conference on Information & Communication
Technologies: from Theory to Applications, Damascus,
2008,pp.1-5
[2] Awidi, I.T, “Developing an e-learning Strategy for
Public Universities in Ghana”, EDUCAUSE Quarterly
Vol. 31 No. 2, EDUCASE, 2008, pp. 66 – 69
[3] John serbe Marfo and Robert Kabutey Okine:,
“Implementation of e-Learning in Ghanaian Tertiary
Institutions (A Case Study of KNUST)”; [Online http://
dspace.knust.edu.gh, accessed on 12/02/2014]
[4] Arbaugh, J. B. (2002). Managing the on-line classroom:
a study of technological and behavioral characteristics of
web-based MBA courses. Journal of High Technology
Management Research, 13, 203–223.
[5] Arbaugh, J. B., & Duray, R. (2002). Technological and
structural characteristics, student learning and
satisfaction with web-based courses–An exploratory
study of two on-line MBA programs. Management
Learning, 33(3), 331–347.
[6] Aronen, R., & Dieressen, G. (2001). Improvement
equipment reliability through e-Learning. Hydrocarbon
Processing, 47–57.
[7] Barbeite, F. G., & Weiss, E. M. (2004). Computer self-
efficacy and anxiety scales for an Internet sample: testing
measurement equivalence of existing measures and
development of new scales. Computers in Human
Behavior, 20, 1–15.
[8] Berger, N. S. (1999). Pioneering experiences in distance
learning: Lessons learned. Journal of Management
Education, 23, 684–690.
[9] Sun, P. -C. et al., What drives a successful e-Learning?
An empirical investigation, Computers & Education
(2007), doi:10.1016/j.compedu.2006.11.007
[10] Lawrence Oborkhale, Apkar Salatian and Gregory Onoh.
“A Quantitative Approach for Evaluating QOS in
Wireless Cellular Networks using the Analytic Hierarchy
Process Method”, 2012 International Conference on
System Engineering and Modeling (ICSEM 2012),
IPCSIT vol. 34, 2012
[11] Weissberger I., Kostanic I., Otero, C.E., “Background
Service QoS in a UMTS Network,” Proceedings of IEEE
Southeast Con, 2010, pp. 230 – 233
[12] Kostanic I., Mijatovic N., Vest S.D.,“Measurement
Based QoS Comparison of Cellular Communication
Networks”, In proceedings of 2009 IEEE International
CQR Workshop, Naples, FL, May 2009.
[13] Saaty, T.L, “The Analytic Hierarchy Process-What It Is
and How It Is Used.” Math. Modelling, 9, (1987), 161-
176.
[14] International Telecommunication Union (ITU-T)
X.608.1:” Information Technology – Enhanced
communications transport protocol: Specification of
QoS management for N-plex multicast transport”; White
paper published Nov., 2008.
IJCATM : www.ijcaonline.org